Article

Evaluation of Scale Management Suitability Based on the Entropy-TOPSIS Method

1
College of Resources and Environment, Southwest University, Chongqing 400715, China
2
Key Lab Arable Land Conservat Southwest China, Ministry of Agriculture, Chongqing 400715, China
*
Author to whom correspondence should be addressed.
Land 2021, 10(4), 416; https://doi.org/10.3390/land10040416
Submission received: 3 March 2021 / Revised: 10 April 2021 / Accepted: 12 April 2021 / Published: 15 April 2021
(This article belongs to the Section Land Planning and Landscape Architecture)

Abstract

:
The evaluation of scale management suitability provides a comprehensive assessment of the various factors driving farmland management conditions. This research objectively evaluated the conditions for scale management suitability by applying the entropy-TOPSIS method with the aim of effectively balancing the space for agricultural production, the development of towns, and ecological protection. First, to ensure a balance between agricultural production, urban development, and ecological protection, 13 indexes were selected to represent the following three areas: natural factors, socioeconomic factors, and characteristics of cultivated land factors. The original matrix was standardized to evaluate the suitability of natural resources, the social economy, and cultivated land conditions, and a comprehensive suitability evaluation of scale management in the Jiangjin District of Chongqing was conducted. The research results divide the study area into four regions based on the level of scale management suitability. Examining the spatial distribution, the level of scale management suitability decreased gradually from north to south, regions at the high and middle levels of scale management suitability were concentrated in the northern area beside the Yangtze river, and the regions at a low level were concentrated in the southern mountain area. This research can provide a reference for the rational utilization of land resources and land use policymaking.

1. Introduction

With China’s continuous urbanization and agricultural modernization, a high income gap between urban and rural areas has driven the transfer of the young labor force from rural to urban areas and led to the abandonment of a large amount of arable land [1]. The aging of the remaining agricultural workers has then led to a decrease in agricultural production efficiency, and other phenomena have become prominent. Much agricultural land is not being used to its full potential [2]. The situation in southwest China is particularly striking. Agricultural land suitability analysis is an important prerequisite for sustainable development of agricultural production [3]. To alleviate these phenomena, the reasonable allocation of production resources and a moderate operational scale are imperative, so evaluating the suitability of the scale of operations is particularly necessary.
The scope of land suitability is very wide and can include everything from nature reserves to nuclear power plants [4]. Recent years have seen a great deal of discussion on land use suitability evaluation and related issues and a wide range of research objects, such as suitability evaluations of agricultural land [3,5,6,7], rural residential areas [8], various land uses [9], site selection of construction land [10], crop planting [11,12,13,14], species habitat [15,16,17], etc.
Research methods tend to be diversified and mainly focus on quantitative analysis, including neural networks [5], the minimum cumulative resistance model [8], the analytic hierarchy process (AHP) [11,13,18], Bayesian networks [12], maximum entropy [16], the habitat suitability model [17], fuzzy-logic [14], fuzzy comprehensive evaluation (FCE) [19], and MCDA methods, such as VIKOR, TOPSIS [20,21], COPRAS, and PROMETHEE II [20]. These approaches have been applied in suitability evaluation, greatly enriching the research on land use suitability. However, few studies have examined the suitability evaluation of scale management.
China is in a transition period from traditional to modern agriculture. However, small farms are seen as a major obstacle to this progress [22]. With the continuous development of economy and technology, the advantages of small farmers will gradually weaken [23]. The extensive production mode of ultra-small scale and decentralized management formed under the current land system can no longer meet the needs of China’s current socioeconomic development, and moderate concentration, scale management, and detailed management will be the main trends in China’s future agricultural production.
Therefore, studying the suitability of scale management in the research area is conducive to not only promoting the rational allocation of land resources but also protecting food security and ecological security, ensuring the sustainability of agricultural production in the region, and providing a forward-looking basis and theoretical support for relevant planning, design, and policies.
In this paper, relevant factors that affect the scale management were extracted from natural factors, socioeconomic factors, and cultivated land resource endowment to construct a scale management suitability evaluation system, evaluate the scale operation suitability of the research area, and rank the results by TOPSIS. The result of TOPSIS were verified by the FCE method.

2. Research Scope and Data Sources

2.1. Overview of the Study Area

Jiangjin District is located in southwestern Chongqing in China (Figure 1) and covers an area of 3217.8 km2. It is adjacent to Hejiang County in Sichuan Province and Xishui County in Guizhou Province. It is at the end of the Three Gorges Reservoir area, and the Yangtze River runs around the city. Geographically, Jiangjin is located at the southwest end of the parallel ridge valley fold area in eastern Sichuan. The terrain is high in the south and low in the north, and the landform is dominated by hills and low mountains; 65.10% of the area is hills, 31.80% is mountains, and 3.10% is valley terraces. Jiangjin is in the humid subtropical monsoon climate zone, with four distinct seasons and climate cultures. It has abundant rainfall; the annual average temperature is 18.3 °C, and the annual average precipitation is 1025 mm. Rivers crisscross the territory; in the upper reaches of the Yangtze River system, the Yangtze River and its tributaries are extremely rich in transit water resources, because Jiangjin industrial and agricultural production provides superior water resource conditions.
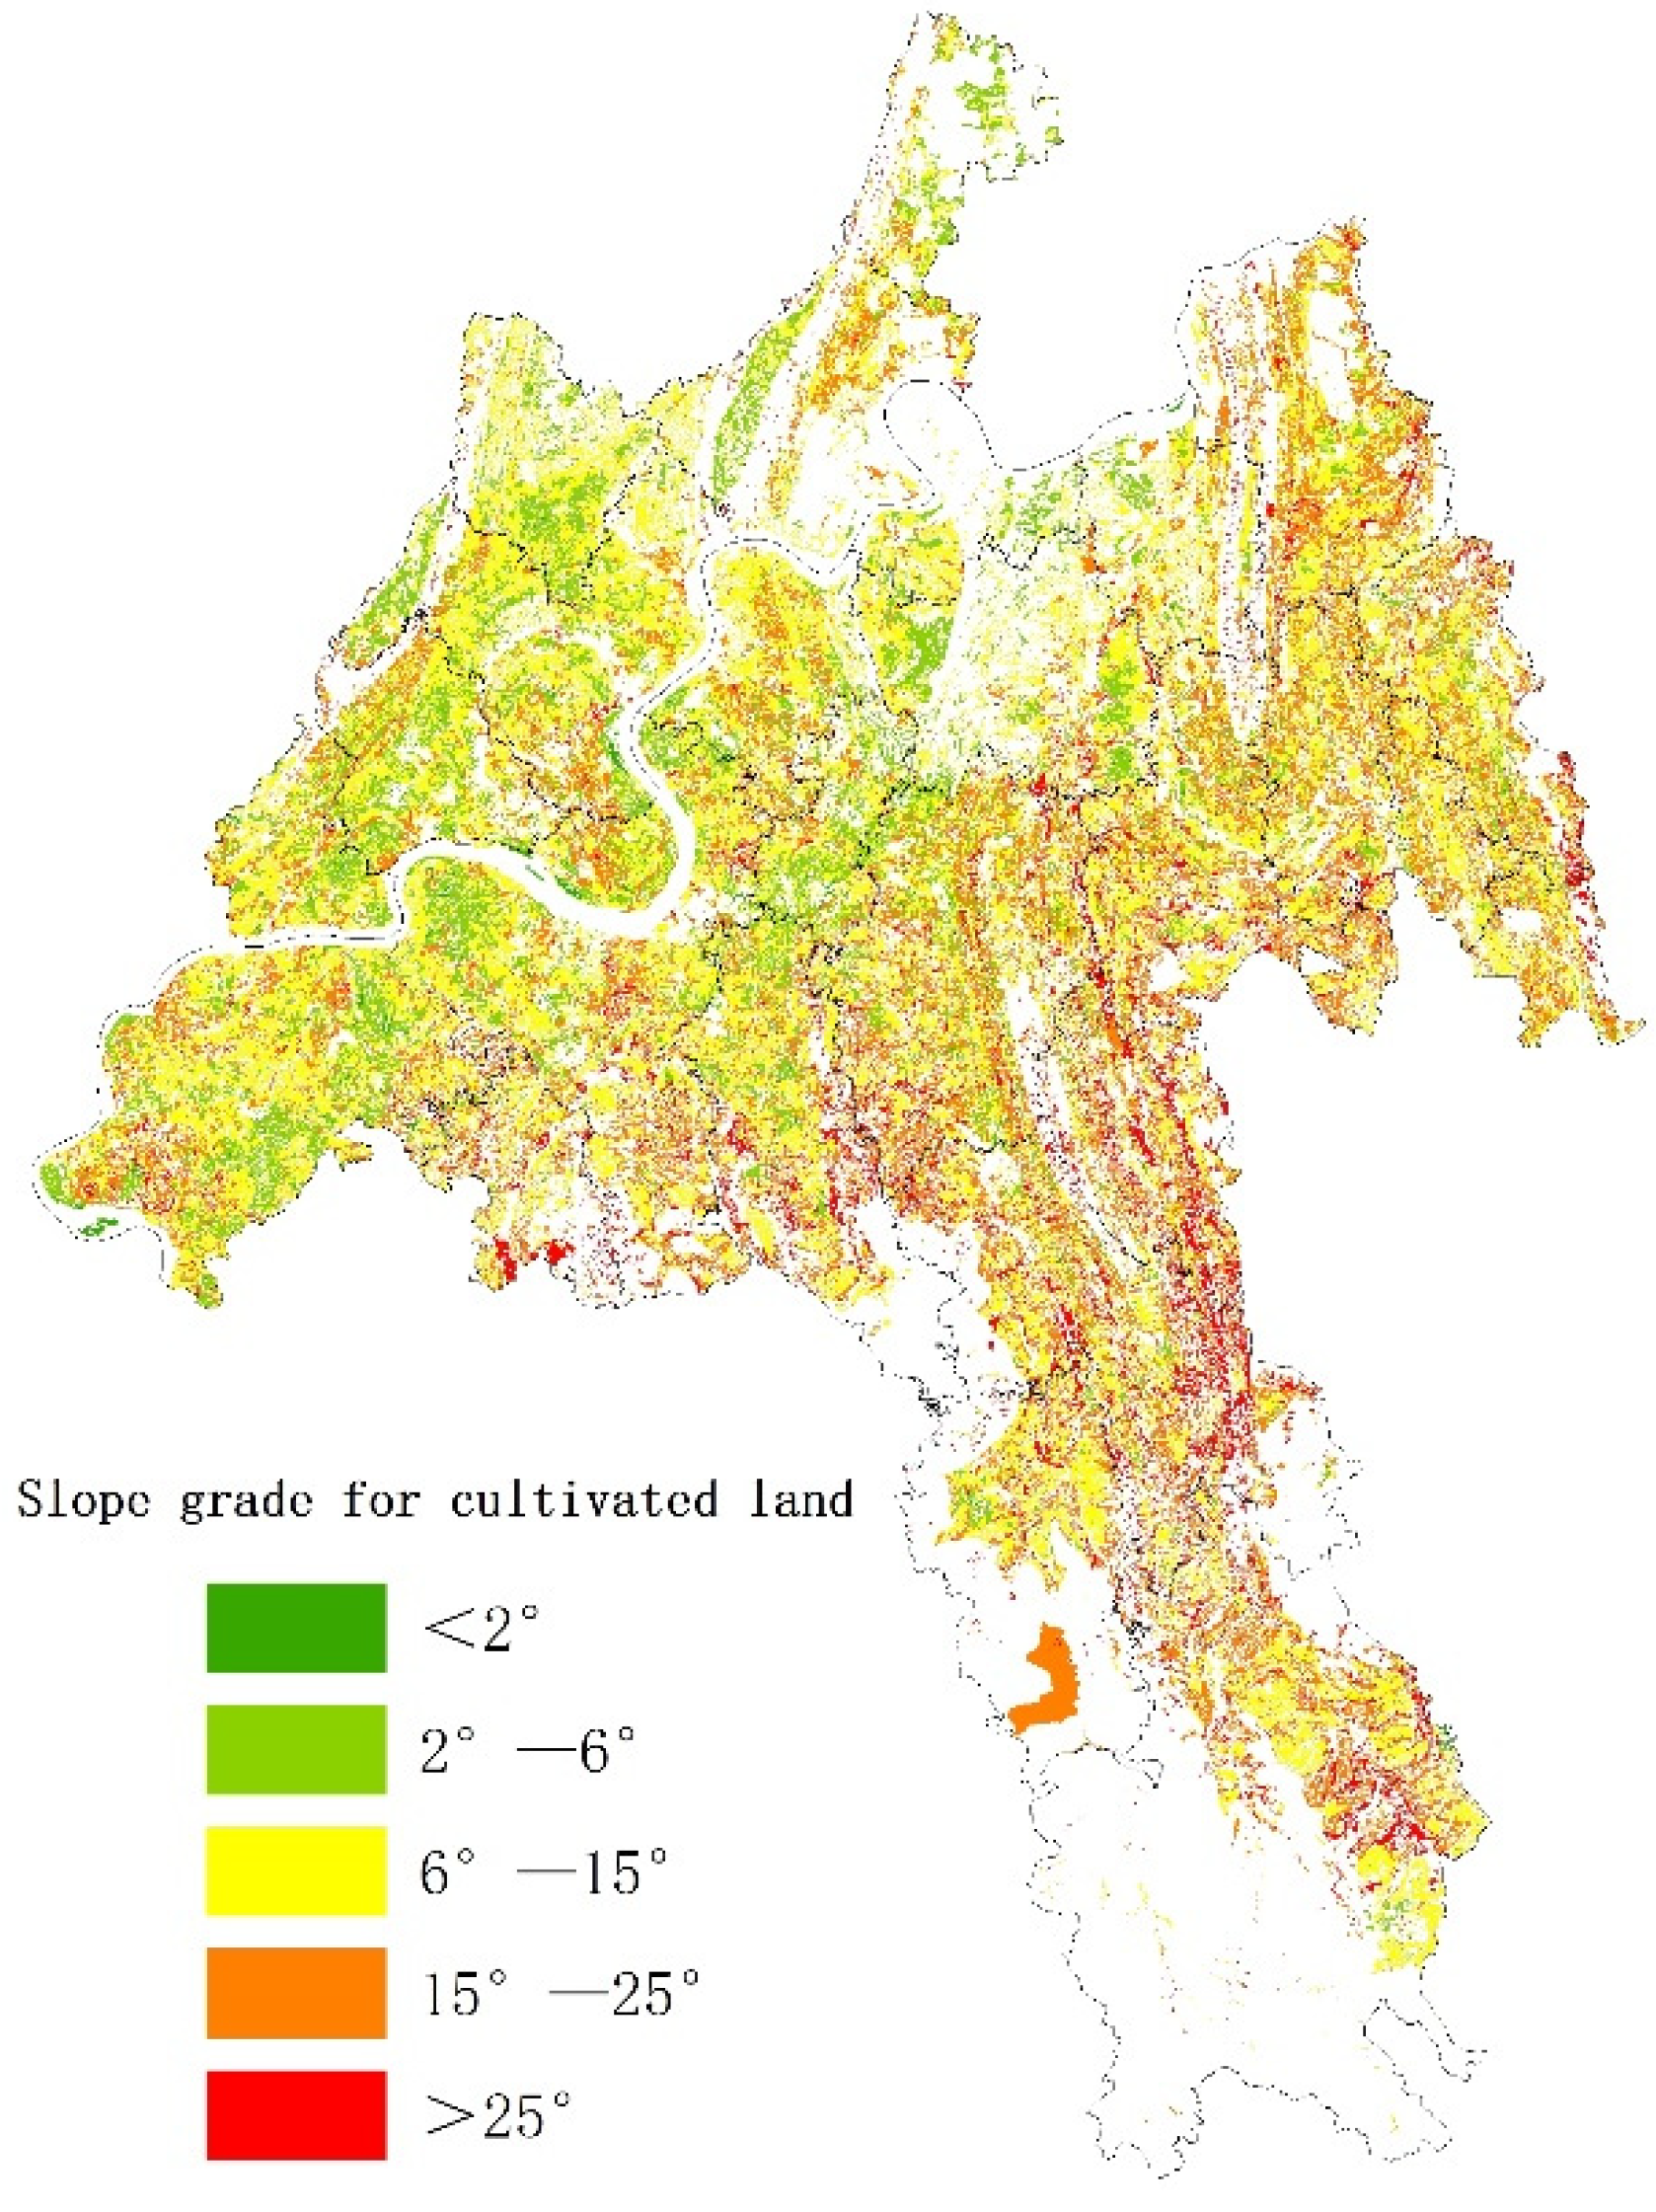
There is 156,835 km2 of sloping land in Southwest China, of which there are 127,661 km2 of gentle sloped land (6°–25°) and 29,174 km2 of steep sloped land (over 25°) [24]. All sloping farmland accounts for 74.68% of the cultivated land in this region. According to the statistics on land use status in Jiangjin District in 2015, the cultivated land area in the study area was 1147.73 km2, accounting for 35.45% of the total area. The cultivated land area in the study area with slopes less than 2°, 2°–6°, 6°–15°, 15°–25°, and slopes greater than 25° were 11.05 km2, 201.79 km2, 481.72 km2, 360.5 km2, and 92.66 km2, respectively, and accounted for 0.96%, 17.58%, 41.97%, 31.41%, and 8.07% of cultivated land, respectively. Overall, the average slope of cultivated land in the study area gradually increases from northwest to southeast, and its spatial distribution is shown in Figure 2.

2.2. Data Sources and Processing

The main data used in this paper include land use type, topography, socioeconomic statistics, and other datasets.
The land use data were from the Land Use Status of Jiangjin District (Figure 1: 10,000, 2015), which provided the main information extracted, including relevant datasets such as cultivated land, forestland, rivers, roads, and slopes of cultivated land that have an impact on agricultural production. The digital elevation model (DEM) is a raster image with a resolution of 30 m and comes from the GDEM dataset of the Computer Network Information Center of the Chinese Academy of Sciences (Geospatial Data Cloud). Elevation data was extracted from the DEM. The population data of each township and the data related to rural economic development and other social and economic data are collected through the Statistical Yearbook of Jiangjin District and the statistical statement of the agricultural economy.

3. Research Methods

3.1. Standardized Treatment of Indicators

There were two types of indicators, positive and negative, selected in this paper. Therefore, there were differences in the data standardization process. The specific process is as follows.
Assuming that there are M evaluation objects and N evaluation indexes, the data matrix can be obtained as follows:
X = [ x 11 x 1 n x n 1 x nm ]
The matrix is normalized to
R = ( r i j ) n × m
In Formula (2),   r i j represents the standard value of the JTH evaluation object on the ith index, r i j [ 0 , 1 ] .
The standardized formula for the positive indicators is as follows:
r i j = x i j min { x i j } max { x i j } min {   x i j }
The standardized formula for the negative indicator is
x i j = max { x i j } x i j max { x i j } min { x i j }

3.2. Definition of Index Weight

This paper adopted the objective entropy weight method to assign a weight to each index and used information entropy to determine that weight. This approach directly calculates the weight by using the information given in the decision matrix without introducing the subjective judgment of researchers. The main steps are as follows:
  • Define entropy
When there are M evaluation indexes and N evaluation objects, the information entropy Ei of the ith index can be expressed as
  E i = k · j = 1 n f ij lnf ij , i = 1 , 2 , 3 , , m
In this formula,   f ij = r ij /   j = 1 n rj ,   k = 1 ln n , when   f ij = 0 , make f ij ln f ij = 0 .
  • Define entropy weight
After the entropy of the ith index is obtained, the entropy weight of the ith index is calculated as follows:
ω j = 1 E i n i = 1 n E i
In this formula, 0 ≤ ω j ≤ 1, i = 1 n ω j = 1 .
  • Calculate the weighted decision matrix
The   weighting   matrix   is   υ i j = ω j n i j   ( ω j   is   the   weight   of   R j , j = 1 n ω j = 1 )

3.3. TOPSIS

Recently, MCDA methods have been widely used in different fields and disciplines [20]. TOPSIS is an acronym that stands for technique for order preference by similarity to an ideal solution and is widely use in solving practical problems [20,21,25,26]. This method has a solid mathematical foundation and a rigorous calculation process. Below we present its algorithm.
  • Determine positive ideal solutions and negative ideal solutions
    A + = { υ 1 + , υ 2 + , , υ n + } = { ( max υ i j | j I ) , ( min υ i j | j I ) }
    A = { υ 1 , υ 2 , , υ n } = { ( min υ i j | j I ) , ( max υ i j | j I ) }
    where j is the cost-type indicator, and I is the efficiency-type indicator.
  • Calculate the Euclidean distance between the target value and the ideal value
    d i + = j = 1 n ( υ i j υ j + ) 2
    d i = j = 1 n ( υ i j υ j ) 2
  • Determine the proximity of each objective to the positive ideal solution
r i * = d i d i + + d i ( i = 1 , 2 , , m )
In the formula, the greater the value of ri* is, the closer the evaluation object is to the ideal.

3.4. The Fuzzy Comprehensive Evaluation (FCE) Method

Fuzzy comprehensive evaluation (FCE) is a comprehensive evaluation method based on fuzzy mathematics. FCE is a comprehensive decision-making methodology of a multivariable problem solving complex decision process. Its evaluation results are practical and reliable, so it has been widely used in many fields [19]. Below we present its algorithm.
  • The object being evaluated
    X = { x 1 , x 2 , x 3 } = { Y 1 , Y 2 , Y 3 }
  • Comprehensive evaluation index set:
    U = ( u 1 , u 2 , , u n )
    where u i ( i = 1 , 2 , , n ) represents each evaluation factor, and n is an integer.
  • Weight matrix:
Use entropy weights as Formulas (5)–(7).
  • Evaluation set:
    V = ( v 1 , v 2 , , v m )
    where v i ( i = 1 , 2 , , m ) represents each evaluation factor, and m is an integer.
  • Evaluation matrix
Membership
The membership matrix is the degree of membership of an index to a comment. If the membership of the ith index Ui and the jth comments Vj is a symbol such as rij, then the ith index of the membership is expressed as
R i = ( r i 1 , r i 2 , r i 3 , , r i j , r i m )
R i is a single factor evaluation vector.
  • Fuzzy transformation
The fuzzy transformation is Y = XR
where ⊗ stand for fuzzy operation.

3.5. Rank Similarity Coefficient

Many studies have been done to measure the similarity of rankings [27]. In order to compare the similarity of rankings, the weighted rank measure of correlation r w [28] and W S [27] were used. They are expressed in Formulas (17) and (18), respectively, as follows:
r w = 1 6 i = 1 n ( ( R x i R y i ) 2 ( ( n R x i + 1 ) + ( n R y i + 1 ) ) n 4 + n 3 n 2 n
For a samples of size N, the rank values R x i and R y i are defined according to Formula (17) [27].
W S = 1 i = 1 n ( 2 R x i | R x i R y i | max { | 1 R x i | , | N R x i | } )
where WS is a value of similarity coefficient, N is a length of ranking,   R x i and R y i mean the place in the ranking for i t h   element in the ranking x and ranking y, respectively.

3.6. Constructing Evaluation Index System

Farmland scale management is a social and economic behavior based on the existing farmland layout that aims at optimizing the allocation of various factors of agricultural production and improving land use and agricultural production efficiency, which are limited by many factors. In this paper, referring to the “Outline of Land Evaluation” of the United Nations Food and Agriculture Organization (FAO), scholars mainly analyzed the natural attributes of land use (including topography, geomorphology, soil, and climate) and socio-economic attributes (geographical location, transportation accessibility, etc.) of land use. The evaluation system was constructed based on other related research [29,30,31,32].
Referring to the method of constructing the model of AHP [18,32], considering the restriction of regional conditions on agricultural practices and the selection principles of evaluation indicators (comprehensive, systematic, and representative) [18,32,33], the index evaluation system is established from three aspects.

3.6.1. Natural Factors

The endowment of natural resources in the research area is the foundation of agricultural production and has a large influence on the efficiency of agricultural production. The natural factors selected in this paper include the standard deviation of elevation (N1), average slope (N2), water resource density (N3), forest coverage rate (N4), and proportion of garden plots (N5) in the study area.
The indicators are explained as follows. Because the altitude is limited within the scope of research on agricultural production, and the elevation difference in the study area only provides the maximum and minimum points in the area of difference, which is insufficient to describe terrain changes in the research area, the standard deviation of elevation (N1) is used to characterize the overall ups and downs of the terrain in the area of the data by superimposing the DEM on the extracted administrative region. The average slope (N2) represents the steepness of the surface unit, which is extracted by superimposition of the DEM onto a slope map and the administrative region. For regions with complex terrain and large fluctuations, land reclamation or conversion of farmland to forest should be carried out, as they are not suitable for scale management. Therefore, N1 and N2 are negative indicators.
Water resource density (N3) captures the proportion of water such as rivers, lakes, and ponds in the total area of the study region. Water resources are an important factor of agricultural production; agricultural production tends to be close to water sources, and greater water density can support a larger area of relatively developed agricultural production, so water resource density is a positive index.
The forest coverage rate (N4) refers to the proportion of forestland in the study area. From the perspective of ecological effects, the higher the forest coverage rate is, the better. However, from the perspective of agricultural production, forestland restricts agricultural production, and the regional functional positioning of high forest coverage rates should focus on ecological protection.
The proportion of orchard land (N5) refers to the proportion of garden land in the total study area. Since it is easy to convert between the garden and cultivated land use modes, the proportion of garden land is included in the evaluation index, and it is a positive index.
In general, from the perspective of natural factors, scale management should prioritize areas with low fluctuation, gentle slopes, high water resource density, a low forest coverage rate, and a high proportion of garden land.

3.6.2. Socioeconomic Factors

Agricultural production is affected not only by natural factors but also by social and economic development, which is mainly reflected in the impact of human activities on agricultural production. Scale management not only requires good natural and site conditions but also must consider the long-term stability of agricultural production. Therefore, the main road density (S1), secondary road density (S2), proportion of nonagricultural construction land area (S3), agricultural population density (S4), and proportion of total agricultural output value (S5) in the region are selected according to the status quo for land use and basic data in the study area.
The index is explained as follows: road density represents accessibility within a certain region and is an important factor affecting agricultural production. The main road density (S1) refers to the roads connecting the towns except for expressways, which are primarily national roads. The secondary road density (S2) represents roads within the township that connect villages or are used for agricultural production. The summed lengths of the different types of roads in the study area are divided by the total area of the study region. The unit is km/km2, and the higher the value is, the better the accessibility, the higher the convenience of agricultural production, and the higher the scale production suitability, which means that this is a positive index.
The proportion of nonagricultural construction land (S3) can reflect the level of urban development in the study area by dividing the area of nonagricultural construction land by the total area of the study region. This index is a negative index: the higher the value is, the higher the level of urban development in the region will be, which is not conducive to agricultural production.
The agricultural population is the main body of agricultural production, but too great an agricultural population will increase the probability of scattered farming, reduce the possibility of land transfer, and affect the consolidation of plots and popularization of agricultural machinery. Therefore, this paper incorporated agricultural population density (S4) as a negative index, where the greater the density is, the lower the suitability for scale management.

3.6.3. Characteristics of Cultivated Land Factors

The characteristics of cultivated land mainly describe the proportion of cultivated land in all land use types, the proportion of cultivated land with a low slope, and the degree of fragmentation in the spatial distribution of cultivated land in the region. In this paper, three factors, the proportion of cultivated land area (L1), the proportion of cultivated land area with a slope below 15° (L2), and the degree of fragmentation of cultivated land (L3), were selected to describe the characteristics of cultivated land.
The indexes are defined as follows. The proportion of cultivated land area (L1) refers to the ratio between the cultivated land area in a region and the total area of that region. The larger the proportion is, the more arable land will be available, so it is a positive indicator.
The proportion of cultivated land area with a slope below 15° (L2) refers to the sum of the areas of all cultivated land with a slope that is less than 15°. The greater that proportion is, the better the arable land in the region is and the smaller the probability of soil and water loss; it is, thus, a positive indicator.
The degree of cultivated land fragmentation is an indicator to describe the spatial distribution of cultivated land. The degree of cultivated land concentration is related to the time cost of agricultural production and has a high impact on agricultural production efficiency. The higher the degree of concentration is, the more beneficial the use of agricultural machinery and the construction of farmland water conservancy facilities will be. A larger value means a more fragmented spatial distribution of cultivated land, and it is a negative indicator.
As seen in Table 1, this paper selected these 13 evaluation factors capturing three aspects influencing scale management: natural factors, socioeconomic factors, and characteristics of cultivated land. Among them, there were seven positive factors, including water resource density (N3), proportion of garden land (N5), main road density (S1), secondary road density (S2), proportion of regional agricultural gross product (S5), proportion of cultivated land area (L1), and proportion of cultivated land area with a slope below 15° (L2). There were six negative factors, including the standard deviation of elevation (N1), average slope (N2), forest coverage rate (N4), proportion of nonagricultural construction land area (S3), agricultural population density (S4), and farmland fragmentation (L3).
By collecting the data needed for the evaluation index system, the original evaluation matrix was constructed. This paper took the town as the minimum evaluation unit. First, the original matrix was standardized by combining Formulas (1)–(6), and the entropy value and weight of each index were calculated. Then, the grading progress for natural resources, social and economic development, and cultivated land characteristics of each administrative unit in the research area and the optimal solution were calculated, which were represented by Nri, Sri, and Lri (Nri, Sri, and Lri represented the proximity of natural factors, socioeconomic factors, and characteristics of cultivated land factors to the optimal solution.) and then sorted according to the degree of closeness.

4. Results and Analysis

4.1. Single-Factor Evaluation of Suitability for Scale Management

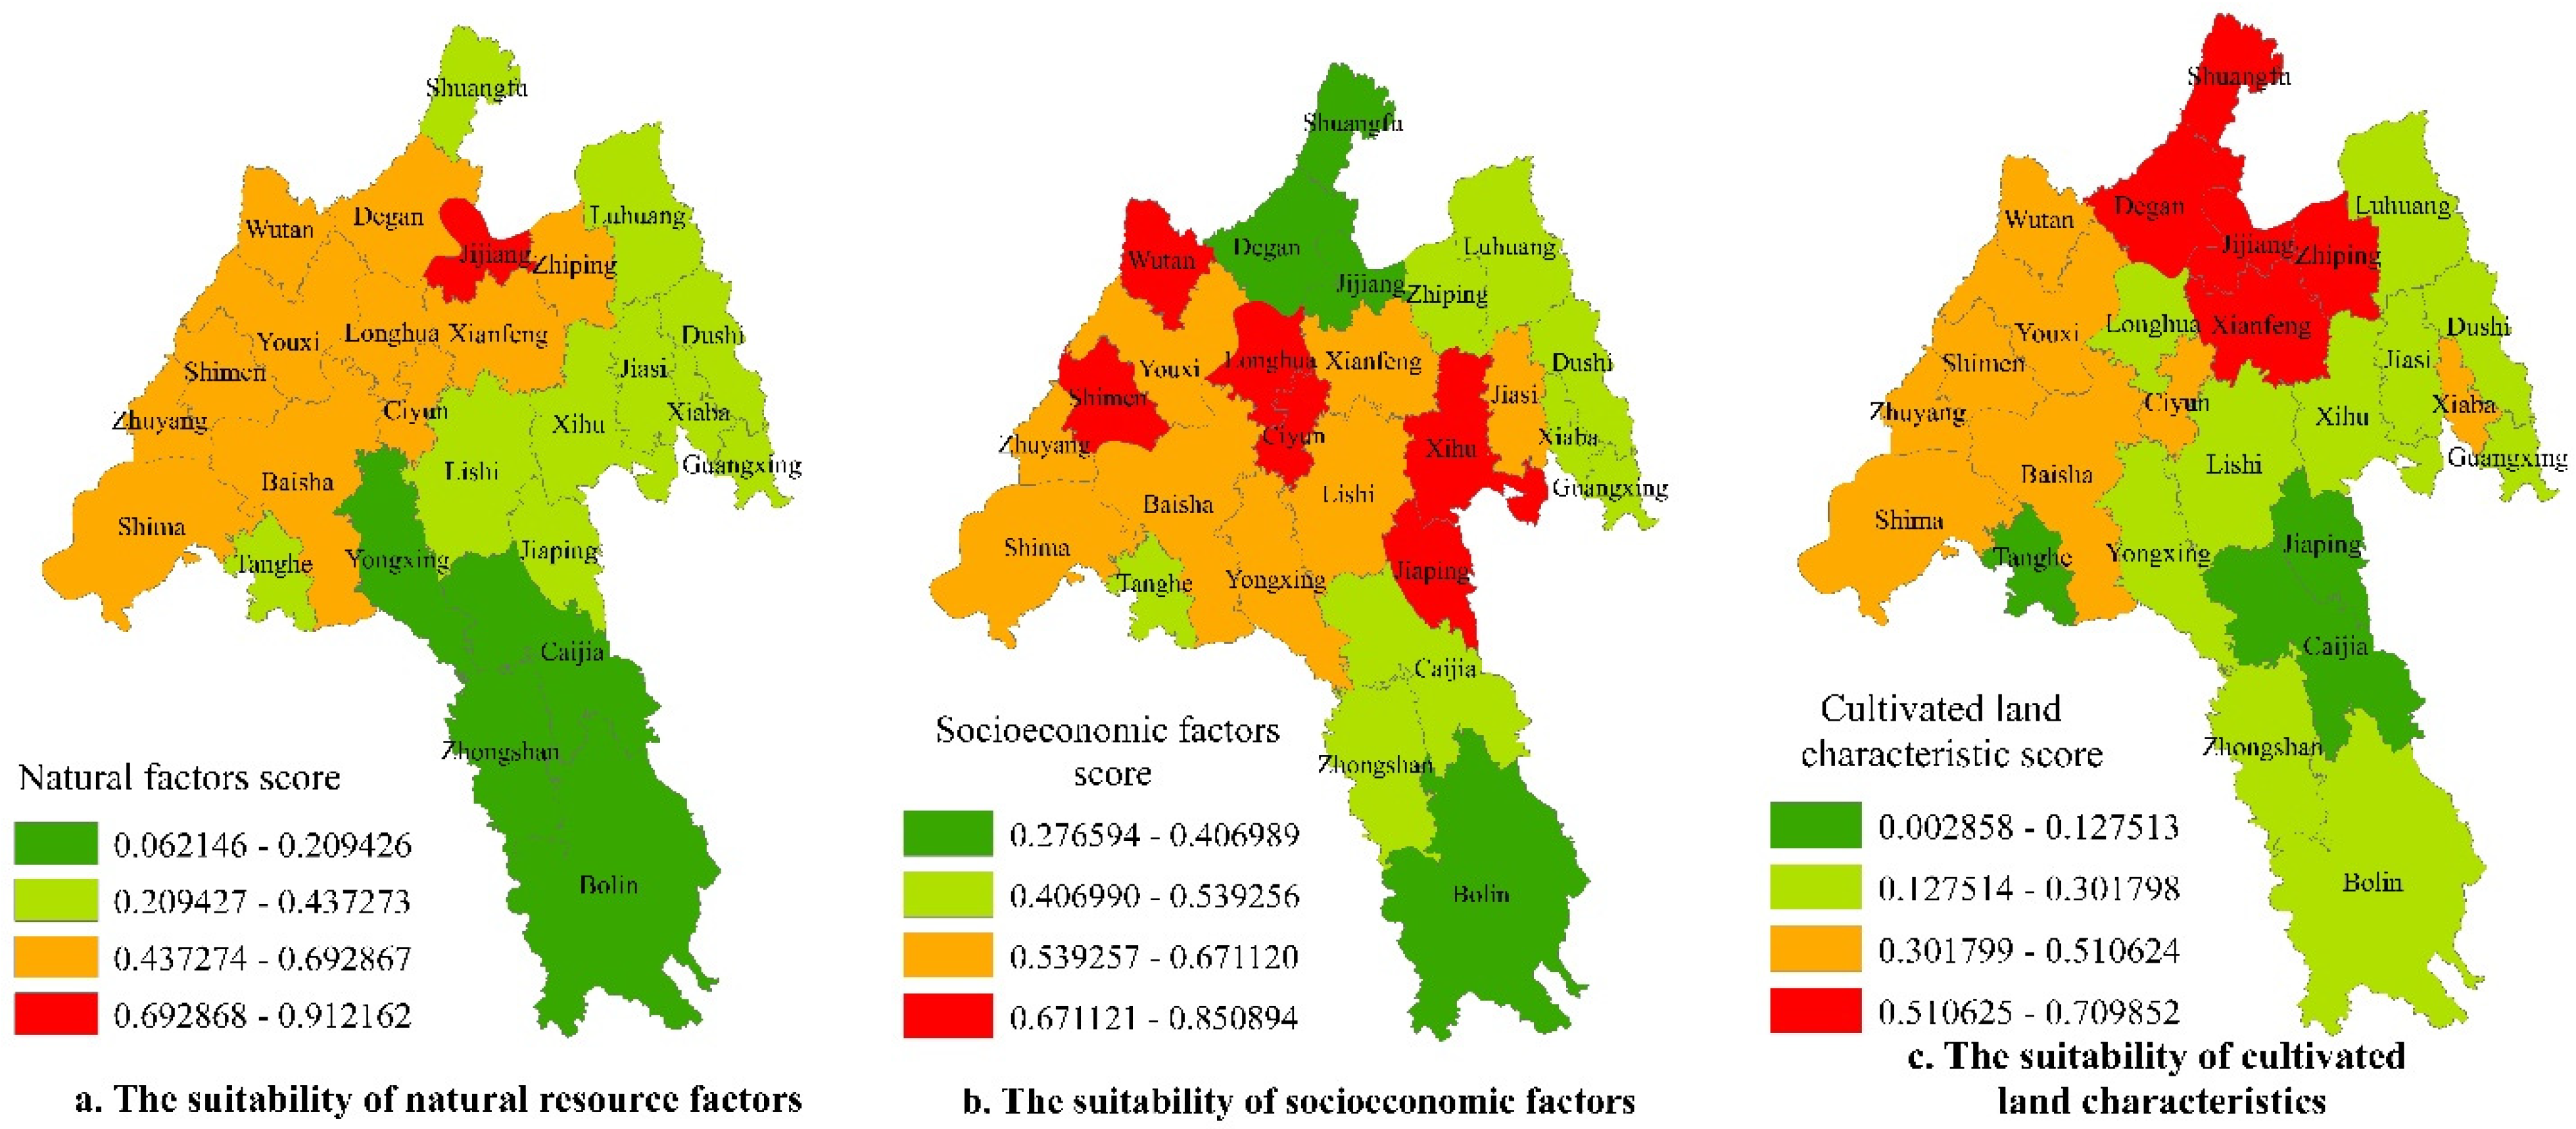
The results in Table 2 were introduced into ArcGIS, and the data were divided into four grades by natural breaks classification. Three classification charts, Figure 3a–c, were obtained for natural resources, social and economic development, and cultivated land resource endowment, respectively.
As seen in Figure 3a, in terms of the suitability of natural resource factors, a gradual deteriorating trend exists from northwest to southeast. The main reason for this trend is that with the continuous rise of altitude, the elevation standard deviation, topographic slope and forest coverage rate are constantly increasing, while water resource density and the proportion of garden land are gradually decreasing.
According to Figure 3b, from the perspective of socioeconomic suitability, the score shows a trend of low in the south and north of the study area and high in the central area. This trend mainly has two causes. First, the northern part of the research area is the main area of urban development, and it is dominated by the development of nonagricultural industries, leading to a low suitability score. Second, the southern part of the study area is largely higher altitude mountainous area dominated by tourism and the tourism industry; it has less agricultural development, and so the suitability score is not high.
According to the cultivated land characteristics in Figure 3c, cultivated land with good conditions is mostly distributed in the valley plain areas, particularly given the relatively flat terrain along both sides of the Yangtze River; the cultivated land is relatively connected and the slope is relatively slow, so the score in the northwest of the study area is generally better than that in the southeast.

4.2. Comprehensive Evaluation by TOPSIS

4.2.1. Index Weight Analysis

According to the original evaluation matrix constructed in the previous step, the weight of each index was calculated by Formulas (5)–(7), as shown in Table 3. The weights of the N4, N5, and L3 indexes were greater than 0.10, indicating that the forest coverage rate, proportion of orchard area, and degree of cultivated land fragmentation were the main factors affecting the evaluation system. Second, the index weights of N1, S1, S2, S5, L1, and L2 were greater than 0.05, indicating that the elevation standard deviation, main road density, secondary road density, proportion of agricultural output value in total output value, proportion of cultivated land area, and proportion of cultivated land area with a slope below 15° also played an important role in the evaluation system.

4.2.2. Comprehensive Evaluation of the Index System by TOPSIS

The original matrix was weighted with the index weight, and the Euclidean distances between the index value and the optimal solution (A+) and the worst solution (A–) were calculated by Formulas (8)–(12), as well as the closeness degree RI to the optimal solution. The sorted results are shown in Table 4. The Ci values of each evaluation unit in Table 4 were imported into ArcGIS, and natural breaks classification was used to classify the evaluation region into four grades: Class I region, Class II region, Class III region, and Class IV region. These were named the priority promotion area, optimization and adjustment area, restricted development area, and prohibited operation area, respectively, as shown in Figure 4.
As shown in Figure 4, there are significant regional differences in the scale management suitability of the study area, with a high spatial distribution concentration and a gradual decreasing trend from north to south.
Area I is the priority promotion area, including Wutan, Youxi, Longhua, Ciyun, Xianfeng, Qijiang, and Zhiping. The cultivated land area of Area I is 238.13 km2. The cultivated land area with a slope below 15° is 190.36 km2, accounting for 79.94% of the total cultivated land in Area I. This area, mainly concentrated in the valley plain area in the north of Jiangjin District, has the best suitability. Jijiang and Zhiping towns have obvious advantages in nonagricultural economic development and are the main areas of urban development in Jiangjin District. To ensure the long-term stability of agricultural production and avoid urban development encroaching on agricultural production land, agricultural production in this area should be outside the buffer zone of urban development. The other five towns in Area I mainly focus on agricultural production from the perspective of regional function positioning, with obvious agricultural production location advantages, flat terrain, a relatively high degree of contiguous farmland, and good agricultural infrastructure. Therefore, all production factors should be reasonably allocated, which in combination with farmland circulation will promote scale management.
Area II is the optimized adjustment area and includes five towns: De Gan, Zhu Yang, Shi Yang, Shi Men, and Bai Sha. The total cultivated land area in Area II is 312.49 km2, and the cultivated land area with a slope below 15° is 226.26 km2, accounting for 72.41% of the cultivated land area in Area II. This region has good suitability conditions; it is mainly concentrated in the western part of the study area and distributed in the valley plain along the Yangtze River. In addition to Degan town, which focuses on industrial development, other areas can effectively improve their agricultural production conditions by combining comprehensive land management with farmland transfer to improve agricultural production efficiency and increase grain output.
Area III is a development restricted area and includes 10 towns: Shuangfu, Luhuang, Dushi, Jia Si, Xiaba, Guangxing, XIhu, Jiaping, Lishi, and Yongxing. The total cultivated land area in Area II is 414.32 km2, of which the cultivated land area with a slope below 15° is 205.36 km2, accounting for 49.56% of the total cultivated land area in Area III. Shuangfu and Luohuang are located in the industrial zone adjacent to the main urban area of Chongqing; they have developed nonagricultural industries and obvious regional advantages, so the possibility of the nonagricultural conversion of cultivated land is relatively high. Therefore, the functional positioning should be to focus on nonagricultural industry development and agricultural production as a supplement. The other towns, except Shuangfu and Luhuang, belong to the transition region between the low mountain area and the southern high mountain area. The natural resources and cultivated land resource endowment conditions are poor, and the situation for social and economic development is not good. These towns mainly engage in agricultural production, but the production level is not high. Thus area should take the protection and improvement of the ecological environment as its main goal and carry out scale management in the region only under appropriate conditions.
Area IV is a prohibited area. The total cultivated land area in Area IV is 182.79 km2, and the cultivated land area with a slope below 15° is 72.59 km2, accounting for 39.71% of the total cultivated land area in Area IV, but the proportion of arable land suitable for cultivation is relatively low. This region is located in the high mountainous region in the south of the study area, with a relatively large standard deviation of elevation. With increasing altitude and slope, the soil layer becomes thinner, and soil and water loss is exacerbated. The land use type of Area IV is mainly forestland, farmland distribution is relatively fragmented, the road network is sparse, the agricultural supporting facilities are weak, and the whole region is largely distributed in a nature protection zone. Therefore, from the perspective of function positioning, Area IV should mainly focus on tourism and ecological protection, as it is not suitable for large-scale agricultural production.
In general, there are significant regional differences in the evaluation results of the study area; in terms of spatial distribution, they are highly concentrated. Area I and Area II are mainly concentrated in the shallow hilly and flat dam areas along the banks of the Yangtze River in the northern part of the study area, and the scale management suitability in this area is relatively high. Area III is distributed in the southeastern part of the study area, which is the transition region between the shallow mound plateau and the southern high mountain area. Area IV is mainly concentrated in the mountain and hilly areas in the south of the study area, and it is within the scope of nature reserves. This area is not suitable for scale management, which conforms to the actual situation. In terms of cultivated land structure, the sizes of Area I to Area IV are 238.13 km2, 312.49 km2, 414.32 km2 and 182.79 km2 (Table 5), respectively, accounting for 20.75%, 27.23%, 36.10%, and 15.93% of the total cultivated land area of the study area, respectively. They show an “olive” shaped distribution that is small at both ends and large in the middle. The results show that the arable land suitable for cultivation was evenly distributed in areas I, II, and III, but there is less in area IV.

4.3. A Comparison with TOPSIS

When we use different methods, the results of the rankings are often different [27]. The choice of method is critical to the result [21]. Therefore, this paper used the FCE method to verify TOPSIS.

4.3.1. The Results of the FCE

The FCE method was used to calculate the matrix, and the results were obtained and sorted, as shown in Table 6.

4.3.2. Rank Similarity Coefficient

In order to compare different rankings, the most popular method is to perform correlation analysis on two or more groups of rankings [34].
The data in Table 7 were used to calculate the similarity coefficient in combination with Formulas (17) and (18). The values of r w and W S were 0.831 and 0.887 (Table 8), respectively, indicating that the rankings of the two groups were highly similar [27,28].

5. Discussion and Conclusions

5.1. Discussion

5.1.1. The Space for Agricultural Production Should Be Coordinated with the Space for Urban Development and That for Ecological Protection

In contrast to other industries, agricultural production requires a large investment but offers a slow return on that investment. The purpose of scale management is to effectively integrate agricultural production resources and improve land use and agricultural production efficiency to guarantee food security, increase grain yield, and increase the income of farmers. It is also an effective measure for promoting farmland circulation and reducing farmland abandonment. Therefore, in view of the natural resource conditions, social and economic development status, and cultivated land characteristics of the research area, 13 factors were selected to construct the farmland scale management suitability evaluation index. The entropy-TOPSIS method was used to evaluate each unit in the research area, and then the evaluation results were classified based on the ArcGIS platform. Finally, a suitability classification of the research area was obtained. The entropy-TOPSIS method obtained the weight for each index through the information provided by each and then provided a comprehensive evaluation of regional suitability combined with TOPSIS system multiobjective decisions. The evaluation results took into account the site conditions of the agricultural production space, the possible scope of urban development space expansion, and the space under ecological protection and effectively evaluated the suitability of each unit in the research area.

5.1.2. Scale Management of Farmland Should Combine Rural Land Circulation and the Comprehensive Improvement of Farmland

The evaluation results showed that cultivated land resources with good site conditions, suitable social and economic development for agricultural production, and low pressure for ecological protection were relatively scarce, and the comprehensive conditions of cultivated land in the whole area still had much room for improvement. Therefore, the appropriate scale of agricultural land in the research area objectively needs to be combined with the scientific and comprehensive improvement of agricultural land to improve agricultural production conditions and production efficiency. However, in actual production, only centralized contiguous operations without supporting facilities for the comprehensive improvement of farmland are bound to lead to the absence of infrastructure such as farmland water conservancy and roads, thus resulting in low production efficiency. Carrying out the comprehensive improvement of farmland without developing supporting industries will result in abandoned farmland and wasted investment. Only the coordinated development of farmland scale management and the comprehensive improvement of farmland and rural land circulation can produce the maximum effect.

5.2. Conclusions

In this paper, the entropy-TOPSIS method is used to evaluate and classify the suitability of scale management in Jiangjin District, Chongqing. There are significant regional differences in the suitability for scale management in the study area, with spatial distribution being highly concentrated. Cultivated land resources suitable for agricultural production are relatively scarce in the study area. However, on the whole, there is still great room for improvement in agricultural production efficiency if integrated farmland improvement and farmland transfer can be effectively combined. The evaluation results take into account the site conditions of the scale management space, urban development space, and ecological protection space. They provide a scientific basis and support for optimizing land resource allocation, carrying out land consolidation and engaging in relevant agricultural industry planning in the research area. This study has broadened the connotation of land suitability evaluation and has certain practical significance.
As agricultural production is influenced by many complex factors, there are many factors affecting the suitability evaluation of farmland scale management; limited by the basic data collected, this paper is restricted to the township level as the minimum evaluation unit scale, although this level theoretically belongs to macroscale research. When the research scale is larger, factors affecting crop growth, such as illumination, precipitation and accumulated temperature, can be added into the evaluation system. When the research scale is reduced to plots, factors such as nitrogen, phosphorus, and potassium content of cultivated land can be added as evaluation indexes. Research using larger or smaller scales as evaluation units remains to be explored.
Methodologically, the FCE method was introduced to verify the effectiveness of TOPSIS. Two coefficients of r w and W S were introduced to compare the similarity of rankings, and the results show that the two groups of rankings have high similarity. More MCDA methods can be explored to compare results in the future. Although the entropy-TOPSIS method can avoid the bias caused by human factors, its effectiveness depends largely on the constructed index system. Therefore, there is still room for further improvement in the screening and research methods for evaluation indexes in this study.

Author Contributions

Conceptualization, D.X. and C.W.; methodology, C.W.; software, X.C.; validation, X.C.; formal analysis, X.C.; resources, D.X.; data curation, C.W.; writing—original draft preparation, X.C.; writing—review and editing, D.X.; visualization, X.C.; supervision, C.W.; funding acquisition, D.X.; All authors have read and agreed to the published version of the manuscript.

Funding

This research was funded by “National Key Water Conservancy Construction Fund of the Three Gorges Follow-up Research Program (No. 5001022019CF50001)”.

Institutional Review Board Statement

Not applicable.

Informed Consent Statement

Not applicable.

Data Availability Statement

Land use data are not publicly available due to privacy.

Conflicts of Interest

The authors declare no conflict of interest.

References

  1. Tian, Y.J.; Li, X.B.; Ma, G.X.; Hao, H.G. Influences of labor emigration from agriculture on the production abandonment of cultivated land in ecological sensitive areas. China Land Sci. 2010, 7, 4–9. [Google Scholar]
  2. Kalogirou, S. Expert systems and GIS: An application of land suitability evaluation. Computers. Environ. Urban Syst. 2002, 26, 89–112. [Google Scholar] [CrossRef]
  3. Ahamed, T.; Rao, K.G.; Murthy, J. GIS-based fuzzy membership model for crop-land suitability analysis. Agric. Syst. 2000, 63, 75–95. [Google Scholar] [CrossRef]
  4. Hopkins, L.D. Methods for generating land suitability maps: A comparative evaluation. J. Am. Inst. Plan. 1977, 43, 386–400. [Google Scholar] [CrossRef]
  5. Wang, F. The use of artificial neural networks in a geographical information system for agricultural land-suitability assessment. Environ. Plan. A 1994, 26, 265–284. [Google Scholar] [CrossRef]
  6. Bandyopadhyay, S.; Jaiswal, R.K.; Hegde, V.S.; Jayaraman, V. Assessment of land suitability potentials for agriculture using a remote sensing and GIS based approach. Int. J. Remote Sens. 2009, 30, 879–895. [Google Scholar] [CrossRef]
  7. Zolekar, R.B.; Bhagat, V.S. Multi-criteria land suitability analysis for agriculture in hilly zone: Remote sensing and GIS approach. Comput. Electron. Agric. 2015, 118, 300–321. [Google Scholar] [CrossRef]
  8. Guo, P.; Zhang, F.; Wang, H.; Qin, F. Suitability evaluation and layout optimization of the spatial distribution of rural residential areas. Sustainability 2020, 12, 2409. [Google Scholar] [CrossRef] [Green Version]
  9. Steiner, F.; McSherry, L.; Cohen, J. Land suitability analysis for the upper Gila River watershed. Landsc. Urban Plan. 2000, 50, 199–214. [Google Scholar] [CrossRef]
  10. Palmer, D.; Gottschalg, R.; Betts, T. The future scope of large-scale solar in the UK: Site suitability and target analysis. Renew. Energy 2019, 133, 1136–1146. [Google Scholar] [CrossRef]
  11. Guo, P.; Zhang, F.; Wang, H.; Qin, F. GIS based land suitability assessment for tobacco production using AHP and fuzzy set in Shandong province of China. Comput. Electron. Agric. 2015, 114, 202–211. [Google Scholar]
  12. Lara-Estrada, L.; Rasche, L.; Schneider, U.A. Modeling land suitability for Coffea arabica L. in Central America. Environ. Model. Softw. 2017, 95, 196–209. [Google Scholar] [CrossRef]
  13. Maleki, F.; Kazemi, H.; Siahmarguee, A.; Kamkar, B. Development of a land use suitability model for saffron (Crocus sativus L.) cultivation by multi-criteria evaluation and spatial analysis. Ecol. Eng. 2017, 106, 140–153. [Google Scholar] [CrossRef]
  14. Joss, B.N.; Hall, R.J.; Sidders, D.M.; Keddy, T.J. Fuzzy-logic modeling of land suitability for hybrid poplar across the Prairie Provinces of Canada. Environ. Monit. Assess. 2008, 2008, 79–96. [Google Scholar] [CrossRef]
  15. Unglaub, B.; Steinfartz, S.; Kühne, D.; Haas, A.; Schmidt, B.R. The relationships between habitat suitability, population size and body condition in a pond-breeding amphibian. Basic Appl. Ecol. 2018, 27, 20–29. [Google Scholar] [CrossRef]
  16. Na, X.; Zhou, H.; Zang, S.; Wu, C.; Li, W.; Li, M. Maximum entropy modeling for habitat suitability assessment of Red-crowned crane. Ecol. Indic. 2018, 91, 439–446. [Google Scholar] [CrossRef]
  17. Li, M.; Zhang, C.; Xu, B.; Xue, Y.; Ren, Y. Evaluating the approaches of habitat suitability modelling for whitespotted conger (Conger myriaster). Fish. Res. 2017, 195, 230–237. [Google Scholar] [CrossRef]
  18. Yalew, S.G.; van Griensven, A.; Mul, M.L.; van der Zaag, P. Land suitability analysis for agriculture in the Abbay basin using remote sensing, GIS and AHP techniques. Model. Earth Syst. Environ. 2016, 2, 101. [Google Scholar] [CrossRef] [Green Version]
  19. Zhang, P.; Feng, G. Application of fuzzy comprehensive evaluation to evaluate the effect of water flooding development. J. Pet. Explor. Prod. Technol. 2018, 8, 1455–1463. [Google Scholar] [CrossRef] [Green Version]
  20. Sałabun, W.; Wątróbski, J.; Shekhovtsov, A. Are MCDA methods benchmarkable? A comparative study of TOPSIS, VIKOR, COPRAS, and PROMETHEE II methods. Symmetry 2020, 12, 1549. [Google Scholar] [CrossRef]
  21. Shekhovtsov, A.; Sałabun, W. A comparative case study of the VIKOR and TOPSIS rankings similarity. Procedia Comput. Sci. 2020, 176, 3730–3740. [Google Scholar] [CrossRef]
  22. Fan, S.; Chan-Kang, C. Is small beautiful? Farm size, productivity, and poverty in Asian agriculture. Agric. Econ. 2005, 32, 135–146. [Google Scholar] [CrossRef] [Green Version]
  23. Rada, N.E.; Fuglie, K.O. New perspectives on farm size and productivity. Food Policy 2018, 84, 147–152. [Google Scholar] [CrossRef]
  24. Xie, J. Chinese Slope Cultivated Land; China Land Press: Beijing, China, 2008; p. 13. [Google Scholar]
  25. Chen, P. Effects of normalization on the entropy-based TOPSIS method. Expert Syst. Appl. 2019, 136, 33–41. [Google Scholar] [CrossRef]
  26. Paradowski, B.; Więckowski, J.; Dobryakova, L. Why TOPSIS does not always give correct results? Procedia Comput. Sci. 2020, 176, 3591–3600. [Google Scholar] [CrossRef]
  27. Sałabun, W.; Urbaniak, K. A new coefficient of rankings similarity in decision-making problems. In Proceedings of the International Conference on Computational Science, Amsterdam, The Netherlands, 3–5 June 2020; Springer: Cham, Switzerland, 2020. [Google Scholar]
  28. Pinto da Costa, J.; Soares, C. A weighted rank measure of correlation. Aust. N. Z. J. Stat. 2005, 47, 515–529. [Google Scholar] [CrossRef]
  29. Gui, J.; Zhanqi, W.; Weisong, L. Suitable evaluation on cultivated land based on fuzzy weights of evidence method in the yarlung zangbo River, Nyangqu River and Lhasa River region. Tibet. J. Nat. Resour. 2014, 29, 1246–1256, (In Chinese with English abstract). [Google Scholar]
  30. Zhou, K.; Li, J.; Wang, Q. Evaluation on agricultural production space and layout optimization based on resources and environmental carrying capacity: A case study of Fujian Province. Sci. Geogr. Sin. 2021, 41, 280–289, (In Chinese with English abstract). [Google Scholar]
  31. Feng, T.; Zhang, F.; Li, C.; Qu, Y.; Zhu, F. Spatial distribution of prime farmland based on cultivated land quality comprehensive evaluation at county scale. Trans. Chin. Soc. Agric. Eng. 2014, 30, 200–210, (In Chinese with English abstract). [Google Scholar]
  32. Zeng, J.; Shao, J.; Wei, C.; Xie, D. Delimitation of permanent basic farmland in mountain and hill areas in southwest China based on multiple-objective decision model. Trans. Chin. Soc. Agric. Eng. 2014, 30, 263–274, (In Chinese with English abstract). [Google Scholar]
  33. Wu, W.; He, H. A study on a decision-making model of prime farmland based on quality of farmland and location principle: A case study of Dujiangyan city. J. Sichuan Agric. Univ. 2011, 29, 429–436, (In Chinese with English abstract). [Google Scholar]
  34. Faizi, S.; Rashid, T.; Sałabun, W.; Zafar, S.; Wątróbski, J. Decision Making with Uncertainty Using Hesitant Fuzzy Sets. Int. J. Fuzzy Syst. 2018, 20, 93–103. [Google Scholar] [CrossRef] [Green Version]
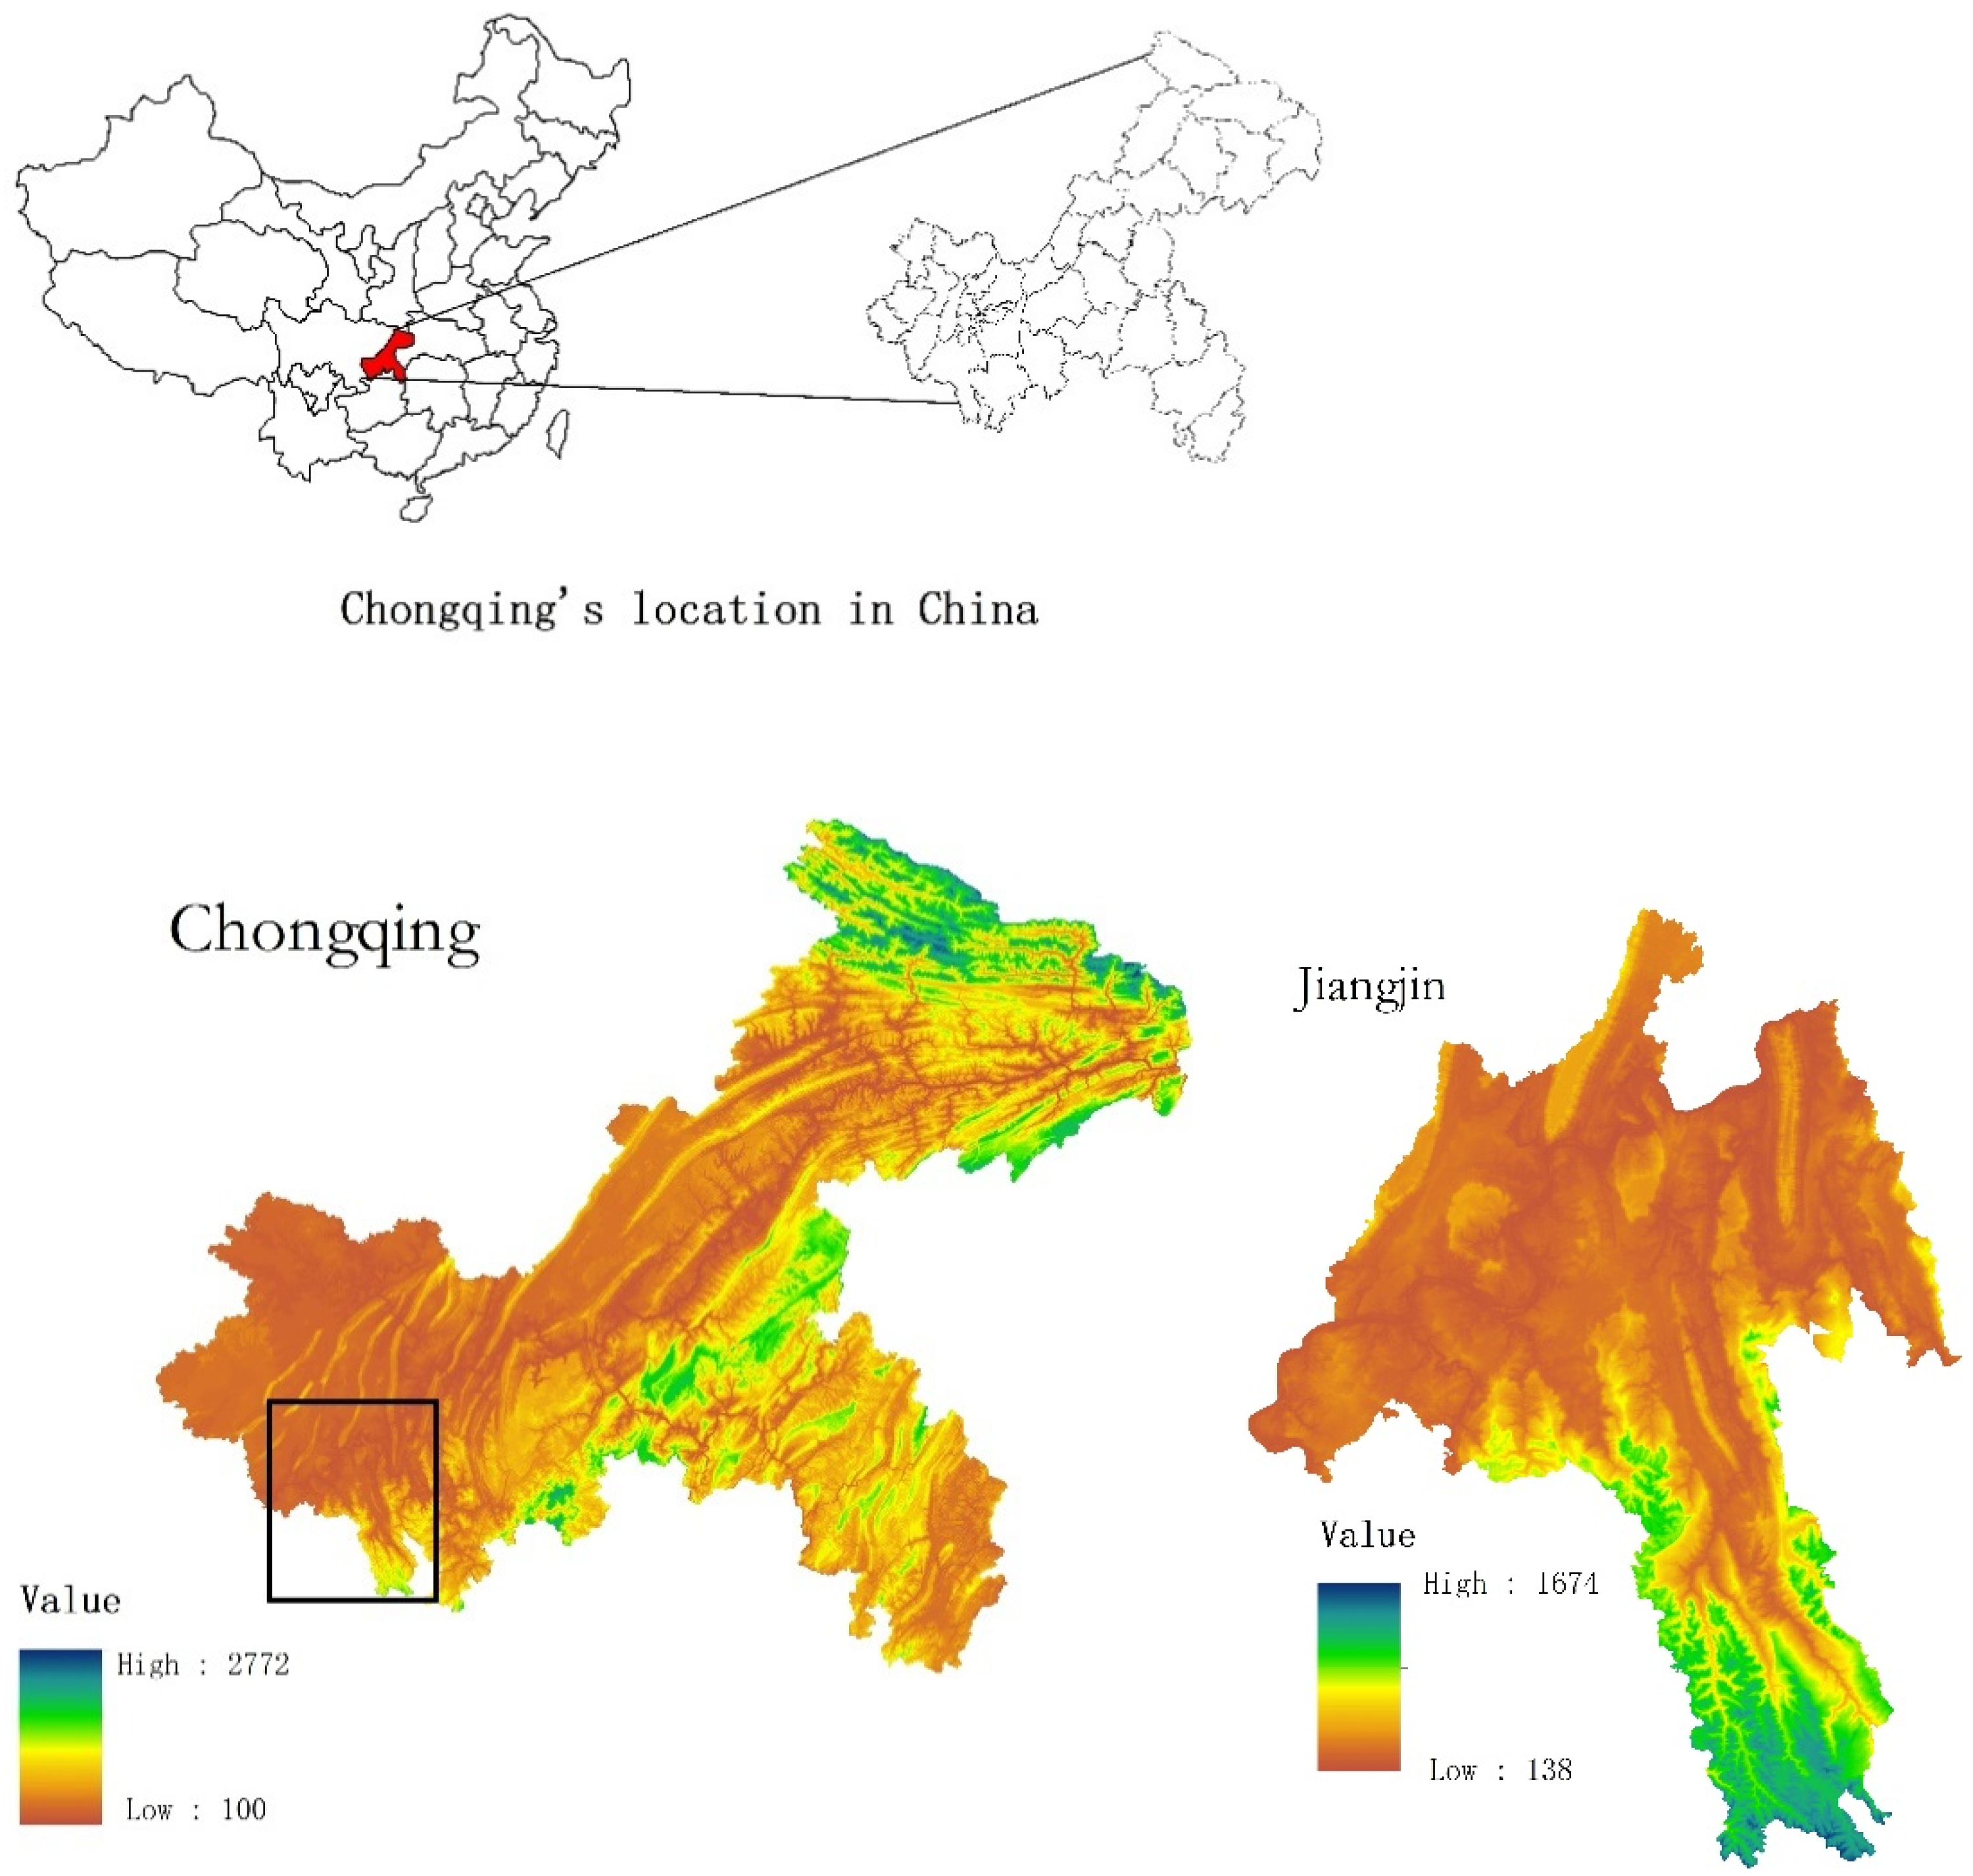
Figure 1. Location and digital elevation model (DEM) of the study area.
Land 10 00416 g001
Figure 2. The cultivated land slope analysis of Jiangjin county.
Land 10 00416 g002
Figure 3. The score of natural factors, socioeconomic factors and characteristics of cultivated land factors in Jiangjin county.
Land 10 00416 g003
Figure 4. The composite scores the research area.
Land 10 00416 g004
Table 1. The index classification and description for evaluation of the suitability of scale management.
Evaluation Indexes/UnitIndex DescriptionPositive or Negative Index
Natural factors (N)Standard deviation of elevation (N1)/mThe standard deviation of all elevation points in the area. Analysis of DEM data; regional statistics by ArcGIS
Average slope (N2)/°The mean value of the slope in the region; the slope map is generated for regional statistics through DEM
Water resource density (N3)/%Surface water area/total area of research area+
Forest coverage rate (N4)/%
orchard land (N5)/%
Forest area/total area of research area
Orchard land/total area of research area

+
Socioeconomic factors (S)Main road density (S1)/(km/km²)Main road length/total area of research area+
Secondary road density (S2) (km/km²)Secondary road length/total area of research area+
Area proportion of nonagricultural construction land (S3)/%Nonagricultural construction land/total area of research area
Agricultural population density (S4)/persons/km2Agricultural population in the research area/total area of research area
Proportion of agricultural output value to total output value in the research area (S5)Output value of agricultural production in the research area/total output value of the research area+
Characteristics of cultivated land factors (L)Proportion of cultivated land area in the research area (L1)/%Cultivated land area/total area of research area+
Proportion of cultivated land area below 15 degrees (L2)/%Cultivated land area with a slope below 15 degrees/total area of cultivated land in the research area+
Fragmentation degree of cultivated land (L3)/(piece/km²)Number of cultivated plots in the research area/total area of research area
Table 2. Proximity to the optimal solution and ranking of natural factors, socioeconomic factors and characteristics of cultivated land factors.
Name of DistrictNri ScoreRankingSri ScoreRankingLri ScoreRanking
Jijiang0.91210.363240.7101
Degan0.62440.349250.6533
Zhiping0.69320.468190.5844
Shuangfu0.437130.277260.5475
Youxi0.59260.64490.4558
Wutan0.59850.70950.5116
Shimen0.514110.70960.34713
Zhuyang0.55180.67170.35211
Shima0.52990.611120.34812
Yongxing0.209230.617110.24420
Tanghe0.300210.510180.12824
Baisha0.486120.581140.36510
Longhua0.64730.79220.30214
Lishi0.357180.66580.21323
Ciyun0.520100.85110.4867
Caijia0.169240.534160.10425
Zhongshan0.062250.441220.25918
Jiaping0.257220.72840.00326
Boling0.062260.407230.25719
Xianfeng0.57470.587130.7002
Luhuang0.410150.448210.27417
Jiasi0.402160.641100.30015
Xiaba0.398170.539150.4209
Xihu0.310200.73130.22422
Dushi0.344190.518170.28316
Guangxing0.420140.463200.24321
Note: Nri, Sri and Lri represent the proximity of natural factors, socioeconomic factors and characteristics of cultivated land factors to the optimal solution, respectively, with the result provided to three decimal places.
Table 3. Weight value for the of scale management index system in the research area.
IndicatorsN1N2N3N4N5S1S2S3S4S5L1L2L3
Index Weight0.050.030.040.170.130.090.050.020.040.090.050.060.16
Table 4. The score and ranking by TOPSIS method.
Administrative DivisionRITOPSIS RankingAdministrative DivisionRITOPSIS Ranking
Jijiang0.6651Lishi0.44116
Degan0.5468Ciyun0.6034
Zhiping0.5807Caijia0.31124
Shuangfu0.42018Zhongshan0.28625
Youxi0.5816Jiaping0.41719
Wutan0.6112Bolin0.27326
Shimen0.52710Xianfeng0.6043
Zhuyang0.5399Luhuang0.41320
Shima0.52011Jiasi0.46814
Yongxing0.37422Xiaba0.47213
Tanghe0.35523Xihu0.44415
Baisha0.49512Dushi0.39821
Longhua0.5925Guangxing0.42317
Note: RI represents the degree of proximity to the optimal solution. The larger the value is, the closer to the optimum. The result is given to three decimal places.
Table 5. The partition and land area statistics for the evaluation of scale management suitability in Jiangjin County.
The Partition of Scale Management Suitability in Jiangjin CityStreet (Town) NameCultivated Land Area/km²
Area I 0.580 ≤ ri < 0.665Wutan Youxi Longhua Ciyun, Xianfeng, Jijiang, Zhiping238.13
Area II 0.495 ≤ ri < 0.580Degan, Zhuyang, Shima, Shimen, Baisha312.49
Area III 0.374 ≤ ri < 0.495Shuangfu, Luhuang, Dushi, Jiasi, Xiaba, Guangxing, Xihu, Jiaping, Lishi, Yongxing414.32
Area IV ri < 0.374Bolin, Zhongshan Caijia, Tanghe182.79
Note: RI represents the degree of proximity to the optimal solution. The larger the value is, the closer to the optimum.
Table 6. The score and ranking by FCE method.
Administrative DivisionFCE ScoreFCE RankingAdministrative DivisionFCE ScoreFCE Ranking
Jijiang0.6241Lishi0.37124
Degan0.5224Ciyun0.4778
Zhiping0.5562Caijia0.37122
Shuangfu0.40814Zhongshan0.38320
Youxi0.4779Jiaping0.43012
Wutan0.4867Bolin0.37123
Shimen0.42813Xianfeng0.46510
Zhuyang0.4936Luhuang0.39717
Shima0.5293Jiasi0.40715
Yongxing0.39419Xiaba0.40316
Tanghe0.33926Xihu0.39518
Baisha0.45811Dushi0.38121
Longhua0.5205Guangxing0.34925
Note: The score is given to three decimal places.
Table 7. TOPSIS and FCE ranks.
Administrative DivisionTOPSIS RanksFCE RanksAdministrative DivisionTOPSIS RanksFCE Ranks
Jijiang11Lishi1624
Degan84Ciyun48
Zhiping72Caijia2422
Shuangfu1814Zhongshan2520
Youxi69Jiaping1912
Wutan27Bolin2623
Shimen1013Xianfeng310
Zhuyang96Luhuang2017
Shima113Jiasi1415
Yongxing2219Xiaba1316
Tanghe2326Xihu1518
Baisha1211Dushi2121
Longhua55Guangxing1725
Table 8. Correlation coefficient of TOPSIS and FCE.
Correlation Coefficients
r w 0.831
W S 0.887
Publisher’s Note: MDPI stays neutral with regard to jurisdictional claims in published maps and institutional affiliations.