Evaluation of Scale Management Suitability Based on the Entropy-TOPSIS Method
Abstract
:1. Introduction
2. Research Scope and Data Sources
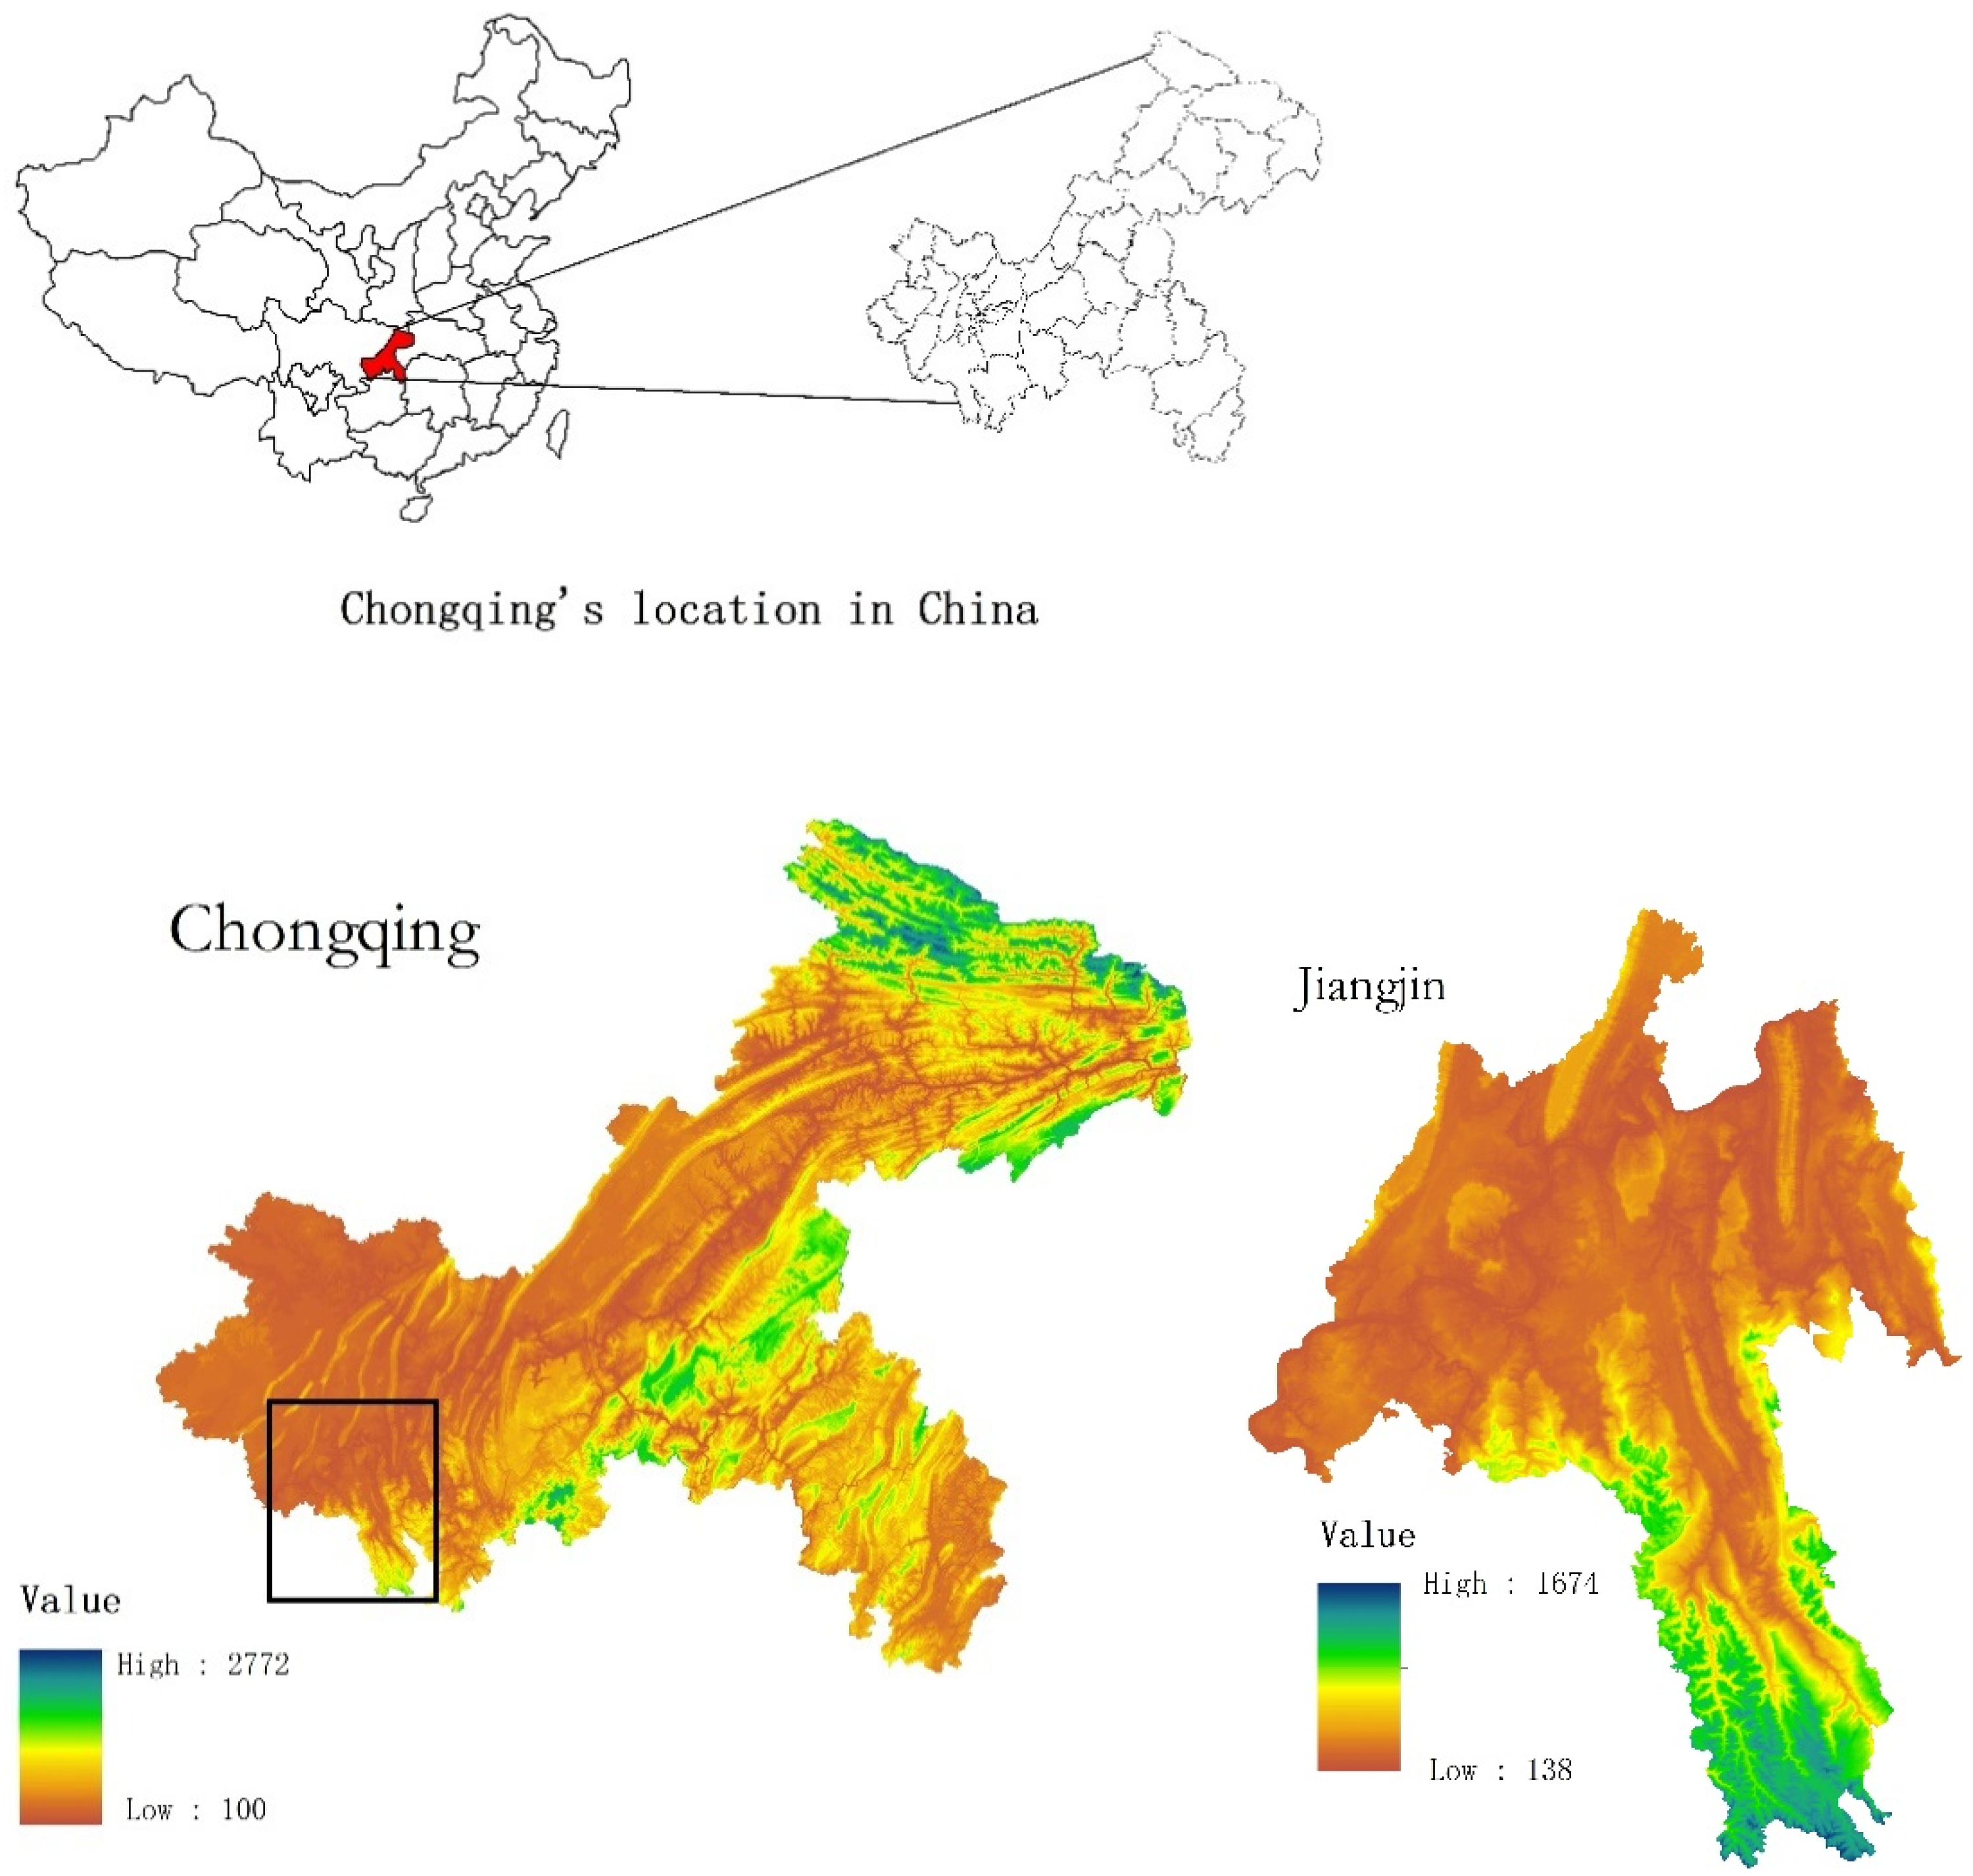
2.1. Overview of the Study Area
2.2. Data Sources and Processing
3. Research Methods
3.1. Standardized Treatment of Indicators
3.2. Definition of Index Weight
- Define entropy
- Define entropy weight
- Calculate the weighted decision matrix
3.3. TOPSIS
- Determine positive ideal solutions and negative ideal solutionswhere j is the cost-type indicator, and I is the efficiency-type indicator.
- Calculate the Euclidean distance between the target value and the ideal value
- Determine the proximity of each objective to the positive ideal solution
3.4. The Fuzzy Comprehensive Evaluation (FCE) Method
- The object being evaluated
- Comprehensive evaluation index set:where represents each evaluation factor, and n is an integer.
- Weight matrix:
- Evaluation set:where represents each evaluation factor, and m is an integer.
- Evaluation matrix
- Fuzzy transformation
3.5. Rank Similarity Coefficient
3.6. Constructing Evaluation Index System
3.6.1. Natural Factors
3.6.2. Socioeconomic Factors
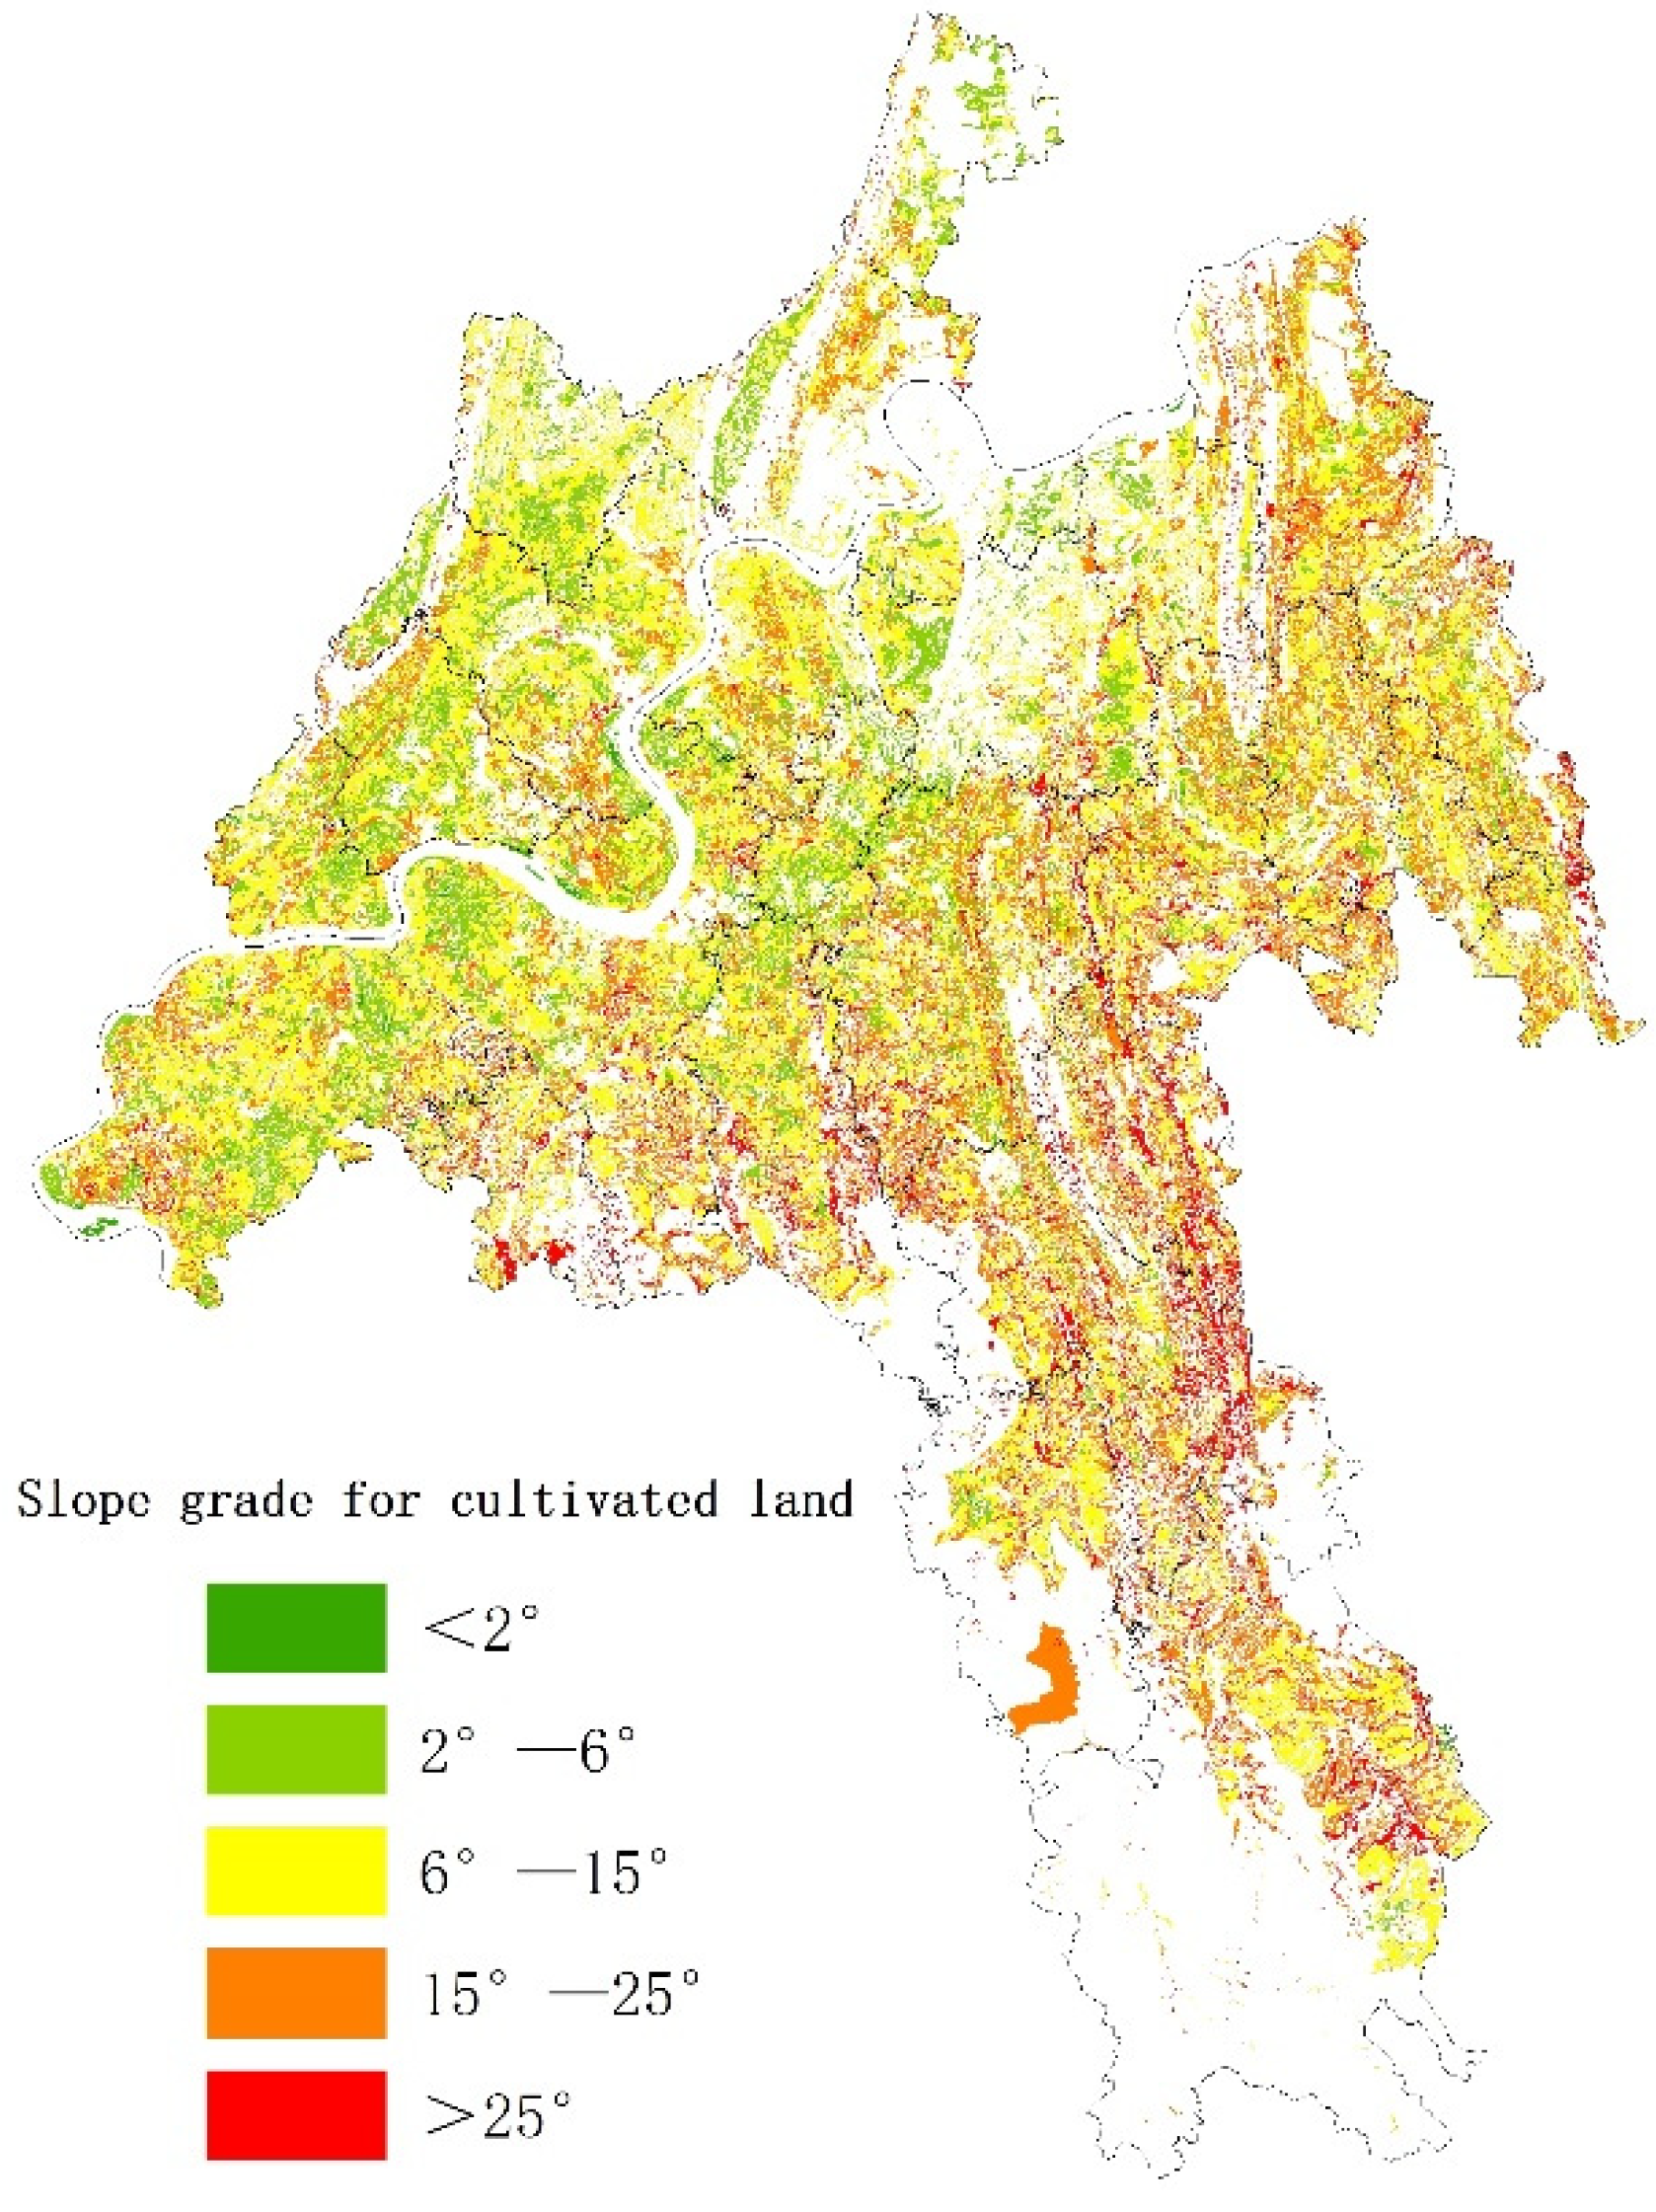
3.6.3. Characteristics of Cultivated Land Factors
4. Results and Analysis
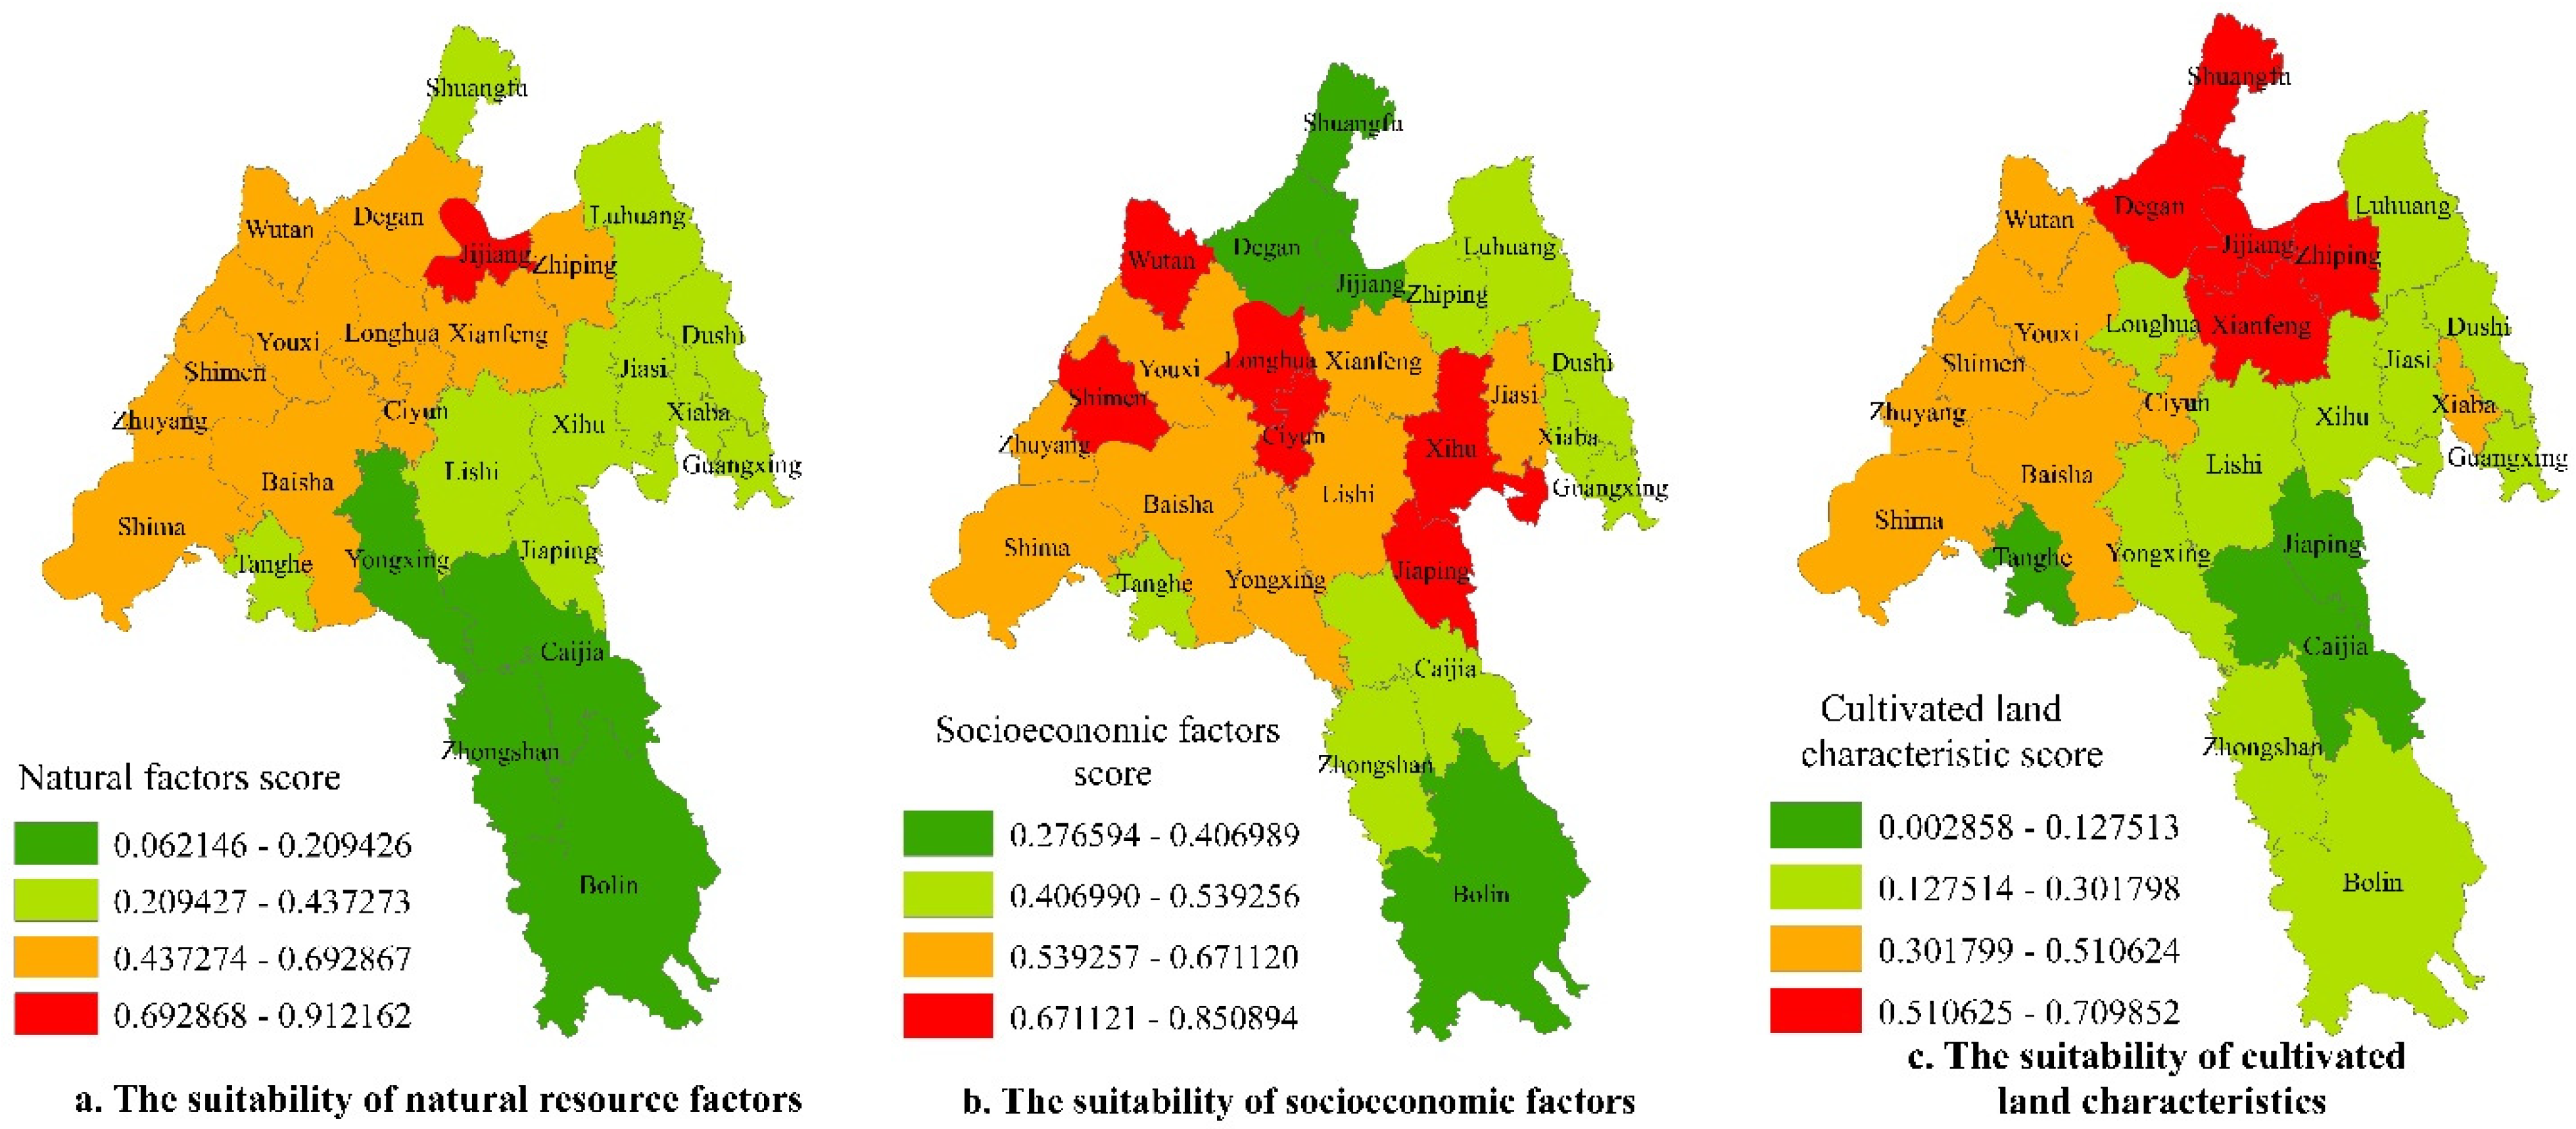
4.1. Single-Factor Evaluation of Suitability for Scale Management
4.2. Comprehensive Evaluation by TOPSIS
4.2.1. Index Weight Analysis
4.2.2. Comprehensive Evaluation of the Index System by TOPSIS
4.3. A Comparison with TOPSIS
4.3.1. The Results of the FCE
4.3.2. Rank Similarity Coefficient
5. Discussion and Conclusions
5.1. Discussion
5.1.1. The Space for Agricultural Production Should Be Coordinated with the Space for Urban Development and That for Ecological Protection
5.1.2. Scale Management of Farmland Should Combine Rural Land Circulation and the Comprehensive Improvement of Farmland
5.2. Conclusions
Author Contributions
Funding
Institutional Review Board Statement
Informed Consent Statement
Data Availability Statement
Conflicts of Interest
References
- Tian, Y.J.; Li, X.B.; Ma, G.X.; Hao, H.G. Influences of labor emigration from agriculture on the production abandonment of cultivated land in ecological sensitive areas. China Land Sci. 2010, 7, 4–9. [Google Scholar]
- Kalogirou, S. Expert systems and GIS: An application of land suitability evaluation. Computers. Environ. Urban Syst. 2002, 26, 89–112. [Google Scholar] [CrossRef]
- Ahamed, T.; Rao, K.G.; Murthy, J. GIS-based fuzzy membership model for crop-land suitability analysis. Agric. Syst. 2000, 63, 75–95. [Google Scholar] [CrossRef]
- Hopkins, L.D. Methods for generating land suitability maps: A comparative evaluation. J. Am. Inst. Plan. 1977, 43, 386–400. [Google Scholar] [CrossRef]
- Wang, F. The use of artificial neural networks in a geographical information system for agricultural land-suitability assessment. Environ. Plan. A 1994, 26, 265–284. [Google Scholar] [CrossRef]
- Bandyopadhyay, S.; Jaiswal, R.K.; Hegde, V.S.; Jayaraman, V. Assessment of land suitability potentials for agriculture using a remote sensing and GIS based approach. Int. J. Remote Sens. 2009, 30, 879–895. [Google Scholar] [CrossRef]
- Zolekar, R.B.; Bhagat, V.S. Multi-criteria land suitability analysis for agriculture in hilly zone: Remote sensing and GIS approach. Comput. Electron. Agric. 2015, 118, 300–321. [Google Scholar] [CrossRef]
- Guo, P.; Zhang, F.; Wang, H.; Qin, F. Suitability evaluation and layout optimization of the spatial distribution of rural residential areas. Sustainability 2020, 12, 2409. [Google Scholar] [CrossRef] [Green Version]
- Steiner, F.; McSherry, L.; Cohen, J. Land suitability analysis for the upper Gila River watershed. Landsc. Urban Plan. 2000, 50, 199–214. [Google Scholar] [CrossRef]
- Palmer, D.; Gottschalg, R.; Betts, T. The future scope of large-scale solar in the UK: Site suitability and target analysis. Renew. Energy 2019, 133, 1136–1146. [Google Scholar] [CrossRef]
- Guo, P.; Zhang, F.; Wang, H.; Qin, F. GIS based land suitability assessment for tobacco production using AHP and fuzzy set in Shandong province of China. Comput. Electron. Agric. 2015, 114, 202–211. [Google Scholar]
- Lara-Estrada, L.; Rasche, L.; Schneider, U.A. Modeling land suitability for Coffea arabica L. in Central America. Environ. Model. Softw. 2017, 95, 196–209. [Google Scholar] [CrossRef]
- Maleki, F.; Kazemi, H.; Siahmarguee, A.; Kamkar, B. Development of a land use suitability model for saffron (Crocus sativus L.) cultivation by multi-criteria evaluation and spatial analysis. Ecol. Eng. 2017, 106, 140–153. [Google Scholar] [CrossRef]
- Joss, B.N.; Hall, R.J.; Sidders, D.M.; Keddy, T.J. Fuzzy-logic modeling of land suitability for hybrid poplar across the Prairie Provinces of Canada. Environ. Monit. Assess. 2008, 2008, 79–96. [Google Scholar] [CrossRef]
- Unglaub, B.; Steinfartz, S.; Kühne, D.; Haas, A.; Schmidt, B.R. The relationships between habitat suitability, population size and body condition in a pond-breeding amphibian. Basic Appl. Ecol. 2018, 27, 20–29. [Google Scholar] [CrossRef]
- Na, X.; Zhou, H.; Zang, S.; Wu, C.; Li, W.; Li, M. Maximum entropy modeling for habitat suitability assessment of Red-crowned crane. Ecol. Indic. 2018, 91, 439–446. [Google Scholar] [CrossRef]
- Li, M.; Zhang, C.; Xu, B.; Xue, Y.; Ren, Y. Evaluating the approaches of habitat suitability modelling for whitespotted conger (Conger myriaster). Fish. Res. 2017, 195, 230–237. [Google Scholar] [CrossRef]
- Yalew, S.G.; van Griensven, A.; Mul, M.L.; van der Zaag, P. Land suitability analysis for agriculture in the Abbay basin using remote sensing, GIS and AHP techniques. Model. Earth Syst. Environ. 2016, 2, 101. [Google Scholar] [CrossRef] [Green Version]
- Zhang, P.; Feng, G. Application of fuzzy comprehensive evaluation to evaluate the effect of water flooding development. J. Pet. Explor. Prod. Technol. 2018, 8, 1455–1463. [Google Scholar] [CrossRef] [Green Version]
- Sałabun, W.; Wątróbski, J.; Shekhovtsov, A. Are MCDA methods benchmarkable? A comparative study of TOPSIS, VIKOR, COPRAS, and PROMETHEE II methods. Symmetry 2020, 12, 1549. [Google Scholar] [CrossRef]
- Shekhovtsov, A.; Sałabun, W. A comparative case study of the VIKOR and TOPSIS rankings similarity. Procedia Comput. Sci. 2020, 176, 3730–3740. [Google Scholar] [CrossRef]
- Fan, S.; Chan-Kang, C. Is small beautiful? Farm size, productivity, and poverty in Asian agriculture. Agric. Econ. 2005, 32, 135–146. [Google Scholar] [CrossRef] [Green Version]
- Rada, N.E.; Fuglie, K.O. New perspectives on farm size and productivity. Food Policy 2018, 84, 147–152. [Google Scholar] [CrossRef]
- Xie, J. Chinese Slope Cultivated Land; China Land Press: Beijing, China, 2008; p. 13. [Google Scholar]
- Chen, P. Effects of normalization on the entropy-based TOPSIS method. Expert Syst. Appl. 2019, 136, 33–41. [Google Scholar] [CrossRef]
- Paradowski, B.; Więckowski, J.; Dobryakova, L. Why TOPSIS does not always give correct results? Procedia Comput. Sci. 2020, 176, 3591–3600. [Google Scholar] [CrossRef]
- Sałabun, W.; Urbaniak, K. A new coefficient of rankings similarity in decision-making problems. In Proceedings of the International Conference on Computational Science, Amsterdam, The Netherlands, 3–5 June 2020; Springer: Cham, Switzerland, 2020. [Google Scholar]
- Pinto da Costa, J.; Soares, C. A weighted rank measure of correlation. Aust. N. Z. J. Stat. 2005, 47, 515–529. [Google Scholar] [CrossRef]
- Gui, J.; Zhanqi, W.; Weisong, L. Suitable evaluation on cultivated land based on fuzzy weights of evidence method in the yarlung zangbo River, Nyangqu River and Lhasa River region. Tibet. J. Nat. Resour. 2014, 29, 1246–1256, (In Chinese with English abstract). [Google Scholar]
- Zhou, K.; Li, J.; Wang, Q. Evaluation on agricultural production space and layout optimization based on resources and environmental carrying capacity: A case study of Fujian Province. Sci. Geogr. Sin. 2021, 41, 280–289, (In Chinese with English abstract). [Google Scholar]
- Feng, T.; Zhang, F.; Li, C.; Qu, Y.; Zhu, F. Spatial distribution of prime farmland based on cultivated land quality comprehensive evaluation at county scale. Trans. Chin. Soc. Agric. Eng. 2014, 30, 200–210, (In Chinese with English abstract). [Google Scholar]
- Zeng, J.; Shao, J.; Wei, C.; Xie, D. Delimitation of permanent basic farmland in mountain and hill areas in southwest China based on multiple-objective decision model. Trans. Chin. Soc. Agric. Eng. 2014, 30, 263–274, (In Chinese with English abstract). [Google Scholar]
- Wu, W.; He, H. A study on a decision-making model of prime farmland based on quality of farmland and location principle: A case study of Dujiangyan city. J. Sichuan Agric. Univ. 2011, 29, 429–436, (In Chinese with English abstract). [Google Scholar]
- Faizi, S.; Rashid, T.; Sałabun, W.; Zafar, S.; Wątróbski, J. Decision Making with Uncertainty Using Hesitant Fuzzy Sets. Int. J. Fuzzy Syst. 2018, 20, 93–103. [Google Scholar] [CrossRef] [Green Version]


| Evaluation Indexes/Unit | Index Description | Positive or Negative Index | |
|---|---|---|---|
| Natural factors (N) | Standard deviation of elevation (N1)/m | The standard deviation of all elevation points in the area. Analysis of DEM data; regional statistics by ArcGIS | – |
| Average slope (N2)/° | The mean value of the slope in the region; the slope map is generated for regional statistics through DEM | – | |
| Water resource density (N3)/% | Surface water area/total area of research area | + | |
| Forest coverage rate (N4)/% orchard land (N5)/% | Forest area/total area of research area Orchard land/total area of research area | − + | |
| Socioeconomic factors (S) | Main road density (S1)/(km/km²) | Main road length/total area of research area | + |
| Secondary road density (S2) (km/km²) | Secondary road length/total area of research area | + | |
| Area proportion of nonagricultural construction land (S3)/% | Nonagricultural construction land/total area of research area | – | |
| Agricultural population density (S4)/persons/km2 | Agricultural population in the research area/total area of research area | – | |
| Proportion of agricultural output value to total output value in the research area (S5) | Output value of agricultural production in the research area/total output value of the research area | + | |
| Characteristics of cultivated land factors (L) | Proportion of cultivated land area in the research area (L1)/% | Cultivated land area/total area of research area | + |
| Proportion of cultivated land area below 15 degrees (L2)/% | Cultivated land area with a slope below 15 degrees/total area of cultivated land in the research area | + | |
| Fragmentation degree of cultivated land (L3)/(piece/km²) | Number of cultivated plots in the research area/total area of research area | – | |
| Name of District | Nri Score | Ranking | Sri Score | Ranking | Lri Score | Ranking |
|---|---|---|---|---|---|---|
| Jijiang | 0.912 | 1 | 0.363 | 24 | 0.710 | 1 |
| Degan | 0.624 | 4 | 0.349 | 25 | 0.653 | 3 |
| Zhiping | 0.693 | 2 | 0.468 | 19 | 0.584 | 4 |
| Shuangfu | 0.437 | 13 | 0.277 | 26 | 0.547 | 5 |
| Youxi | 0.592 | 6 | 0.644 | 9 | 0.455 | 8 |
| Wutan | 0.598 | 5 | 0.709 | 5 | 0.511 | 6 |
| Shimen | 0.514 | 11 | 0.709 | 6 | 0.347 | 13 |
| Zhuyang | 0.551 | 8 | 0.671 | 7 | 0.352 | 11 |
| Shima | 0.529 | 9 | 0.611 | 12 | 0.348 | 12 |
| Yongxing | 0.209 | 23 | 0.617 | 11 | 0.244 | 20 |
| Tanghe | 0.300 | 21 | 0.510 | 18 | 0.128 | 24 |
| Baisha | 0.486 | 12 | 0.581 | 14 | 0.365 | 10 |
| Longhua | 0.647 | 3 | 0.792 | 2 | 0.302 | 14 |
| Lishi | 0.357 | 18 | 0.665 | 8 | 0.213 | 23 |
| Ciyun | 0.520 | 10 | 0.851 | 1 | 0.486 | 7 |
| Caijia | 0.169 | 24 | 0.534 | 16 | 0.104 | 25 |
| Zhongshan | 0.062 | 25 | 0.441 | 22 | 0.259 | 18 |
| Jiaping | 0.257 | 22 | 0.728 | 4 | 0.003 | 26 |
| Boling | 0.062 | 26 | 0.407 | 23 | 0.257 | 19 |
| Xianfeng | 0.574 | 7 | 0.587 | 13 | 0.700 | 2 |
| Luhuang | 0.410 | 15 | 0.448 | 21 | 0.274 | 17 |
| Jiasi | 0.402 | 16 | 0.641 | 10 | 0.300 | 15 |
| Xiaba | 0.398 | 17 | 0.539 | 15 | 0.420 | 9 |
| Xihu | 0.310 | 20 | 0.731 | 3 | 0.224 | 22 |
| Dushi | 0.344 | 19 | 0.518 | 17 | 0.283 | 16 |
| Guangxing | 0.420 | 14 | 0.463 | 20 | 0.243 | 21 |
| Indicators | N1 | N2 | N3 | N4 | N5 | S1 | S2 | S3 | S4 | S5 | L1 | L2 | L3 |
|---|---|---|---|---|---|---|---|---|---|---|---|---|---|
| Index Weight | 0.05 | 0.03 | 0.04 | 0.17 | 0.13 | 0.09 | 0.05 | 0.02 | 0.04 | 0.09 | 0.05 | 0.06 | 0.16 |
| Administrative Division | RI | TOPSIS Ranking | Administrative Division | RI | TOPSIS Ranking |
|---|---|---|---|---|---|
| Jijiang | 0.665 | 1 | Lishi | 0.441 | 16 |
| Degan | 0.546 | 8 | Ciyun | 0.603 | 4 |
| Zhiping | 0.580 | 7 | Caijia | 0.311 | 24 |
| Shuangfu | 0.420 | 18 | Zhongshan | 0.286 | 25 |
| Youxi | 0.581 | 6 | Jiaping | 0.417 | 19 |
| Wutan | 0.611 | 2 | Bolin | 0.273 | 26 |
| Shimen | 0.527 | 10 | Xianfeng | 0.604 | 3 |
| Zhuyang | 0.539 | 9 | Luhuang | 0.413 | 20 |
| Shima | 0.520 | 11 | Jiasi | 0.468 | 14 |
| Yongxing | 0.374 | 22 | Xiaba | 0.472 | 13 |
| Tanghe | 0.355 | 23 | Xihu | 0.444 | 15 |
| Baisha | 0.495 | 12 | Dushi | 0.398 | 21 |
| Longhua | 0.592 | 5 | Guangxing | 0.423 | 17 |
| The Partition of Scale Management Suitability in Jiangjin City | Street (Town) Name | Cultivated Land Area/km² |
|---|---|---|
| Area I 0.580 ≤ ri < 0.665 | Wutan Youxi Longhua Ciyun, Xianfeng, Jijiang, Zhiping | 238.13 |
| Area II 0.495 ≤ ri < 0.580 | Degan, Zhuyang, Shima, Shimen, Baisha | 312.49 |
| Area III 0.374 ≤ ri < 0.495 | Shuangfu, Luhuang, Dushi, Jiasi, Xiaba, Guangxing, Xihu, Jiaping, Lishi, Yongxing | 414.32 |
| Area IV ri < 0.374 | Bolin, Zhongshan Caijia, Tanghe | 182.79 |
| Administrative Division | FCE Score | FCE Ranking | Administrative Division | FCE Score | FCE Ranking |
|---|---|---|---|---|---|
| Jijiang | 0.624 | 1 | Lishi | 0.371 | 24 |
| Degan | 0.522 | 4 | Ciyun | 0.477 | 8 |
| Zhiping | 0.556 | 2 | Caijia | 0.371 | 22 |
| Shuangfu | 0.408 | 14 | Zhongshan | 0.383 | 20 |
| Youxi | 0.477 | 9 | Jiaping | 0.430 | 12 |
| Wutan | 0.486 | 7 | Bolin | 0.371 | 23 |
| Shimen | 0.428 | 13 | Xianfeng | 0.465 | 10 |
| Zhuyang | 0.493 | 6 | Luhuang | 0.397 | 17 |
| Shima | 0.529 | 3 | Jiasi | 0.407 | 15 |
| Yongxing | 0.394 | 19 | Xiaba | 0.403 | 16 |
| Tanghe | 0.339 | 26 | Xihu | 0.395 | 18 |
| Baisha | 0.458 | 11 | Dushi | 0.381 | 21 |
| Longhua | 0.520 | 5 | Guangxing | 0.349 | 25 |
| Administrative Division | TOPSIS Ranks | FCE Ranks | Administrative Division | TOPSIS Ranks | FCE Ranks |
|---|---|---|---|---|---|
| Jijiang | 1 | 1 | Lishi | 16 | 24 |
| Degan | 8 | 4 | Ciyun | 4 | 8 |
| Zhiping | 7 | 2 | Caijia | 24 | 22 |
| Shuangfu | 18 | 14 | Zhongshan | 25 | 20 |
| Youxi | 6 | 9 | Jiaping | 19 | 12 |
| Wutan | 2 | 7 | Bolin | 26 | 23 |
| Shimen | 10 | 13 | Xianfeng | 3 | 10 |
| Zhuyang | 9 | 6 | Luhuang | 20 | 17 |
| Shima | 11 | 3 | Jiasi | 14 | 15 |
| Yongxing | 22 | 19 | Xiaba | 13 | 16 |
| Tanghe | 23 | 26 | Xihu | 15 | 18 |
| Baisha | 12 | 11 | Dushi | 21 | 21 |
| Longhua | 5 | 5 | Guangxing | 17 | 25 |
| Correlation Coefficients | |
|---|---|
| 0.831 | |
| 0.887 | |
Publisher’s Note: MDPI stays neutral with regard to jurisdictional claims in published maps and institutional affiliations. |
© 2021 by the authors. Licensee MDPI, Basel, Switzerland. This article is an open access article distributed under the terms and conditions of the Creative Commons Attribution (CC BY) license (https://creativecommons.org/licenses/by/4.0/).
Share and Cite
Cao, X.; Wei, C.; Xie, D. Evaluation of Scale Management Suitability Based on the Entropy-TOPSIS Method. Land 2021, 10, 416. https://doi.org/10.3390/land10040416
Cao X, Wei C, Xie D. Evaluation of Scale Management Suitability Based on the Entropy-TOPSIS Method. Land. 2021; 10(4):416. https://doi.org/10.3390/land10040416
Chicago/Turabian StyleCao, Xiaoteng, Chaofu Wei, and Deti Xie. 2021. "Evaluation of Scale Management Suitability Based on the Entropy-TOPSIS Method" Land 10, no. 4: 416. https://doi.org/10.3390/land10040416
APA StyleCao, X., Wei, C., & Xie, D. (2021). Evaluation of Scale Management Suitability Based on the Entropy-TOPSIS Method. Land, 10(4), 416. https://doi.org/10.3390/land10040416


