Article

Land-Use Modes of the Dike–Pond System in the Pearl River Delta of China and Implications for Rural Revitalization

1
College of Natural Resources and Environment, South China Agricultural University, Guangzhou 510642, China
2
Key Laboratory of Construction Land Transformation, Ministry of Natural Resources, Guangzhou 510642, China
3
Guangdong Province Engineering Research Center for Land Information Technology, Guangzhou 510642, China
4
School of Geography Sciences, Guangzhou University, Guangzhou 510006, China
5
Jiangsu Center for Collaborative Innovation in Geographical Information Resource Development and Application, Nanjing 210023, China
6
School of Geography, Nanjing Normal University, Nanjing 210023, China
7
State Key Laboratory of Resources and Environmental Information System, Institute of Geographic Sciences and Natural Resources Research, Chinese Academy of Sciences, Beijing 100101, China
8
Department of Geography, University of Wisconsin-Madison, Madison, WI 53706, USA
9
South China Academy of Natural Resources Science and Technology, Guangzhou 510630, China
10
Guangdong Province Key Laboratory for Land Use and Consolidation, Guangzhou 510642, China
*
Author to whom correspondence should be addressed.
Land 2021, 10(5), 455; https://doi.org/10.3390/land10050455
Submission received: 15 March 2021 / Revised: 15 April 2021 / Accepted: 21 April 2021 / Published: 23 April 2021
(This article belongs to the Section Land Socio-Economic and Political Issues)

Abstract

:
Rural revitalization is a global problem. The measures should be adjusted to local conditions to make targeted efforts. Natural and socioeconomic resource factors should be considered in rural revitalization. Therefore, this study focuses on the dike–pond system, which is an important traditional agricultural cultural heritage in the Pearl River Delta of China, to illustrate the importance of identifying the utilization mode of a certain land-use type in village integrated with socioeconomic factors to promote rural revitalization. The study used principal component analysis (PCA) and the variance inflation factor (VIF) to identify the main factors influencing the land-use modes of the dike–pond systems, systematic cluster analysis to identify the modes, and interpretive structural modeling to clarify the influence relationships and structures of the factors. We found that the seven modes reflected the different characteristics, organizational structures, and interaction relationships of the factors. There were significant differences in the ecological processes between the seven modes. More detailed village planning should be performed. Strengthening the economic affordability of the operator should be regarded as important in policy guidance and support measures. Agricultural support measures need to be adjusted to different land-use type systems, and localized resources should be revitalized by the theory of “human–earth–sphere”.

1. Introduction

Ongoing global urbanization accompanied by substantial rural population outflow has resulted in a shortage of labor resources, recession, and social degradation in rural areas. For example, although China is the most dynamic economic region globally, China’s rural population decline rate was 47% between 1960 and 2015, the second-highest among the BRICS countries [1]. The practice of rural revitalization of developed countries provides guidance for determining the key factors of rural development in developing countries, such as the “one village one product” strategy in Japan that focuses on the development of characteristic products [2,3], urban agriculture development aimed at efficient production of scarce agricultural resources in Singapore [4], and the Saemaul Movement of South Korea focused on “diligence, self-help, and cooperation” [5,6]. However, no country can fully apply foreign rural development strategies.
Studies on rural reconstruction, urban–rural integration development, land consolidation, rural village renewal and planning, and key factors of rural revitalization have explained the relationship between land use influencing factors, such as ecological resources, policy guidance, support measures, industry, labor, technology, business entities, active social participation, heritage conservation, and rural revitalization [7,8,9,10,11,12,13,14,15,16,17]. Regulations of the components of natural resource systems and socioeconomic resource systems are required in the process of land use to achieve revitalization of rural ecology, industry, talent, culture, and organization (Figure 1). Practical applications have demonstrated the positive effects of regulating some of these factors on rural revitalization [11].
In 2020, all rural poor people in China were lifted out of poverty, contributing to more than 70% of the world’s poverty reduction [18,19]. However, rural population outflow, and environmental degradation still exist in rural areas. Rural development has entered a stage of comprehensive transformation. The 19th National Congress of the Communist Party of China put forward the “Rural Revitalization Strategy”, focusing on solving the fundamental problems of agriculture, rural areas, and farmers, which are vital to the national economy and people’s livelihoods. This strategy focuses on improving rural areas to secure a decisive victory in developing a moderately prosperous society and comprehensively developing socialist modernization [20,21]. Rural revitalization needs to adjust the measures to local conditions and make targeted efforts. For this reason, some studies have divided the villages into different areas and proposed suggestions to promote rural revitalization [22,23,24] or perform village planning [17]. However, there is a lack of identification of the utilization mode of a certain land-use type in villages to promote rural revitalization.
The Pearl River Delta of China has seen rapid economic growth; however, some problems still exist in rural areas, such as the destruction of the ecological environment and the gradual disappearance of traditional culture. The traditional dike–pond system, a special land use type in rural areas of China, Thailand, Indonesia and other countries [25], is the manifestation of cultural wisdom and is developed by transforming and utilizing low-lying waterlogged land by working people in the Pearl River Delta since ancient times. Plants are grown on the dikes and supply food for fish and shrimp raised in ponds. The plants and agricultural waste are used as fodder. The pond water and mud are used to irrigate and fertilize the plants grown on the dikes, respectively (Figure 2). The dike–pond system represents a complex interacting ecological system. Thus the traditional dike–pond system is regarded as a crucial aspect of sustainable agriculture since it represents a harmonious structure, mutualism, benign circulation, and is highly effective. The dike–pond system not only provides ecological resources and an environment for living creatures, but it is also used by people to produce various agricultural products and provide cultural and spiritual benefits for human beings. Therefore, this system is regarded as an important traditional agricultural cultural heritage in the Pearl River Delta in modern times. However, due to socioeconomic development and unreasonable utilization, the traditional agricultural cultural heritage is on the verge of disappearing. The identification of the existing land-use mode of the dike–pond system is conducive to the protection, inheritance, and development of the traditional agricultural cultural heritage and ultimately promotes rural revitalization.
Existing research on the identification of the land-use modes of the dike–pond systems has primarily focused on two aspects. The first aspect is the classification of the dike–pond utilization forms with respect to dike–pond utilization and transformation. For example, Sinha et al. used hydrogeomorphology to classify the land use to represent the characteristics of the dike–pond system indirectly [26]. Min et al. classified the dike–pond system as a subtype of the integrated farming systems in wetland ecosystems [27]. Liu classified the land use of the dike–pond systems in Nanhai using grading and a continuous classification method [28]. The second aspect is the identification of the land-use modes of the dike–pond systems based on analyzing the internal components of the system and their interaction. For example, Edwards identified the dike–pond systems of Indonesia, Philippines, Malawi, Thailand, and China as crop–livestock–fish integrated farming systems based on the interactions of the components in subsystems [25]. Zhong categorized the types of dike–pond systems in the Pearl River Delta based on differences in the composition and transformation of natural resources [29]. Luo identified the mulberry dike–fishpond systems in the Pearl River Delta as complex modes based on biological organization hierarchy [30]. These studies revealed that dike–pond systems have the characteristics of natural factors. However, dike–pond systems are complex and artificial ecological agricultural systems that are influenced by natural and socioeconomic factors, which, in turn, affect the system in a feedback mechanism. However, previous studies only considered the influences and interactions of the natural factors on the land-use modes of the dike–pond systems, and the effects of socioeconomic factors were not included. If the farmers’ needs for income are ignored in the governance of the dike–pond systems, the policies and mechanisms of rural revitalization are not in line with the farmers’ utilization of the dike–pond systems, resulting in low rural revitalization efficiency.
Therefore, the purpose of this research is to identify the land-use mode of the dike–pond system integrated with socioeconomic factors of the Pearl River Delta of China and propose implications for rural revitalization. We investigate the dike–pond systems of the Pearl River Delta of China. Field investigations and questionnaire surveys are used, and natural and socioeconomic factors are combined to determine the land-use modes of the dike–pond systems and the organizational structure and influence relationships among the controlling factors. In addition, we focus on the implications of rural revitalization. The primary research steps include the following: (1) the factors that have important influences on the land-use modes of the dike–pond systems are extracted using principal component analysis (PCA) and the variance inflation factor (VIF). (2) A systematic cluster analysis method is used to identify the land-use modes of the dike–pond systems in the Pearl River Delta. (3) The organizational structure and influence relationships among the main controlling factors in the dike–pond systems are determined using interpretive structural modeling (ISM). The research results are analyzed, and suggestions are provided.

2. Materials and Methods
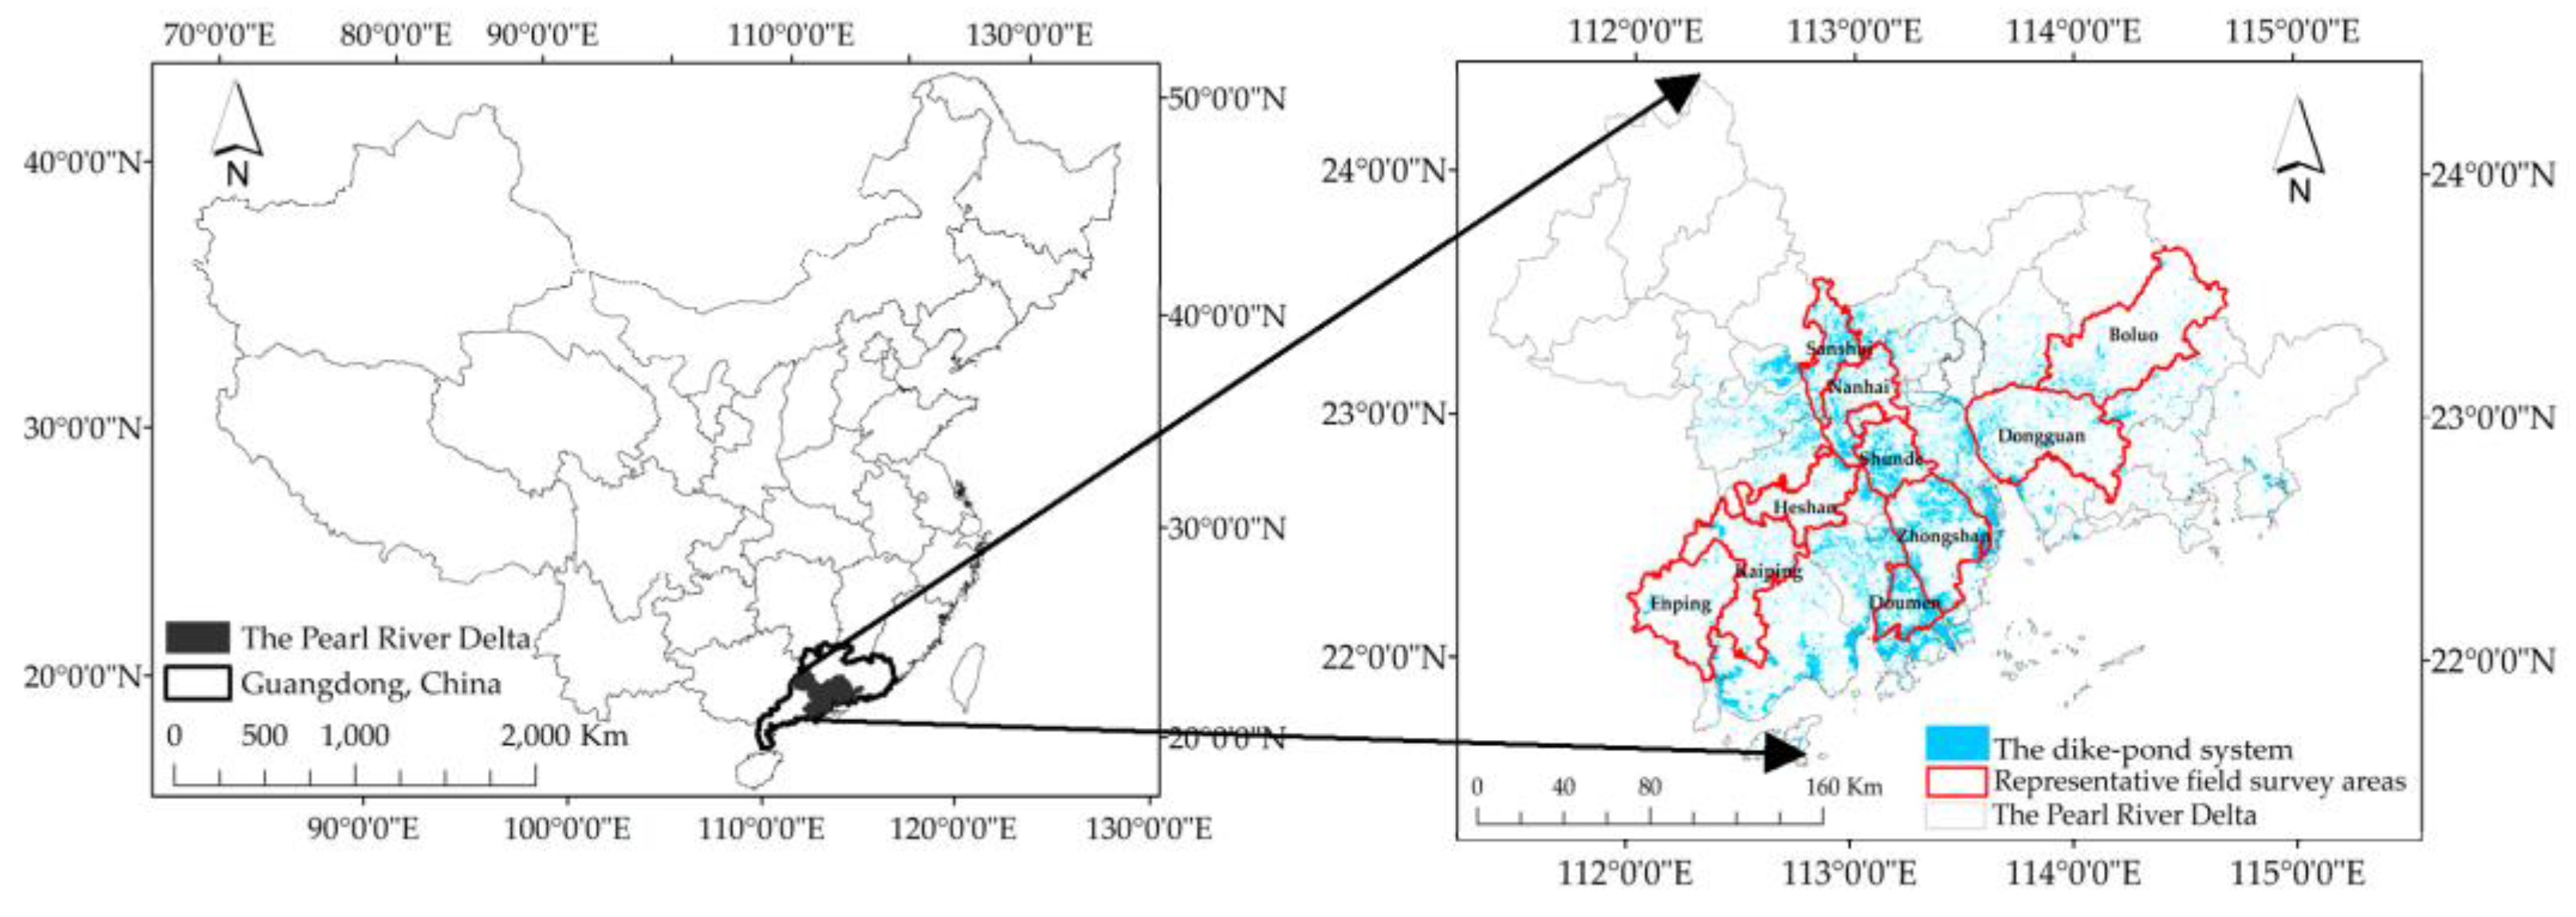
2.1. Study Area

The Pearl River Delta is located in south-central Guangdong province in China and covers 53,600 km2 (21°30′–24°20′ N, 111°22′–115°22′ E). The area has a subtropical oceanic monsoon climate, with an average annual temperature of 21.4–22.4 °C and average annual precipitation of 1600–2300 mm, providing favorable conditions for agricultural production. As an important engine of the national economy, rural urbanization and industrialization have occurred in this region, decreasing the economic gap between urban and rural areas in the Pearl River Delta. In 2018, the GDP of the region reached RMB 8.10 thousand billion (approximately USD 1.16 thousand billion), accounting for 9.00% of the country’s annual GDP. The per capita disposable income of the permanent rural residents accounts for 47.60% of all permanent residents. The output value of agriculture, forestry, animal husbandry, and fishery was RMB 0.22 thousand billion (approximately USD 0.03 thousand billion), and the output value of the primary industry accounted for only 1.50% of all industries. The dike–pond system is the primary agricultural system in rural areas of the Pearl River Delta. Dike–pond systems are widely distributed in the Pearl River Delta, with a total area of 399,604.23 ha, accounting for 7.30% of the land area in the Pearl River Delta (Figure 3). The rational utilization of the dike–pond systems is crucial for the sustainable development of rural resources in the Pearl River Delta.

2.2. Data Sources

Elevation affects land-use type due to differences in climate and water resources [31]. Soil texture is a physical soil property that affects the water holding and aeration characteristics of soil [32]. This, different crops are typically planted in different soils to maximize more agricultural production. Therefore, elevation and soil texture (Appendix A Table A1) were chosen as natural influencing factors. According to the literature [31], field investigations, and questionnaire surveys, 12 socioeconomic factors (Appendix A Table A1) were selected. The vector data of the average elevation and soil texture were obtained from the database of dike–pond systems in the Pearl River Delta in 2014 and the database of the land use status of Guangdong Province in 2017. This information was provided by the Department of Natural Resources of Guangdong Province. In addition, data on the socioeconomic factors were obtained from the questionnaire surveys. According to the regional differences in the distribution of different dike–pond systems and the levels of agricultural development in the Pearl River Delta [33], the relatively advanced development zone in the middle and east of the Pearl River Delta (represented by Sanshui, Doumen, and Zhongshan), the relatively underdeveloped zone in the southwest and east of the Pearl River Delta (represented by Enping, Heshan, Kaiping, Dongguan, and Boluo), and the medium development zone in the middle of the Pearl River Delta (represented by Nanhai and Shunde) were selected for the field investigations and questionnaire surveys (Figure 3).
Field investigations and questionnaire surveys were conducted from November 2018 to January 2019 and from August to September 2019. The targets of the questionnaire surveys were peasant households, enterprises located in the area of the dike–pond systems, and local government organizations to obtain answers from different people and organizations. Business data was obtained from peasant households and enterprises and included information on the construction scale, input, and output. More comprehensive questions were asked of government personnel responsible for the implementation of the policy systems. The number of questionnaires was ≥30 for each zone to meet the lower limit of the statistical significance of the data. A total of 92 valid questionnaires were obtained. The results from the field investigations and questionnaire surveys represent part of the information on the land use of the dike–pond systems in the study area. The land-use modes of the dike–pond systems considered in this study do not represent the frequency of occurrence of land-use modes of the dike–pond systems.

2.3. The Identification Methods of the Land-Use Modes of the Dike–Pond Systems

2.3.1. Screening of the Primary Factors Influencing the Land-Use Modes of the Dike–Pond Systems

The natural and socioeconomic factors were extracted using PCA and VIF to determine the factors with an important influence on the land-use modes of the dike–pond systems. These factors constitute the “main controlling factors” of different land-use modes of the dike–pond systems. PCA is used to transform the original correlated factors into a new set of unrelated factors, namely principal components, by linear transformation. The steps of PCA are as follows [34]:
(1) We established the initial factor matrix   X = x i j n × p , where n and p are the number of samples and factors, respectively; i = 1, 2…, n; j = 1, 2…, p.
(2) We normalized the index data using Equation (1). The normalized matrix Z i j = x i j n × p was obtained.
x i j = x i j x ijmin x ijmax x ijmin
where x i j is the value of the j-th factor of the i-th sample,   x i j is the normalized value of x i j ,   x ijmin is the lowest value of the j-th factor of the i-th sample, and   x ijmax is the highest value of the j-th factor of the i-th sample.
(3) We used the Kaiser–Meyer–Olkin (KMO) test (Equations (2)–(4)) and Bartlett test (Equations (5) and (6)) on the standardized data to verify that the sample data were suitable for PCA [35]:
ρ j , p j = i = 1 n x i j x ¯ i j * x i p j x ¯ i p j i = 1 n x i j x ¯ i j 2 * i = 1 n x i p j x ¯ i p j 2
s = ρ j p j , h = ρ j , p j ρ j , h ρ p j , h 1 ρ j , h 2 1 ρ p j , h 2
K M O = j p ρ j , p j 2 j p ρ j , p j 2 + j p s 2
where ρ j , p j is the complex correlation coefficient obtained from the regression of the independent variable   x i p j i = 1 ,   2 , n ,   j = 1 ,   2 , p on all other independent variables   x i . x ¯ represents the mean value. s is the partial correlation coefficient. h( 2 h p ) is the fixed variable. When the KMO value is greater than 0.6, the data are suitable for PCA.
The Bartlett test was used to test whether the correlation coefficient matrix (R) is an identity matrix. The theory of the test is as follows [36]:
K 2 ( p 2 p ) 2 = n 1 2 p + 5 6 ln R
W = K 1 a 2 p 2 p 2
The null hypothesis ( H 0 ) is made that R is the identity matrix. If H 0 is true, the K 2 has an approximate chi-square distribution with degree of freedom. Degree of freedom is calculated by   p 2 p 2 . a is the significance level. The larger the value of the chi-square statistic, the stronger the correlation between the indicators is. If K 2 is higher than W and p-value, the probability of H 0 , is less than a (0.05), H 0 is rejected.
(4) We calculated the correlation coefficient matrix   R = r j k p × p ; r j k was calculated using Equation (7), where k = 1, 2…, p.
  r j k = i = 1 n Z i j × Z i k n 1
(5) We calculated the characteristic root   λ x of the characteristic equation (Equation (8)) of the correlation coefficient matrix R:
R λ x I = 0
where I is the identity matrix.   λ x = λ 1 ,   λ 2 λ p . The characteristic root is the variance of the principal component. According to each eigenvalue, the corresponding unit eigenvector T l is obtained by Equation (9):
R λ x I T l = 0
where T l = t l 1 , t l 2 t l p , l = 1, 2…, p. The normalized variables were transformed into principal components using Equation (10):
F l = t l 1 × Z 1 + t l 2 × Z 2 + + t l p × Z p
where the index   F l is the l-th primary component.
(6) We determined the number of principal components according to the variance contribution rate c using Equation (11). If c is higher than 70% [37], the number of principal components m is determined:
c = j = 1 m λ j j = 1 p λ j
(7) We screened the factors. The square root of the eigenvalue of each principal component was multiplied by the eigenvector corresponding to the eigenvalue. The factor loading matrix was obtained. The principal components had subfactors with different loadings; the subfactors with loadings whose absolute value was greater than 0.6 [38] were retained. However, correlated factors may exist in each principal component. Therefore, VIF was used to determine the multicollinearity of the factors using Equations (12) and (13):
VIF = 1 1 R j , p j 2
R j , p j 2 = i = 1 n x i j x ¯ i j * x i p j x ¯ i p j 2 i = 1 n x i j x ¯ i j 2 * i = 1 n x i p j x ¯ i p j 2
where R j , p j 2 is the square of the complex correlation coefficient. Empirical analysis indicates no multicollinearity when 0 < VIF < 10, strong multicollinearity when 10 ≤ VIF < 100, and very strong multicollinearity when VIF ≥ 100 [39].
The applicability of the factors obtained from PCA and VIF was assessed by determining the information contribution rate using Equation (14) [40]. The results indicate if the condition is satisfied that most of the original information is contained in a relatively small number of factors.
N = t r S S t r S h  
where N is the information contribution rate, t r S S is the sum of the variance of the screened factors, and t r S h is the sum of the variance of the original factors.

2.3.2. Mode Identification

Cluster analysis was used to classify and merge the “main controlling factors” and classify the land-use modes of the dike–pond systems. Initially, each of the N samples was considered one category, and the distances among the categories or samples were equal. We selected the group with the smallest distance and merged it into a new category. Then, the distances between the new category and the other categories were calculated, and the two categories with the closest distance were merged. This process was repeated until all the samples were merged into a category. The number of categories of the land use modes of the dike–pond systems was determined flexibly [41]. The steps are as follows [42]:
The first step was to normalize the index data using Equation (15).
x i h = x i h μ σ
where   x i h ( i = 1, 2, 3.... n ; h = 1 ,   2 ,   3 m )   denotes the original data of the h -th index of the i -th sample, μ is the mean value of the index data, σ is the standard deviation of the index data, and x i h   denotes the normalized data.
The second step was to calculate the clustering statistics and use the square of the Euclidean distance (Equation (16)) to determine the distance d i j between the i -th sample and the j -th sample and create the distance matrix.
d i j = [ a = 1 m x i a x j a 2 ] 1 2  
In the third step, Ward clustering (Equation (17)) was used to combine the two categories with the least increase in the sum of the squared deviations until all samples were classified into one category.
D k r 2 = n k + n p n r + n k D k p 2 + n k + n q n r + n k D k q 2 n k n r + n k D p q 2
where D is the distance between different categories. When each sample is of one type, D = d i j . n k , n r , n p ,   n q are the number of samples in categories G k , G r , G P , G q , where G r is the combined category of G p and G q , and G k is an arbitrary category.
The fourth step was to determine the number of categories and the samples in each category.

2.4. Structural Analysis of the Modes

Interpretive structural modeling (ISM) was first proposed by Warfield in 1973 to analyse numerous and chaotic factors in a system to determine relatively clear influence relationships and the organizational structure of the system [43]. ISM was used to analyze the factors in Table 1 to determine the structure and influence relationships among the factors of the land-use modes of the dike–pond systems and create graphs of the organizational structure. The steps are as follows:
The first step was to create directed graphs. Suppose a system consists of N factors, and the influence relationships among these factors can be represented by directed lines or directed graphs. When the factor Si has an effect on Sj, we connect the factor Si with Sj by a straight line, with an arrow pointing at Sj, thus creating a directed graph.
The second step was to establish the adjacency matrix. According to the directed graph, the adjacency matrix A is used to represent the existence (1) or nonexistence (0) of the influence relationships among the factors in the system quantitatively.
The third step was to calculate the reachability matrix M of the system. The square of the sum of the adjacency matrix A and the unit matrix I was calculated by using the Boolean rules (0 + 0 = 0, 0 + 1 = 1, 1 + 1 = 1, 0 * 0 = 0, 0 * 1 = 0, 1 * 1 = 1). The reachability matrix M is determined until the conditions are met, i.e., (A + I) (A + I)2 ≠ …≠ (A + I)m−1 = (A + I)m = M (m = 1, 2,….) [43]. The reachability matrix M indicates the existence of direct or indirect influence relationships among the factors [44].
The fourth step was to analyze the reachability matrix. The sets were defined as (1) the reachability set R   S i   = { S j   | M i j = 1 } ; (2) the antecedent set Q S i = { S j   | M   j i = 1 } , and (3) the commonality set C S i   = R S i   Q S i     ( 0 < i ,   j < N ) , where Sij is the i-th row and j-th column factor of M. If R S i   = R S i   Q S i   , R(Si) is the set of factors of the top level. Then the row and column related to the factors of R(Si) were removed from the reachability matrix M. Then, we repeated the same steps to obtain the factor set of the next level. In this manner, the other levels and their corresponding factors were obtained. Finally, the structural model with the factors of all levels was created. The relationships among the factors were expressed by the reachability matrix [43].

3. Structure of the Land-Use Modes of the Dike–Pond Systems

3.1. Land Use Modes of the Dike–Pond Systems and Their Characteristics

The methods in Section 2.3 were used to extract the main controlling factors. The test value of KMO was 0.64. The p-value of the Bartlett test was less than 0.05. The cumulative contribution rate of the principal components was 74.36%. The four principal components had subfactors with different loadings; the subfactors with loadings whose absolute value was greater than 0.6 were retained. Thus, the factors describing the soil texture and level of satisfaction with the infrastructure were deleted. Then, VIF was used to remove the labor resource input factor. Finally, 11 factors were obtained. Approximately 100% of the original information was replaced by 78.57% of the original factors. The main controlling factors are listed in Table 1.
The elevation range of the survey sites was −8~149 m. A 20 m interval was used for the first division of the land-use modes of the dike–pond systems using cluster analysis in the eight groups of the main controlling factors [45]. For convenience, the land use areas of the dike–pond systems were divided into low-elevation areas (elevation ≤ 10 m) and high-elevation areas (elevation > 10 m). According to the naming convention of the “Functional Dominant Type of Business Industry”, the land-use modes of the dike–pond systems in the Pearl River Delta were classified into five categories: the aquaculture economic mode, the ecological breeding mode, the combination of planting and aquaculture mode, the high-standard ecological agriculture mode, and the humanistic agricultural mode.
The land-use modes were proposed for guiding the future use of rural resources. The land rent was used for the further division because it reflects the quality of the natural resources, the geographical location, and the supply and demand [46]. According to the per capita consumption level of rural residents (RMB 30.76 thousand, approximately USD 4.69 thousand) in 2018 and the views of the operators in the questionnaire survey, the area was categorized into the traditional (<RMB 30.76 thousand) and modern (≥USD 30.76 thousand) dike–pond agricultural development zones. Finally, the land-use modes of the dike–pond systems in the Pearl River Delta were classified into seven categories (Table 2): the aquaculture economic mode in the traditional dike–pond agricultural development zone (Mode 1), the ecological breeding mode in the traditional dike–pond agricultural development zone (Mode 2), the aquaculture economic mode in the modern dike–pond agricultural development zone (Mode 3), the ecological breeding mode in the modern dike–pond agricultural development zone (Mode 4), the combination of planting and aquaculture mode in the modern dike–pond agricultural development zone (Mode 5), the high-standard ecological agriculture mode in the modern dike–pond agricultural development zone (Mode 6), and the humanistic agricultural mode in the modern dike–pond agricultural development zone (Mode 7).
The average values of the main controlling factors in each mode were used to represent the modes’ characteristics; the details are summarized in Table 2. The following was observed:
(1) The dike–pond systems with different land-use modes are located in low-elevation and/or high-elevation areas, and the construction scales are mostly small-scale and/or large scale. The ratios of the dike to pond area range from 2:8 to 5:5. Mode 2 has the largest variety of ratios, followed by Modes 3 and 4. The remaining modes have only one ratio type.
(2) There is considerable diversity in the plants, animals, and cultured aquatic products in the ponds in the dike–pond systems. In Modes 1–3, the dikes were planted with few vegetables, and in Modes 2 and 3, they were planted with few fruits and/or trees. Various fruits and trees were planted in Mode 6. In Modes 2 and 6, Pennisetum purpureum Schum was planted, banana trees were planted in Mode 5, and mulberries in Mode 7. No planting occurred in Modes 1–4. Therefore, in contrast to the traditional mulberry dike–fishpond, the modern dike–pond systems included vegetable dike–fishpond, fruit and/or tree dike–fishpond, grass dike–fishpond, banana dike–fishpond, mulberry dike–fishpond, and pure fish pond. Regarding the livestock and poultry on the dikes, ducks or geese were common in Modes 2 and 4, pigs in Mode 6, and few chickens and/or ducks or no animals in Modes 1, 3, 5, and 7. Therefore, the modern division of the dike–pond systems includes duck (goose) dike–fishpond, pig dike–fishpond, and pure fish pond. For cultured aquatic products in the ponds, Modes 1 and 3 included high-value and high-yield fish or shrimp, and the remaining modes mainly included the four major Chinese carps, tilapia, and dace.
Regarding different industry types, Mode 1 mainly focused on aquaculture, supplemented by livestock and poultry breeding, and planting. The main focus of Mode 2 was livestock and poultry breeding and aquaculture, supplemented by the planting industry. Mode 3 mainly focused on aquaculture, supplemented by planting, livestock and poultry breeding, and the catering service industry. Mode 5 mainly focused on planting and aquaculture, supplemented by livestock and poultry breeding. Livestock and poultry breeding and aquaculture were predominant in Mode 4. The dominant industries in Mode 6 were planting, livestock and poultry breeding, aquaculture, processing, and afforestation, whereas those of Mode 7 were planting, aquaculture, processing, catering services, sightseeing, leisure, and tourism, as well as popular science education. The operators were different in different modes. Modes 1–3 were dominated by peasant households, while there were few enterprises. Peasant household or enterprises were common in Mode 5, and peasant households were dominant in Mode 4. Mode 6 was dominated by enterprises, and Mode 7 had a combination of government and enterprises.
In addition, the rent levels of the modes were significantly different. Those of Modes 1 and 2 were relatively low. Modes 3–6 were medium. Mode 7 was the highest.
(3) Regarding the technical level of operations, Mode 4 was weak, and the other modes were strong or general. In terms of the level of perfection of the policies and the system, Mode 4 was level 2, whereas the rest were above level 3. Modes 1, 2, 5, and 6 were all level 3, and Modes 3 and 7 were levels 4 and 5, respectively.

3.2. Organizational Structure and Influence Relationships of the Main Controlling Factors of the Land-Use Modes of the Dike–Pond Systems

The main controlling factors were defined as S1~S11 (Table 1). ISM was used to create directional graphs of the factors of the land-use modes of the dike–pond systems (Figure 4). The aquaculture economic mode in the traditional dike–pond agricultural development zone and the aquaculture economic mode in the modern dike–pond agricultural development zone are the same (Figure 4a) in terms of the organizational structure and influence relationships of the main controlling factors. The first and second levels of the main controlling factors include elevation, level of perfection of the policies and the system, and the economic affordability of the operators. The construction scale, average annual rent per hectare of the bare dike–pond system, the industry type, and the technical level of operation represent the third level of the main controlling factors. Aquaculture input per hectare is the fourth level of the main controlling factor. The ratio of the dike to pond area, the cost of growing plants per hectare, and the cost of breeding livestock and poultry per hectare are the fifth level of the main controlling factors.
The following relationships between the main controlling factors were observed. Elevation influences the level of perfection of the policies and the system. The level of perfection of the policies and the system affects the industry type. The industry type has impacts on the construction scale. The construction scale and the economic affordability of the operators influence the average annual rent per hectare of the bare dike–pond system. The construction scale, the ratio of the dike to pond area, the cost of growing plants per hectare, the cost of breeding livestock and poultry per hectare, the aquaculture input per hectare, and the industry type are influenced by the average annual rent per hectare of the bare dike–pond system. The level of perfection of the policies and the system affects the technical level of operation. The ratio of the dike to pond area, the cost of growing plants per hectare, the cost of breeding livestock and poultry per hectare, and the aquaculture input per hectare are influenced by the technical level of operation. The aquaculture input per hectare influences the ratio of the dike to pond area.
The ecological breeding mode in the traditional dike–pond agricultural development zone is the same as the ecological breeding mode in the modern dike–pond agricultural development zone (Figure 4b) in terms of the organizational structure and the influence relationships of the main controlling factors. The grading of the factors and the influence relationships among the factors are different from the aquaculture economic mode in the traditional dike–pond agricultural development zone and the aquaculture economic mode in the modern dike–pond agricultural development zone. The aquaculture input per hectare and the cost of breeding livestock and poultry per hectare are in the fourth level of the main controlling factors. The ratio of the dike to pond area and the cost of growing plants per hectare are at the fifth level of the major controlling factors. The cost of breeding livestock and poultry per hectare and the aquaculture input per hectare influence each other, and both affect the ratio of the dike to pond area.
The grading of the factors and the influence relationships among the factors on the combination of planting and aquaculture mode in the modern dike–pond agricultural development zone (Figure 4c) are different from the ecological breeding mode in the traditional dike–pond agricultural development zone and the ecological breeding mode in the modern dike–pond agricultural development zone. Specifically, the cost of growing plants per hectare and the aquaculture input per hectare are in the fourth level of the main controlling factors. The ratio of the dike to pond area and the cost of breeding livestock and poultry per hectare are at the fifth level of the major controlling factors. The cost of growing plants per hectare and the aquaculture input per hectare are influenced by each other and influence the ratio of the dike to pond area, whereas the cost of breeding livestock and poultry per hectare does not influence the other factors.
The grading of the factors and the influence relationships among the factors on the high-standard ecological agriculture mode in the modern dike–pond agricultural development zone (Figure 4d) are different from the combination of planting and aquaculture mode in the modern dike–pond agricultural development zone. Specifically, the cost of growing plants per hectare, the cost of breeding livestock and poultry per hectare, and the aquaculture input per hectare are in the fourth level of the main controlling factors. The ratio of the dike to pond area is at the fifth level of the major controlling factors. The cost of growing plants per hectare, the cost of breeding livestock and poultry per hectare, and the aquaculture input per hectare are influenced by each other and influence the ratio of the dike to pond area.
The grading of the factors in the humanistic agricultural mode in the modern dike–pond agricultural development zone (Figure 4e) is significantly different from that of the other modes. The elevation, the level of perfection of the policies and the system, and the economic affordability of the operator are in the first and second levels of the main controlling factors. The industry type and the technical level of operation are in the third level of the main controlling factors. The cost of growing plants per hectare and the aquaculture input per hectare are in the fourth level of the main controlling factors. The construction scale, the ratio of the dike to pond area, the cost of breeding livestock and poultry per hectare, and the average annual rent per hectare of the bare dike–pond system are in the fifth level of the main controlling factors.
The elevation affects the level of perfection of the policies and the system, the level of perfection of the policies and the system affects the industry type, and the industry type influences the construction scale. The construction scale and the average annual rent per hectare of the bare dike–pond system influence each other. The construction scale, the average annual rent per hectare of the bare dike–pond system, the ratio of the dike to pond area, the cost of growing plants per hectare, the cost of breeding livestock and poultry per hectare, the aquaculture input per hectare, and the industry type are influenced by the economic affordability of the operator. The level of perfection of the policies and the system affects the technical level of operation. The cost of growing plants per hectare, the aquaculture input per hectare and the ratio of the dike to pond area are influenced by the technical level of the operation. The cost of growing plants per hectare and the aquaculture input per hectare are influenced by each other and affect the ratio of the dike to pond area. The ratio of the dike to pond area and the cost of breeding livestock and poultry per hectare do not influence the other factors.

4. Discussion

4.1. Village Planning

Some governments, including those in the United Kingdom, United States, and Germany, have focused on establishing bottom-up and tiered rural revitalization planning [47,48,49]. For example, the success of village renewal planning in Germany is attributed to the detailed investigation and evaluation of resources and the systematic planning of village development. The same resource is used differently according to the village conditions [17]. This study shows that (Figure 4) the identification of the utilization mode of the land-use type in villages can guide and support village planning. Different land-use modes are suitable for the same land-use type and reflect the different characteristics, organizational structures, and interaction relationships of the factors. In other words, there are differences in the order of the control measures. According to Liu [21], the spatial arrangement and the differences in the rural regional system have to be identified first. The rural regional system refers to a spatial system characterized by a “point-field-area-network”. It consists of the interactions of human culture, the economy, resources, and the environment and is a multibody system composed of urban–rural integration, complex rural areas (different subsystems), village–town organisms, and housing–industry symbiosis. Therefore, village planning should be performed at the village scale, focus on the discrimination of “points” within the village, and divide the land-use types into different subpoints (subtypes) to allocate land resource elements more efficiently, such as Mode 7, where the sequence of the factor control is different from that of the other modes. In addition, it is necessary to establish an indicator system and assessment methods to identify the differences among different land-use type systems to promote detailed village planning.

4.2. Strengthen the Economic Affordability of the Operator

Many international studies have focused on the revitalization of rural areas, but few have ranked the importance of different regulatory measures. This study shows that for certain natural resources, it is not appropriate to focus only on policy guidance and support measures because they lack strong economic affordability of the operator. The economic affordability of the operator is as important as policy guidance and support measures (Figure 4). The population outflow into America’s suburbs rather than into remote villages illustrates the lack of village committees or cooperatives that can organize poor farmers to achieve modernization, intensification, and efficient utilization of rural resources, despite policy guidance and support measures [1]. The types of operators are diversified, and they are not only independent farmers. The economic affordability of the operator can be improved by promoting various forms of cooperation and alliance, including a joint-stock cooperative with internal shares and external rent, a joint-stock cooperative with a village committee as its unit, and a joint-stock cooperative or enterprise formed by peasant households organized by the village committee [50]. For example, the construction scales of Modes 6 and 7 are very large, and there are many different industry types due to local reforms of the rural collective property rights joint-stock system. Rural joint-stock cooperatives were established, and the farmers’ land contract and management rights were converted into shares for quantification. Through public bidding, the cooperatives collect rents and sign lease contracts to lease dike–pond resources to individuals in their own or outside villages, as well as to enterprises and government + enterprises. Finally, farmers in their own villages share dividends according to their shares.

4.3. Formulate Differentiated Measures to Support Agriculture

The experiences of other countries, for example, India and China, shows that the liberalization of the land transfer market can benefit the rural poor and achieve poverty reduction [51,52]. Large construction scale land-use modes of the dike–pond systems benefited from this. This study shows that the rent level affects the operation of the land transfer market. Many factors affect the land rent level, such as the quality of land resources, scale, policies and systems, agricultural subsidies, and industrial types [51,53]. It has to classify the land-use type for determining how to adjust the rent level to ensure smooth land transfer. Xu contended that there should be fewer land rent subsidies to prevent high rents, which would adversely affect the land transfer market [54]. However, this study shows that the adjustment land rent of Mode 7 should be based on ensuring the benefits of the traditional rural agricultural circular production, which protects the traditional cultural heritage with less stock and without adversely affecting the smooth operation of the land transfer market.

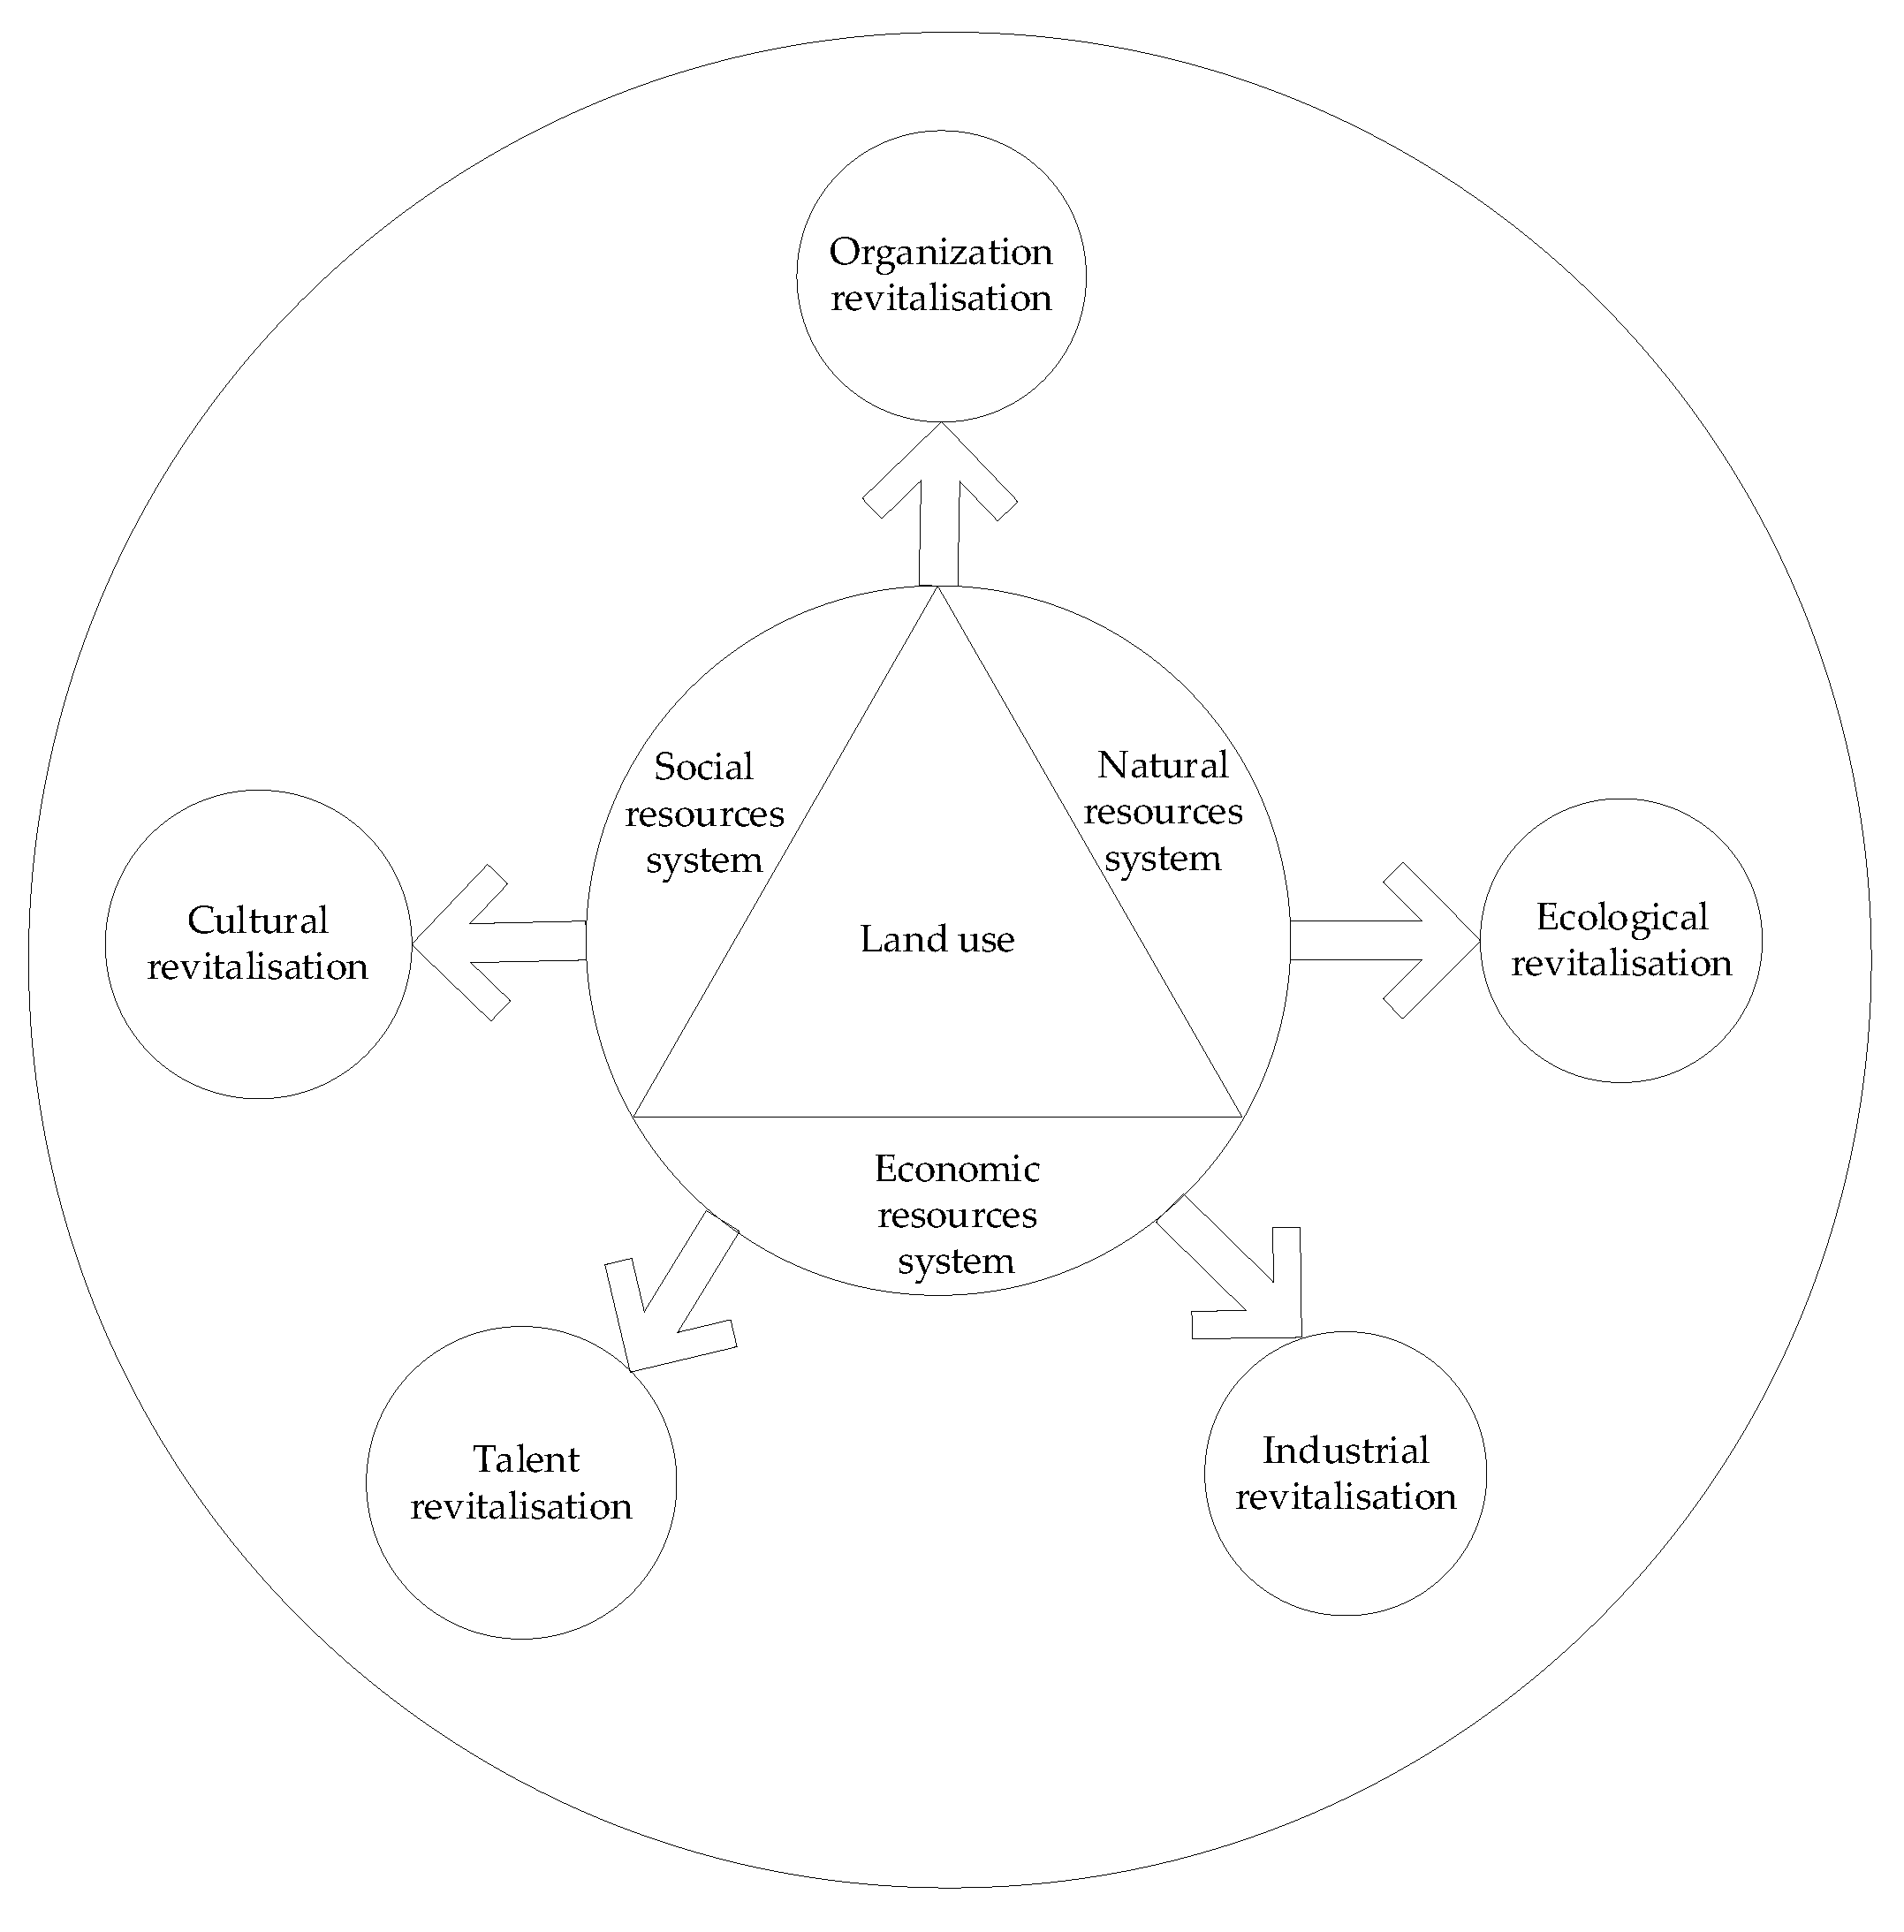
4.4. Revitalize Localized Resources by the Theory of “Human–Earth–Sphere”

The human–earth–sphere refers to a spatial intersection on the surface of the earth, formed by the interaction of biosphere, atmosphere, hydrosphere, lithosphere and pedosphere, which is linked by human development [55]. The theory of “human–earth–sphere” implies that ecological processes do not exist independently in natural systems (Figure 5) and should be included in rural land use planning [56]. The results of this study show that differences in the structures and influence relationships occurred between Modes 1–6 only differed regarding the input of animals and plants (Figure 4). However, there are significant differences in the ecological processes between the seven modes. Some of the operators of Mode 3 (Figure 4a), Mode 6 (Figure 5d), and Mode 7 (Figure 5e) promote material recycling and multistage energy flows by integration with the catering service industry, processing industry, culture, and tourism industry, and others. In the other modes (Figure 5a–c), the relationships between material recycling and energy flows were only observed in the plant, livestock and poultry, and aquatic animal industries. Mode 2, Mode 4 (Figure 5b), and Mode 6 (Figure 5d) utilized biogas digesters to recycle agricultural waste. Different kinds of inputs of aquatic species, livestock and poultry, and plants have different density ranges to maximize benefits, resulting in different ratios of the dike to pond area. Therefore, the spatial patterns of each mode may be different. Different inputs and species of animals and plants results in a difference in material circulations and energy flows directly. Therefore, natural resource conditions, policy guidance, supporting measures, the economic affordability of the operators, construction scales, industrial types, technical levels, and land rent affect the ecological processes. Research on the response mechanisms among natural resources and socioeconomic resources system is the basis for achieving the coupling and sustainable development of the human–earth system. The efficiency of material recycling and energy flow should be improved. The advantages of traditional localized resources should be brought into full play, to achieve high production and ecological and living benefits by emphasising “integrity, coordination, recycling, and regeneration”.

5. Conclusions

Countries worldwide have contributed significantly to rural revitalization. It is critical to adjust measures to local conditions and make targeted efforts. Regulations of the components of natural resource systems and socioeconomic resource systems are required for land-use change to achieve rural revitalization. However, there is a lack of identifying the utilization mode of a certain land-use type in village and the integration with socioeconomic factors to promote rural revitalization.
Seven modes of the dike–pond systems, which are an important traditional agricultural cultural heritage in the Pearl River Delta of China, were identified: the aquaculture economic mode in the traditional dike–pond agricultural development zone (Mode 1), the ecological breeding mode in the traditional dike–pond agricultural development zone (Mode 2), the aquaculture economic mode in the modern dike–pond agricultural development zone (Mode 3), the ecological breeding mode in the modern dike–pond agricultural development zone (Mode 4), the combination of planting and aquaculture mode in the modern dike–pond agricultural development zone (Mode 5), the high-standard ecological agriculture mode in the modern dike–pond agricultural development zone (Mode 6), and the humanistic agricultural mode in the modern dike–pond agricultural development zone (Mode 7). The organizational structure and influence relationships among the main control factors were the same for Modes 1 and 3 and for Modes 2 and 4, whereas those of the other modes were different. There were significant differences in the ecological processes among the seven modes. The results of identifying the utilization modes of a certain land-use type in the villages lead to the following suggestions: (1) The village planning should be detailed. (2) Strengthening the economic affordability of the operator should be regarded as important in policy guidance and support measures. (3) Agricultural support measures should be adjusted to different land-use type systems. (4) The localized resources should be revitalized by the theory of “human–earth–sphere”.
This study had some limitations and weaknesses. On the one hand, the primary selection of the natural and socioeconomic factors was subjective. On the other hand, due to the limitations of capital and human resources, we can only select representative villages with different agricultural development levels according to the guidance of municipal, county and town government departments, and try to cover a wider range of the study area. However, the sample size of the questionnaire survey to obtain data on the socioeconomic factors may have been inadequate to identify all land use modes of the dike–pond systems in the Pearl River Delta region. Therefore, in a future study, we will adjust the main controlling factors and expand the sample size of the questionnaire survey to conduct a more comprehensive analysis of the land use modes of the dike–pond systems and promote rural revitalization.

Author Contributions

Conceptualization, H.L. and L.W.; methodology, H.L. and L.W.; investigation, H.L.; software, H.L.; data curation, H.L.; writing—original draft preparation, H.L.; writing—review and editing, H.L., L.W., J.G. and A.-X.Z.; supervision, H.L., L.W. and Y.H. All authors have read and agreed to the published version of the manuscript.

Funding

This work was financially supported by the National Key R&D Program of China (2018YFD1100103).

Institutional Review Board Statement

Not applicable.

Informed Consent Statement

Not applicable.

Data Availability Statement

Data sharing not applicable.

Conflicts of Interest

The authors declare no conflict of interest.

Appendix A

Table A1. Impact factors of land-use modes of the dike–pond systems.
FactorsSubfactorsUnitThe Meaning or Computing Methods of the Factors
Natural factorsElevationmThe elevation of the center of the dike–pond system.
Soil texture/The soil texture at the center of the dike–pond system ranged from 1 to 7, representing medium clay, light clay, heavy loam, medium loam, light loam, sandy loam, and loose sandy soil.
Socioeconomic factorsConstruction scalehaThe total land use area of the dike–pond system.
Ratio of the dike to pond area/The ratio of the dike area to the aquaculture area in the dike–pond system.
Cost of growing plants per hectareRMBThe cost per unit area of planting seedlings on the dike in the system.
Cost of breeding livestock and poultry per hectareRMBThe main livestock and poultry breeding species in the dike–pond system, including chickens, ducks, geese, and pigs. The calculation is as follows: the cost of livestock and poultry breeding/construction scale of the dike–pond system.
Aquaculture input per hectareNumbersThe maximum appropriate inputs of fish (shrimp) larvae per unit area are different. The inputs of main fish (shrimp) larvae per unit area were also used to represent the type of aquaculture (by species).
Average annual rent per hectare of the bare dike–pondRMBThe average annual rent per hectare for the last five years for the bare dike–pond.
Labor resource inputNumber of peopleThe total number of workers required for land use activities of the dike–pond system.
The economic affordability of the operator/Using the Likert scale, different abilities were classified as very weak (1), weak (2), general (3), strong (4), and very strong (5).
Level of satisfaction with the infrastructure/The facilities important to agricultural production were classified to reflect the people’s degree of satisfaction with the agricultural technical equipment and transportation. Using the Likert scale, the level of satisfaction was classified as very dissatisfied (1), not satisfied (2), basically satisfied (3), relatively satisfied (4), and very satisfied (5).
Industry type/The types of industry involved in the dike–pond system, such as the planting industry, livestock and poultry industry, and aquaculture industry.
Technical level of operation/Planting and breeding techniques were considered. Using the Likert scale, the levels were classified as very weak (1), weak (2), general (3), strong (4), and very strong (5).
Level of perfection of the policies and the system/Using the Likert scale, the levels ranged from 1 to 5. Level 5 represented the perfect level.

References

  1. Liu, Y.S.; Li, Y.H. Revitalize the world’s countryside. Nature 2018, 548, 275–277. [Google Scholar] [CrossRef] [PubMed]
  2. Anh, N.T. One Village One Product (OVOP) in Japan to One Tambon One Product (OTOP) in Thailand: Lessons for Grass Root Development in Developing Countries. J. Soc. Dev. Sci. 2013, 4, 529–537. [Google Scholar] [CrossRef] [Green Version]
  3. Nishizawa, N.; Kabir, M.L. One Village One Product Movement Success Story of Rural Development in Japan and Learning Points for Bangladesh. Econ. Sci. 2005, 52, 71–92. Available online: https://www.researchgate.net/publication/37503598 (accessed on 15 April 2021).
  4. Diehl, J.A.; Sweeney, E.; Wong, B.; Sia, C.S.; Yao, H.; Prabhudesai, M. Feeding cities: Singapore’s approach to land use planning for urban agriculture. Glob. Food Sec. 2020, 26. [Google Scholar] [CrossRef]
  5. Soh, S.; Lee, S.H. Saemaul Movement of the 1970s in the Farmer’s Diaries: Mechanism for Mobilization and Particapation. J. Reg. Stud. 2018, 26, 45–68. [Google Scholar] [CrossRef]
  6. Choi, O. Analysis of Achievements of Saemaul Undong Policy. Korean Assoc. Comp. Gov. 2016, 20, 227–243. [Google Scholar] [CrossRef]
  7. Huang, G.Q. A look at rural ecological revitalization. Chin. J. Eco Agric. 2019, 27, 190–197. [Google Scholar] [CrossRef]
  8. Wang, P.; Qi, M.N.; Liang, Y.J.; Ling, X.B.; Song, Y. Examining the Relationship between Environmentally Friendly Land Use and Rural Revitalization Using a Coupling Analysis: A Case Study of Hainan Province, China. Sustainability 2019, 11, 6266. [Google Scholar] [CrossRef] [Green Version]
  9. Han, J. How to promote rural revitalization via introducing skilled labor, deepening land reform and facilitating investment? China Agric. Econ. Rev. 2020, 12, 577–582. [Google Scholar] [CrossRef]
  10. Zhou, Y.; Li, Y.M.; Xu, C.C. Land consolidation and rural revitalization in China: Mechanisms and paths. Land Use Policy 2020, 91. [Google Scholar] [CrossRef]
  11. Wang, Y.S.; Li, Y.H. Promotion of degraded land consolidation to rural poverty alleviation in the agro-pastoral transition zone of northern China. Land Use Policy 2019, 88, 1–8. [Google Scholar] [CrossRef]
  12. Ma, L.; Long, H.L.; Zhang, Y.N.; Tu, S.S.; Ge, D.Z.; Tu, X.S. Agricultural labor changes and agricultural economic development in China and their implications for rural vitalization. J. Geogr. Sci. 2019, 29, 163–179. [Google Scholar] [CrossRef] [Green Version]
  13. Wu, C.Q.; Zhang, H.P. Reconstruction the Rural Subjectivity by Peasants Organization:the Foundation of Rural Revitalization in the New Era. J. China Agric. Univ. Soc. Sci. 2018, 35, 74–81. [Google Scholar] [CrossRef]
  14. Wu, L.C.; Xie, S.L. The Revitalization of Rural Culture from the Perspective of Cultural Governance:Value Coupling and System Construction. J. Huazhong Agric. Univ. Sci. Ed. 2019, 139, 16–23. [Google Scholar] [CrossRef]
  15. Pijanowski, J.M. Village Renewal as an Important Element of Integrated Rural Development. Barom. Reg. 2016, 14, 165–172. Available online: http://br.wszia.edu.pl/eng/zeszyty/pdfs/br45_17pijanowski.pdf (accessed on 15 April 2021).
  16. Kutkowska, B.; Kalisz, D.E. Implementation of regional policy in rural areas on the example of village renewal in lower silesia competition. Rocz. Nauk. Stowarzyszenia Ekonom. Rol. Agrobiz. 2019, 21, 239–248. [Google Scholar] [CrossRef]
  17. Kim, J.K.; Kim, H.M.; Cho, S.J. A Study on the Principle of Rural Village Planning Process Based on Rural Resources—Focused on Case Study of Two Rural Traditional Theme Villages. J. Korean Soc. Rural Plan. 2004, 10, 29–37. Available online: http://ocean.kisti.re.kr/downfile/volume/ksrp/NCGHBW/2004/v10n4s25/NCGHBW_2004_v10n4s25_29.pdf (accessed on 13 April 2021).
  18. Foster, J.E. Absolute versus Relative Poverty. Am. Econ. Rev. 1998, 88, 335–341. [Google Scholar] [CrossRef]
  19. Wang, Z.Z.; Yang, Z.H. Poor but not trapped: No poverty trap in rural China at Presrnt. J. Hubei Minzu Univ. Soc. Sci. 2021, 39, 118–131. [Google Scholar] [CrossRef]
  20. Liu, Y.S. Research on the urban-rural integration and rural revitalization in the new era in China. Acta Geogr. Sin. 2018, 73, 637–650. [Google Scholar] [CrossRef]
  21. Liu, Y.S. The basic theory and methodology of rural revitalization planning in China. Acta Geogr. Sin. 2020, 75, 1120–1133. [Google Scholar] [CrossRef]
  22. Li, Y.R.; Bu, C.L.; Cao, Z.; Liu, X.H.; Liu, Y.S. Village classification system for rural vitalization strategy: Method and empirical study. J. Nat. Resour. 2020, 35, 243–256. [Google Scholar] [CrossRef]
  23. Liu, Y.; Tang, L.N.; Pan, Y.C. Multifunctional characteristics and revitalization strategies of different types of rural development at village scale. Trans. Chinese Soc. Agric. Eng. 2019, 35, 9–17. [Google Scholar] [CrossRef]
  24. Yu, S.; Wang, Y.X.; Du, Y.Q. Classified Governance: The Strategy of Rural Revitalization Under Heterogeneous Resource Endowment. J. Northwest. A F Univ. Sci. Ed. 2019, 19, 52–60. [Google Scholar] [CrossRef]
  25. Edwards, P.; Pullin, R.; Gartner, J.A. Research and Education for the Development of Integrated Crop-Livestock-Fish Farming Systems in the Tropics; International Center for Living Aquatic Resources Management: Manila, Philippines, 1988; ISBN 971-1022-46-X. [Google Scholar]
  26. Sinha, R.; Saxena, S.; Singh, M. Protocols for riverine wetland mapping and classification using remote sensing and GIS. Curr. Sci. 2017, 112, 1544–1552. [Google Scholar] [CrossRef]
  27. Min, Q.; He, L. Agro-cultural Landscapes in China: Types and Significances. In Biocultural Landscapes; Hong, S.K., Bogaert, J., Min, Q., Eds.; Springer: Berlin, Germany, 2014; ISBN 978-94-017-8940-0. [Google Scholar]
  28. Liu, Y. A Research of Land Use Classification in Developed Regions of China-A case study of Nanhai. Sci. Technol. Manag. Land Resour. 2007. [Google Scholar] [CrossRef]
  29. Zhong, G.F. The types, structure and results of the dike-pond system in South China. Geojournal 1990, 21, 83–89. [Google Scholar] [CrossRef]
  30. Luo, S.M. Fundamental classification of eco-agricultural models. Chin. J. Eco Agric. 2009, 17, 405–409. [Google Scholar] [CrossRef]
  31. Zhang, J.E.; Luo, S.M. Discussion on some basic concepts about agricultural ecosystem studies. Trop. Geogr. 2000, 20, 102–106. [Google Scholar] [CrossRef]
  32. Wu, K.N.; Zhao, R. Soil Texture Classification and ItsApplication in China. Acta Pedol. Sin. 2019, 56, 227–241. [Google Scholar] [CrossRef]
  33. Xu, S.; Huang, W.X. A quantitative analysis of regional differences about urban-rural integration in the Pearl River Delta. Trop. Geogr. 2002, 22, 294–298. [Google Scholar] [CrossRef]
  34. Wan, J.B.; Zeng, H.Y.; Zhu, B.H. Application of Principal Component Analysis in Evaluation of Water Quality of Lean River. China Water Wastewater 2009, 25, 104–108. [Google Scholar] [CrossRef]
  35. Xie, K.; Zhang, J.F. Short-term Wind Speed Forecasting Using PCA-WNN Based on KMO-Bartlett Typical Wind Speed Selection. Power Equip. 2017, 31, 86–91. Available online: http://kns-cnki-net-s.vpn.scau.edu.cn:8118/KXReader/Detail?TIMESTAMP=637548044145361328&DBCODE=CJFD&TABLEName=CJFDLAST2017&FileName=FADI201702004&RESULT=1&SIGN=jBPJ4DmLk3m2Y1A9QNQzZwtfC%2f0%3d# (accessed on 23 April 2021).
  36. Li, H.C.; Jiang, H. SPSS Data Analysis Course; People’s Posts and Telecommunications Press: Beijing, China, 2012; ISBN 978-7-115-26410-7. [Google Scholar]
  37. Jollife, I.T.; Cadima, J. Principal component analysis: A review and recent developments. Philos. Trans. R. Soc. A Math. Phys. Eng. Sci. 2016, 374, 1–16. [Google Scholar] [CrossRef] [PubMed]
  38. Skrbic, B.; Durisic-Mladenovic, N. Principal component analysis for soil contamination with organochlorine compounds. Chemosphere 2007, 68, 2144–2152. [Google Scholar] [CrossRef] [PubMed]
  39. Hu, C.Y. Research and Application of Index System Optimizition of Aging Mine Ventilation Based on Variance Inflation Factor. Master’s Thesis, China University of Mining and Technology, Jiangsu, China, 2016. Available online: http://kns-cnki-net-s.vpn.scau.edu.cn:8118/kcms/detail/detail.aspx?dbcode=CMFD&dbname=CMFD201701&filename=1016910746.nh&v=sXut6GRQhR7MIKnzOCk%25mmd2BPV%25mmd2BTsPuRp2b33%25mmd2Bl7Ew0FFpPyDRmiIr67j%25mmd2Fb2ANLy5XBS (accessed on 23 April 2021).
  40. Zhou, L.B.; Li, G.; Chi, G.T. The Establishment of Human All round Development Evaluation Indicator System Based on R-Cluster and Coefficient of Variation. Syst. Eng. 2010, 28, 56–63. Available online: http://kns-cnki-net-s.vpn.scau.edu.cn:8118/kcms/detail/detail.aspx?dbcode=CJFD&dbname=CJFD2010&filename=GCXT201012009&v=r0Fmkan10Gh9hFnxlbI4123TyGj3Udbod3iD8dmTReCBBp9ebaZOOLuoE%25mmd2BcoOQQs (accessed on 23 April 2021).
  41. Liu, S.B. Research on the System of Watershed Land Use Function Zoning:A Case Study of Liangzi Lake Watershed. Ph.D. Thesis, China University of Geosciences, Wuhan, China, 2013. Available online: https://kns.cnki.net/kcms/detail/detail.aspx?dbcode=CDFD&dbname=CDFD1214&filename=1013352239.nh&v=AxzCyl2Q7bmnTD3ikd%25mmd2FWDRKl%25mmd2FRt4Iaa%25mmd2BHDOczgjMGicHM4Ea7EjLBwozURUOvQ64 (accessed on 2 January 2021).
  42. Zhao, Y. Study on Soil and Water Conservation Regionalization and Function Orientation. Ph.D. Thesis, Beijing Forestry University, Beijing, China, 2013. Available online: https://kns.cnki.net/kcms/detail/detail.aspx?dbcode=CDFD&dbname=CDFD1214&filename=1013214029.nh&v=tS45SqIn6DeaBZaLONqZE2WC4V7169L06oZKSE1zIdQPj4UQnRw3K0ccuJe44GQx (accessed on 2 January 2021).
  43. Zhang, C.; Sun, L.; Wen, F.S.; Lin, Z.Z.; Ledwich, G.; Xue, Y.S. An interpretative structural modeling based network reconfiguration strategy for power systems. Int. J. Electr. Power Energy Syst. 2015, 65, 83–93. [Google Scholar] [CrossRef]
  44. Zhou, J.; Zeng, C.; Ling, W.L. Analysis of algae bloom in Taihu Lake base on interpretative structural modeling. Environ. Pollut. Control. 2009, 31, 20–24. [Google Scholar] [CrossRef]
  45. Hou, M.H.; Liu, H.Y.; Zhang, H.B.; Wang, C.; Tan, Q.M. Influences of topographic features on the distribution and evolution of landscape in the coastal wetland of Yancheng. Acta. Ecol. Sin. 2013, 33, 3765–3773. [Google Scholar] [CrossRef]
  46. Liu, W.B. Mechanism of Rural Land Transfer in China. Ph.D. Thesis, Central South University, Changsha, China, 2013. [Google Scholar] [CrossRef]
  47. Cullingworth, J.B.; Nadin, V. Town and Country Planning in the UK; Routledge: London, UK, 1997; ISBN 0415217741. [Google Scholar]
  48. Richard, E.L.; Roland, R.V. Signs of Progress: A Report on Rural America’s Revitalization Efforts; Department of Agriculture: Washington, DC, USA, 1989.
  49. Teng, H.S.; Bi, Y.L.; Lai, L.L. Exploration on Planning Compilation of Characteristic Protection Villages from Perspective of Village Renewal: A Case Study of Gaozhai Village in Xing’an County, Guangxi. IOP Conf.Seri. Earth Environ. Sci. 2020, 585, 1–7. [Google Scholar] [CrossRef]
  50. Zhang, L.J.; Zhao, J.W. Research on the Modes of Rural Land Shareholding Cooperative System. Rural Econ. 2013, 31, 24–28. Available online: http://kns-cnki-net-s.vpn.scau.edu.cn:8118/kcms/detail/detail.aspx?dbcode=CJFD&dbname=CJFD2013&filename=NCJJ201306004&v=aAE%25mmd2F8PoypF7yGGGByfnqAg2hkr%25mmd2FDnihWx%25mmd2FtYVaiRfAGDvcXNK%25mmd2FHVJGsvMwqaJMvS (accessed on 23 April 2021).
  51. Deininger, K.; Jin, S.; Nagarajan, H.K. Efficiency and equity impacts of rural land rental restrictions: Evidence from India. Eur. Econ. Rev. 2008, 52, 892–918. [Google Scholar] [CrossRef] [Green Version]
  52. Jin, S.Q.; Jayne, T.S. Land Rental Markets in Kenya: Implications for Efficiency, Equity, Household Income, and Poverty. Land Econ. 2013, 89, 246–271. [Google Scholar] [CrossRef]
  53. Wang, Y.H.; Li, X.B.; Xin, L.J.; Tan, M.; Jiang, M. Spatiotemporal changes in Chinese land circulation between 2003 and 2013. J. Geogr. Sci. 2018, 28, 707–724. [Google Scholar] [CrossRef] [Green Version]
  54. Xu, Y.; Li, X.B.; Xin, L.J. Differentiation of scale-farmland transfer rent and its influencing factors in China. Acta. Geogr. Sin. 2021, 76, 753–763. [Google Scholar] [CrossRef]
  55. Liu, Y.S. Modern Human-Earth Relationship and Human-Earth System Science. Sci. Geogr. Sin. 2020, 40, 1221–1234. [Google Scholar] [CrossRef]
  56. Theobald, D.M.; Spies, T.; Kline, J.; Maxwell, B.; Hobbs, N.T.; Dale, V.H. Ecological Support for Rural Land-Use Planning. Ecol. Appl. 2005, 15, 1906–1914. [Google Scholar] [CrossRef]
Figure 1. The framework of the relationship between land use and rural revitalization.
Land 10 00455 g001
Figure 2. The traditional dike–pond system (the mulberry dike–fishpond system).
Land 10 00455 g002
Figure 3. The representative field survey areas in the Pearl River Delta.
Land 10 00455 g003
Figure 4. Organizational structure and influence relationships of the main controlling factors of the land-use modes of the dike–pond systems. Note: (ae) represent the subfigures of Figure 4, and the solid lines with the arrow represent the relationships among the factors in the systems.
Land 10 00455 g004
Figure 5. Relationships between material recycling and energy flow of different land-use modes of the dike–pond systems. Note: (ae) represent the subfigures of Figure 5, and the black solid lines with the arrow line represent the relationships of material transformation between the elements in the systems, and the red solid lines with the arrow and round head represent the relationships of energy flows.
Land 10 00455 g005
Table 1. Main controlling factors of the land-use modes of the dike–pond systems.
FactorsThe Factor NumberThe Subfactors
NaturalS1Elevation
SocioeconomicS2Construction scale
S3Ratio of the dike to pond area
S4Cost of growing plants per hectare
S5Cost of breeding livestock and poultry per hectare
S6Aquaculture input per hectare
S7Average annual rent per hectare of the bare dike–pond
S8The economic affordability of the operator
S9Industry type
S10Technical level of operation
S11Level of perfection of the policies and the system
Table 2. Characteristics of the land-use modes of dike–pond systems.
Main Controlling FactorsTraditional Dike–Pond Agricultural Development ZoneModern Dike–Pond Agricultural Development Zone
Aquaculture economic mode in the traditional dike–pond agricultural development zone (Mode 1)Ecological breeding mode in the traditional dike–pond agricultural development zone (Mode 2)Aquaculture economic mode in the modern dike–pond agricultural development zone (Mode 3)Ecological breeding mode in the modern dike–pond agricultural development zone (Mode 4)The combination of planting and aquaculture mode in the modern dike–pond agricultural development zone (Mode 5)High-standard ecological agriculture mode in the modern dike–pond agricultural development zone (Mode 6)Humanistic agricultural mode in the modern dike–pond agricultural development zone (Mode 7)
ElevationLow-elevation areas and high-elevation areasLow-elevation areas and high-elevation areasLow-elevation areas and high-elevation areasHigh-elevation areasLow-elevation areasHigh-elevation areasLow-elevation areas
Construction scale 1Mostly small-scale, large-scale Mostly small-scale, large-scale Mostly small-scale, large-scale Mostly small-scale, large-scaleLarge-scaleLarge-scaleLarge-scale
Ratio of the dike to pond area 2:82:8, 3:7, 4:62:8, 4:62:8, 3:75:55:54:6
Planting industryFew vegetables or no plantsFew vegetables, few fruits and/or trees, Pennisetum purpureum Schum or no plantsFew vegetables, few fruits and/or trees or no plantsNo plants Banana treesPennisetum purpureum Schum, various fruits and treesMulberries
Livestock and poultry industryFew chickens and/or ducks or noneDucks or geeseFew chickens and/or ducks or noneDucks or geeseFew chickens Pigs None
Aquaculture industryShrimp or high-value and high-yield fishesMostly the four major Chinese carps and tilapiaMostly high-value and high-yield fishes or shrimpThe four major Chinese carps, tilapia, and daceMostly grass carpMostly the four major Chinese carps and tilapiaMostly the four major Chinese carps
Average annual rent per hectare of the bare dike–pondLow (RMB 15428.56), (approximately USD 2376.95)Low (RMB 17590.90), (approximately USD 2710.09)Medium (RMB 71,933.00), (approximately USD 11082.13)Medium (RMB 42,999.98), (approximately USD 6624.66)Medium (RMB 31,499.98), (approximately USD 4852.94)Medium (RMB 30999.99), (USD approximately 4775.84)High (RMB 149999.93), (approximately USD 23109.27)
OperatorsMostly peasant household, enterprisesMostly peasant household, enterprisesMostly peasant household, enterprisesPeasant householdPeasant household or enterprisesEnterpriseGovernment + enterprise
Industry typesMainly focusing on aquaculture industry, supplemented by livestock and poultry breeding and planting industriesMainly focusing on livestock and poultry breeding and aquaculture industries, supplemented by planting industryMainly focusing on aquaculture industry, supplemented by planting, livestock and poultry breeding and catering services industriesLivestock and poultry breeding and aquaculture industriesMainly focusing on planting and aquaculture industries, supplemented by livestock and poultry breeding industriesPlanting, livestock and poultry breeding, aquaculture, processing, afforestation industriesPlanting, aquaculture, processing, catering services, sightseeing leisure tourism and popular science education industries
Technical level of operationGeneralGeneralStrongWeakStrongStrongStrong
Level of perfection of the policies and the systemLevel 3Level 3 Level 4Level 2 Level 3Level 3Level 5
1 In the table, large-scale refers to a land use area of ≥6.67 ha of the dike–pond system, and small-scale refers to <6.67 ha.
Publisher’s Note: MDPI stays neutral with regard to jurisdictional claims in published maps and institutional affiliations.

