Article

To What Extent Are Cattle Ranching Landholders Willing to Restore Ecosystem Services? Constructing a Micro-Scale PES Scheme in Southern Costa Rica

1
Natural Management Resources, Universidad Estatal a Distancia (UNED), San José 474-2050, Costa Rica
2
Consultant in Technology, Strategy and Neuro-Innovation, San José 474-2050, Costa Rica
3
Centro Nacional de Alta Tecnología (CeNAT)-Laboratorio PRIAS, San José 1174-1200, Costa Rica
4
Gestión de Cuencas Hidrográficas, Centro Agronómico Tropical de Investigación y Enseñanza (CATIE), Turrialba 30501, Costa Rica
5
Department of Applied Economics I, Faculty of Social Sciences and Communication, University of the Basque Country (UPV/EHU), Sarriena s/n, 48949 Leioa, Spain
6
HEGOA, Institute for International Cooperation and Development Studies, University of the Basque Country (UPV/EHU), Avda. Lehendakari Agirre, 81, 48015 Bilbao, Spain
7
EKOPOL Research Group, Faculty of Social Sciences and Communication, University of the Basque Country (UPV/EHU), Sarriena s/n, 48940 Leioa, Spain
*
Author to whom correspondence should be addressed.
Land 2021, 10(7), 709; https://doi.org/10.3390/land10070709
Submission received: 1 May 2021 / Revised: 3 June 2021 / Accepted: 4 June 2021 / Published: 5 July 2021
(This article belongs to the Special Issue Ecosystem Services, Sustainable Rural Development and Protected Areas)

Abstract

:
Deforestation and the unsustainable management of agricultural and livestock production systems in tropical mountain areas have caused fragmented and degraded landscapes. Payment for ecosystem services (PES) could be an effective policy instrument with which to reduce deforestation and restore disturbed ecosystems. The national-scale PES program in Costa Rica is recognized as being successful; however, its financial resources have been mostly dedicated to forest protection, and much less to reforestation projects. This paper aims to construct a micro-scale PES scheme by using primary data generated through spatial modeling and socio-economic and stated preference surveys (choice experiment) in southern Costa Rica. The results suggest that, on average, landholders would agree to implement restoration projects on their own private pasturelands if an appropriate holistic place-based approach was applied encompassing biophysical, social, economic, and institutional aspects. Willingness-to-accept values allow payments to be linked to cattle farmers’ estimates of specific ecosystem services (ES) and land opportunity costs. The economic valuation of three ESs (erosion control, water availability, and biodiversity) allows construction of a layered payment scheme, which could encourage the development of a potential partnership between national and local institutions and NGOs as alternative buyers of ESs, reduce transaction costs, and improve household well-being.

1. Introduction

Agriculture and livestock systems undoubtedly play a key role in supporting human well-being and livelihoods. However, anthropogenic pressure and associated land degradation result in a loss of biodiversity and a reduction in the variety and level of ecosystem services (ESs) [1,2,3,4]. Regarding mountain ecosystems, empirical research suggests that deforestation and forest degradation lead to depleted soil infiltration rates and water infiltration capacity [5]. The shift in the frequency distribution of erosion rates depends on the degree of human disturbance of the native vegetation [6,7], and the number of large floods increases strongly with accelerated deforestation [8,9,10,11]. Although in general terms the expansion of farmland has increased the value of some essential provisioning ESs and provided some economic benefits [12], it has also significantly affected human well-being [2,3,12], particularly in terms of the impact on land degradation [13]. This effect has been especially intense in tropical countries [14].
Restoration efforts aim at recovering the original characteristics of an ecosystem that was previously degraded, damaged, or destroyed by human intervention. It was suggested in [15] that ecological restoration increases biodiversity levels by an average of 44%. Empirical research demonstrates a significantly increasing trend in the ecosystem carbon sequestration service [16,17,18], erosion and flood control services [5,9,10,19,20], and landscape forest connectivity [21]. Restoration programs, followed by sustainable land-use management, can improve, both the provisioning of services, and people’s well-being [2,3,15]. However, these multiple restoration goals can also diverge and conflict [3].
Restoration goals, strategies, and actions should be approached carefully, considering site-specific environmental conditions as a means for generating the expected ecological synergies. Furthermore, restoration strategies face the complex challenge of increasing the provisioning of services, such as food production, for an expanding population [22], while simultaneously conserving or enhancing biodiversity and other types of ES [2,23]. Science-based experience in some large-scale restoration projects (e.g., the Atlantic Forest Restoration Pact in Brazil) revealed that a successful restoration strategy needs to have a bottom-up decision-making approach, involving a range of stakeholders, including landowners, smallholders, nongovernment organizations, local government leaders, and indigenous and community groups [2,24,25,26].
To address all of these targets, restoration actions need the support of financial incentives, and most reforestation projects have shown net benefits, in both developed and developing countries [18,27,28]. Nonetheless, in broader terms, the efficiency of conservation and economic outcomes, often using cost-effectiveness as a proxy, should never outweigh the social equity dimensions and non-market value [29,30,31]. Ultimately, such financial incentives are usually instrumentalized in a subsidy-like approach, which means conditional cash payments aiming to compensate for the possible costs of alternative environmental land-use stewardship. These incentive mechanisms are conceptualized as payments for ecosystem services (PES) around the world. Even though they can show a wide range of specific characteristics, PES schemes have two fundamental attributes: voluntariness and additionality.
Unlike traditional command-and-control environmental policies, PES programs represent a novel paradigm by introducing a voluntary approach. Additionality in this context is commonly defined as the measured outcome of a policy or project, in addition to what might have occurred in the absence of a PES scheme [32]. However, this concept has been mostly applied in strictly environmental terms as “the net impact of the biophysical provision of ecosystem services, in comparison with the baseline scenario or hypothetical situation where the PES scheme is not in place” [33]. According to [34], environmental additionality is positively influenced by three factors: spatial targeting, payment differentiation, and strong conditionality.
Accepting the existence of a polarized academic discussion surrounding efficiency versus equity, this debate has accomplished an expansion of the capabilities, dimensions, and limits of Wunder’s pioneering conceptualization of PES [35]. Therefore, other attributes such as economic fairness and personal well-being should be taken into account. For example, given a compensation criterion approach, payments should compensate landholders for lost benefits related to the provision of environmental services and be differentiated according to the cost of such provision. Their willingness to accept (WTA) compensation for the services they provide is largely determined by the degree to which their livelihood depends on the land covered by the program. This, in turn, affects the opportunity cost of supplying the services. In addition, WTA is also a function of the potential on-farm benefits derived from the promoted land use change [33].
The pioneering nationwide PES program in Costa Rica is mostly recognized with regard to the conservation of remaining forests. In fact, from its inception in 1997 until 2018, almost 90% of the land covered was for strict forest protection (over one million hectares), while payments for reforestation were received for about 70,000 hectares [36]. Several studies have evaluated the impact of the program on reducing deforestation rates [37,38,39], on the effects on poverty and equity [40,41,42], and on the overall efficiency [42,43,44]. However, there is little scientific evidence about the preference of landholders for enrolling in a PES arrangement for reforestation purposes on their own property. There is also scarce information about the links between payments, land opportunity costs, and landholders’ economic valuation of ES.
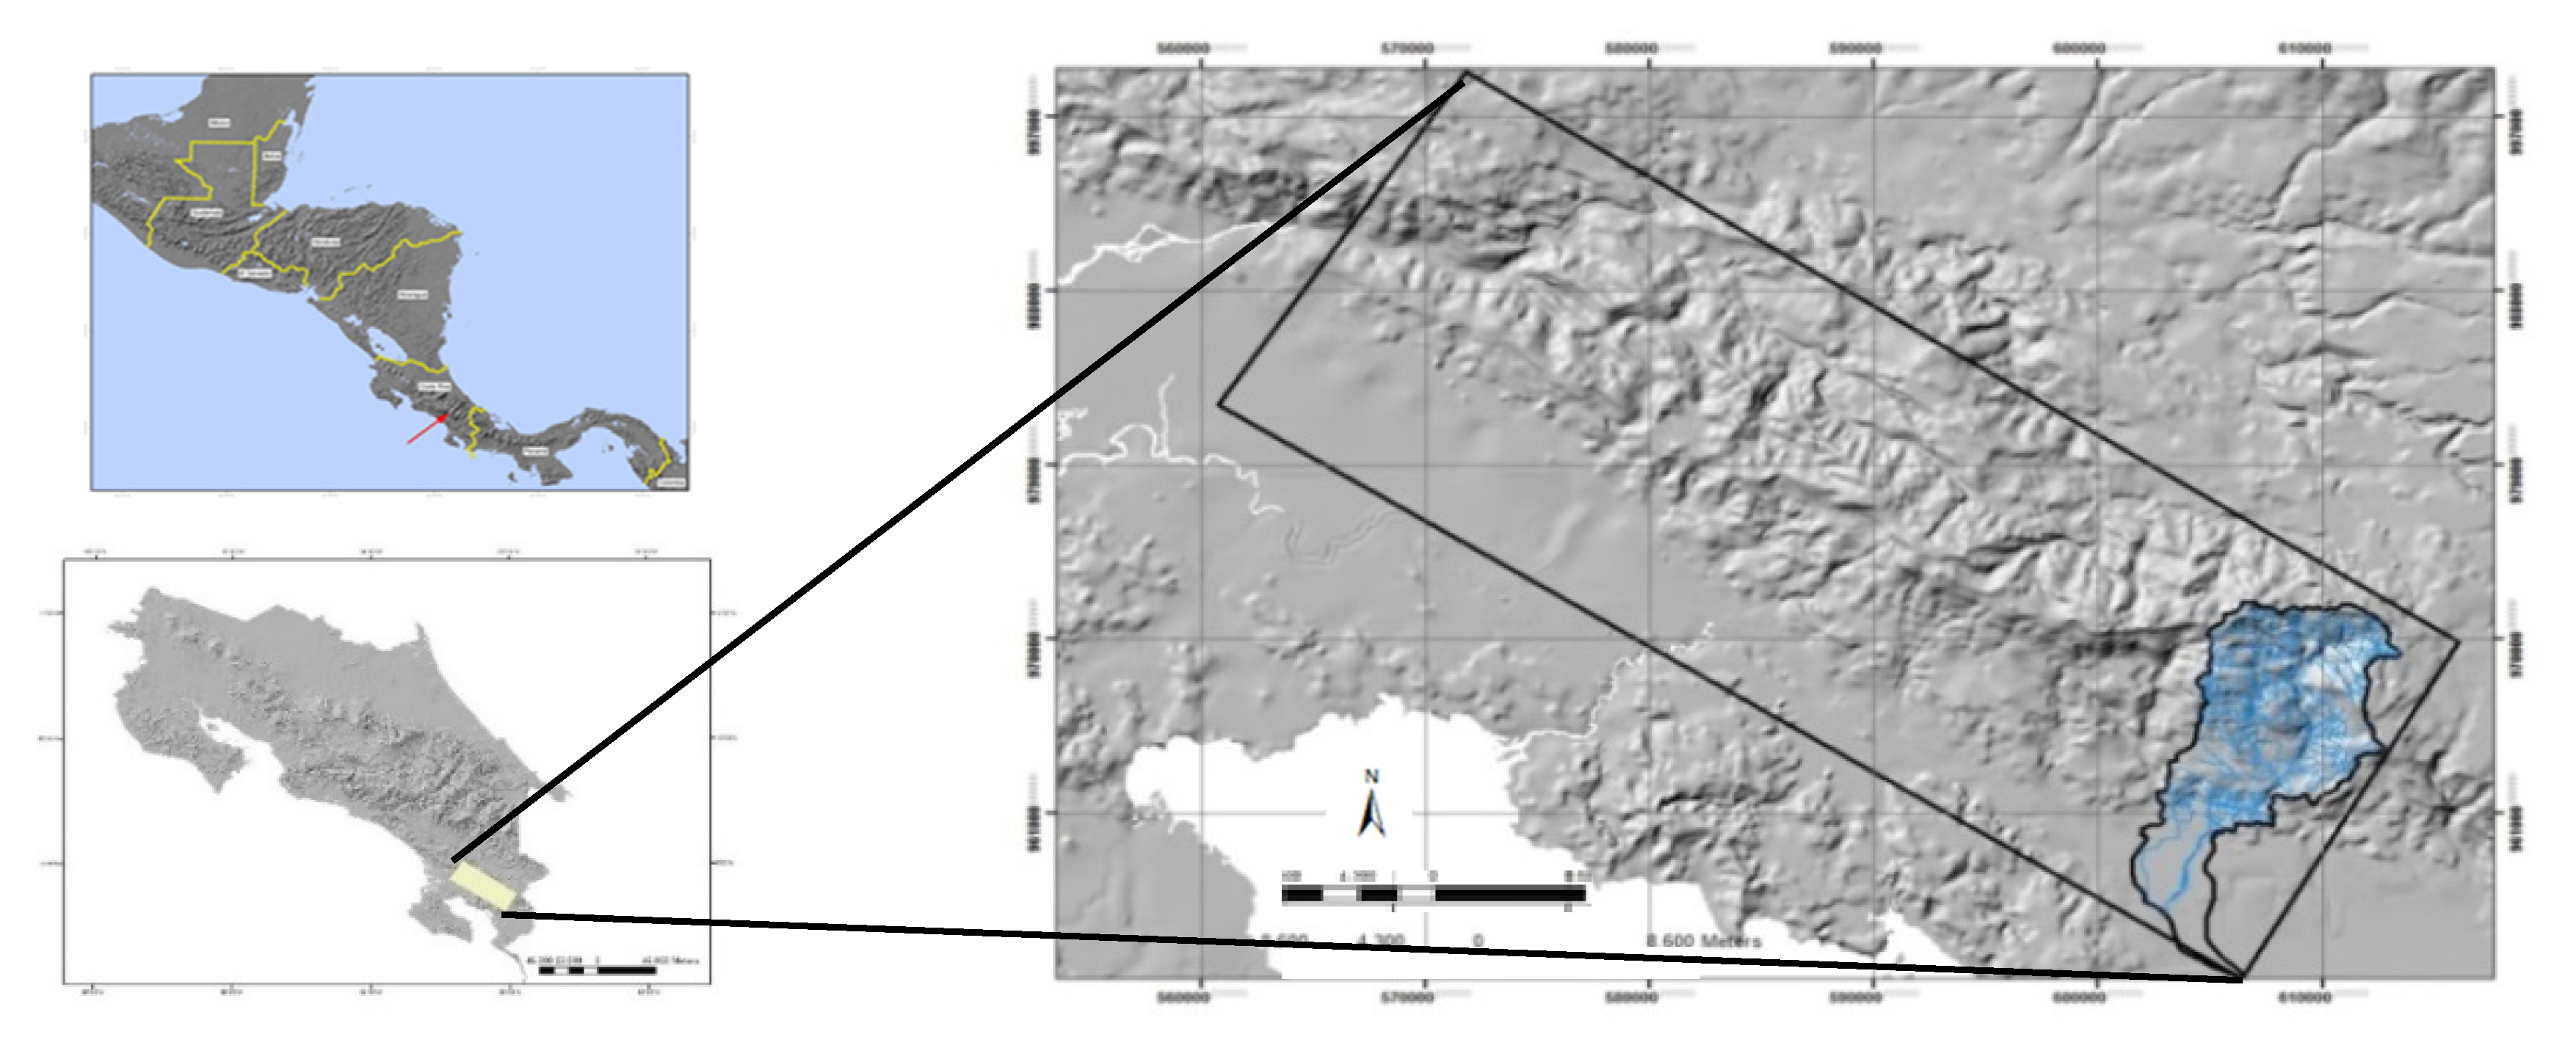
In this study, a micro-scale PES scheme is assessed with the support of a GIS-based spatial dataset in the Claro River sub-watershed (southern Costa Rica). Discrete choice modeling was carried out to elicit the preferences of landholders at the site regarding alternative restoration options, giving several ESs as attributes in the choice set. Choice experiments (CEs) are often used to examine human-induced changes in an ecosystem, represented by a set of attributes for which people can establish their preferences [45]. Closely related to this study, CEs have been applied as a method to investigate the preferences of farmers for participating in environmental incentive-based mechanisms in developing countries [46,47,48,49,50,51,52,53]. Most of them focused on analyzing the factors that can influence potential enrolment in hypothetical PES contracts, and just a few include the perception of the benefits of ecosystem services [49,52]. Unlike other studies, ours includes a place-based approach that complements the economic analysis from a micro-scale perspective.
This research was aimed at investigating some of the main shortcomings of the national PES program in Costa Rica reported by researchers and scholars, in terms of the lack of a spatial targeting approach, landholder WTA, and opportunity cost data. Specifically, this paper tries to respond to four questions: (1) Are landholders in the Claro River sub-watershed willing to implement reforestation projects by reducing cattle grazing pasture areas? (2) What is the minimum level of willingness to accept compensating payment to join a hypothetical PES program? (3) To what extent do current payments for reforestation reflect current land opportunity costs? (4) Could the estimated landholders’ marginal economic valuation of determined ES could be endogenized into a micro-scale PES scheme?

2. An Overview of the Nationwide PES Program in Costa Rica

Costa-Rica’s national-scale PES program emerged in 1995 from a convergence of various factors that led to the 1995 Forestry Law reform, which entailed a necessary increased level of restrictions on legal tree extraction. The program bundles together the provision of four main ESs: carbon sequestration, biodiversity protection, water regulation, and landscape beauty. It provides direct cash payments to private landowners for different types of five-year contracts: forest protection, reforestation, sustainable forest management, and agroforestry [42]. The National Forestry Fund (FONAFIFO) is the institutional mediator responsible for administrating the PES program. This mediating role can be described as the process by which the beneficiaries of the program give their acquired rights to the ES to FONAFIFO, which then sells them to potential buyers [54].
The program continues to be one of the most advanced in terms of experimentation in governance [55]; however, its environmental effects have often been questioned. Empirical studies suggest it has a minimal impact on reducing deforestation rates [37,38,39]. With respect to the socio-economic outcomes, apart from indigenous territories, most of the payments are captured by relatively wealthy landowners [41,56]. According to [40], there is no evidence of improvements in tangible household well-being, and it also does not appear to have benefited participants in terms of better means of living. The program does not have an explicit social component, despite it being a government-led initiative [36].
With respect to the policy criterion of conditionality, FONAFIFO established a pragmatic approach, where the extension of forest land is used as a proxy for ES [42]. Furthermore, and beyond the relative or even minimal impact on reducing deforestation rates, the outcome of the program in terms of additionality would require constructing a baseline dataset and conducting a systematic modeling analysis in the absence of a program for each PES contract. It was noted in [57] that a PES may result in more additionality if it is properly reoriented towards enhancing landscape restoration.
Additionality is positively influenced by spatial targeting; therefore, a land-use approach would allow FONAFIFO to allocate the optimal resources in order to prioritize and maximize the spatial provision of ES. Several studies [57,58,59] strongly recommend using a landscape approach, along with socio-economic and ecological indicators, for a more intensive and adequate assumption of an additionality principle in the national policy priorities. Moreover, the key factor for ensuring that a PES scheme is effective relies on the extent of the alignment of payments received by landholders with the additional enhancement of ES over the status quo scenario [60].
The decision on final levels of payments to be provided by nationwide public programs is usually arbitrary and will inevitably be influenced by administrative resolutions based on the available budget [42]; in fact, actual payments for reforestation still reflect levels prior to the program’s introduction, and payments for forest protection were initially established on the then current renting price of pastureland. Current incentives are based approximately on national averages of the opportunity costs of forgone cattle pasture [58]. However, in theoretical terms, the payment level should reflect two important factors: (1) the estimated value of the ES provided by the forest, and (2) the opportunity cost for the landowner associated with participating.
Another debated subject highlighted by scholars regarding the Costa Rican PES scheme is the strong dependence on fixed payments [55,57,59], regardless of the spatial variability in the provision of environmental services or the cost of the required management practices to different landholders [54]. The method of accounting is determined by bundling the four officially selected ESs (carbon sequestration, landscape beauty, biodiversity conservation, and water protection). In this way, each piece of land, regardless of its particular ES value, receives a fixed payment. More recently, payment levels for forest protection have introduced differentiation for areas that are hydrologic hotspots. In addition, the reforestation category distinguishes four modalities: reforestation with fast-growing species, medium-growing species, native species, and natural regeneration. As an alternative to bundling, the layering of ecosystem services refers to separating payments for each site-specific ES to be provided in a packaged scheme [61].
There are also significant shortcomings in the PES design, and several improvements have been suggested, focusing on the development of differentiated payments that would reflect different opportunity costs. Considering that this type of design might be technically difficult, auctions have been encouraged [59] as a means of revealing opportunity costs [42], although implementing them would necessarily be costly. Another alternative for revealing opportunity costs, as well as eliciting landholders’ preference for enrolment and level of WTA, is through a CE approach.
In addition, the diverse range of factors promoting or preventing landowner participation in the PES program have also been examined. According to [62], the Costa Rican case illustrates that participation is led by landowners and is greatly influenced by their capacity to cover transaction, legal, and information costs, and to satisfy land tenure requirements. However, one of the stricter institutional requirements of FONAFIFO, which limits access to enrolment in the program, is the lack of legal property titles among smaller landholders [42]. It was found in [63] that a combination of poor environmental conditions for agriculture and the opportunity cost calculus of landowners drives the decision to enroll in the program.
One more important constraint, often highlighted in theoretical and empirical studies, is the high transaction costs. PES contracts commonly incur two types of transaction costs: (1) those assumed by FONAFIFO that might discourage, even by legal means, the participation of smallholders [43]; and (2) those inevitably assumed by the eventual beneficiaries, which will necessarily affect their initial interest in participating in the program [64]. The costs assumed by beneficiaries are the greatest barrier to participation by the most vulnerable in developing countries [64,65,66]. Transaction costs include all expenses for contract establishment and maintenance (e.g., travel expenses, information gathering, the design of a management plan, and external monitoring). According to [67], estimates of transaction costs borne by participants vary from 12 to 18% of the total payments.
Beyond the national program, there are two remarkable experiences with local PESs in Costa Rica. On the one hand, the Heredia watershed payment scheme, managed by an ad hoc public enterprise and partially funded by a private corporation, provides payments to landowners to avoid land degradation of the area upstream of the watershed, where water sources are located. Although this scheme incorporates an explicit place-based approach, focusing on the provision of hydrological services within a watershed, it fails in not taking an additionality approach or adding other types of ES [68]. On the other hand, the RISEMP project scheme, sponsored by the World Bank and the Global Environment Facility (GEF) and coordinated by the Center for Tropical Agriculture, Research and Education (CATIE), facilitates payments to livestock producers conditioned on the adoption of silvopastoral practices. This project succeeds in at least two aspects: (1) it introduces a differentiated payment scheme reflecting differences in the intensity of silvopastoral efforts, and (2) it layers two ESs (biodiversity and carbon sequestration) [69,70].

3. Materials and Methods

3.1. Description of the Study Area

The study area is the Claro River sub-watershed, located in the Fila Cruces mountain range (8°40′–8°47′30″ N and 82°57′30″–83°4′30″ W) in southern Costa Rica (Figure 1). The area has a humid tropical climate, with mean annual precipitation of 4000–6000 mm. Its altitude lies between 60 and 1650 m.a.s.l. and it covers a total area of 10,081 km2. It is an ecosystem with a very steeply sloped topography, characterized by biological connectivity and high ecological endemism [71]. This territory has been threatened by deforestation and fragmentation processes, in which land is mainly occupied by extensive livestock and subsistence agriculture [71,72,73,74]. These human activities are also causing severe alteration of the hydrological balance, the effects of which result in erosion and a high risk of landslides, floods [75], and sedimentation into the Golfo Dulce, affecting the coral reefs [76,77,78,79].

3.2. GIS Erosion Susceptibility Assessment

The Claro River sub-watershed is especially affected by intense fragmentation in its upper part, which is also characterized by steep slopes. This disturbance has caused a great number of erosive events, including severe landslides. During the rainy season, floods are common in the lower lands affecting Rio Claro town. Actions that have been taken to avoid persistent flooding have focused on the construction of temporary levees (Figure 2). An empirical geological study recommended the implementation of reforestation policies due to highly overexploited terrain, mostly on steeply sloping land used as pasture and at high risk of landslides [75].
As part of an integrated assessment approach, employing primary data, an erosion susceptibility map was generated by using artificial neural networks [80]. It reveals severe alteration of the ecosystem in terms of the probability of occurrence of erosion events, especially in the upper sub-watershed (Figure 3). Empirical results suggest a strong spatial correlation between the erosion susceptibility index and land use and land cover data. The highest index values were reached in pasturelands and disturbed forests, and the lowest values in natural forest areas [80,81].
Research and restoration projects have been carried out over the past decade on abandoned and degraded agricultural and pasture lands near the upper sub-watershed of the river. Different restoration strategies have been tested, such as natural regeneration, applied nucleation/island tree planting, and plantation. Designing a cost-effective restoration strategy requires experience and knowledge from testing alternative treatments and knowledge of the adaptive dynamics of the plant species and the site characteristics, as well as the pre-defined ecological goal to be achieved [24,82]. The specific landscape and the biophysical and microclimatic conditions of the area, along with the low seed dispersal, aggressive exotic vegetation, and soil degradation represent strong limitations to natural regeneration for optimum forest recovery [83]. Results demonstrate that an active restoration strategy based on applied nucleation is the most cost-effective method compared to plantation in order to rapidly establish canopy cover and restore large areas [84,85,86].

3.3. Choice Experiment

3.3.1. Theoretical Approach

A choice experiment is a stated preference technique based on demand, welfare, and consumer theory [87], and the random utility model (RUM) developed by [88]. This study employed a choice experiment (CE) model to elicit individual landholders’ preferences for adopting active ecological restoration measures in relation to their current cattle grazing land stewardship. This methodology relies on the assumption of the expected rational behavior of the subjects. Their choices among hypothetical alternatives should reveal the order of their preferences. A CE can offer several advantages over other non-market valuation methods, such as contingent valuation, including the ability to evaluate potential combinations of program characteristics [50], greater statistical efficiency, and better control of the collinearity of experimental stimuli among attributes [89].
However, the hypothetical nature of decision making in a choice experiment raises questions concerning three potential sources of bias. The first has to do with the respondents having a real understanding of the meaning and scope of the experiment, where bias may result from a lack of incentive to truthfully reveal their own preferences [53]. For this reason, conducting the experiment requires a prior induction exercise involving the use of charts and images to facilitate the identification of attributes and careful construction of the valuation scenario. Including cheap talk scripts, such as those developed by [90], has also been found to reduce hypothetical bias [91,92]. Second, the respondents may reveal a certain degree of caution or uncertainty about their preferences relative to their perception of institutional constraints when implementing the proposed environmental policies [93]. A third source of potential bias is in the underlying incentive for respondents to accommodate their choices to the researcher’s view, thus the experiment may be affected by a lack of truthfulness [53].

3.3.2. Experimental Design and Data Collection

The CE model was designed by presenting choice sets to each respondent with two generic active restoration policies, with each alternative encompassing environmental attributes and their associated levels reflecting the expected impacts. The environmental attributes selected for valuation were three ESs: erosion control (ERO), water availability (WATER), and biodiversity (BIO). Table 1 shows the attributes and levels considered in this study. They aim at capturing in percentages the expected future level of provision of each ES. These values were obtained through consultation with experts. In addition, a fourth attribute represents the selected proportion of pastureland dedicated to the implementation of restoration actions (AREA). A maximum level of 50% was established, allowing livestock production in the remaining pastureland. Finally, the payment attribute (PAY) is defined as the minimum compensating payment that the farmer would be willing to accept to implement a restoration project in pastureland. Payment values are reported in Costa Rican colones. The proposed selection of attributes allows us to assess the relative importance of ESs to individual landholders’ choices regarding restoration initiatives.
The attributes and levels were combined using an orthogonal main effects design [47,49,94], which generated a fractional factorial design of 16 choice sets from the full factorial of 43 × 41 possible combinations [95,96,97]. Each choice set consisted of two generic alternatives (A and B), along with a status quo option describing the current grazing livestock production. The choice sets were not assigned in blocks, as is commonly done in practice, due to the limited sample size in the Claro River sub-watershed. The total number of observations was 496 (a total dataset of 82 respondents generated 492 observations in [48]).
The fieldwork was carried out between November 2017 and April 2018. A total of 31 landholders dedicated to livestock activity and located in the Claro River sub-watershed area were finally interviewed out of the estimated census data of 38 properties, based on the data offered by the local San Vito cattle farmers’ chamber. The questionnaire (available on request) comprised two parts. The first part consists of respondent characteristics such as demographics, socioeconomic factors, and experience with natural resource management and environmental conservation. The second part presents the choice questions, including descriptions of the situations and a series of alternative soil management arrangements, for which respondents were asked to indicate their preference. Choice cards were used to elicit preferences, an example of which is shown in Figure 4.

3.3.3. Theory and Econometric Analysis

Following this model, people are assumed to choose the option that results in maximum utility for their daily decision-making. Thus, if individual n faces m mutually exclusive alternatives, the utility that the individual obtains from alternative j  U n j can be formalized as follows:
U n j = V n j + ε n j
where V n j is the observable part of utility (deterministic component) and ε n j is the non-observable part (random component).
The observed utility component for individual n is assumed to be a linear additive function of x n j k variables for k = 1, …, K attributes that describe every alternative j, each weighted with a coefficient β n j k :
V n j = k = 1 K x n j k β n j k
The stochastic component of utility   ε n j is assumed to be independent and identically distributed (IID) with a type I extreme value (Gumbel) distribution [88], so that the parameters of Equation (2) can be estimated by means of multinomial logit (MNL) regression. However, the MNL model has two relevant drawbacks. First, as a consequence of the IID property, the model relies on the assumption that choices are consistent with the independent and irrelevant alternatives (IIA) property. This axiom states that the ratio of the probabilities of choosing one alternative over another (given that both alternatives have a non-zero probability of choice) is unaffected by the presence or absence of changes in the choice set [98]. The IIA property is usually checked by the test proposed in [99].
Second, the MLN model relies on an assumption of homogeneous preferences across respondents. Assuming the presence of taste variations, some degree of preference heterogeneity is required to be incorporated into the model: (i) observed heterogeneity, by allowing for interactions between socioeconomic characteristics and attributes of the alternatives or constant terms; or (ii) unobserved heterogeneity, by estimating coefficients over a continuous distribution rather than as a point estimate [45].
U n j =   β ¯ x n j + β n ˜ x n j + ε n j
Thus, each individual coefficient vector β is the sum of population mean β ¯ and individual deviation β n ˜ . The stochastic part of utility, β i ˜ x n j + ε n j , is correlated between alternatives, which means that the model does not exhibit the IIA property. If the error terms are IID type I extreme values, the model obtained is a random parameter logit (RPL). An RPL model allows parameters to vary randomly across individuals (but not across choice situations), providing a continuous distribution of preferences [100]. The model can include alternative specific constants (ASCs) for the status quo or for the restoration alternatives and interactions between the ASCs and respondent-specific characteristics (covariates) in order to improve the model fit [101], so that Equation (3) is rewritten as Equation (4):
U n j = A S C j +   β ¯ x n j + β n ˜ x n j + α j m A S C j   S m n + δ n m   x n j   S n m + + ε n j  
where A S C j is the alternative specific constant for alternative j, α j m   is the vector of coefficients of the interactions between the ASC and the mth socioeconomic characteristic of individual n ( S m n ), and δ n m is the vector of coefficients of interactions between the attributes and the mth socioeconomic characteristic of individual n. The ASC captures the average influence on the utility of unobserved factors that are correlated to alternative j. Many authors recommend including ASC terms [102,103], and their use is favored in the current state of art, although there are case studies in the literature that exclude ASCs [104,105,106]. It has been argued that ASCs are important in order for interpreting individual preferences [107]. Including ASCs helps to reduce inaccuracies due to violation of the assumption of IIA [103], and excluding them could result in biased attribute parameter estimates, since the remainder of the model would attempt to capture both observed and unobserved effects [102].
In this study, ASC was considered to be a random variable and was assigned to be correlated to the status quo alternative. In this sense, the parameter was coded zero for generic alternatives A and B, and one for the status quo option. If the sign of its estimated value is positive, respondents would, on average, prefer the status quo over the alternatives, and vice versa. The socioeconomic and attitudinal factors of respondent characteristics can be also included through interactions with the alternative specific constants, in order to improve the model fit. Furthermore, to test for the influence of socio-demographic variables on choices, interaction terms of ASC and other attributes were also generated.
Another alternative method for assessing the presence of unobserved heterogeneity in the model is to identify potential segments or subgroups across respondents who share preferences and socio-economic characteristics [100]. The latent class (LC) model can be considered a semi-parametric version of the RPL, where parameters are distributed discretely with a finite set of values. The model does not require additional assumptions regarding the distribution of β; instead, it assumes the existence of a given number of classes that are not observable by the analyst, as well as which individuals belong to which class. Membership of a particular class or segment for each individual is estimated through a latent membership likelihood function that depends on the socio-economic characteristics of the individual and not the characteristics of the program’s attributes. The relevance of the LC model over the RPL is in the capturing of further information regarding the presence of differentiated classes, which could be useful in policy design [50]. Even if unobserved heterogeneity is accounted for in both RPL or LC methods, the model may fail to explain the source of heterogeneity [52].
Both RPL and LC models were estimated with R.3.4.2 [108] using the GMNL package [109]. The log-likelihoods were simulated using 200 shuffled Halton draws in a quasi-Monte Carlo maximum likelihood simulation. Model selection was based on the lowest Akaike information criterion (AIC). An iterative process was used, in which interaction variables (i.e., socio-demographic variables) were subtracted one by one, starting with the least statistically significant, and comparing the model to the previous one based on AIC. When only statistically significant interaction variables remained, the first ones to be dropped were progressively re-added and the model was re-evaluated for improvements to AIC, regardless of statistical significance.

4. Results

4.1. Descriptive Statistics of Respondent Characteristics

Based on the field survey, the majority of interviewed households were entirely dedicated to cattle ranching (74%) and the others to dual purpose cattle ranching, for both meat and milk production. Specifically, the revenue of ranching holdings is generated from the sale of animals, while in dual-purpose farming income is obtained from a combination of selling animals (occasionally) and milk (including its use in cheese production).
Table 2 shows a summary of descriptive statistics for the survey respondents. About 74% of the respondents were male, and the respondents’ average age was over 49. It is relevant to highlight that the female respondents were mainly young women, fully involved in farming duties. About 36% of the households had their place of residence in nearby towns and villages of San Vito, Concepción, Aguabuena, and Rio Claro. These correspond to the wealthiest households, which own the largest land parcels and the most livestock units. Some of residents were professionals or perform alternative jobs in the towns. Out of the total survey population, only 25% had property rights, a proportion in agreement with the data collected in nearby Osa Peninsula [42]. As mentioned above, this is one of the main constraints on having access to credit and PES schemes, especially for the reforestation category.
The average size of the pasture area within the total land parcel was reported to be about 38 hectares, although the high value of standard deviation (~37 ha) reveals a wide range of pastureland area across the properties, with an average number of cattle units of about 28. The vast majority of land parcels contain fragments of forest cover, either primary, secondary, or riparian, with an average size of about 30 hectares. This feature indicates a concern for the environment and a perception of forest benefits. There is no spatial evidence in the last decade of the clearing of forests for agriculture or livestock purposes [80].

4.2. Random Parameter Logit Model

The estimation results of the RPL models, both with and without respondent characteristics, are reported in Table 3. The values of the AIC statistic for both models reveal an improvement in the degree of goodness-of-fit for the model with covariates. Therefore, the latter was considered for further analysis. The selected respondent characteristics or covariates were those that reached the highest statistical significance. Two random parameters for attributes (ASC and AREA) were included and specified as normally distributed. The model also contains interaction effects between random variables and covariates. The payment attribute is fixed and measured in present value terms so that meaningful estimates of WTA can be calculated [46].
The status quo parameter (ASC) is negative, implying that, on average, most of the landholders were interested and willing to participate in a restoration initiative over the status quo option. As expected, an almost equal distribution of choices was found between the two hypothetical, generic restoration alternatives presented to the respondents. The first alternative was chosen in 36.5% of cases and the second in 35.7% of cases, confirming the absence of selection bias in the hypothetical alternatives due to design error [52].
The positive signs and statistical significance of the coefficient estimates for the ES attributes (apart from BIO) indicate a higher likelihood that a landholder would participate in a restoration program. The erosion control (ERO) and water availability (WATER) attributes show high statistical significance and a similar coefficient magnitude, with ERO slightly more preferred than WATER. The negative sign of the AREA attribute, which describes the maximum portion of pastureland that farmers would be willing to convert to reforestation, indicates that the greater its value, the lower its utility to respondents. This sign is expected, indicating that households obtain a regular income from livestock production.
The incorporation and accounting of unobserved preference heterogeneity among respondents by allowing model parameters to vary randomly across individuals is partially explained by the presence of statistically significant estimates of their standard deviations [110] registered by the ASC (in the model without covariates) and AREA random parameters. In order to explore possible sources of heterogeneity, several interactions among the attributes and socioeconomic characteristics of the respondents were tried, but only the ones depicted in Table 3 were found to be significant. The interaction between ASC and the dual-purpose scheme shows a positive sign, which may indicate that farmers working under this scheme are less likely to participate in a restoration program. In addition, the interaction between ASC and pastureland size reveals that the larger the size, the higher the probability that the current situation (status quo) would be chosen (p < 0.05).
The implication of the negative sign for the interaction between the AREA attribute and the dual-purpose scheme is that landholders using this scheme are more likely to set aside a smaller proportion of pastureland for reforestation purposes. The significance and negative sign of ASC indicates that the utility for respondents is higher for the two hypothetical, generic environmental alternatives than the status quo option when everything else is held constant. In other words, the majority of respondents showed a strong preference for improving the status quo scenario beyond what was depicted by the proposed attributes shown on the choice cards [111].

4.3. Latent Class Logit Model

In contrast to RPL, the LC model allows for the detection of groups with homogenous behavior within the sample of respondents. Hence, the model assumes that the landholders’ preferences are similar within classes and different between them. The choice of the optimal number of segments with heterogeneous preferences was based on the AIC statistics, although as suggested in [112], it is better determined through the Bayesian information criterion (BIC). In addition, it was recommended in [102] to assess the values of statistical significance, signs and magnitude of estimated parameters, and cautiously observe the socioeconomic characteristics of the target population [113].
Applying all of these criteria in this study resulted in two groups showing a clearly differentiated behavioral status. ASC was coded as for the RPL model. Table 4 reports the parameter estimates for each class and the class membership predicted function based on the socioeconomic covariates.
According to the results of the LC model estimates, 38.7% of the respondents belong to class 1 and the remaining 61.29% to class 2. The respondents in class 1 did not make their choices depending on the ES attributes, as the estimated coefficients were not statistically significant. Furthermore, they seemed to express a strong preference for maintaining the largest portion dedicated to pastureland, as shown by the magnitude and significantly negative value of the AREA coefficient. In addition, class 1 displays a higher sensitivity to the payment attribute compared with class 2. In summary, the profile of respondents in class 1 demonstrates a relatively reluctant attitude towards the proposed restoration alternatives. In contrast, the pattern of preferences of class 2 indicates that these individuals have an explicit environmental concern, as shown by the significantly positive values of the ES attributes and the significance and negative sign of ASC. In addition, this class is less sensitive to payment levels. In sum, class 2 is defined by similar average preferences as found in the RPL model.
The estimated coefficients of the membership equation provide information about the sources of preference heterogeneity across both classes. The membership function coefficients for class 1 are normalized to zero, in order to be able to identify the remaining coefficients, hence the membership equation for class 2 has to be evaluated relative to class 1. The positive sign of the pastureland size variable indicates that individuals who have larger pasturelands are more likely to belong to class 2. This result is reasonable, given the fact that landholders with larger properties are more likely to implement restauration initiatives, compared with households that have smaller land parcels, and therefore a higher dependency on land-use resources. The majority of these households are involved in dual-purpose activities, and their land parcels have a smaller average size than those involved solely in cattle ranching. This interpretation is consistent with the significance and negative sign of the dual-purpose variable, which indicates that households using this farming regime are more likely to belong to class 1. The positive sign of the forest size variable implies that landholders with larger parcels of forest are more likely to belong to class 2. With regard to the age variable, younger people are more in favor of implementing restoration initiatives than older people.

4.4. Marginal Value of Attributes and Welfare Change

As a result of the logit transformation of the econometric calculation of the utility function, the coefficient estimates can be interpreted as the relative contribution of a unit change in a particular attribute to the probability that a given choice is made while holding everything else constant. In theory, willingness-to-pay (WTP) estimates are determined by calculating the ratio of an attribute’s marginal utility to the marginal utility of income [114]. The estimated coefficient on the payment attribute β n j generated by both RPL and LC models can be interpreted as the marginal utility of income [45]. For linear attribute parameters, the marginal willingness to pay (mWTP) equals the negative ratio of the respective attribute coefficient β n j and the coefficient of the payment attribute β n j .
W T P n = U β n j U β n p = β n j β n p
This study assumes the payment attribute to be fixed and not randomly distributed, so the parameters and distributions for WTA compensation can be easily estimated [101,104,115,116]. In addition, the payment vehicle is defined as a compensation amount, so that the denominator of Equation (5) will be positive, and therefore the corresponding ratio or “implicit price” indicates a WTA compensation amount.
In order to examine a broader meaning of mWTA estimates, a common method is to calculate the marginal individual welfare changes or compensating surplus (CS) related to different policy scenarios by using the formula provided in [114]:
C S = ( U 0 U 1 ) β n p
where U 0 indicates utility at the status quo, U 1 indicates the utility of a determined policy scenario, and β n p is the parameter estimate of income. For this calculation, it is assumed that the utility is linear and separable into attributes.
The WTA estimates were calculated for the different attributes of the model by using Equation (5) from RPL models, both with and without covariates, and are reported in Table 5. The values are measured in CRC/ha/year for a unit increase in attribute level. The monetary values reveal few differences among the ecosystem service attributes, but a remarkable difference in the ASC attribute. The two RPL model estimates denote similar differences between their respective coefficients (see Table 3). In this case, the ASC attribute was previously defined as a random variable with a normal distribution, and as the payment level is fixed, the respective WTA amount will also be normally distributed, which accounts for statistically significant standard deviations across the respondents. The preference heterogeneity among respondents is reflected by a significant difference in WTA estimates [116].
The positive sign of the marginal rate of substitution for the environmental attributes indicates that, with everything else being equal, respondents would be better off on average with an increase in the levels of those attributes. For a 1% improvement in the provision of ERO, farmers on average would be willing to pay a premium of 1413 CRC/ha/year (approximately 2.54 USD/ha/year). Similarly, for a 1% improvement in the provision of WATER, farmers on average would be willing to pay 1222 CRC/ha/year (approximately 2.17 USD/ha/year). All of these monetary values can also be interpreted in terms of existing and future bequest values, representing the economic importance that landholders assign to the enhancement of ecosystem services for present and future generations.
The marginal rate of substitution for the AREA attribute represents a significant feature. In this case, as noted above, AREA refers to the maximum portion of pastureland that landholders would be willing to give up in order to implement restoration initiatives. Hence, for a 1% increase in the portion of pasture area for restoration purposes, landholders on average would be willing to accept at least CRC 5227 (approximately USD 9.38) per hectare per year (RPL model without covariates) and CRC 5519 (approximately USD 9.90) per hectare per year (RPL model with covariates). The ASC monetary value suggests a baseline payment to consider participating in a restoration initiative (irrespective of the attributes considered in the model).
The welfare values of potential restoration scenarios were estimated by applying Equation (6) with the results of the RPL model with covariates. Three hypothetical policy scenarios were evaluated, reflecting the different degrees of implementation and environmental effects of the restoration strategies (strong, medium, and weak). Table 6 reports the attribute levels and compensating surplus estimates for each scenario. The status quo scenario is related to the current grazing livestock and the attribute levels are set to zero, so that the potential negative environmental impact is not considered for comparison purposes. The negative sign of the compensating surplus (CS) estimates implies, in practical terms, the requirement of an additional incentive payment for landholders to implement these restoration scenarios. These monetary values indicate a welfare change due to the proposed policy scenarios, taking into consideration both the utility associated with the attributes and the exclusion of the value associated with the baseline payment.
The welfare value results shown in Table 6 correspond to the mean amount of money that an individual landholder would be additionally compensated for implementing the restoration policy initiative as described for each scenario. Thus, the estimated annual compensating surplus that each household would receive is an average of CRC 100,086 (approximately USD 179.57) for scenario I, CRC 43,835 (approximately USD 78.65) for scenario II and CRC 23,777 (approximately USD 42.62) for scenario III. All of these values would be conditioned on compliance with the change in the additionality provision of ES.

4.5. Opportunity Costs and Nationwide PES Scheme in Costa Rica

To test the validity of these results, the opportunity costs of implementing restoration alternatives should be considered. The opportunity cost of an activity is theoretically defined as the highest profit forgone by not putting the land under an available alternative. In this case study, cattle ranching is not just the main land-use economic activity amongst surveyed households; moreover, it is hard to find alternative high-value crops given the low soil productivity and the other special biophysical conditions of the area. Empirical studies [117,118] report that about three-quarters of areas under PES schemes have soils that do not allow agricultural use. Alternative land uses such as urbanization and tourism are currently very far from being realistic and suitable options. Hence, the opportunity costs were calculated for cattle ranching and dual purpose (meat and dairy), with estimated average annual household benefits of about 175,876.14 and 338,925 CRC/ha/year, respectively. Although net present values should be calculated in order to properly consider these opportunity costs, since this study is only concerned with comparing programs, only the on-going year of payments is considered.
With regard to the national PES scheme in Costa Rica, there is a wide range of payments depending in the restoration category (Table 7). For instance, for a reforestation plan with fast-growing species (e.g., Vochysia guatemalensis), the payment established for 2017 was CRC 643,107 per hectare for a 5-year period (an average of approximately CRC 128,621 per hectare and per year) by executive order R-541-2016-MINAE. The only plan capable of fully compensating the opportunity costs for the considered year is reforestation with native species.

5. Discussion

5.1. Targeting of Ecosystem Services as a Place-Based Approach

The first research question of this study was how to assess the extent to which cattle ranching landholders located in the Claro River sub-watershed would be willing to implement restoration projects within their properties through a hypothetical PES scheme. This question was raised based on the results obtained from primary data through a GIS-based spatial assessment, which demonstrated the presence of high levels of erosion susceptibility in the upper sub-watershed and a strong spatial correlation with cattle rangelands [80,81]. The selection of the erosion control (ERO) attribute along with two other ESs (water availability and biodiversity) in the CE model allowed us to elicit the respondents’ preferences for them in order. The ERO coefficient was shown to be positive and have the highest statistical significance, hence it shows that people prioritize restoration strategies focused on reversing land degradation and erosion risks. The WATER attribute estimate is also statistically significant (in contrast with the BIO attribute), with a magnitude very close to ERO. This means that landholders would prefer reforestation actions that would simultaneously enhance and ensure the delivery of water.
A common concern among researchers and environmental practitioners is the uncertain environmental effectiveness of nationwide PES schemes. The lack of a spatial targeting approach and the short-term nature of the programs are cited among the main concerns [42,58,119]. Although the current Costa Rican PES scheme policy framework favors those applicants whose properties are located within a pre-established national biological corridor, the employment of national-scale secondary spatial data necessarily fails to address an effective place-based approach to target specific ESs.
In this case study, GIS-based erosion susceptibility data allows a spatially related allocation of payments. A micro-scale approach to the PES scheme would imply a double gain in terms of cost-effectiveness. First, a pre-determined ecosystem-based spatial targeting approach would allow the allocation of financial resources to areas more likely to enhance specific ESs. Primary SIG-based data and newly developed machine learning modeling techniques facilitate the spatial allocation of prioritized hotspots. Second, a micro-scale mapping assessment is essential for allocating specific restoration practices to tackle land degradation. In this sense, further research is strongly recommended to expand the GIS-based spatial assessment in the same location to quantify a wider range of ESs (e.g., water availability, biodiversity conservation, carbon sequestration).

5.2. Willingness to Restore Ecosystem Services under a PES Scheme

The first step in targeting the restoration of ecosystem services through a PES scheme relies on the active involvement of a large proportion of the potential providers. Following a place-based approach, in this case study, this commitment lies with the cattle farmers. The overall results of RPL and LC estimates suggest a strong preference among average landholders for the implementation of restoration initiatives, with the necessary support of a designed, constructed PES scheme. This result is consistent with the findings of previous case studies assessing the willingness to accept PES schemes in rural areas in Mexico and Nicaragua [46,47,48,50].
However, in this case study, about a third of the respondents clearly opted to maintain their current livestock production, without any land-use changes in their pastureland parcels. Most of the dual-purpose farmers preferred to maintain the status quo, although this choice does not necessarily assume an overall negative environmental opinion.
Two distinctive systems of livestock production were found. On the one hand, larger holdings, mainly located in the upper watershed, are involved in a cattle ranching-only scheme, based on selling and buying male bovines. The landholders’ families live in nearby urban settlements and usually generate extra off-farm income. Most of the holdings were reported to have less than one animal per hectare, so the revenue per hectare is low. Aside from the low productivity, the poor soil nutrient availability [120] and climatic conditions [121] also limit the implementation of alternative commodity crops. On the other hand, households under dual-purpose schemes are mainly characterized by small-scale family-based production of milk and cheese. The revenue per hectare is significantly higher than in the other cattle scheme thanks to the profitable sales of milk and artisanal cheese.
Therefore, the notable divergence in landholders’ stated choices, reflected in these two distinct systems of livestock production, can be explained by the differences in their land opportunity costs. This deductive conclusion is closely aligned to existing case studies in Mexico, Costa Rica, and other Central American countries [46,47,48,56,63,68]. Furthermore, it is possible to infer that the average low land opportunity costs and current low meat prices at local markets could also eventually explain the choice of some respondents for restoration alternatives.
To examine the extent to which landholders would potentially be eager to implement restoration actions on their properties under a PES scheme, individual marginal willingness to accept (WTA) estimates and implicit prices were calculated (see Table 5). Observing the monetary value of the ASC, landholders on average would require 139,183 CRC/ha/year (approximately 249.72 USD/ha/year) as a baseline payment to enter the overall program. To determine internal validity, this amount can be contrasted with the estimated land opportunity costs for cattle ranching farmers (about 175,876.14 CRC/ha/year). Assuming that the monetary value of the ASC is normally distributed, it is possible to infer with reasonable confidence that the observed WTA estimates are within a realistic range.
According to our results, apart from the strategy of reforestation with native species, the amount of current fixed payments under the Costa Rican PES scheme seems to be insufficient to fully compensate the average income received by cattle ranching landholders. In this hypothetical scenario, transaction and operational costs are not considered, otherwise these would be necessarily assumed by landholders and, as a consequence, could nearly outweigh the whole compensation payment.
Therefore, landholders’ participation in a potential PES scheme could only be effective if an external intermediary institution were willing to assume at least the expected high direct operational costs of implementing reforestation projects. Transaction costs could be considerably reduced if economies of scale were gained by bundling individual contracts into a unique global contract. In this sense, given the fact that a discrete CE is basically designed as an individual decision-making approach, the capability of a community-based scheme could change the opinion of some initially reluctant landholders [53]. Thus, future research should address the design and testing of alternative methodologies that could contribute to the search for collective decisions by potential beneficiaries, which would result in an efficient use of available public resources.
Despite the small sample size, we consider these results to be reasonably representative of the current state of cattle ranching landholders in mountain areas of southern Costa Rica. However, it would not be accurate to claim external validity outside this area. The preferences stated by the respondents must be contextualized in their own temporal and spatial scale. Taking into account the shortcomings of this case study, we demonstrate that even for a specific site with low land opportunity costs, it would be hard for the current national PSE scheme for reforestation to fulfil the preferences of landholders.

5.3. Evaluating a Layered Payment Scheme

The Costa Rican PES program includes the ability to enroll a PES scheme under a wide range of reforestation categories, allowing significant variation in PES levels (see Table 7). This remarkable advantage implicitly captures latent layered payments that reflect differentiated ESs. In this sense, a reforestation strategy with native species may reflect a biodiversity-targeted approach. However, a baseline spatial dataset is essential to quantify the added net impact, in terms of enhanced provision of ES derived by the implementation of reforestation actions. This case study in particular provides GIS-based spatial hotspot data regarding erosion susceptibility modeling. Further spatial modeling research is required to provide a baseline dataset regarding water supply or water quality ES.
We consider that the main contribution of this case study consists of incorporating an ES additionality approach into a small-scale PES scheme. It is argued in [122] that in order for a PES scheme to be efficient, the actions and derived services paid for are additional to the status quo, and according to [60] this is a prerequisite for achieving effectiveness. In this sense, we investigated landholders’ willingness to accomplish reforestation actions, which imply land-use changes to their properties, in exchange for compensating payments conditioned on the enhancement of specific ESs. Hence, we designed a CE model by defining attributes related to the provision of erosion control, water availability, and biodiversity. The latter was not statistically significant in the econometric analysis and therefore was not included in further calculations.
Turning to the attributes valued the highest by the landholders, their estimated marginal WTA measures indicate the required additional payment for enhancing erosion control (2.54 USD/ha/year) and water availability (approximately 2.17 USD/ha/year). In order to construct a PES scheme with these findings, there are two alternative strategies: the traditional bundling, as used by the Costa Rican PES scheme, which consists of grouping both ESs together in a single package, or layering, by which payments are made separately for each ES within the same scheme framework.
We consider that the layering approach implies a further improvement step, considering the following: (1) With the support of baseline spatial datasets, trade-offs and overlapping effects between the additional enhancement provision of ES can be reduced by diverting the optimal resources to the required site-specific restoration actions [61]. (2) This approach would favor the construction of “networked” or multi-level governance, which refers to the creation of ad hoc horizontal partnerships of institutions and social actors to manage the PES scheme, ideally based on bottom-up, collective decision-making [61]. As an example, an erosion control scheme could be collectively funded by government institutions, regarding agriculture and livestock production or risk management, and social actors, such as local chambers of producers, in parallel with a scheme targeting local water companies by introducing a tariff to pay for water availability and quality. (3) Layering ecosystem services would benefit landholders by having additional payments conditioned on the enhanced delivery of ES.

6. Conclusions

This paper reports empirical research findings from a CE model integrated with support from GIS-based spatial data, to explore how landholders around the Claro River sub-watershed evaluate the option of restoring the region’s ES. The environmental spatial assessment and existing research evidence demonstrate high levels of erosion susceptibility in the upper sub-watershed, which leads to land degradation, with impacts on multiple ESs such as livestock yield, water availability, and biodiversity loss.
The overall CE results indicate that landholders under a cattle ranching regime are mostly willing to adopt drastic environmentally sound land-use changes if optimal incentive payments are provided through a PES scheme. CE also allows us to examine the presence and potential sources of behavioral heterogeneity across respondents and to estimate their willingness to accept (WTA) the implementation of restoration practices on their pasturelands. The larger the pasturelands and associated lower productivity, the more likely they will enroll in a PES scheme. In contrast, landholders under a dual-purpose farming scheme are clearly averse to changing their current small-scale mode of production.
Based on the results from this study, households explicitly recognize the benefits gained by first reducing the risks of soil erosion and land degradation, followed by securing water availability. The estimated levels of WTA these ESs capture the economic relevance that people attribute to securing present and future provision. However, in order to implement restoration projects, the estimated average individual WTA compensation levels for landholders, which are closely correlated to their opportunity costs, are strongly affected by the size of their pasturelands. These WTA estimates are a long way from fully offsetting the current payments offered by the Costa Rican PES program, even if a potential intermediary entity were to assume the expected high operational and transaction costs. Moreover, the lack of land tenure rights among most of the landholders would undermine access to the program.
Beyond these results, this case study assesses the potential benefits of a micro-scale layered PES scheme based on a spatial targeting approach and landholders’ willingness to accept payments to provide their most highly valued ecosystem services. This novel proposal could overcome the main shortcomings of the national PES scheme. However, the results must be carefully framed in the current temporal and spatial scales of the studied area and the small size of the surveyed population. Therefore, it is difficult to assume external validity for other sites in Costa Rica.
Some necessary policy implications should be addressed in order to undertake a micro-scale PES scheme. First, appropriate policy frameworks and institutional arrangements should be considered to draft flexible payment schemes closely aligned to a spatial targeting approach, in order to measure the additionality of differentiated ESs. Second, the development of “networked” or multi-level governance could improve access to alternative financial mechanisms, to complement the budget-fixed bounds of the nationwide PES program and play an intermediary role in assuming the expected high direct operational and transaction costs. Third, the implementation of secured land tenancy rights will be an inevitable and essential policy.

Supplementary Materials

The following are available online at https://www.mdpi.com/article/10.3390/land10070709/s1, Figure S1: Gographical location of the Claro River sub-watershed in southern Costa Rica.

Author Contributions

Conceptualization, I.P.-R.; methodology, I.P.-R.; software, I.P.-R. and D.F.; validation, D.F., C.V., F.J. and I.E.; formal analysis, D.F., C.V. and I.E.; investigation, I.P.-R.; resources, I.P.-R., D.F. and C.V.; data curation, I.P.-R., D.F. and C.V.; writing—original draft preparation, I.P.-R.; writing—review and editing, I.P.-R.; visualization, D.F., C.V., F.J. and I.E.; supervision, I.E.; project administration, D.F. and C.V.; funding acquisition, I.P.-R. All authors have read and agreed to the published version of the manuscript.

Funding

This research was funded by Fondo de Becas CeNAT-CONARE, Costa Rica, https://cenat.ac.cr/ (accessed on 28 April 2021). The publication process was partly financed by the EKOPOL Research group, recognized by the Basque Government (IT-1365-19).

Institutional Review Board Statement

Not applicable.

Informed Consent Statement

Not applicable.

Acknowledgments

We appreciate the support from the local residents, local institutions and scholars. We would also like to thank the two anonymous reviewers for their comments and suggestions. Special thanks go to the PRIAS-CENAT laboratory personnel for technical and logistic support during this research.

Conflicts of Interest

The authors declare no conflict of interest.

References

  1. Barral, M.P.; Benayas, J.M.R.; Meli, P.; Maceira, N.O. Quantifying the impacts of ecological restoration on biodiversity and ecosystem services in agroecosystems: A global meta-analysis. Agric. Ecosyst. Environ. 2015, 202, 223–231. [Google Scholar] [CrossRef] [Green Version]
  2. Brancalion, P.H.S.; Niamir, A.; Broadbent, E.; Crouzeilles, R.; Barros, F.S.M.; Zambrano, A.M.A.; Baccini, A.; Aronson, J.; Goetz, S.; Reid, J.L.; et al. Global restoration opportunities in tropical rainforest landscapes. Sci. Adv. 2019, 5. [Google Scholar] [CrossRef] [PubMed] [Green Version]
  3. Navarro, L.M.; Marques, A.; Proença, V.; Ceauşu, S.; Gonçalves, B.; Capinha, C.; Fernandez, M.; Geldmann, J.; Pereira, H.M. Restoring degraded land: Contributing to Aichi Targets 14, 15, and beyond. Curr. Opin. Environ. Sustain. 2017, 29, 207–214. [Google Scholar] [CrossRef]
  4. Benayas, J.M.R.; Bullock, J.M. Restoration of Biodiversity and Ecosystem Services on Agricultural Land. Ecosystems 2012, 15, 883–899. [Google Scholar] [CrossRef]
  5. Watson, J.E.M.; Evans, T.; Venter, O.; Williams, B.; Tulloch, A.; Stewart, C.; Thompson, I.; Ray, J.C.; Murray, K.; Salazar, A.; et al. The exceptional value of intact forest ecosystems. Nat. Ecol. Evol. 2018, 2, 599–610. [Google Scholar] [CrossRef] [PubMed]
  6. Vanacker, V.; Bellin, N.; Molina, A.; Kubik, P.W. Erosion regulation as a function of human disturbances to vegetation cover: A conceptual model. Landsc. Ecol. 2014, 29, 293–309. [Google Scholar] [CrossRef]
  7. Viles, H.A.; Naylor, L.A.; Carter, N.E.A.; Chaput, D. Biogeomorphological disturbance regimes: Progress in linking ecological and geomorphological systems. Earth Surf. Process. Landf. 2008, 33, 1419–1435. [Google Scholar] [CrossRef]
  8. Calder, I.R. Forests and hydrological services: Reconciling public and science perceptions. Land Use Water Resour. Res. 2002, 2. [Google Scholar] [CrossRef]
  9. Brookhuis, B.; Hein, L. The value of the flood control service of tropical forests: A case study for Trinidad. For. Policy Econ. 2016, 62, 118–124. [Google Scholar] [CrossRef]
  10. Bruijnzeel, L. Hydrological functions of tropical forests: Not seeing the soil for the trees? Agric. Ecosyst. Environ. 2004, 104, 185–228. [Google Scholar] [CrossRef]
  11. Farley, K.A.; Jobbagy, E.G.; Jackson, R.B. Effects of afforestation on water yield: A global synthesis with implications for policy. Glob. Chang. Biol. 2005, 11, 1565–1576. [Google Scholar] [CrossRef]
  12. Wang, X.; Dong, X.; Liu, H.; Wei, H.; Fan, W.; Lu, N.; Xu, Z.; Ren, J.; Xing, K. Linking land use change, ecosystem services and human well-being: A case study of the Manas River Basin of Xinjiang, China. Ecosyst. Serv. 2017, 27, 113–123. [Google Scholar] [CrossRef]
  13. IPBES. Summary for Policymakers of the Assessment Report on Land Degradation and Restoration of the Intergovernmental Science-Policy Platform on Biodiversity and Ecosystem Services; Secretariat of the Intergovernmental Science-Policy Platform on Biodiversity and Ecosystem Services: Bonn, Germany, 2018; p. 44. [Google Scholar]
  14. Kaimowitz, D.; Sheil, D. Conserving What and for Whom? Why Conservation Should Help Meet Basic Human Needs in the Tropics. Biotropica 2007, 39, 567–574. [Google Scholar] [CrossRef]
  15. Benayas, J.M.R.; Newton, A.C.; Diaz, A.; Bullock, J.M. Enhancement of Biodiversity and Ecosystem Services by Ecological Restoration: A Meta-Analysis. Science 2009, 325, 1121–1124. [Google Scholar] [CrossRef] [PubMed]
  16. Feng, X.; Fu, B.; Lu, N.; Zeng, Y.; Wu, B. How ecological restoration alters ecosystem services: An analysis of carbon sequestration in China’s Loess Plateau. Sci. Rep. 2013, 3, 2846. [Google Scholar] [CrossRef] [PubMed]
  17. Fonseca, W.; Alice, F.E.; Rey-Benayas, J.M. Carbon accumulation in aboveground and belowground biomass and soil of different age native forest plantations in the humid tropical lowlands of Costa Rica. New For. 2011, 43, 197–211. [Google Scholar] [CrossRef]
  18. Huang, L.; Shao, Q.; Liu, J. Forest restoration to achieve both ecological and economic progress, Poyang Lake basin, China. Ecol. Eng. 2012, 44, 53–60. [Google Scholar] [CrossRef]
  19. Bosch, J.; Hewlett, J. A review of catchment experiments to determine the effect of vegetation changes on water yield and evapotranspiration. J. Hydrol. 1982, 55, 3–23. [Google Scholar] [CrossRef]
  20. Van Dijk, A.I.J.M.; Van Noordwijk, M.; Calder, I.R.; Bruijnzeel, S.L.A.; Schellekens, J.; Chappell, N.A. Forest–flood relation still tenuous—Comment on ‘Global evidence that deforestation amplifies flood risk and severity in the developing world’. Glob. Chang. Biol. 2009, 15, 110–115. [Google Scholar] [CrossRef]
  21. Arroyo-Rodríguez, V.; Pineda, E.; Escobar, F.; Benítez-Malvido, J. Value of Small Patches in the Conservation of Plant-Species Diversity in Highly Fragmented Rainforest. Conserv. Biol. 2009, 23, 729–739. [Google Scholar] [CrossRef]
  22. Food and Agriculture Organization (FAO). The Resource Outlook to 2050: By How Much Do Land, Water and Crop Yields Need to Increase by 2050. Available online: http://ftp.fao.org/docrep/fao/012/ak971e/ak971e00.pdf. (accessed on 24 March 2018).
  23. Kiers, E.T.; Leakey, R.R.B.; Izac, A.-M.; Heinemann, J.A.; Rosenthal, E.; Nathan, D.; Jiggins, J. ECOLOGY: Agriculture at a Crossroads. Science 2008, 320, 320–321. [Google Scholar] [CrossRef] [PubMed]
  24. Holl, K.D. Research Directions in Tropical Forest Restoration. Ann. Mo. Bot. Gard. 2017, 102, 237–250. [Google Scholar] [CrossRef] [Green Version]
  25. Jones, H.P. Impact of Ecological Restoration on Ecosystem Services. In Encyclopedia of Biodiversity; Elsevier: Amsterdam, The Netherlands, 2013; pp. 199–208. [Google Scholar]
  26. Reed, M.S.; Buenemann, M.; Atlhopheng, J.; Akhtar-Schuster, M.; Bachmann, F.; Bastin, G.; Bigas, H.; Chanda, R.; Dougill, A.; Essahli, W.; et al. Cross-scale monitoring and assessment of land degradation and sustainable land management: A methodological framework for knowledge management. Land Degrad. Dev. 2011, 22, 261–271. [Google Scholar] [CrossRef]
  27. DE Groot, R.S.; Blignaut, J.; VAN DER Ploeg, S.; Aronson, J.; Elmqvist, T.; Farley, J. Benefits of Investing in Ecosystem Restoration. Conserv. Biol. 2013, 27, 1286–1293. [Google Scholar] [CrossRef] [PubMed] [Green Version]
  28. Mekuria, W.; Veldkamp, E.; Tilahun, M.; Olschewski, R. Economic valuation of land restoration: The case of exclosures established on communal grazing lands in Tigray, Ethiopia. Land Degrad. Dev. 2011, 22, 334–344. [Google Scholar] [CrossRef]
  29. Corbera, E.; Pascual, U. Ecosystem Services: Heed Social Goals. Science 2012, 335, 655–656. [Google Scholar] [CrossRef] [PubMed]
  30. Muradian, R.; Arsel, M.; Pellegrini, L.; Adaman, F.; Aguilar, B.; Agarwal, B.; Corbera, E.; De Blas, D.E.; Farley, J.; Froger, G.; et al. Payments for ecosystem services and the fatal attraction of win-win solutions. Conserv. Lett. 2013, 6, 274–279. [Google Scholar] [CrossRef] [Green Version]
  31. Pascual, U.; Phelps, J.; Garmendia, E.; Brown, K.; Corbera, E.; Martin, A.; Gomez-Baggethun, E.; Muradian, R. Social Equity Matters in Payments for Ecosystem Services. Bioscience 2014, 64, 1027–1036. [Google Scholar] [CrossRef] [Green Version]
  32. Shrestha, R.; Timilsnia, G. The additionality criterion for identifying clean development mechanism projects under the Kyoto Protocol. Energy Policy 2002, 30, 73–79. [Google Scholar] [CrossRef]
  33. Pascual, U.; Muradian, R.; Rodríguez, L.C.; Duraiappah, A. Exploring the links between equity and efficiency in payments for environmental services: A conceptual approach. Ecol. Econ. 2010, 69, 1237–1244. [Google Scholar] [CrossRef]
  34. Ezzine-De-Blas, D.; Wunder, S.; Ruiz-Pérez, M.; Moreno-Sanchez, R.D.P. Global Patterns in the Implementation of Payments for Environmental Services. PLoS ONE 2016, 11, e0149847. [Google Scholar] [CrossRef] [PubMed] [Green Version]
  35. Wunder, S. Payments for Environmental Services: Some Nuts and Bolts. CIFOR Occasional Paper. Available online: http://www.cifor.org/publications/pdf_files/OccPapers/OP-42.pdf (accessed on 20 April 2021).
  36. Porras, I.; Chacón-Cascante, A. Costa Rica’s Payments for Ecosystem Services Programme. In Ecosystems, Poverty Alleviation and Conditional Transfers; International Institute for Environment and Development: London, UK, 2018; p. 59. [Google Scholar]
  37. Robalino, J.; Pffaf, A.; Sánchez-Azofeifa, A.; Alpízar, F.; León, C.; Rodríguez, C.M. Deforestation Impacts of Environmental Services Payments—Costa Rica’s PSA Programme 2000–2005; Environment for Development: Washington, WA, USA, 2005; p. 20. [Google Scholar]
  38. Robalino, J.; Pfaff, A.; Villalobos, L. Assessing the impact of institutional design of payments for environmental services: The Costa Rican experience. In Ecosystem Services from Agriculture and Agroforestry: Measurement and Payments; Earthscan: Oxford, UK, 2011. [Google Scholar]
  39. Sánchez-Azofeifa, A.; Pfaff, A.; Robalino, J.; Boomhower, J. Costa Rica’s Payment for Environmental Services Program: Intention, implementation, and impact. Conserv. Biol. 2007, 21, 1165–1173. [Google Scholar] [CrossRef] [PubMed] [Green Version]
  40. Arriagada, R.A.; Sills, E.O.; Ferraro, P.; Pattanayak, S.K. Do Payments Pay Off? Evidence from Participation in Costa Rica’s PES Program. PLoS ONE 2015, 10, e0131544. [Google Scholar] [CrossRef]
  41. Lansing, D.M. Understanding Smallholder Participation in Payments for Ecosystem Services: The Case of Costa Rica. Hum. Ecol. 2017, 45, 77–87. [Google Scholar] [CrossRef]
  42. Porras, I.; Barton, D.N.; Miranda, M.; Chacón-Cascante, A. Learning from 20 Years of Payments for Ecosystem Services in Costa Rica; International Institute for Environment and Development: London, UK, 2013; p. 76. [Google Scholar]
  43. Legrand, T.; Froger, G.; Le Coq, J.-F. Institutional performance of Payments for Environmental Services: An analysis of the Costa Rican Program. For. Policy Econ. 2013, 37, 115–123. [Google Scholar] [CrossRef] [Green Version]
  44. Arriagada, R.A.; Ferraro, P.; Sills, E.O.; Pattanayak, S.K.; Cordero-Sancho, S. Do Payments for Environmental Services Affect Forest Cover? A Farm-Level Evaluation from Costa Rica. Land Econ. 2012, 88, 382–399. [Google Scholar] [CrossRef]
  45. Hoyos, D. The state of the art of environmental valuation with discrete choice experiments. Ecol. Econ. 2010, 69, 1595–1603. [Google Scholar] [CrossRef]
  46. Baker, K.; Baylis, K.; Bull, G.; Barichello, R. Are non-market values important to smallholders’ afforestation decisions? A psychometric segmentation and its implications for afforestation programs. For. Policy Econ. 2019, 100, 1–13. [Google Scholar] [CrossRef]
  47. Torres, A.B.; Macmillan, D.C.; Skutsch, M.; Lovett, J.C. Payments for ecosystem services and rural development: Landowners’ preferences and potential participation in western Mexico. Ecosyst. Serv. 2013, 6, 72–81. [Google Scholar] [CrossRef]
  48. Costedoat, S.; Koetse, M.; Corbera, E.; Ezzine-De-Blas, D. Cash only? Unveiling preferences for a PES contract through a choice experiment in Chiapas, Mexico. Land Use Policy 2016, 58, 302–317. [Google Scholar] [CrossRef]
  49. Diafas, I.; Barkmann, J.; Mburu, J. Measurement of Bequest Value Using a Non-monetary Payment in a Choice Experiment—The Case of Improving Forest Ecosystem Services for the Benefit of Local Communities in Rural Kenya. Ecol. Econ. 2017, 140, 157–165. [Google Scholar] [CrossRef]
  50. Kaczan, D.; Swallow, B.M.; Adamowicz, W. Designing a payments for ecosystem services (PES) program to reduce deforestation in Tanzania: An assessment of payment approaches. Ecol. Econ. 2013, 95, 20–30. [Google Scholar] [CrossRef]
  51. Lliso, B.; Pascual, U.; Engel, S.; Mariel, P. Payments for ecosystem services or collective stewardship of Mother Earth? Applying deliberative valuation in an indigenous community in Colombia. Ecol. Econ. 2020, 169, 106499. [Google Scholar] [CrossRef]
  52. Tarfasa, S.; Balana, B.B.; Tefera, T.; Woldeamanuel, T.; Moges, A.; Dinato, M.; Black, H. Modeling Smallholder Farmers’ Preferences for Soil Management Measures: A Case Study from South Ethiopia. Ecol. Econ. 2018, 145, 410–419. [Google Scholar] [CrossRef]
  53. Vorlaufer, T.; Falk, T.; Dufhues, T.; Kirk, M. Payments for ecosystem services and agricultural intensification: Evidence from a choice experiment on deforestation in Zambia. Ecol. Econ. 2017, 141, 95–105. [Google Scholar] [CrossRef] [Green Version]
  54. Pagiola, S. Payments for environmental services in Costa Rica. Ecol. Econ. 2008, 65, 712–724. [Google Scholar] [CrossRef] [Green Version]
  55. Matulis, B.S. Persistent Neo-liberalization in PES: Taxes, Tariffs, and the World Bank in Costa Rica. Conserv. Soc. 2017, 15, 147–156. [Google Scholar] [CrossRef]
  56. Zbinden, S.; Lee, D.R. Paying for Environmental Services: An Analysis of Participation in Costa Rica’s PSA Program. World Dev. 2005, 33, 255–272. [Google Scholar] [CrossRef]
  57. Sierra, R.; Russman, E. On the efficiency of environmental service payments: A forest conservation assessment in the Osa Peninsula, Costa Rica. Ecol. Econ. 2006, 59, 131–141. [Google Scholar] [CrossRef]
  58. Barton, D.; Faith, D.; Rusch, G.; Acevedo, H.; Paniagua, L.; Castro, M. Environmental service payments: Evaluating biodiversity conservation trade-offs and cost-efficiency in the Osa Conservation Area, Costa Rica. J. Environ. Manag. 2009, 90, 901–911. [Google Scholar] [CrossRef] [PubMed]
  59. Daniels, A.E.; Bagstad, K.; Esposito, V.; Moulaert, A.; Rodriguez, C.M. Understanding the impacts of Costa Rica’s PES: Are we asking the right questions? Ecol. Econ. 2010, 69, 2116–2126. [Google Scholar] [CrossRef]
  60. Vedel, S.E.; Jacobsen, J.B.; Thorsen, B.J. Forest owners’ willingness to accept contracts for ecosystem service provision is sensitive to additionality. Ecol. Econ. 2015, 113, 15–24. [Google Scholar] [CrossRef]
  61. Reed, M.S.; Allen, K.; Dougill, A.J.; Evans, K.L.; Kenter, J.O.; Hoy, J.; McNab, D.; Stead, S.M.; Twyman, C.; Scott, A.S.; et al. A place-based approach to payments for ecosystem services. Glob. Environ. Chang. 2017, 43, 92–106. [Google Scholar] [CrossRef]
  62. Estrada, N.; Declerck, F. Payment for ecosystem services for energy, biodiversity conservation, and poverty reduction in Costa Rica. In Integrating Ecology and Poverty Reduction: The Application of Ecology in Development Solutions; Springer: New York, NY, USA, 2011. [Google Scholar]
  63. Arriagada, R.; Sills, E.O.; Pattanayak, S.K.; Ferraro, P.J. Combining Qualitative and Quantitative Methods to Evaluate Participation in Costa Rica’s Program of Payments for Environmental Services. J. Sustain. For. 2009, 28, 343–367. [Google Scholar] [CrossRef]
  64. Pagiola, S.; Arcenas, A.; Platais, G. Can Payments for Environmental Services Help Reduce Poverty? An Exploration of the Issues and the Evidence to Date from Latin America. World Dev. 2005, 33, 237–253. [Google Scholar] [CrossRef]
  65. Grieg-Gran, M.; Porras, I.; Wunder, S. How can market mechanisms for forest environmental services help the poor? Preliminary lessons from Latin America. World Dev. 2005, 33, 1511–1527. [Google Scholar] [CrossRef]
  66. Villanueva, C.; Ibrahim, M.; Casasola, F.; Sepúlveda, C. Ecological indexing as a tool for the Payments for Ecosystem Services in agricultural landscapes: The experience of the GEF-Silvopastoral project in Costa Rica, Nicaragua and Colombia’. In Ecosystem Services from Agriculture and Agroforestry: Measurement and Payments; Earthscan: Oxford, UK, 2011. [Google Scholar]
  67. Miranda, M.; Porras, I.; Moreno, L. The Social Impacts of Payments for Environmental Services in Costa Rica: A Quantitative Field Survey and Analysis of the Virilla Watershed; Markets for Environmental Services: London, UK, 2003. [Google Scholar]
  68. Kosoy, N.; Martinez-Tuna, M.; Muradian, R.; Martinez-Alier, J. Payments for environmental services in watersheds: Insights from a comparative study of three cases in Central America. Ecol. Econ. 2007, 61, 446–455. [Google Scholar] [CrossRef]
  69. Garbach, K.; Lubell, M.; DeClerck, F.A. Payment for Ecosystem Services: The roles of positive incentives and information sharing in stimulating adoption of silvopastoral conservation practices. Agric. Ecosyst. Environ. 2012, 156, 27–36. [Google Scholar] [CrossRef]
  70. Rasch, S.; Wünscher, T.; Casasola, F.; Ibrahim, M.; Storm, H. Permanence of PES and the role of social context in the Regional Integrated Silvo-pastoral Ecosystem Management Project in Costa Rica. Ecol. Econ. 2021, 185, 107027. [Google Scholar] [CrossRef]
  71. ProDUS. Diagnóstico: Plan Regulador Cantonal de Golfito; Universidad de Costa Rica: San José, Costa Rica, 2007; p. 658. [Google Scholar]
  72. TNC. Evaluación Ecológica, Socio-Económica, Institucional del Sector de Fila Cruces, Golfito, Costa Rica; Universidad Nacional: Heredia, Costa Rica, 2008; p. 159. [Google Scholar]
  73. Höbinger, T.; Schindler, S.; Seaman, B.S.; Wrbka, T.; Weissenhofer, A. Impact of oil palm plantations on the structure of the agroforestry mosaic of La Gamba, southern Costa Rica: Potential implications for biodiversity. Agrofor. Syst. 2011, 85, 367–381. [Google Scholar] [CrossRef]
  74. SINAC. Grúas II: Propuesta de ordenamiento territorial para la conservación de la biodiversidad en Costa Rica. In Análisis de Vacíos en la Representatividad e Integridad de la Biodiversidad Terrestre; Universidad de Costa Rica: San José, Costa Rica, 2007; p. 100. [Google Scholar]
  75. Andreas, M.; Allan, A. Incorporating geology and geomorphology in land management decisions in developing countries: A case study in Southern Costa Rica. Geomorphology 2007, 87, 68–89. [Google Scholar] [CrossRef]
  76. Cortés, J. The coral reefs of Golfo Dulce, Costa Rica. In Distribution and Community Structure; National Museum of Natural History Smithsonian Institution: Washington, WA, USA, 1990; p. 37. [Google Scholar]
  77. Cortés, J. Los Arrecifes Coralinos del Golfo Dulce, Aspectos Ecológicos; Universidad de Costa Rica: San José, Costa Rica, 1992; p. 8. [Google Scholar]
  78. Quesada, A.; Cortés, J. Los ecosistemas marinos del Pacífico sur de Costa Rica: Estado del conocimiento y perspectivas de manejo. Rev. Biol. Trop. 2006, 54, 101–145. [Google Scholar]
  79. Umaña, G. Characterization of Some Golfo Dulce Drainage, River Basin (Costa Rica); Universidad de Costa Rica: San José, Costa Rica, 1998; p. 11. [Google Scholar]
  80. Pérez-Rubio, I.; Flores, D.; Vargas, C.; Mende, A.; Jiménez, F. Análisis comparativo de susceptibilidad de erosión y evaluación de incertidumbre en la subcuenca del Río Claro, Costa Rica. Rev. Cienc. Ambient. 2021, 55, 271–293. [Google Scholar] [CrossRef]
  81. Pérez-Rubio, I.; Mende, A. Análisis espacial de susceptibilidad de erosión en una cuenca hidrográfica del trópico húmedo de Costa Rica. Rev. Cienc. Ambient. 2017, 52, 1–26. [Google Scholar] [CrossRef] [Green Version]
  82. Holl, K.D.; Zahawi, R.A.; Cole, R.J.; Ostertag, R.; Cordell, S. Planting Seedlings in Tree Islands Versus Plantations as a Large-Scale Tropical Forest Restoration Strategy. Restor. Ecol. 2010, 19, 470–479. [Google Scholar] [CrossRef]
  83. Holl, K.D. Factors Limiting Tropical Rain Forest Regeneration in Abandoned Pasture: Seed Rain, Seed Germination, Microclimate, and Soil1. Biotropica 1999, 31, 229–242. [Google Scholar] [CrossRef]
  84. Cole, R.; Holl, K.; Keene, C.; Zahawi, R. Direct seeding of late-successional trees to restore tropical montane forest. For. Ecol. Manag. 2011, 261, 1590–1597. [Google Scholar] [CrossRef]
  85. Holl, K.D.; Reid, J.L.; Chaves-Fallas, J.M.; Oviedo-Brenes, F.; Zahawi, R.A. Local tropical forest restoration strategies affect tree recruitment more strongly than does landscape forest cover. J. Appl. Ecol. 2016, 54, 1091–1099. [Google Scholar] [CrossRef] [Green Version]
  86. Zahawi, R.A.; Holl, K.D.; Cole, R.J.; Reid, J.L. Testing applied nucleation as a strategy to facilitate tropical forest recovery. J. Appl. Ecol. 2012, 50, 88–96. [Google Scholar] [CrossRef]
  87. Lancaster, K.T. A New Approach to Consumer Theory. J. Political Econ. 1966, 74, 132–157. [Google Scholar] [CrossRef]
  88. McFadden, D. Conditional Logit Analysis of Qualitative Choice Behaviour. In Frontiers in Econometrics; Zarembka, P., Ed.; Academic Press: New York, NY, USA, 1974. [Google Scholar]
  89. Holmes, T.P.; Adamowicz, W.L. Attribute-based Methods, a Primer on Nonmarket Valuation; Springer: New York, NY, USA, 2003; pp. 171–219. [Google Scholar]
  90. Cummings, R.G.; Taylor, L.O. Unbiased Value Estimates for Environmental Goods: A Cheap Talk Design for the Contingent Valuation Method. Am. Econ. Rev. 1999, 89, 649–665. [Google Scholar] [CrossRef]
  91. Landry, C.E.; List, J.A. Using Ex Ante Approaches to Obtain Credible Signals for Value in Contingent Markets: Evidence from the Field. Am. J. Agric. Econ. 2007, 89, 420–429. [Google Scholar] [CrossRef] [Green Version]
  92. Mozumder, P.; Berrens, R.P. Investigating hypothetical bias: Induced-value tests of the referendum voting mechanism with uncertainty. Appl. Econ. Lett. 2007, 14, 705–709. [Google Scholar] [CrossRef]
  93. Biénabe, E.; Hearne, R.R. Public preferences for biodiversity conservation and scenic beauty within a framework of environmental services payments. For. Policy Econ. 2006, 9, 335–348. [Google Scholar] [CrossRef]
  94. Lee, C.-L.; Wang, C.-H.; Sriarkarin, S. Evaluating the Public’s Preferences toward Sustainable Planning under Climate and Land Use Change in Forest Parks. Sustainability 2019, 11, 3149. [Google Scholar] [CrossRef] [Green Version]
  95. Burgess, L. Discrete Choice Experiments. Department of Mathematical Sciences, University of Technology, Sydney. Available online: http://crsu.science.uts.edu.au/choice/ (accessed on 22 April 2021).
  96. Louviere, J.J. Analyzing Individual Decision Making: Metric Conjoint Analysis; SAGE Publications: Newbury Park, CA, USA, 1988. [Google Scholar]
  97. Pearmain, D.; Swanson, J.; Kroes, E.; Bradley, M. Stated Preference Techniques: A Guide to Practice; Steer Davies Gleave and Hague Consulting Group: London, UK, 1991. [Google Scholar]
  98. Louviere, J.J.; Hensher, D.A.; Swait, J.D. Stated Choice Methods: Analysis and Application; Cambridge University Press: Cambridge, UK, 2000. [Google Scholar]
  99. Hausman, J.; McFadden, D. Specification Tests for the Multinomial Logit Model. Econometrica 1984, 52, 1219. [Google Scholar] [CrossRef] [Green Version]
  100. Boxall, P.C.; Adamowicz, W.L. Understanding Heterogeneous Preferences in Random Utility Models: A Latent Class Approach. Environ. Resour. Econ. 2002, 23, 421–446. [Google Scholar] [CrossRef]
  101. Revelt, D.; Train, K. Mixed Logit with Repeated Choices: Households’ Choices of Appliance Efficiency Level. Rev. Econ. Stat. 1998, 80, 647–657. [Google Scholar] [CrossRef]
  102. Adamowicz, W.; Boxall, P.; Williams, M.; Louviere, J. Stated Preference Approaches for Measuring Passive Use Values: Choice Experiments and Contingent Valuation. Am. J. Agric. Econ. 1998, 80, 64–75. [Google Scholar] [CrossRef]
  103. Blamey, R.; Bennett, J.; Louviere, J.; Morrison, M.; Rolfe, J. A test of policy labels in environmental choice modelling studies. Ecol. Econ. 2000, 32, 269–286. [Google Scholar] [CrossRef]
  104. Bujosa, A.; Riera, A.; Hicks, R.L. Combining Discrete and Continuous Representations of Preference Heterogeneity: A Latent Class Approach. Environ. Resour. Econ. 2010, 47, 477–493. [Google Scholar] [CrossRef]
  105. Dissanayake, S.T.M.; Ando, A.W. Valuing Grassland Restoration: Proximity to Substitutes and Trade-offs among Conservation Attributes. Land Econ. 2014, 90, 237–259. [Google Scholar] [CrossRef]
  106. Ruto, E.; Garrod, G. Investigating farmers’ preferences for the design of agri-environment schemes: A choice experiment approach. J. Environ. Plan. Manag. 2009, 52, 631–647. [Google Scholar] [CrossRef] [Green Version]
  107. Morrison, M.; Bennett, J.; Blamey, R.; Louviere, J. Choice Modeling and Tests of Benefit Transfer. Am. J. Agric. Econ. 2002, 84, 161–170. [Google Scholar] [CrossRef]
  108. R Core Team. R: A Language and Environment for Statistical Computing Computer Program, Version 3.6.1; R Foundation for Statistical Computing: Vienna, Austria, 2019. [Google Scholar]
  109. Sarrias, M.; Daziano, R. gmnl: Multinomial Logit Models with Random Parameters: R Package Version 1.1-3; R Foundation for Statistical Computing: Vienna, Austria, 2017. [Google Scholar]
  110. Mariel, P.; Hoyos, D.; Meyerhoff, J. Stated or inferred attribute non-attendance? A simulation approach. Econ. Agrar. Recur. Nat. 2013, 13, 51–67. [Google Scholar] [CrossRef] [Green Version]
  111. Rajmis, S.; Barkmann, J.; Marggraf, R. User community preferences for climate change mitigation and adaptation measures around Hainich National Park, Germany. Clim. Res. 2009, 40, 61–73. [Google Scholar] [CrossRef]
  112. Greene, W.H.; Hensher, D.A. A latent class model for discrete choice analysis: Contrasts with mixed logit. Transp. Res. Part B Methodol. 2003, 37, 681–698. [Google Scholar] [CrossRef]
  113. Scarpa, R.; Thiene, M. Destination Choice Models for Rock Climbing in the Northeastern Alps: A Latent-Class Approach Based on Intensity of Preferences. Land Econ. 2005, 81, 426–444. [Google Scholar] [CrossRef]
  114. Hanemann, W.M. Discrete/continuous models of consumer demand. Econometrica 1984, 52, 541–561. [Google Scholar] [CrossRef]
  115. Croissant, Y. Estimation of Multinomial Logit Models in R: The mlogit Packages: R Package Version 0.2-2; R Foundation for Statistical Computing: Vienna, Austria, 2012. [Google Scholar]
  116. Espinosa-Goded, M.; Barreiro-Hurle, J.; Ruto, E. What Do Farmers Want from Agri-Environmental Scheme Design? A Choice Experiment Approach. J. Agric. Econ. 2010, 61, 259–273. [Google Scholar] [CrossRef]
  117. Hartshorn, G.; Ferraro, P.; Spergel, B.; Sills, E. Evaluation of the World Bank—GEF Ecomercados Project in Costa Rica; NC State University: Raleigh, NC, USA, 2005. [Google Scholar]
  118. Ortiz, E.; Borge, C.; Sage, L. Impacto del Programa de Pago de Servicios Ambientales en Costa Rica Como Medio de Reducción de la Pobreza en Medios Rurales; Unidad Regional de Asistencia Técnica (RUTA): San José, Costa Rica, 2003; p. 62. [Google Scholar]
  119. Wünscher, T.; Engel, S.; Wunder, S. Spatial targeting of payments for environmental services: A tool for boosting conservation benefits. Ecol. Econ. 2008, 65, 822–833. [Google Scholar] [CrossRef]
  120. Celentano, D.; Zahawi, R.A.; Finegan, B.; Ostertag, R.; Cole, R.J.; Holl, K.D. Litterfall Dynamics Under Different Tropical Forest Restoration Strategies in Costa Rica. Biotropica 2010, 43, 279–287. [Google Scholar] [CrossRef]
  121. Cole, R.J.; Holl, K.D.; Zahawi, R.A. Seed rain under tree islands planted to restore degraded lands in a tropical agricultural landscape. Ecol. Appl. 2010, 20, 1255–1269. [Google Scholar] [CrossRef] [PubMed]
  122. Wunder, S.; Engel, S.; Pagiola, S. Taking stock: A comparative analysis of payments for environmental services programs in developed and developing countries. Ecol. Econ. 2008, 65, 834–852. [Google Scholar] [CrossRef]
Figure 1. Geographic location of Claro River sub-watershed. Clearer figure in the Supplementary Materials.
Land 10 00709 g001
Figure 2. Environmental vulnerability caused by erosion in the Claro River sub-watershed: (a) drastic land-use change in livestock production on steeply sloping terrain located in the upper sub-watershed; (b) severe landslides also occur in the upper sub-watershed; (c) frequent floods affect lowlands close to Rio Claro town; (d) temporary levees are built to prevent floods in the town.
Land 10 00709 g002
Figure 3. Erosion susceptibility map (Pérez-Rubio et al., 2021).
Land 10 00709 g003
Figure 4. Example of a choice card. This card is an English translation of choice card 1 in the survey.
Land 10 00709 g004
Table 1. Description of attributes and levels.
AttributeAttribute Levels
Erosion control (ERO)25, 35, 65%
Water availability (WATER)15, 30, 60%
Biodiversity (BIO)20, 30, 40%
Area (AREA)15, 25, 50%
Payment (PAY)100,000 CRC/ha/year
150,000 CRC/ha/year
200,000 CRC/ha/year
250,000 CRC/ha/year
1USD = 557.34 CRC (October 2017).
Table 2. Characteristics of survey households.
Respondent CharacteristicsValue (std. dev)
Average age (years)49.36 (14.86)
Female respondents (%)25.8
Households with place of residence outside land parcel (%)36
Property rights (%)25
Average size of pasturelands (ha)38.16 (37.78)
Average size of forests (ha)29.06 (18.27)
Average total number of cattle units28.13 (20.21)
Cattle farming model (ranching) (%)74
Table 3. Results of random parameter logit models.
Variables and Interaction EffectsRPL without Covariates (Model 1)RPL with Covariates (Model 2)
ASC (for status quo alternative)−0.090 (0.898)−1.949 (0.819) *
Erosion control (ERO)0.019 (0.004) ***0.019 (0.004) ***
Water availability (WATER)0.017 (0.004) ***0.017 (0.004) ***
Biodiversity (BIO)0.003 (0.009)0.003 (0.009)
Area (AREA)−0.070 (0.024) **−0.077 (0.034) *
Payment (PAY)0.014 (0.001) ***0.014 (0.001) ***
ASC × Dual purpose-3.211 (0.731) ***
ASC × Pastureland size.0.022 (0.008) **
Area × Dual purpose-−0.114 (0.057) *
Standard deviation
ASC3.521(1.118) **0.131 (0.711)
Area0.109 (0.020) ***0.156 (0.025) ***
AIC600.508587.37
Log likelihood−292.25−282.69
Number of observations496496
Standard errors in parentheses. * Significant at p < 0.1, ** significant at p < 0.05, *** significant at p < 0.01.
Table 4. Results of latent class model estimates.
AttributesClass 1Class 2
ASC (for status quo alternative)1.964 (1.012)−1.638 (0.564) **
Erosion control (ERO)0.146 (0.221)0.288 (0.075) ***
Water availability (WATER)0.013 (0.252)0.337 (0.082) ***
Biodiversity (BIO)−0.048 (0.204)−0.020 (0.084)
Area (AREA)−2.131 (0.336) ***−0.168 (0.085)
Payment (PAY)1.244 (0.213) ***0.280 (0.073) ***
Membership equation
Intercept 4.794 (0.638) ***
Pastureland size 0.017 (0.003) ***
Forest land size 0.141 (0.028) ***
Dual purpose −2.696 (0.295) ***
Age −0.182 (0.023) ***
Average membership probability38.7061.29
AIC669.42
Log likelihood−317.71
Number of observations496
Standard errors in parentheses. ** significant at p < 0.05, *** significant at p < 0.01.
Table 5. Marginal willingness to accept, in CRC 1000 per hectare per year, in 2017.
AttributesRPL Model without CovariatesRPL Model with Covariates
ERO1.419 (0.747, 2.091) ***1.413 (0.738, 2.088) ***
WATER1.212 (0.599, 1.825) ***1.222 (0.606, 1.837) ***
AREA−4.990 (−8.509, −1.470) **−5.519 (−10.460, −0.579) *
ASC−6.433 (−132.413, 119.545)−139.183 (-269.097, −9.269) *
95% confidence interval in parentheses. * Significant at p < 0.1, ** significant at p < 0.05, *** significant at p < 0.01. USD 1 = CRC 557.34 (October 2017).
Table 6. Compensating surplus (CS) for different restoration scenarios, in 1000 CRC per hectare per year, in 2017.
ScenarioLevels of AttributesCompensating Surplus
EROWATERBIOAREAMeanConfidence Interval
Strong restoration (I)65%60%40%50%−100.086(−612.950, 412.776)
Medium restoration (II)35%30%30%25%−43.835(−315.233, 227.562)
Weak restoration (III)25%15%20%15%−23.777(−190.041, 142.486)
95% confidence interval in parentheses. USD 1 = CRC 557.34 (October 2017).
Table 7. Costa Rican PES program reforestation payment levels and categories for 2017.
CategoriesHectare/Contract (CRC)Annual Average Payment per HectareFirst Year Payment per Hectare
Reforestation with fast-growing species643,107128,621.4321,553.5
Reforestation with medium-growing species757,634151,526.8378,817
Reforestation with native species 1,136,451227,290.2568,225.5
Natural regeneration109,10621,821.221,821.2
USD 1 = CRC 557.34 (October 2017).
Publisher’s Note: MDPI stays neutral with regard to jurisdictional claims in published maps and institutional affiliations.

