Article

Impact of Land Use and Land Cover Changes on Urban Ecosystem Service Value in Dhaka, Bangladesh

by
Md. Mostafizur Rahman
1,2,* and
György Szabó
1
1
Department of Photogrammetry and Geoinformatics, Faculty of Civil Engineering, Budapest University of Technology and Economics, 1111 Budapest, Hungary
2
Department of Urban and Regional Planning, Rajshahi University of Engineering and Technology, Rajshahi 6204, Bangladesh
*
Author to whom correspondence should be addressed.
Land 2021, 10(8), 793; https://doi.org/10.3390/land10080793
Submission received: 24 June 2021 / Revised: 18 July 2021 / Accepted: 26 July 2021 / Published: 28 July 2021
(This article belongs to the Section Land Planning and Landscape Architecture)

Abstract

:
Urban ecosystem services provide a wide range of services to sustain life, social relation, health, etc., and address most of the challenges, including climate change and environmental pollution. While it is recognized that the urban ecosystem substantially contributes to human well-being in cities, there is less attention to consider the value of urban ecosystem service in urban planning and policymaking. This study analyzed the land use and land cover (LULC) dynamics of city of Dhaka over the past three decades (1990–2020) to evaluate the impact of LULC on ecosystem services value (ESV). The estimation of ESV in relation to LULC has been done using the globally used benefits transfer method (BTM). Findings of the study show that built-up area has increased by 188.35% from 1990 to 2020, with an average annual growth rate is about 6.28%The analysis of ESV shows that it has decreased by 59.55% (85 million USD) from 142.72 million USD in 1990 to 57.72 million USD in 2020 due to the development of the built-up area through conversion of agricultural land, waterbodies, and forest and vegetation land. This study also identified that waterbodies are the greatest contributor to ESV. The result on the elasticity of ESV in relation to LULC implies that about 1% transition in LULC would result in about 0.33% change in total ESV during the study period. We believe that the findings of this study would serve as a reference for the policy maker and urban planner to devise appropriate land use decision to ensure sustainable urban development of Dhaka.

1. Introduction

Ecosystem services (ES) can be defined as the conditions and processes through which natural ecosystems, and the species that make them up, sustain and enrich human life [1]. Ecosystem services can be considered as the benefits human populations derive, directly or indirectly, from ecosystem functions [2,3]. Ecosystem services are categorized into four major groups: (a) provisioning services (e.g., food production); (b) regulatory services (e.g., climate regulation); (c) supporting services (e.g., pollination); and (d) cultural services (e.g., recreation). These ecosystem services provide many functions to human life [4]. Costanza et al. [3] identified 17 functions that are derived from ecosystem services necessary for the survival and well-being of human life. Urban ecosystem services play an essential role in connecting cities with the biosphere and to reduce the ecological footprint and ecological debt of cities and at the same time enhance urban public health, resilience, and quality of urban life [5]. Urban ecosystem services contribute directly or indirectly to human well-being providing many functions, including food supply, water supply, waste treatment, regulation of the urban heat island effect, clean air, water filtration, noise reduction, pollination, and climate regulation, etc. [5,6,7,8]. A healthy ecosystem can also ensure urban sustainability and contribute to achieving sustainable development [9,10].
However, due to the rapid urbanization, sustained population growth, migration, climate change, and industrialization, urban ecosystem services are threatened, and there is the likelihood that the available urban ecosystem services may not withstand such pressure [11,12]. Over the past fifty years, ecosystems have been changed by human activities more extensively and rapidly to meet the growing demands of habitation, food, fiber, fresh water, and fuel resulting in an irreversible loss in the ecosystem services. The degradation of ecosystem services is an obvious barrier to achieving the Millennium Development Goals [13]. A vulnerable urban ecosystem will lead to environmental pollution, biodiversity decline, land degradation, extreme climatic events, developing urban heat island effect, threaten public health, human safety, and global ecological security [13,14,15]. Against this background, protecting the urban ecosystem becomes one of the essential steps to achieve sustainability [15,16].
Urban ecosystem services are affected by many anthropogenic activities and natural events. Land use and land cover (LULC) changes (e.g., from forest and vegetation to built-up area), resulting from socioeconomic and physical development, is one of the important human activities which is responsible for dynamics in urban ecosystem services [17,18,19]. However, due to the rapid urbanization, population migration, the intensity, speed, and degree of LULC changes are faster compared to the past [20]. The spatial pattern of LULC change in an urban area affects the urban ecosystem services in many ways. For example, conversion of wetland to the built-up area for human habitation will lead to urban flooding due to rainfall. However, there exists space-time variation in the impacts of LULC change on urban ecosystem services [21,22,23]. The monitoring of the health of urban ecosystem services, understanding of its relationship with human well-being in cities is of great interest among the researchers and urban policy makers to promote coordinated urban development warranting social interest, urban economy, and environment [14,19,24].
In the literature, there exist several methods to evaluate terrestrial ecosystem services. These methods are broadly classified into four groups: (a) revealed preference approaches; (b) stated preference approaches; (c) cost-based approaches; and (d) the benefits transfer method (BTM). The BTM, developed by Costanza et al. [3] in 1997 is the most common method used globally to value ecosystem services. In their work, they classified global ecosystems into 16 biomes. They further identified 17 functions that are derived from those 16 ecosystems services. Using the benefits transfer method, they estimated global ecosystem service value (ESV) with an average of USD 33 trillion (in 1995) per year. After their successful estimation of global ESV, attention towards ecosystem service valuation has been increased globally among researchers [25,26,27,28,29]. For example, Lin et al. [30] examined the influence of LULC changes on ecosystem service in Chengdu city, China; Hein et al. [31] analyzed the spatial scale of ecosystem services and studied how stakeholders assign value to different ecosystem services based on the spatial scale; Tolessa et al. [17] monitored the impact of land use/land cover change on ecosystem services in the central highlands of Ethiopia. Estoque and Murayama [32] examined the potential impact of LULC change on the ecosystem services of Baguio city, the Philippines, and observed a substantial decrease in ESV due to change of agricultural and forest land to the built-up area.
Bangladesh is an agroeconomy-based developing country with a high population density and one of the most vulnerable countries to climate change and disaster risk [33]. However, in the past decade, Bangladesh has made remarkable progress in sustained economic growth and development. Over the past decade, it becomes one of the fastest-growing economies in Asia and even in the world [34]. Different studies showed that, in past decades, due to rapid urbanization, economic growth, sea-level rise, climate change, and natural disaster, urban areas, Dhaka, the capital city of the country, has experienced remarkable LULC changes [35,36,37]. It is argued that unplanned changes in LULC will dismantle the urban ecosystem, leading to environmental degradation, air and water pollution, the urban heat island effect, urban disturbance, social and economic burden, all hampering human well-being and public health [38,39]. For example, in past decades, Dhaka has developed a large amount of built-up area at the expense of wetland. Due to this transformation, the natural landscape was disturbed, and as a result, Dhaka faces waterlogging and rainfall-induced urban flooding, which cause enormous problems to urban people. Similarly, the present scenario of air pollution and water pollution in Dhaka is the consequence of an endangered urban ecosystem [40,41,42].
In response to the above, some researchers studied the nexus between LULC change and ecosystem services in Bangladesh. For example, Hoque et al. [43] studied the future impact of land use/land cover changes on ecosystem services in the lower Meghna river estuary of Bangladesh. Their findings revealed that rural and urban settlement in the lower Meghna estuary had increased at the expense of agricultural and mangrove forest lands, leading to a total ESV decrease of US$105.34 million during 1988–2018. Akber et al. [44] assessed the impact of land use change on ecosystem services (ES) of southwest coastal Bangladesh. Their results revealed that agricultural land decreased by 253,928 ha, resulting in a loss of ESV US$ 1.41 billion during the period 1980–2016. The study of Huq et al. [45] analyzed the interactions between freshwater ecosystem services and land cover changes in southern Bangladesh. Their results showed that during the period 1973 to 2014, substantial land cover transformations occurred, e.g., an increase of agricultural land, rural vegetation with settlement (RVS) in exchange for wetlands resulting in USD 1.06 billion worth of freshwater ecosystem services loss. The above studies mainly focused on coastal areas of Bangladesh but not on the cities. Zinia and McShane [46] evaluated urban ecosystem services in Dhaka on the basis of household surveys, field-level observation, interviews, and discussion with experts and local people. They mainly identified and mapped available urban ecosystems and conducted inventory analysis. Their work did not consider the impact of LULC change on ESV.
According to the literature, there is insufficient work evaluating the impact of LULC changes on urban ecosystem services, especially the use of satellite image-derived LULC change for urban ecosystem service assessment is very limited locally and globally. Although there are some studies conducted in urban areas or cities globally, the LULC characteristics of those urban areas or cities are different from that of Bangladesh. For example, the study of Lin et al. [30] examined the influence of LULC changes on ecosystem service in Chengdu city, where the agricultural land and built-up area occupied about 51.86% and 18.16% of the total land respectively in 2018. On the other hand, Dhaka occupied 8.08% and 51.85% of Bangladesh’s agricultural land and built-up area respectively in 2020. Although there are many separate studies on LULC change and ecosystem services valuation in Bangladesh, there is limited research that focuses on the influence of LULC change on urban ecosystem services. According to the literature, there is no previous study in Dhaka analyzing the impact of LULC change on ecosystem services. Thus, this study is the first of its kind to assess the impact of LULC changes on ecosystem services using satellite images. In the view of above, this study aims (1) to analyze the LULC change dynamics of Dhaka during the period from 1990 to 2020; (2) to estimate and map the total ESV over the study period; (3) to assess the value of individual ecosystem service functions; and (4) to assess the impact of LULC change on ESV through determining the elasticity of ESV in response to LULC change.

2. Materials and Methods

2.1. Study Area

The study was conducted in Dhaka, Bangladesh. The city is centrally located in Bangladesh and lies between 23.67° and 23.90° N in latitude and 90.33° and 90.51° E in longitude, and has an area of 305.82 km2. The study area covers the Dhaka metropolitan police (DMP) area (Figure 1). The topography of the city is predominantly flat, having a mean surface elevation of 15 m. The city is surrounded by three major rivers, namely the Turag to the northwest, Buriganga-Dhaleshwari to the south, and Shitallakhya-Balu to the east. Dhaka is the capital of Bangladesh and the center of the national government, trade, and culture. It is the largest city in Bangladesh and in Eastern South Asia. It is also considered as one of the major cities in South Asia due to its urban character and socioeconomic and political diversity.
Dhaka is one of the largest and densely populated megacities of the world [47]. The city is the home of more than 11 million people within a total land area of about 305.82 km2. According to Demographia World Urban Areas, as of May 2021, Dhaka is the first-ranked high-density city in the world, having 36,941 people per square kilometer. The population growth rate in Dhaka is about 3.5% in 2021, which is one of the highest growth rates amongst the most Asian cities [48]. This high level of population growth rate is the reflection of rural–urban migration in Dhaka. The vibrant culture, business opportunities, income opportunities, health, and education facilities, etc., have contributed to the increasing migration and population growth in Dhaka.
Dhaka experiences a tropical wet, dry, and monsoon climate, having an average temperature of 25 °C (77 °F) and monthly means varying between 18 °C (64 °F) in January and 29 °C (84 °F) in August. The annual rainfall of Dhaka ranges between 1169 mm to 3028 mm, and the yearly average rainfall is about 2076 mm. About 80% of the average annual rainfall of 1854 mm occurs through the monsoon period, spanning from May to the end of September [49]. Due to the ever-increasing population in Dhaka, the air and water are becoming polluted beyond the acceptable level, wetland and green space are being occupied by multistory buildings and real estate developments to fulfill the needs of the increasing population, which, in turn, threatened the overall environment, biodiversity, and urban ecosystem of Dhaka.

2.2. Datasets

This study focuses on the valuation of urban ecosystem services based on land use land cover (LULC) change. Thus, LULC is the core data for this study, and this LULC data has been derived from satellite images. This study uses time-series datasets from Landsat-5, Landsat-7, and Landsat-8. Landsat satellite images for the years 1990, 1995, 2000, 2005, 2010, 2015, and 2020 were downloaded from US Geological Survey (USGS) official website (https://earthexplorer.usgs.gov/, accessed on 28 July 2021). Table 1 presents the detailed description of Landsat images used for this study.
The whole study area lies at the intersection of Landsat path 137 and row 44. The downloaded images had a built-in projection system of the Universal Transverse Mercator (UTM) projection within Zone 46 North based on the World Geodetic System (WGS)—1984 datum. The spatial resolution of the images used for this study is 30 × 30 m per pixel. Since the temporal variation might affect the spectral reflectance of the Earth’s surface, similar dated images were downloaded to avoid such variation. We selected Landsat data for the month of November in each year except 1990 because the cloud-free images were available in the month of November. In addition, there was no rain during November, this ensures the actual presence of waterbodies. If images were taken during rainy season, some low land could have been identified as wetland/waterbodies although those were not actual waterbodies. Therefore, we had selected data for the month of November. In 1990, there were no cloud-free images available for the month of November, so in that case, we took image for the month of December.

2.3. Landsat Image Processing

Landsat data product has a different level of processing. In this study, we have downloaded Level-1 precision and terrain corrected (L1TP) and cloud-free multispectral images. L1TP images are radiometrically calibrated and orthorectified using ground control points (GCPs) and digital elevation model (DEM) to correct for relief displacement. The highest-quality level-1 products are suitable for pixel-level time series analysis. L1TP is geometrically corrected; hence no further processing for geometric correction is required for Landsat images [50]. The raw images contain a digital number (DN) value for each pixel. However, these DN values do not reflect the actual earth surface characteristics due to atmospheric effects and solar angle. The reflected or emitted electromagnetic radiation (EMR) from features on the Earth’s surface area is influenced by distortions due to the sensor, solar, atmospheric, and topographic effects. Thus, the satellite sensor does not receive the actual reflected signal from the earth’s surface [51]. Therefore, preprocessing is required to minimize these effects, depending on remote sensing applications. Most pre-processing focuses on radiometric and atmospheric correction to improve the accuracy of surface reflectance, emittance, and back scattering measurements. Many atmospheric models are available to correct the radiometric error, such as 6S (second simulation of the satellite signal in the solar spectrum) and MODTRAN (moderate resolution atmospheric radiance and transmittance), atmospheric correction for flat terrain (ATCOR2), fast line-of-sight atmospheric analysis of spectral hypercubes (FLAASH), simple dark object subtraction (SDOS), dark object subtraction (DOS), and cosine estimation of atmospheric transmittance (COST) [52]]. In this study, we have applied COST model for radiometric correction of images because the COST model is entirely based on image characteristics and was developed to account for multiplicative effects of atmospheric scattering and absorption [51]. The COST model also performs well compared to other models [53] and is available in many image processing software. Three-step procedures were performed to convert DN values to surface reflectance through radiometric correction. These steps are (a) conversion of DN values to spectral radiance at the sensor, (b) conversion of spectral radiance to reflectance at the sensor, and (c) atmospheric correction and conversion of sensor reflectance to surface reflectance. We a applied COST model for radiometric correction using the radCor() function of RStoolbox in R software [54].

2.4. Classification of Land Use and Land Cover (LULC)

The surface reflectance value acquired after preprocessing through a radiometric and atmospheric correction in the earlier step was used to derive LULC maps. We used an unsupervised classification method to classify Landsat images into five broad LULC classes. These LULC classes are (a) built-up area; (b) vegetation; (c) bare land; (d) waterbody; (e) agricultural land. The definition of these LULC classes are presented in Table 2. These LULC categories have been selected considering biome types used to calculate ecosystem value.
We used the unsupervised classification method because this method has some advantages over the supervised classification method. This method is comparatively quick and easy to run and does not require extensive prior knowledge about the area. In the unsupervised method, classes are created completely based on spectral information of the images and, thus, are not subject to visual interpretation [55]. In this method, the interpreter has to define the number of classes, and the software automatically groups the pixels of similar spectral properties into the number of classes previously defined by the user [56]. One of the disadvantages of this method is that spectral reflectance does not always correspond to the informational category. This mostly happens to the pixels having values like two adjacent classes. This problem can be solved by determining the optimal number of classes through an iterative process [57].
Different clustering algorithms are available to classify land cover using an unsupervised method. Popular clustering algorithms include interactive self-organization data analysis (ISODATA), clustering large applications (CLARA), mean-shift clustering, agglomerative hierarchical clustering (AHC), partitioning around medoids (PAM), random forest, and k-means clustering, etc. [58,59,60,61]. Amongst, K-means clustering is one of the most commonly used unsupervised clustering algorithms used to classify LULC. Considering its popularity, we have used a k-means clustering algorithm using R software [54] to classify processed Landsat images into five LULC classes. In K-means clustering, data are partitioned into a set of k groups or clusters where k represents the number of clusters predefined by the analyst. K-means clustering classifies data in such a way that data within the same cluster are as similar as possible, whereas data from the different clusters are as dissimilar as possible [62].
As mentioned earlier, determining the optimal number of clusters is a fundamental issue in k-means clustering. Because the performance and accuracy are associated with determining the number of clusters. An optimal number of clusters prevents misclassification of the dataset. There are several methods to determine the optimal number of classes. Among them, three methods are popular; these are elbow, silhouette, and gap statistic methods [63]. We used the elbow method to determine the optimal number of clusters and identified that eight is the optimal number of classes for our dataset, although our required number of LULC classes is five. So, we first applied k-means clustering with k=8, and then we regrouped the class into five LULC classes.
‘Salt-and-pepper’ noise was observed in the classified images. Some misclassifications were identified in the classified images. Since Landsat images have low resolution, such misclassification and ‘salt-and-pepper’ noises are common. Hence, some degree of postprocessing is required to eliminate ‘salt-and-pepper’ and misclassification. To remove the ‘salt-and-pepper’ noise, we applied a 3 × 3 majority filter in ArcGIS 10.8 software. The classified raster images were then vectorized to manually rectify the localized error due to misclassification. This output has been used to create the final version of LULC maps for the different time periods. After removing the localized error, the vectorized images were converted to raster images again for accuracy assessment.
Accuracy assessment was done using the Google Earth platform. Classified images were compared to corresponding land cover in Google Earth for accuracy assessment. It is recommended that about 50 random points for each land use class are required to assess the classification accuracy if the study area is less than 1 million acres and the land cover category is less than 12 classes [64]. In our case, the size of the study area was 75,569.77 acres, and the number of LULC classes was five. The minimum sampling point is 250 for the assessment of classification accuracy. We generated 300 random sampling points using the stratified sampling technique in ArcGIS 10.8. Overall classification accuracies of the classified images for the year 1990, 1995, 2000, 2005, 2010, 2015, and 2020 were 91.00%, 85.60%, 89.70%, 86.80%, 85.80%, 88.00%, and 89.70% with kappa coefficients of 0.859, 0.758, 0.865, 0.795, 0.786, 0.854, and 0.795.
In addition to quantifying the LULC type, we also analyzed the LULC change over the study period since LULC changes influence ecosystem services and their function. We used the land-use dynamic index to understand the LULC changes over time [65]. Land-use dynamic index was calculated using the following Equation (1).
K = A j A i A i × 1 T × 100 %
where K indicates the land-use dynamic index for a single LULC type, A i and A j are the initial and final area of specific LULC type, respectively, and T is the study period.

2.5. Assignment of Ecosystem Services Values (ESV)

Ecosystem service valuation has received much attention, and it has been used globally to understand the multiple benefits offered by ecosystem services. A lot of studies have been conducted to estimate the value of ecosystem services in the past few decades, including the economic valuation of tropical forests, endangered species management, and protected areas. However, the ecosystem service valuation model presented by Costanza et al. [3] is considered as the robust method to estimate the economic value of ecosystem services. They identified 17 ecosystem services from 16 biomes in order to calculate ESV. Using the benefits transfer method (BTM), they estimated global economic values for those ecosystem services based on existing literature and original calculations. Since then, this method has been used by many studies globally to assess ecosystem services. Although the method presented by Costanza et al. [3] received some critiques due to low estimate of farmland unit value and uncertainties, the model presents the most comprehensive set of initial approximations for ecosystem service valuation. Therefore, we used this method in our study for the valuation of ecosystem services for Dhaka. To obtain the values of ecosystem services for each of the five LULC categories in Dhaka, we compared the five categories of LULC with 16 biomes identified in Costanza et al. [3]. The most relevant biome for each category was assigned as the proxy for that LULC type. For example, ‘cropland’ biome for ‘agricultural land’, ‘wetland’ for ‘water body’, ‘tropical forest’ for ‘forest and vegetation’, ‘urban’ for ‘built-up area’, ‘desert’ for ‘bare land’ were assigned for the proxy to calculate the value of ecosystem service for each land use type. In our case, most of the waterbodies are wetlands, and a negligible portion belongs to shallow lakes/river. Therefore, we assigned waterbodies as ’wetlands’ instead of lakes/rivers. Although the LULC categories and equivalent biomes do not perfectly match, their use proved feasible in many other studies [17,66,67,68]. LULC types, equivalent biome, and corresponding value coefficient are presented in Table 3.

2.6. Calculation of Ecosystem Services Values

Based on the value coefficient in Table 3, the total value of ESV was calculated by multiplying land area with value coefficient according to the following Equation (2) [69,70].
E S V = A k × V C k
where ESV is the total estimated value of ecosystem service, A k is the area in hectare and V C k is the value coefficient US   $   h a 1 y r 1 for each LULC category ‘k’. In order to determine the change in ecosystem service value, we calculated the differences between the estimated ESV for each LULC category for the year 1990, 1995, 2000, 2005, 2010, 2015, and 2020. We estimated the ESV change rate using the following Equation (3).
E S V c r = E S V j E S V i E S V i × 1 T × 100 %
where E S V c r refers to the yearly ESV change rate for a single LULC type, E S V i and E S V j are the initial and final ecosystem service value, and T is the study period.
In addition to calculating the ESV for each LULC category and estimating the effect of LULC change on total ESV, we also estimated the value of 17 ecosystem functions provided by each biome using the following Equation (4) [68].
S V f = A k × V C f k
where, E S V f is the estimated value of ecosystem service function f, A k is the area (ha) and V C f k is the value coefficient of function f US   $   h a 1 y r 1 for each LULC category ‘k’. The value coefficient for each individual function was obtained from Table 2 in Costanza et al. [3].

2.7. Calculating Elasticity of ESV Due to LULC Changes

Elasticity describes how well one variable responds in relation to the changes in another variable. To understand how total ESV changes due to the change of LULC, we calculated the elasticity of ESV. The elasticity of ESV in relation to LULC changes measures the percentage change of ESV in response to the percentage change in LULC. The elasticity of ESV was calculated using the following Equations (5) and (6) [30].
E E L = E S V j E S V i E S V i × 1 T × 100 % L T P
L T P = n = 1 n L C A i n = 1 n L C A i × 1 T × 100 %
In the above equations, EEL is the elasticity of total ESV in relation to LULC changes, E S V i and E S V j are the initial and final ecosystem service value, and T is the study period. LTP is the percentage of land transition which implies the degree of LULC changes, L C A i is the changes of LULC category i during the study period and L C A i is the area of lULC category of i .

2.8. Sensitivity Analysis

In the early step, we made a similarity check of our five LULC categories with 16 biomes identified by Costanza et al. [3], and the most similar biome was assigned to the corresponding LULC category as the proxy, but the biomes used as the proxies are not perfect matches of each LULC category; thus, there exist uncertainties in the coefficient values used to calculate ESV. Hence, sensitivity analysis is necessary to determine the level of dependence of total ESV due to a change in the coefficient value of a specific LULC type. Coefficient of sensitivity (CS) is a measure to verify the effective representation of biomes and the accuracy of the corresponding value coefficient in various LULC categories. We used the standard economic concept of elasticity to calculate CS as per the following Equation (7) [68,69].
C S = E S V j E S V i / E S V i V C j k V C i k / V C i k
where ESV and VC refer to estimated total ecosystem service value and value coefficient, respectively; i and j represent the initial and adjusted value, and k represents the specific LULC type. The value coefficient of each LULC category was adjusted by ± 50 % to calculate the adjusted ESV and CS. By calculating the value of CS, we can understand the dependence level of change in the total ESV due to the change in the value coefficient of a specific LULC type. If CS is less than 1, then the estimated ESV is inelastic with respect to value coefficient, and if CS is greater than 1, the calculated ESV is considered to be elastic. If the estimated ESV with respect to value coefficient is inelastic, then the representation of proxies and associated estimated ESV are reliable. In many previous studies, sensitivity analysis was widely used to understand the change in ESV due to change in value coefficient [71,72,73,74].

3. Results

3.1. Land Use Land Cover Change

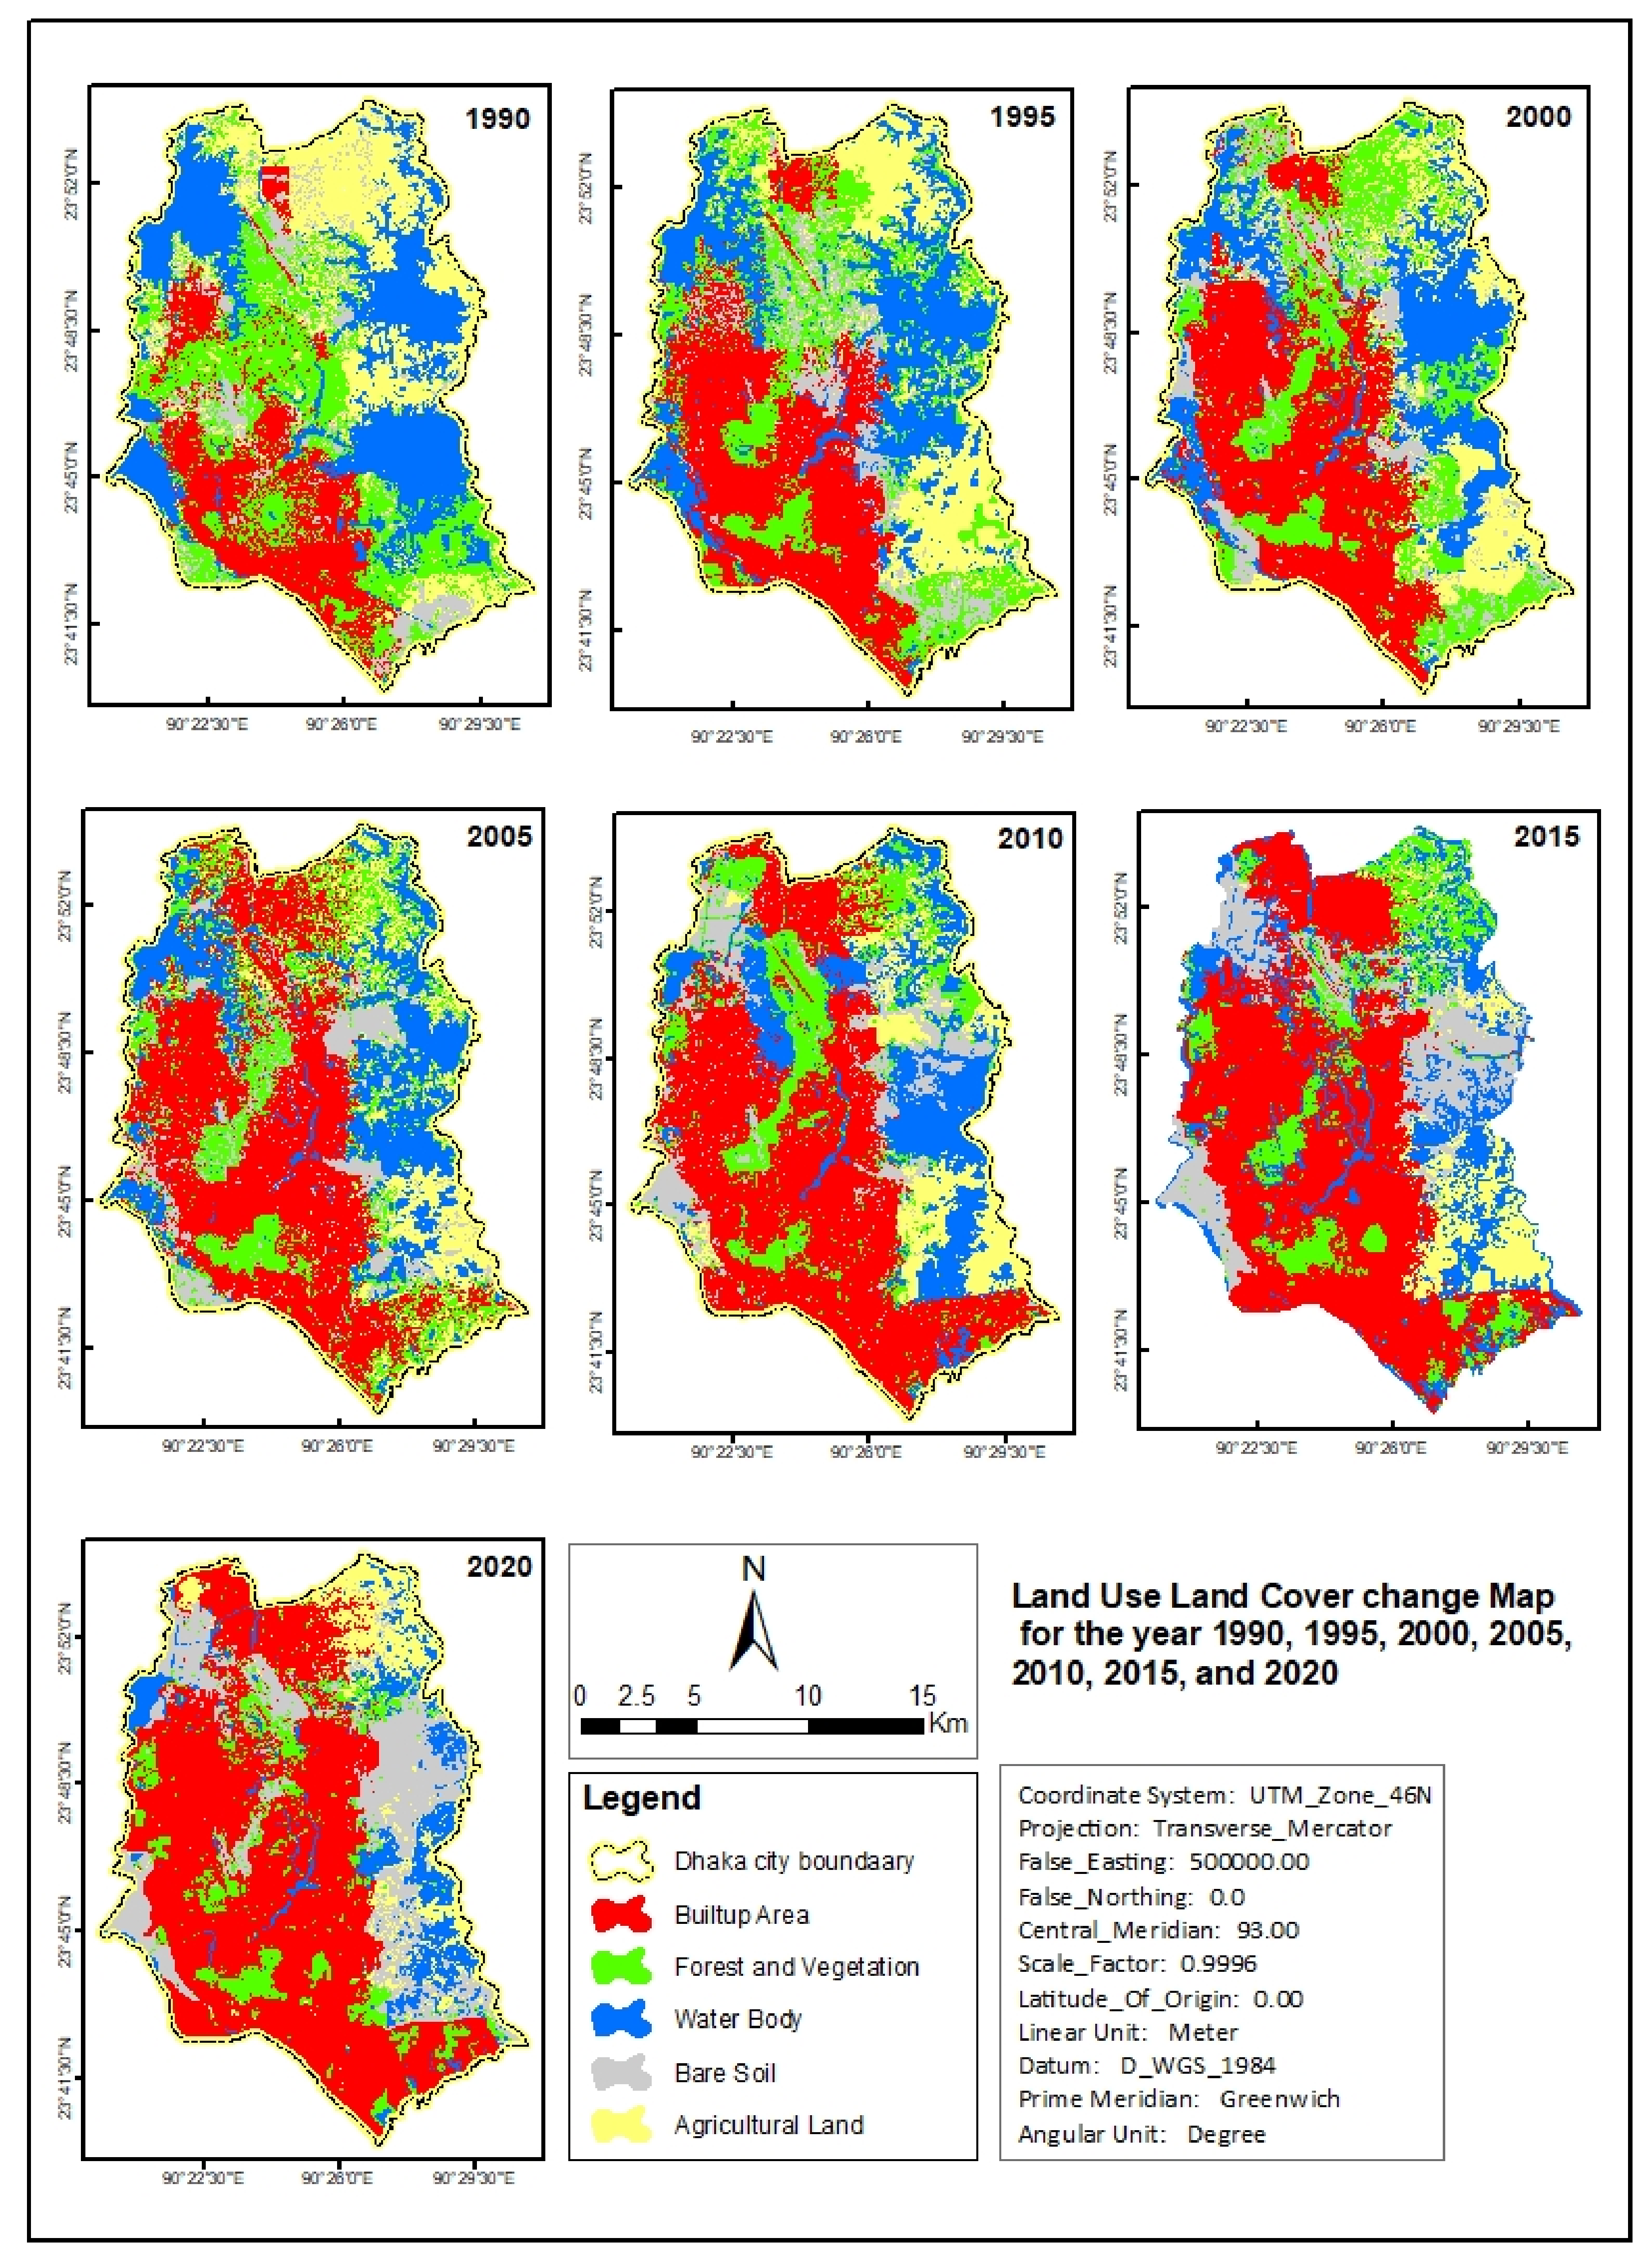
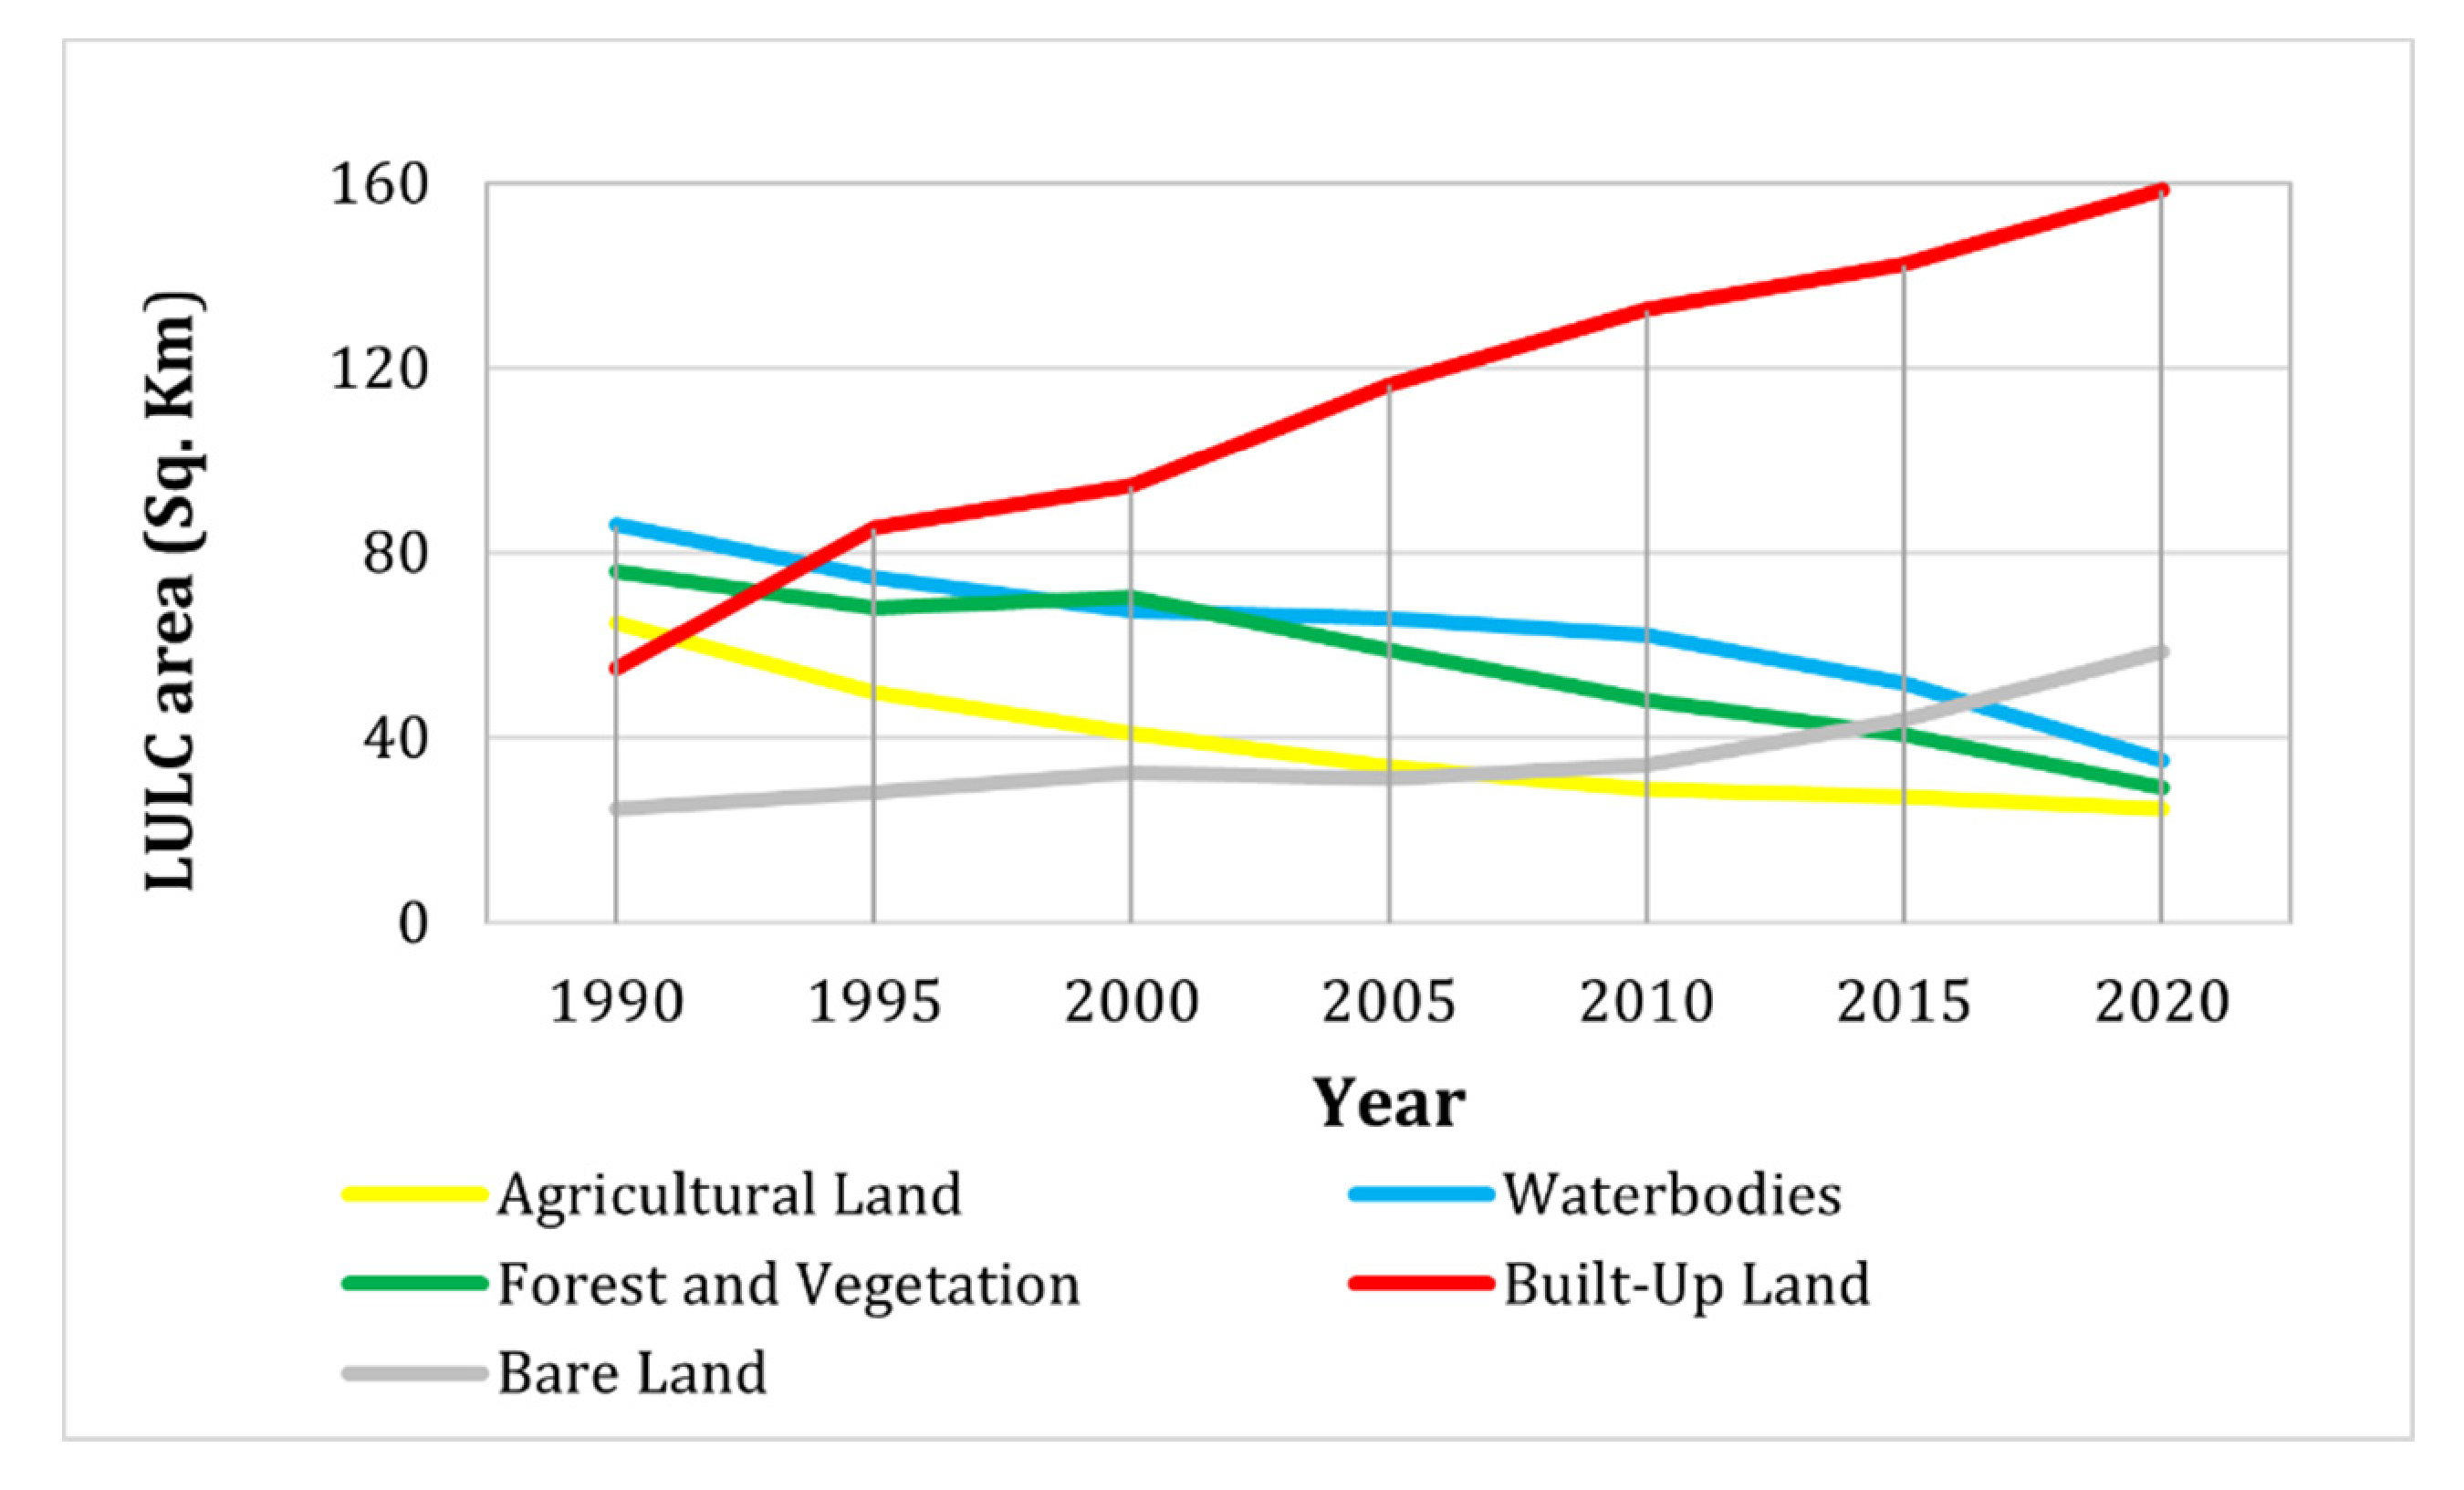
Spatial distribution and trend of LULC changes of Dhaka for the last three decades have been presented in Figure 2 and Figure 3. Figure 2 illustrates that, in 1990, the built-up area was spatially distributed along the southern part of Dhaka, which extends towards the northwest direction over the past 30 years. Initially, agricultural land was distributed over the northern part of the city, but in the course of time some portion of the forest and vegetation area in the southeast part was converted into agricultural land, and later most agricultural land was converted to the built-up area. In 1990, forest and vegetation was distributed in the central part of the city, but most parts of it have been replaced by built-up area in the past 30 years. Figure 2 illustrates that most parts of the different LULC types were converted to the built-up area during the period 1990 to 2020. This transition is the result of the high urbanization rate in Dhaka.
Figure 3 shows the trends of LULC changes of Dhaka during the period from 1990 to 2020. From this figure, two trends of LULC change are evidently identifiable. Firstly, agricultural land, waterbodies, and forest and vegetation show a gradual decrease over the last three decades; secondly, built-up area and bare land show a gradual increase over the period. These trends imply that a considerable portion of agricultural land, waterbodies, and forest and vegetation were occupied by built-up area and bare land in the study area in the past 30 years.
Table 4 shows the distribution of different LULC types during the period 1990 to 2020 in the study area. In 1990, the dominant LULC type was waterbodies (85.85 km2), and the lowest portion of land remained bare land (24.52 km2), whereas in 2020, the highest amount was land was allocated to the built-up area, and the lowest amount of land was occupied by agricultural land. However, except in 1990, the built-up area constituted the dominant LULC type up to 2020, having a proportion of about 27.88%, 30.91%, 38.09%, 43.38%, 46.57%m and 51.85% 1995, 2000, 2005, 2010, 2015, and 2020 respectively.
We also calculated the land use change dynamic index (k) according to Equation (1) to understand the annual rate of changes of different LULC types in the different study periods. Table 5 shows the value of k in which the “–” sign indicates the decrease and others indicate an increase in LULC changes. From Table 5, it can be seen that agricultural land, waterbodies, forest and vegetation annually decreased by 2.06%, 1.98%, and 2.05% respectively from the period 1990 to 2020. On the other hand, built-up area and bare land annually increased by 6.28% and 4.61%, respectively, during the period 1990 to 2020.
It is also observed that the annual decreasing rate of agricultural land use change (4.66%) was highest during the period 1990–1995 and that of waterbodies (6.49%) and forest and vegetation (5.65%) during the period 2015–2020. The annual increase of built-up area change (11.01%) was highest during the period 1990–1995 and that of bare land (6.71%) during the period in 2015–2020. Figure 2 and Figure 3 and Table 4 show the spatial distribution and trend of LULC changes but do not provide the idea of how a particular LULC type was redistributed over the period. To understand this redistribution mechanism, we created a transition matrix using ArcGIS 10.8 software, which is presented in Table 6. This transition matrix shows how the different LULC types of the study area were redistributed during the period from 1990 to 2020.
Table 6 shows that built-up area occupied 9.18% (28.07 km2), 5.46% (16.70 km2), 15.58% (47.65 km2), and 5.39% (16.48 km2) area from agricultural land, waterbodies, forest and vegetation, and bare land during the period from 1990 to 2020, whereas it lost only 1.71% from its own. It can also be noted that, except waterbodies, the major portion of different LULC types was converted to the built-up area; a major portion of waterbodies (11.52%) was converted to bare land. Table 6 also implies that the forest and vegetation and waterbodies were the highest contributors (15.58% and 11.52%, respectively) of built-up area and bare land increase.

3.2. Variation in Ecosystem Services Value

3.2.1. Change in Ecosystem Service Value

In our study, we estimated the ESV of Dhaka for each LULC type based on Equation (2), ecosystem service value coefficient in Table 7, and area of different LULC types in Figure 3. Please note that we converted the measurement unit of land area from km2 to hectare since ecosystem service value coefficients were calculated based on the later unit of measurement [3]. The result of the estimated ESV has been presented in Table 7 and Table 8, Figure 4 and Figure 5. According to result, as presented in Table 7 and Figure 4, the total estimated ESV of Dhaka were 142.72, 124.47, 114.18, 109.12, 101.67, 84.84, and 57.72 million USD in the year 1990, 1995, 2000, 2005, 2010, 2015, and 2020 respectively. Table 7 clearly shows that waterbodies were the highest contributor to total ESV, followed by forest and vegetation, and agricultural land. On the other hand, built-up areas and bare land have no contribution to ESV.
According to Figure 4, the ESV trend of Dhaka shows a declining change process. A gradual decrease in ESV was observed for forest and vegetation, and agricultural land over the study period, and a sharp decrease in ESV was observed during the period 1990–2000 and 2010–2020. Since waterbodies were the highest contributor to total ESV, the characteristics of the total ESV change process are dominated by the characteristic change process of ESV derived from waterbodies.
To understand the yearly changes of ESV, we calculated the rate of annual changes for ESVs according to Equation (3). Table 8 shows the annual rate of changes of ESV for different LULC types during the period 1990 to 2020. The negative sign in the values represents the decrease in ESV. Table 8 shows the annual rate of ESV for agricultural land, waterbodies, forest and vegetation only; ESV changes for the built-up area and bare land are not present because they derive no ESV. It can be seen that ESV derived from agricultural land, forest and vegetation, and waterbodies annually decreased by 2.06%, 2.05%, and 1.98%, respectively, from the period 1990 to 2020.
It can also be observed that annual change in ESV from agricultural land use (4.66%) was highest during the period 1990–1995 and that of waterbodies (6.49%) and forest and vegetation (5.65%) during the period in 2015–2020. ESV derived from agricultural land decreased by 0.13 million USD during the period from 1990 to 1995. From 2015 to 2020, ESV derived from waterbodies and forest and vegetation reduced by 24.89 and 2.3 million USD, respectively. Table 8 shows that the annual rate of changes in total ESV of Dhaka were −2.56%, −1.65%, −0.89%, −1.37%, and −3.31% during the period 1990–1995, 1995–2000, 2000–2005, 2005–2010, 2010–2015, and 2015–2020 respectively. However, the overall annual rate of change was −1.99% from 1990 to 2020. During this period, about 85 million USD of total ESV of Dhaka lost. The highest decrease in total ESV was observed during the period 2015 to 2020, with an annual decrease of about 6.39%.
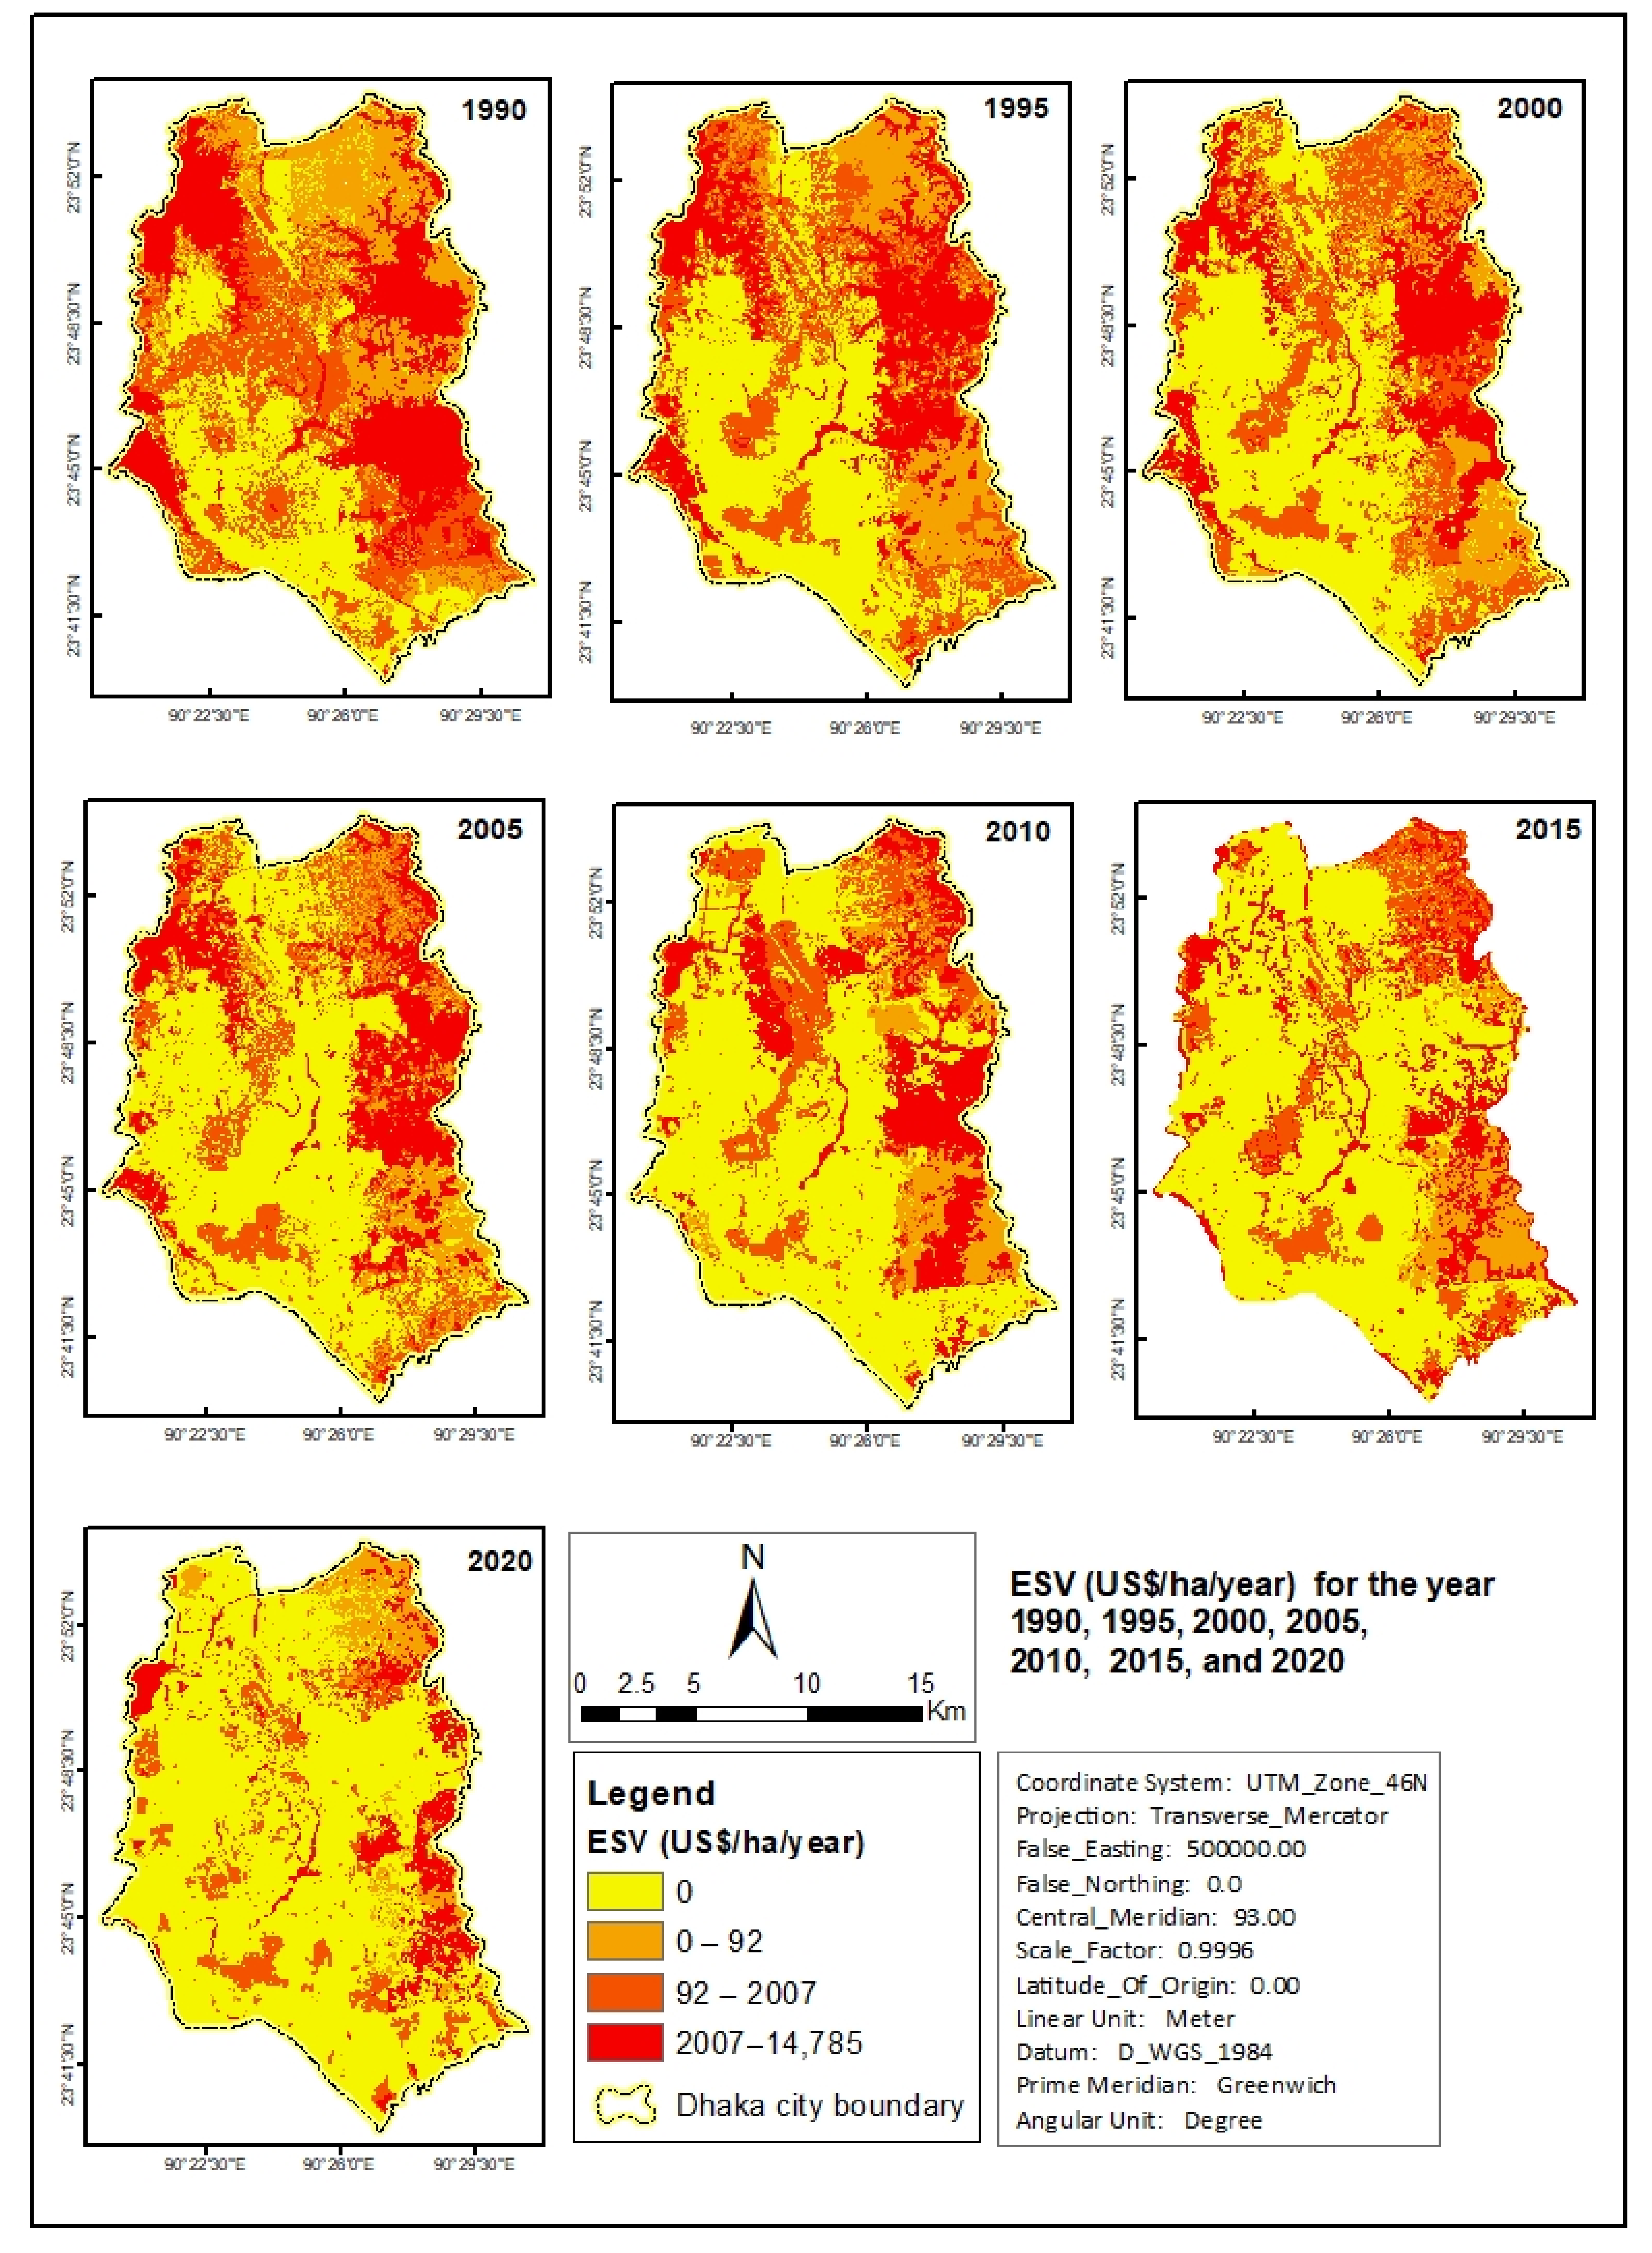
The spatial distribution of ESV of Dhaka for the years 1990, 1995, 2000, 2005, 2010, 2015, and 2020 are illustrated in Figure 5. This figure indicates that, in 1990, the value of ESV was higher throughout the city except for the southwestern part and part of the northern side. About 28.08% (85.85 km2) of the total area had ESV 14,785 USD/ha/year. The higher value of ESV was the result of the presence of waterbodies and forest and vegetation throughout the cities. In 1995, the value of ESV was decreased around the central part and western part of the city due to the encroachment of the forest and vegetation land by built-up areas. In 2000, the ESV in northeast part was slightly increased due to the conversion of agricultural land to forest and vegetation. The ESV, in 2005, experienced a considerable reduction in the northern part due to the conversion of forest and vegetation land to the built-up area. The ESV was considerably decreased along the eastern part in 2010 and in 2015 because a large portion of waterbodies and wetlands were converted to bare land. In 2020, the ESV decreased throughout the city resulting from the conversion of wetlands and waterbodies to bare land along the eastern side, forest and vegetation to bare land in the central part, and forest and vegetation to agricultural land. Only about 11.43% (34.94 km2) in area contains ESV 14,785 USD/ha/year in 2020.

3.2.2. Estimated Value of Individual Ecosystem Service Function

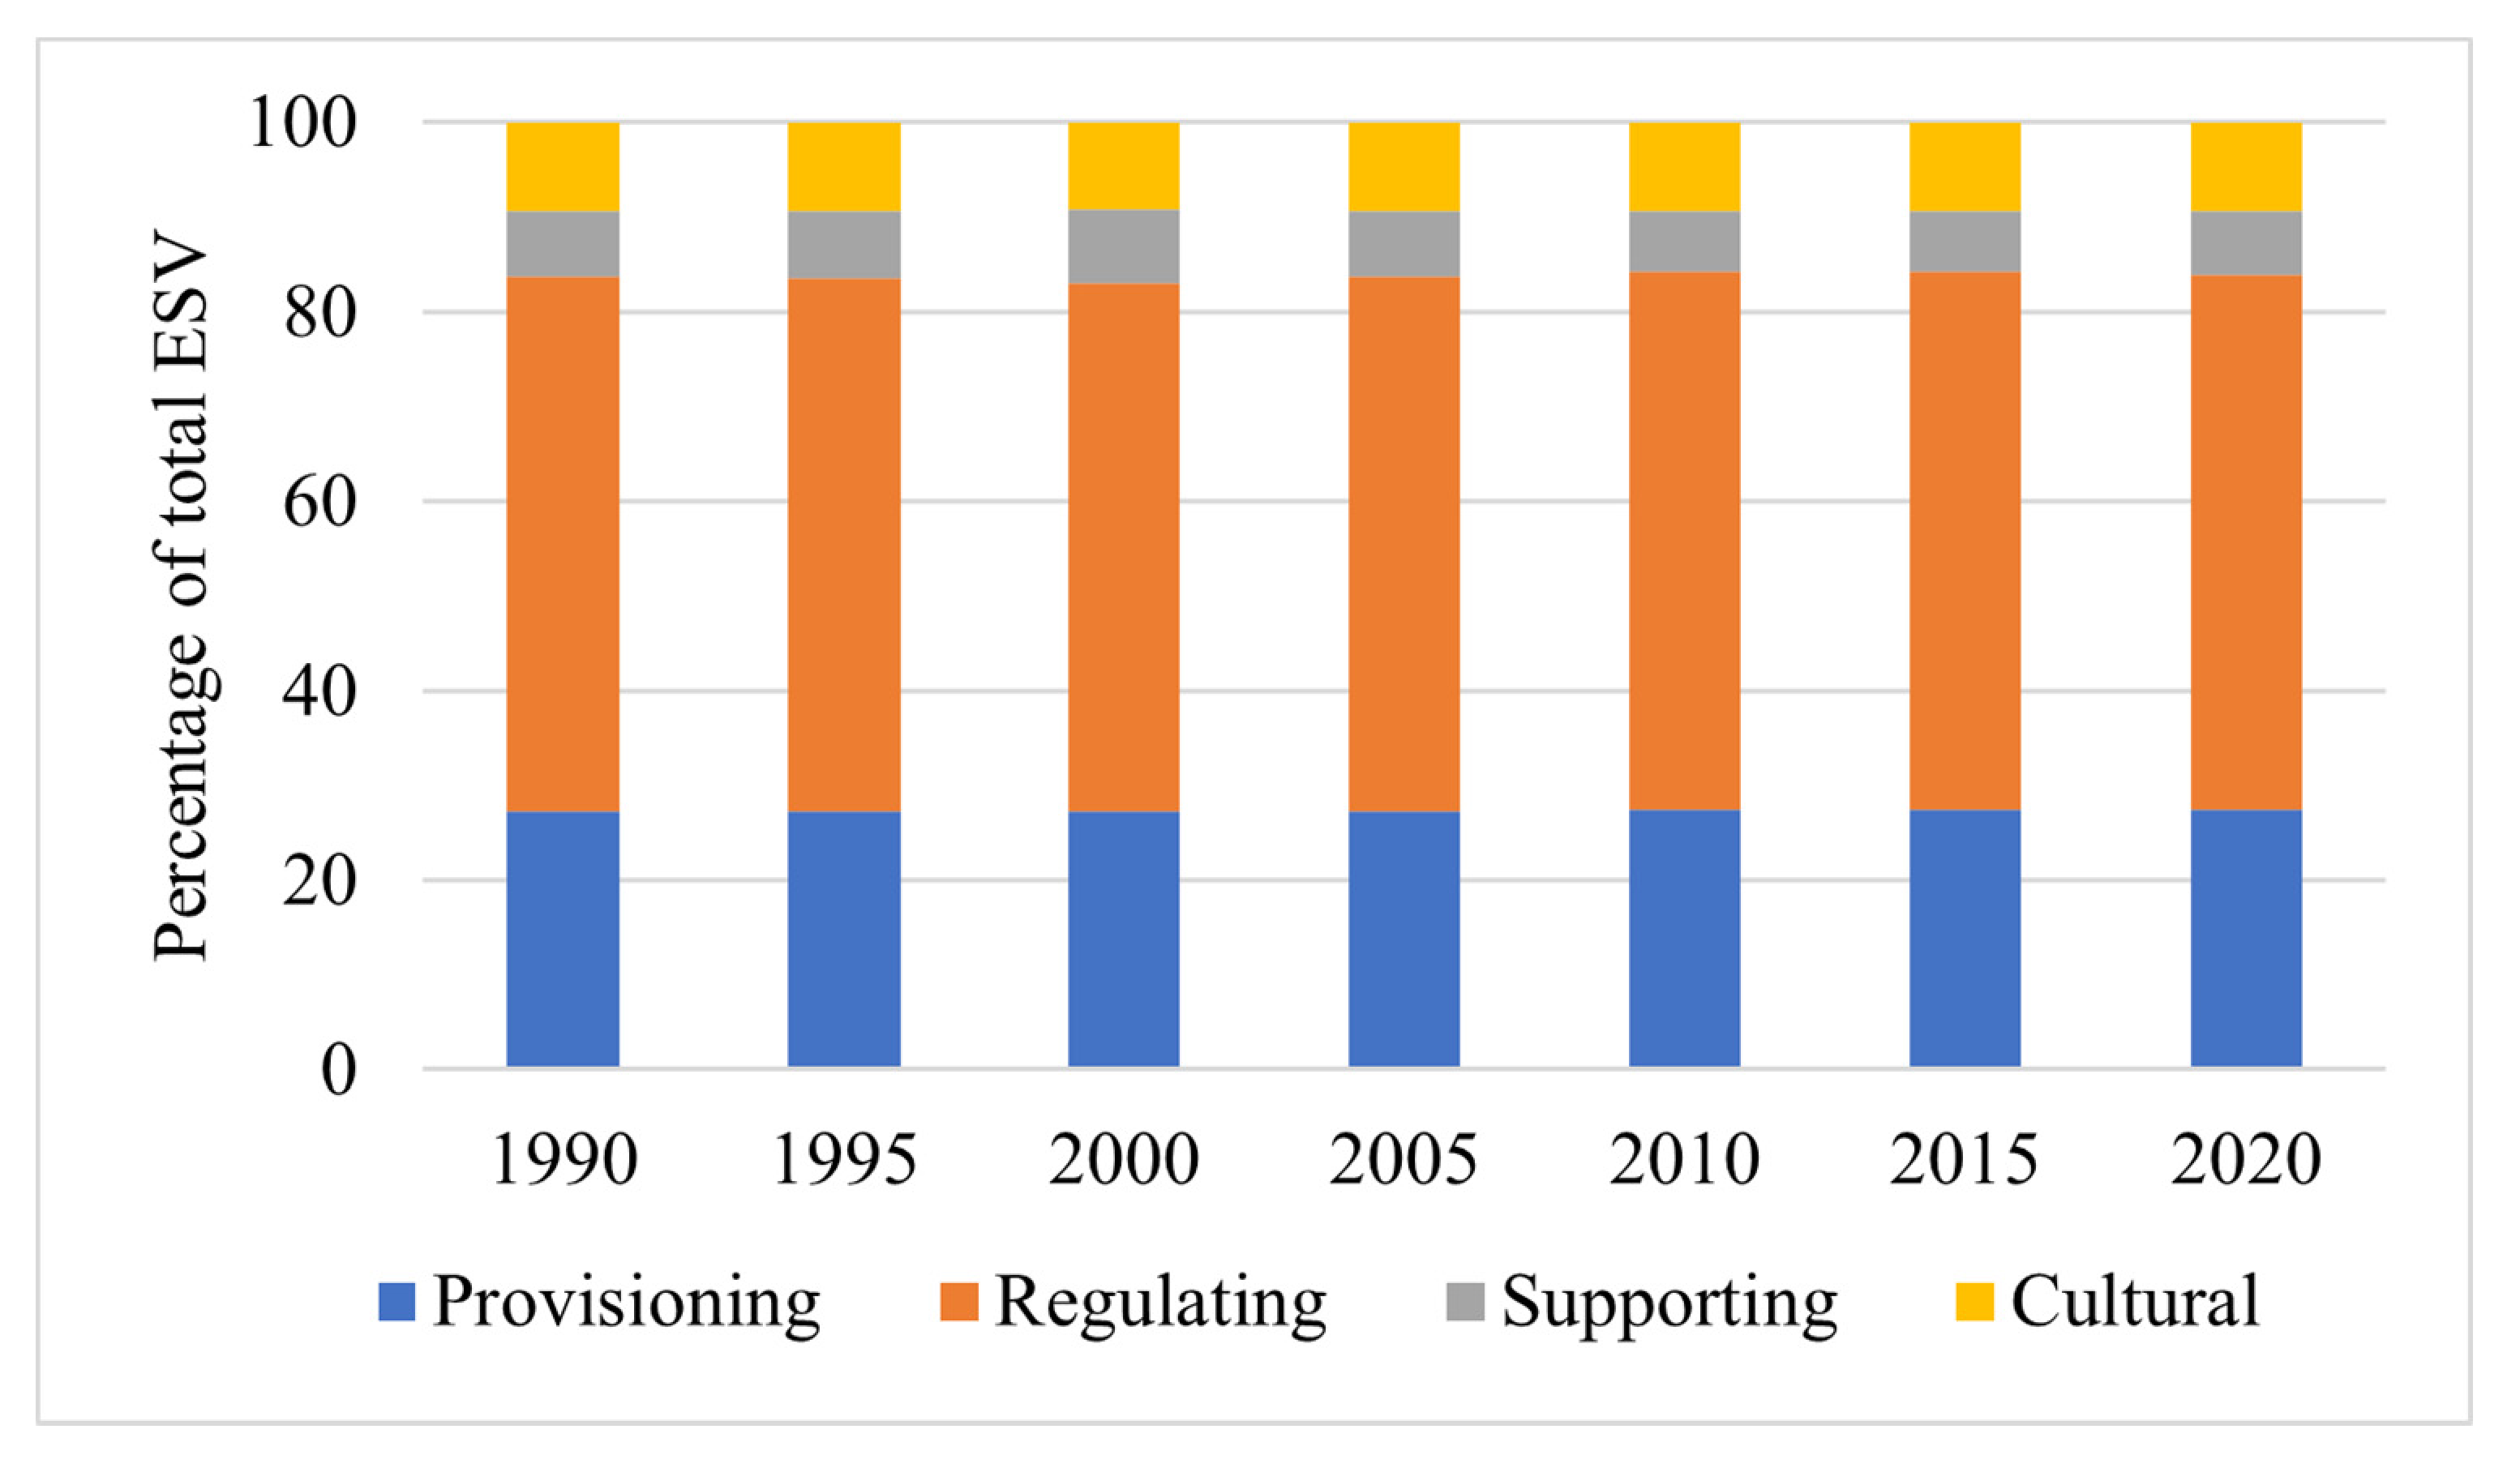
In this study, we estimated the value of 17 individual ecosystem functions based on Equation (4), the area of different LULC types in Figure 3, and the value coefficient of individual ecosystem functions provided in Table 2 in Costanza et al. [3]. In addition, we calculated the impact of LULC changes on the change of individual ecosystem function during the period 1990 to 2020. The values of 17 individual ecosystem functions are presented in Table 9. These 17 ecosystem services are grouped into four broad categories: provisioning, regulating, supporting, and cultural. The value of individual ecosystem function helps to understand the contribution of each ecosystem function to overall ESV. As shown in Figure 6, the regulating services are the major contributor to total ESV in the study area, followed by the provisioning, cultural and supporting services. The regulating services contributed about 56.43%, 56.34%, 55.91%, 56.42%, 56.85%, 56.80% and 56.60% of the total ESV in the year 1990, 1995, 2000, 2005, 2010, 2015, and 2020. In the case of provisioning services, they showed the highest contribution (27.42%) in 2020. Compared to regulating and provisioning services, the contribution of supporting services and cultural service to the total ESV is low: on average 6.79%, 9.37%, respectively.
According to Table 9, water supply, waste treatment, and disturbance regulation are three major contributors and share 22.90%, 25.60%, and 27.30% of total ESV, respectively, in 1990. Due to the large quantity of waterbodies and higher value of the coefficient, these three ecosystem functions generate higher ESV and contribute to the major portion of total ESV. Change in the value of individual ecosystem function were calculated during the period 1990–1995, 1995–2000, 2000–2005, 2005–2010, 2010–2015, 2015–2020 and are presented in Table 10.
According to Table 9 and Table 10, although the percentage of contribution to total ESV of major three ecosystem functions remained similar during the period 1990 to 2020, the quantity of the major ecosystem functions decreased by 59.31% (19.38 million USD), 59.34% (21.67 million USD), and 59.31% (23.13 million USD) respectively in 2020. The highest declines in the value of ESV for water supply (32.43%), waste treatment (32.37%), and disturbance regulation (32.43%) were observed during the period 2015–2020. In the case of supporting and cultural groups of ESV, nutrient cycling function and cultural function are the major contributors to the total ESV. They contributed about 4.89% (6.98 million USD) and 5.31% (7.58 million USD) to the total ESV in 1990. However, their contributions declined by 61.57% (4.30 million USD) and 59.31% (4.49 million USD) during the period 1990 to 2020.

3.2.3. Impact of LULC Change on ESV

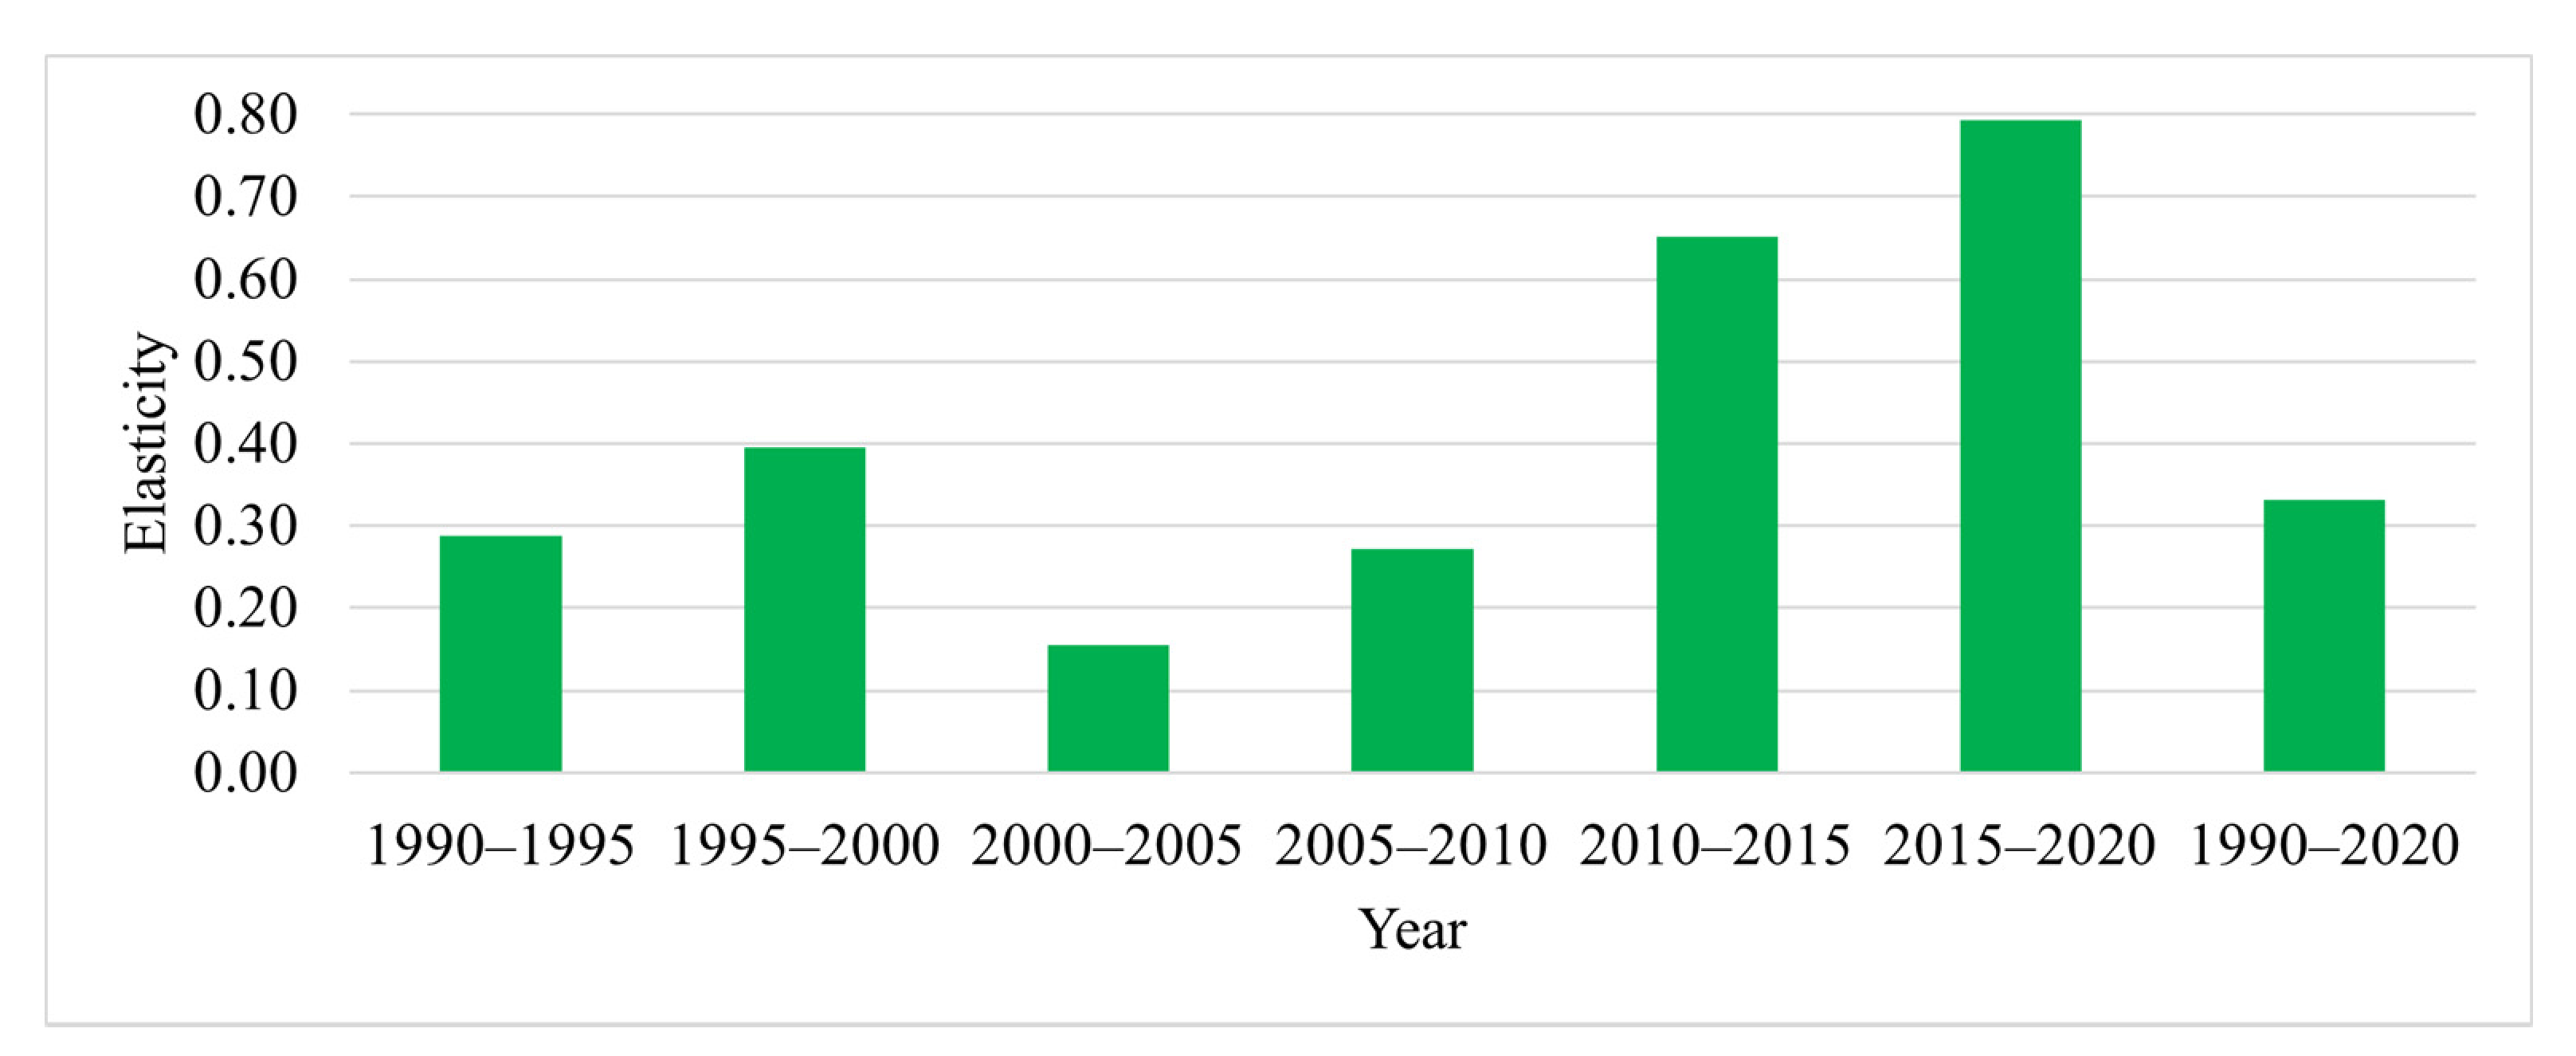
To understand the impact of LULC changes on the total ESV and their relationship, we have calculated the elasticity of ESV in response to LULC changes. The elasticity of ESV in response to LULC changes was calculated using Equation (5) and is presented in Figure 7. The figure shows that the elasticity of ESV in response to LULC changes were 0.29, 0.40, 0.15, 0.27, 0.65, 0.79, and 0.33 during the period, 1990–1995, 1995–2000, 2000–2005, 2005–2010, 2010–2015, 2015–2020, 1990–2020 respectively. The elasticity implies that 1% transition of LULC would result respectively in on average 0.29%, 0.40%, 0.15%, 0.27%, 0.65%, 0.79%, and 0.33% change of total ESV during the study period (Figure 7). As illustrated in Figure 7, the elasticity of ESV during the different time periods over 1990 to 2020 shows a fluctuating trend. The elasticity of ESV increased from 0.29 to 0.40 during the period 1990–2000; however, it declined during the period 2000–2005. After that, an increasing trend in the elasticity of ESV was observed during the period 2005 to 2020. The increasing trend of elasticity implies that ESV is becoming more sensitive to LULC changes with time. The highest elasticity of ESV was observed during the period 2015 to 2020. The elasticity of ESV implies the sensitivity of ESV in relation to LULC change. The higher the value of elasticity, the higher the sensitivity of ESV to LULC change. The higher value of elasticity of ESV during 2015–2020 implies that the greatest change in the ESV occurred during that period.
The impact and relationship between ESV and LULC can also be understood in Figure 8. Figure 8 shows that waterbodies, forest and vegetation, and agriculture had a positive impact upon ESV. On the other hand built-up areas and bare land negatively affect ESV. As shown in Figure 8, the trend between ESV and waterbodies is more similar compared to others which implies that waterbodies have a higher positive impact on ESV change compared to other LULC types. The higher impact of the water body is also justified due to its higher coefficient value and large area. Built-up areas and bare land have a negative impact upon ESV, causing the value of ESV to decrease. Although both of them have a negative impact, the built-up area is more responsible for reducing total ESV due to its larger area compared to bare land.

3.2.4. Sensitivity Analysis

In order to evaluate the reliability of the results, we performed a sensitivity analysis. We calculated the value of the coefficient of sensitivity (CS) based on Equation (7), considering ± 50 % adjustment in the original value coefficient proposed by Costanza et al. [3]. For the estimated ESV to be reliable, the value CS must be less than 1. If the value of CS is consistently lower than 1, then it is confirmed that the estimation of ESV was relatively inelastic in relation to the value of the coefficient, and the assignment of ecosystem service value coefficient was perfect. In our study, the value of CS was less than 1 (Table 11), which confirms that estimation of total ESV was inelastic in relation to the value coefficient (Table 3, proposed by Costanza et al. [3]. The CS for waterbodies was higher, about 0.9%, compared to agricultural land and forest and vegetation due to its high value of coefficient and large area. The lower value of CS of agricultural land and forest and vegetation implies that the adjustment in their value coefficient had very little impact on the estimation of ESV. Less than ± 0.2 % change was observed in total ESV due to ± 50 % change in the value coefficient for agricultural land, and about ± 5 % change was observed due to the ± 50 % change in the value coefficient for forest and vegetation.
On the other hand, the comparatively higher CS value of waterbodies implies that change in the value coefficient has a greater impact upon the estimation of ESV, ± 50 % change in the value coefficient resulted in about ± 44 % change in the estimated ESV. However, the sensitivity analysis in our study showed that the estimated ESV using the value coefficient in Table 3 is robust despite the uncertainties in the value coefficient.

4. Discussion

4.1. Land Use Land Cover Change Dynamics

This present study attempts to quantify the LULC dynamics and their impacts on urban ecosystem services in Dhaka during the past three decades from 1990 to 2020. Our findings regarding LULC change dynamics are in close conformity with the findings of other studies: (a) agricultural land, waterbodies, and forest and vegetation show a gradual decrease; and built-up area and bare land show a gradual increase over the study period [75]; (b) initially, the proportion of waterbodies/wetland was higher, and it decreases over time [35]; (c) built-up area continues to increase over time and dominates all other LULC types [75]; and (d) a considerable portion of agricultural land, waterbodies, and forest and vegetation have been replaced by built-up area and bare land during the study period [76,77].
LULC changes are dynamic and nonlinear, which means that transition of one land use from another does not follow similar pattern over the year due to many natural and manmade factors. During the study period, the built-up area increased by 188.35%. This increase was only possible at the expense of valuable agricultural land, waterbodies, and forest and vegetation. During the past three decades, the fringe area of Dhaka was rapidly developed through the conversion of wetland/ and agricultural land into built-up area, including housing, commercial activities, service facilities, industries, and associated urban infrastructures [36]. This conversion of wetland/water body, agricultural land was done through land filling. This conversion was the obvious consequence of urbanization and migration in Dhaka [78].
LULC change dynamics in Dhaka was influenced by many factors. Population migration, urbanization, and industrialization are the main factors contributing to LULC change in Dhaka. Being the capital city of Bangladesh, Dhaka is characterized by many urban facilities compared to other cities in Bangladesh. Most importantly, Dhaka is the main hub of income generation in Bangladesh due to the presence of many industries, business opportunities, commercial activities, and private job opportunities. In addition to income generation facilities, Dhaka has many pull factors, including education and health facilities. Due to Dhaka’s pull factors and push factors of other cities and rural areas, a large number of people migrate towards Dhaka every year [79]. The increase in population requires many residential, commercial, industrial activities and many urban facilities, including education, health, civic services, which directly affect the dynamics of the LULC change. For example, a high rate of urbanization led to the conversion of wetland to the built-up area of Dhaka, causing rainfall-induced waterlogging and urban flooding in many parts of the city [80].

4.2. Assessment of Urban Ecosystem Service Values

Based on the LULC change, we have quantified the ESV of Dhaka during the period from 1990 to 2020. Our findings identified that LULC change is one of the important drivers of ecosystem services. However, due to the differences in value coefficient and extent of land area, the impacts upon ESV of different LULC types have a different magnitude. Our findings suggest that the ESV trend of Dhaka shows a declining change process due to the transition of LULC during the study period. While the decreases in forest and vegetation, agricultural land, and waterbodies were responsible for reduction of ESV, waterbody reduction was the main contributor among them due to its high-value coefficient and large area compared to the other two. During the period from 1990 to 2020, the total estimated ESV of Dhaka decreased by 59.55%, in which 52.74% ESV decreased due to the reduction of waterbodies. This is in line with the findings of other studies in the well-established literature [17,81,82,83]. For example, the study of Wang et al. [84] shows a declining trend of ESV in Sanjiang Plain, northeast China, during the period from 1980 to 2000. Their study identified that the substantial decline in ESV was essentially due to the 53.4% loss of wetlands. During the period from 1980 to 2000, a considerable amount of wetland was lost through the conversion to agricultural land in Sanjiang Plain, northeast China. Our study also identified that, from 1990 to 2020, the built-up area increased from 17.98% to 51.85% in Dhaka at the expense of agricultural land, waterbodies, and forest and vegetation land. Since the built-up area derives no ecosystem service value, the total ESV declined due to the development of the built-up area during the past three decades. A similar scenario is also evident in some other studies showing the development of the built-up area through the conversion of agricultural land [85], forest, and vegetation [86] and waterbodies [87].
In the case of individual ecosystem services functions, water supply, waste treatment, and disturbance regulation are three major contributors over the study period. Their importance is also supported by other studies. For example, according to the study by Hasan et al. [18], water supply, waste treatment, soil formation and retention, and biodiversity protection were the most valuable ecosystem services, affecting the total ESV Guangdong, Hong Kong, and Macao in south China during 1986–2017. The regulating services show the highest contribution towards ESV during the study period. It contributed about 56.43%, 56.34%, 55.91%, 56.42%, 56.85%, 56.80% and 56.60% of the total ESV in the year 1990, 1995, 2000, 2005, 2010, 2015, and 2020 (Figure 6). The reason behind the highest contribution of regulating services is the presence of a large amount of waterbodies and their high-value coefficient for individual ecosystem services functions. For example, two individual functions of waterbodies have a higher value coefficient: waste treatment and disturbance regulation with a high-value coefficient (Table 3). However, the value of individual ecosystem functions decreased over the study period. For example, the individual value of water supply, waste treatment, and disturbance regulation functions decreased by 59.31% (19.38 million USD), 59.34% (21.67 million USD), and 59.31% (23.13 million USD) respectively in 2020. Some other studies also identified a similar trend. For example, the study of Hasan et al. [18] identified the highest decline in the water supply value (−22.30 billion CNY, −14.72%) between 1986 and 2017, followed by waste treatment (−20.77 billion CNY, −14.63%) in Guangdong, Hong Kong, and Macao in South China.
Our findings on the elasticity of ESV in response to LULC change show that change of ESV to LULC change is highly elastic. The elasticity result implies that about 1% transition in LULC would result in about 0.33% change in total ESV during the study period. Apart from a fluctuation during 2000–2005, the elasticity seems to be increasing (Figure 7), which implies that ESV is becoming more dependent upon LULC changes over time. A similar result was also identified in other studies. For example, the elasticity of the ecosystem service value change responding to LULC changes during the periods of 1992–2001, 2001–2009, and 2009–2018 were 0.28, 0.34, and 0.50, respectively, indicating an increasing trend over time [30].
The sensitivity analysis was done to test the reliability of our estimation of ESV, and it confirmed that our estimation of ESV is robust since the value of the coefficient of sensitivity (CS) is lower than 1 in all the cases, which is much similar to other studies by Tolessa et al. [17], Gashaw et al. [74], Hasan et al. [18], and Wang et al. [88]. However, we understand and believe that Costanza et al. [3] developed the value coefficient for different land cover types for global estimation and might underestimate real services of land cover types in the local context. In addition, ESV for some LULC types was estimated using equivalent biomes (Table 3), which, in turn, may not be able to derive the actual ESV from that particular LULC type. In addition, ecosystem service value coefficients were assumed to be spatially homogeneous, but, in reality, value coefficients may be different in different places based on local context [17]. Hence, the development of ecosystem service value coefficients based on local context, physical and socioeconomic characteristics is very important. Owing to this reality, different researchers have tried to modify the ecosystem service value coefficients originally developed by Costanza et al. [3] to fit the local context. For example, Xie et al. [89], on the basis of a questionnaire survey of 700 ecological experts, developed an equivalent weighting factor per hectare ESV to be applicable for Chinese terrestrial ecosystems. However, in Bangladesh, there has been no such study that worked on adjusting the ecosystem service value coefficients for urban areas.

4.3. Limitations and Future Scope of the Study

In this study, ESV was calculated based on Landsat satellite images derived from land cover and the benefit transfer method proposed by Costanza et al. [3]. However, there are several uncertainties and limitations with the assessment of ESV using this method. First, we classified different land cover types using time-series Landsat images, which are not high-resolution. Since the estimation of ESV in this study is completely based on different land cover types, the accuracy of the estimated ESV entirely depends upon the accuracy of land cover classification. However, due to the medium spatial resolution of Landsat images, the accuracy of land cover classification is also low compared to some other high-resolution images, such as quick bird and world view images, but most high-resolution images are not freely available. Therefore, Sentinel images can be used to derive LULC because Sentinel images have comparatively higher resolution than Landsat images. However, Sentinel images are not available before 2015. In this case, image fusion technique (for Landsat and Sentinel images) can be tested to derive high-resolution LULC before 2015. Second, benefit transfer methods assume the spatial homogeneity of the ecosystem service value coefficient, but human-environmental systems are much complex and heterogeneous; the same LULC may derive different ecosystem service values in different countries since the social, physical, and economic context is inevitably different. So the generalization of the value coefficient would inevitably generate erroneous ESV [90]. Hence, we recommend developing a value coefficient considering the local context. For Bangladesh, there is no specific value coefficient of different LULC types. So, future study can focus on developing value coefficient considering the local contest of Bangladesh. Third, since LULC categories are not a perfect match to equivalent biomes, several studies calculated the coefficient of sensitivity (CS) to examine the reliability and robustness of the estimation. Most of the studies adjusted value coefficients by ± 50 % to calculate CS. However, testing the robustness and reliability of the result was criticized by many researchers because of the tendency for CS value to be often less than 1 even when the value coefficient was adjusted by ± 25 % [91]. This indicates that the CS is robust but erroneous. Fourth, we have assumed that the value coefficient of ESV remains constant during the study period, but, in reality, it is unlikely that the value coefficient of ESV would remain constant over time [92], so the ESV change rate over time would not reflect the actual ESV change rate. Therefore, we recommend adjusting the value coefficient over time in future studies.

5. Conclusions

This study shows how ESV changes over time due to the change of LULC. The study identified that built-up area is the most dominant LULC type during the whole period except in 1990. The built-up area increased by 188.35% from 1990 to 2020, with an average annual growth rate is about 6.28%. The built-up area increased at the expense of agricultural land, waterbodies, and forest and vegetation land due to the high rate of urbanization, population migration, industrialization, and socioeconomic development in Dhaka. The analysis of ESV shows that it has decreased by 59.55% (85 million USD) from 142.72 million USD in 1990 to 57.72 million USD in 2020 due to the development of the built-up area through conversion of agricultural land, waterbodies, and forest and vegetation land. The elasticity result implies that 1% transition in LULC would result in about 0.33% change in total ESV during the study period. However, the highest decline in total ESV (32.20%, 27.32 million USD) occurred during the period 1990 to 1995. The study identified that waterbodies have a higher positive impact on ESV change compared to other LULC types. It has also been identified that water supply, waste treatment, and disturbance regulation are three major contributors to ESV in our study area.
This study is the first of its kind to understand the impact of LULC change on urban ecosystem services and their functions in Dhaka. The valuation of urban ecosystem services has many significances in sustainable land use planning because it has a great impact on the human well-being of city people. For example, urban vegetation controls the urban heat island effect. Loss of urban vegetation can require additional energy demand for cooling and heating buildings, increase the number of people with respiratory diseases, and many more impacts. All of these are related to an economic cost, so it is important to explore how ecosystem services respond in relation to LULC changes to facilitate decision-making towards urban sustainability. We strongly believe that this study would help policymakers and urban planners to devise appropriate land use decisions to ensure sustainable urban development of Dhaka considering natural resources and the trade-off between urban development and reduction of ecosystem services.

Author Contributions

Conceptualization, M.M.R.; methodology, M.M.R.; software, M.M.R.; validation, M.M.R.; formal analysis, M.M.R.; investigation, M.M.R.; resources, M.M.R.; data curation, M.M.R.; writing—original draft preparation, M.M.R.; writing—review and editing, M.M.R. and G.S.; supervision, G.S. All authors have read and agreed to the published version of the manuscript.

Funding

This research received no external funding.

Institutional Review Board Statement

Not applicable.

Informed Consent Statement

Not applicable.

Data Availability Statement

Datasets used in this study are available from the corresponding author on request.

Acknowledgments

This research work is an output of doctoral study at the Department of Photogrammetry and Geoinformatics, Budapest University of Technology and Economics. The first author thanks the Ministry of Foreign Affairs and Trade and the Tempus Public Foundation of the Hungarian Government for providing the opportunity to study Ph.D. with the Stipendium Hungaricum Scholarship. The authors would like to thank the US Geological Survey (USGS) for providing time series Landsat images for use in this research.

Conflicts of Interest

The authors declare no conflict of interest.

References

  1. Pharo, E.; Daily, G.C. Nature’s Services: Societal Dependence on Natural Ecosystems. Bryology 1998, 101, 475. [Google Scholar] [CrossRef] [Green Version]
  2. Arico, S.; Reid, W.V.; Mooney, H.A.; Cropper, A.; Capistrano, D.; Carpenter, S.R.; Chopra, K.; Dasgupta, P.; Dietz, T.; Duraiappah, A.K.; et al. Millennium Ecosystem Assessment. Ecosystems and Human Well-Being: Synthesis; Island Press: Washington, DC, USA, 2005. [Google Scholar]
  3. Costanza, R.; d’Arge, R.; de Groot, R.; Farber, S.; Grasso, M.; Hannon, B.; Limburg, K.; Naeem, S.; O’Neill, R.V.; Paruelo, J.; et al. The Value of the world’s Ecosystem Services and Natural capital. Nature 1997, 387, 253–260. [Google Scholar] [CrossRef]
  4. De Groot, R.S.; Alkemade, R.; Braat, L.; Hein, L.; Willemen, L. Challenges in integrating the concept of ecosystem services and values in landscape planning, management and decision making. Ecol. Complex. 2010, 7, 260–272. [Google Scholar] [CrossRef]
  5. Gómez-Baggethun, E.; Gren, Å.; Barton, D.N.; Langemeyer, J.; McPhearson, T.; O’Farrell, P.; Andersson, E.; Hamstead, Z.; Kremer, P. Urban Ecosystem Services. In Urbanization, Biodiversity and Ecosystem Services: Challenges and Opportunities; Springer Science and Business Media LLC: Berlin, Germany, 2013; pp. 175–251. [Google Scholar] [CrossRef] [Green Version]
  6. Baró, F.; Chaparro, L.; Gómez-Baggethun, E.; Langemeyer, J.; Nowak, D.J.; Terradas, J. Contribution of Ecosystem Services to Air Quality and Climate Change Mitigation Policies: The Case of Urban Forests in Barcelona, Spain. Ambio 2014, 43, 466–479. [Google Scholar] [CrossRef] [PubMed] [Green Version]
  7. Langemeyer, J.; Gómez-Baggethun, E.; Haase, D.; Scheuer, S.; Elmqvist, T. Bridging the Gap Between Ecosystem Service Assessments and Land-Use Planning through Multi-Criteria Decision Analysis (MCDA). Environ. Sci. Policy 2016, 62, 45–56. [Google Scholar] [CrossRef]
  8. Haase, D.; Larondelle, N.; Andersson, E.; Artmann, M.; Borgström, S.; Breuste, J.; Gomez-Baggethun, E.; Gren, Å.; Hamstead, Z.; Hansen, R.; et al. A Quantitative Review of Urban Ecosystem Service Assessments: Concepts, Models, and Implementation. Ambio 2014, 43, 413–433. [Google Scholar] [CrossRef] [Green Version]
  9. Söderman, T.; Kopperoinen, L.; Shemeikka, P.; Yli-Pelkonen, V. Ecosystem Services Criteria for Sustainable Development in Urban regions. J. Environ. Assess. Policy Manag. 2012, 14, 1250008. [Google Scholar] [CrossRef]
  10. Pan, Y.; Zhang, B.; Wu, Y.; Tian, Y. Sustainability Assessment of Urban Ecological-Economic Systems Based on Emergy Analysis: A Case Study in Simao, China. Ecol. Indic. 2021, 121, 107157. [Google Scholar] [CrossRef]
  11. Liu, W.; Zhan, J.; Zhao, F.; Yan, H.; Zhang, F.; Wei, X. Impacts of Urbanization-Induced Land-Use Changes on Eco-System Services: A Case Study of the Pearl River Delta Metropolitan Region, China. Ecol. Indic. 2019, 98, 228–238. [Google Scholar] [CrossRef]
  12. Aldana-Domínguez, J.; Palomo, I.; Angonese, J.G.; Schmitz, C.A.; Montes, C. Assessing the Effects of past and Future Land Cover Changes in Ecosystem Services, Disservices and Biodiversity: A Case Study in Barranquilla Metropolitan Area (BMA), Colombia. Ecosyst. Serv. 2019, 37, 100915. [Google Scholar] [CrossRef]
  13. Chen, Y.; Lu, H.; Li, J.; Xia, J. Effects of Land Use Cover Change on Carbon Emissions and Ecosystem Services in Chengyu Urban Agglomeration, China. Stoch. Environ. Res. Risk Assess. 2020, 34, 1197–1215. [Google Scholar] [CrossRef]
  14. Quintas-Soriano, C.; Castro, A.J.; Castro, H.; García-Llorente, M. Impacts of Land Use Change on Ecosystem Services and Implications for Human Well-Being in Spanish drylands. Land Use Policy 2016, 54, 534–548. [Google Scholar] [CrossRef]
  15. Montoya-Tangarife, C.; De La Barrera, F.; Salazar, A.; Inostroza, L. Monitoring the Effects of Land Cover Change on the Supply of Ecosystem Services in an Urban Region: A Study of Santiago-Valparaíso, Chile. PLoS ONE 2017, 12, e0188117. [Google Scholar] [CrossRef] [PubMed]
  16. Llambí, L.D.; Becerra, M.T.; Peralvo, M.; Avella, A.; Baruffol, M.; Flores, L.J. Monitoring Biodiversity and Eco-System Services in Colombia’s High Andean Ecosystems: Toward an Integrated Strategy. Mt. Res. Dev. 2019, 39, A8. [Google Scholar]
  17. Tolessa, T.; Senbeta, F.; Kidane, M. The Impact of Land use/Land Cover Change on Ecosystem Services in the Central Highlands of Ethiopia. Ecosyst. Serv. 2017, 23, 47–54. [Google Scholar] [CrossRef]
  18. Hasan, S.; Shi, W.; Zhu, X. Impact of Land Use Land Cover Changes on Ecosystem Service Value—A Case Study of Guangdong, Hong Kong, and Macao in South China. PLoS ONE 2020, 15, e0231259. [Google Scholar] [CrossRef] [Green Version]
  19. Grafius, D.R.; Corstanje, R.; Warren, P.H.; Evans, K.L.; Hancock, S.; Harris, J.A. The Impact of Land use/Land Cover Scale on Modelling Urban Ecosystem services. Landsc. Ecol. 2016, 31, 1509–1522. [Google Scholar] [CrossRef] [Green Version]
  20. Lambin, E.F.; Meyfroidt, P. Global Land Use Change, Economic Globalization, and the Looming Land Scarcity. Proc. Natl. Acad. Sci. USA 2011, 108, 3465–3472. [Google Scholar] [CrossRef] [Green Version]
  21. Zhao, Q.; Wen, Z.; Chen, S.; Ding, S.; Zhang, M. Quantifying Land Use/Land Cover and Landscape Pattern Changes and Impacts on Ecosystem Services. Int. J. Environ. Res. Public Health 2019, 17, 126. [Google Scholar] [CrossRef] [Green Version]
  22. Gong, J.; Li, J.; Yang, J.; Li, S.; Tang, W. Land Use and Land Cover Change in the Qinghai Lake Region of the Tibetan Plateau and Its Impact on Ecosystem Services. Int. J. Environ. Res. Public Health 2017, 14, 818. [Google Scholar] [CrossRef]
  23. Gu, C.; Zhang, Y.; Liu, L.; Li, L.; Li, S.; Zhang, B.; Cui, B.; Rai, M.K. Qualifying Land Use and Land Cover Dynamics and Their Impacts on Ecosystem Service in Central Hima-Laya Transboundary Landscape Based on Google Earth engine. Land 2021, 10, 173. [Google Scholar] [CrossRef]
  24. Arunyawat, S.; Shrestha, R.P. Assessing Land Use Change and Its Impact on Ecosystem Services in Northern Thailand. Sustainability 2016, 8, 768. [Google Scholar] [CrossRef] [Green Version]
  25. Woldeyohannes, A.; Cotter, M.; Biru, W.D.; Kelboro, G. Assessing Changes in Ecosystem Service Values over 1985–2050 in Response to Land Use and Land Cover Dynamics in Abaya-Chamo Basin, Southern Ethiopia. Land 2020, 9, 37. [Google Scholar] [CrossRef] [Green Version]
  26. Talukdar, S.; Singha, P.; Shahfahad; Mahato, S.; Praveen, B.; Rahman, A. Dynamics of Ecosystem Services (ESs) in Response to Land Use Land Cover (LU/LC) Changes in the Lower Gangetic Plain of India. Ecol. Indic. 2020, 112, 106121. [Google Scholar] [CrossRef]
  27. Sannigrahi, S.; Zhang, Q.; Joshi, P.; Sutton, P.; Keesstra, S.; Roy, P.; Pilla, F.; Basu, B.; Wang, Y.; Jha, S.; et al. Examining Effects of Climate Change and Land Use Dynamic on Biophysical and Economic Values of Ecosystem Services of a Natural Reserve Region. J. Clean. Prod. 2020, 257, 120424. [Google Scholar] [CrossRef]
  28. Sharma, R.; Rimal, B.; Baral, H.; Nehren, U.; Paudyal, K.; Sharma, S.; Rijal, S.; Ranpal, S.; Acharya, R.P.; Alenazy, A.A.; et al. Impact of Land Cover Change on Ecosystem Services in a Tropical Forested Landscape. Resources 2019, 8, 18. [Google Scholar] [CrossRef] [Green Version]
  29. Burke, T.; Whyatt, J.D.; Rowland, C.; Blackburn, G.A.; Abbatt, J. The Influence of Land Cover Data on Farm-Scale Valuations of Natural Capital. Ecosyst. Serv. 2020, 42, 101065. [Google Scholar] [CrossRef]
  30. Lin, X.; Xu, M.; Cao, C.; Singh, R.P.; Chen, W.; Ju, H. Land-use/Land-Cover Changes and Their Influence on the Eco-System in Chengdu City, China During the Period of 1992–2018. Sustainability 2018, 10, 3580. [Google Scholar] [CrossRef] [Green Version]
  31. Hein, L.; van Koppen, K.; de Groot, R.S.; van Ierland, E.C. Spatial Scales, Stakeholders and the Valuation of Eco-System services. Ecol. Econ. 2006, 57, 209–228. [Google Scholar] [CrossRef]
  32. Estoque, R.C.; Murayama, Y. Examining the Potential Impact of Land use/Cover Changes on the Ecosystem Services of Baguio City, the Philippines: A Scenario-Based analysis. Appl. Geogr. 2012, 35, 316–326. [Google Scholar] [CrossRef]
  33. Mondal, M.S.H. The Implications of Population Growth and Climate Change on Sustainable Development in Bangladesh. Jàmbá J. Disaster Risk Stud. 2019, 11, 1–10. [Google Scholar] [CrossRef] [Green Version]
  34. Chowdhury, M.N.M.; Hossain, M.M. Population Growth and Economic Development in Bangladesh: Revisited Malthus. Am. Econ. Soc. Rev. 2019, 5, 1–7. [Google Scholar] [CrossRef]
  35. Dewan, A.; Yamaguchi, Y. Land Use and Land Cover Change in Greater Dhaka, Bangladesh: Using Remote Sensing to Promote Sustainable Urbanization. Appl. Geogr. 2009, 29, 390–401. [Google Scholar] [CrossRef]
  36. Hassan, M.M.; Southworth, J. Analyzing Land Cover Change and Urban Growth Trajectories of the Mega-Urban Region of Dhaka Using Remotely Sensed Data and an Ensemble Classifier. Sustainability 2017, 10, 10. [Google Scholar] [CrossRef] [Green Version]
  37. Uddin, M.; Anwar, M.; Rahman, M.; Mobin, M. An Investigation on the Pattern of Land Use Change in Dhaka City Using Remote Sensing and GIS Application. J. Environ. Sci. Nat. Resour. 2015, 7, 105–109. [Google Scholar] [CrossRef]
  38. Dong, Y.; Ren, Z.; Fu, Y.; Miao, Z.; Yang, R.; Sun, Y.; He, X. Recording Urban Land Dynamic and Its Effects During 2000–2019 at 15-M Resolution by Cloud Compu-Ting With Landsat series. Remote Sens. 2020, 12, 2451. [Google Scholar] [CrossRef]
  39. Clerici, N.; Cote-Navarro, F.; Escobedo, F.J.; Rubiano, K.; Villegas, J.C. Spatio-temporal and cumulative effects of land use-land cover and climate change on two ecosystem services in the Colombian Andes. Sci. Total Environ. 2019, 685, 1181–1192. [Google Scholar] [CrossRef] [PubMed]
  40. Zinia, N.J.; McShane, P. Ecosystem Services Management: An Evaluation of Green Adaptations for Urban Devel-Opment in Dhaka, Bangladesh. Landsc. Urban. Plan. 2018, 173, 23–32. [Google Scholar] [CrossRef]
  41. Nahrin, K. Environmental Area Conservation through Urban Planning: Case Study in Dhaka. J. Prop. Plan. Environ. Law 2019, 12, 55–71. [Google Scholar] [CrossRef]
  42. Rahman, M.H.; Khan, T.Z.; Raju, R.A.; Huq, M.J. Urban Eco-Sustainability and Disaster Risk Reduction by Implementing Vertical Garden in Dhaka City Eco-System Services and Urban Disaster Risk Management. In Proceedings of the International Conference on Disaster Risk Management, Dhaka, Bangladesh, 12–14 January 2019. [Google Scholar]
  43. Hoque, M.Z.; Cui, S.; Islam, I.; Xu, L.; Tang, J. Future Impact of Land use/Land Cover Changes on Ecosystem Services in the Lower Meghna River Estuary, Bangladesh. Sustainability 2020, 12, 2112. [Google Scholar] [CrossRef] [Green Version]
  44. Akber, M.A.; Khan, M.W.R.; Islam, M.A.; Rahman, M.M.; Rahman, M.R. Impact of Land Use Change on Ecosystem Services of Southwest Coastal Bangladesh. J. Land Use Sci. 2018, 13, 238–250. [Google Scholar] [CrossRef]
  45. Huq, N.; Bruns, A.; Ribbe, L. Interactions between Freshwater Ecosystem Services and Land Cover Changes in Southern Bangladesh: A Perspective from Short-Term (seasonal) and Long-Term (1973–2014) Scale. Sci. Total. Environ. 2019, 650, 132–143. [Google Scholar] [CrossRef]
  46. Zinia, N.J.; McShane, P. Urban Ecosystems and Ecosystem Services in Megacity Dhaka: Mapping and Inventory Analysis. Urban Ecosyst. 2021, 1–14. [Google Scholar] [CrossRef]
  47. Ahmed, S.J.; Nahiduzzaman, K.M.; Bramley, G. From a Town to a Megacity: 400 Years of Growth. In Dhaka Megacity; Springer Science and Business Media LLC: Berlin, Germany, 2013; pp. 23–43. [Google Scholar] [CrossRef]
  48. World Population Review. Dhaka Population 2021 (Demographics, Maps, Graphs). 2021. Available online: https://worldpopulationreview.com/en/world-cities/Dhaka-Population (accessed on 19 May 2021).
  49. Noorunnahar, M.; Hossain, M. Trend Analysis of Rainfall Data in Divisional Meteorological Stations of Bangladesh. Ann. Bangladesh Agric. 2020, 23, 49–61. [Google Scholar] [CrossRef]
  50. USGS. Using the USGS Landsat Level-1 Data Product. 2019. Available online: https://www.usgs.gov/core-science-systems/nli/landsat/using-usgs-landsat-level-1-data-product (accessed on 5 May 2021).
  51. Chavez, P.S. Image-Based Atmospheric Corrections—Revisited and improved. Photogramm. Eng. Remote Sens. 1996, 62, 1025–1035. [Google Scholar]
  52. López-Serrano, P.M.; Corral-Rivas, J.J.; Díaz-Varela, R.A.; Álvarez-González, J.G.; López-Sánchez, C.A. Evaluation of Radiometric and Atmospheric Correction Algorithms for Aboveground Forest Biomass Estimation Using Landsat 5 TM data. Remote Sens. 2016, 8, 369. [Google Scholar] [CrossRef] [Green Version]
  53. Mahiny, A.S.; Turner, B.J. A Comparison of Four Common Atmospheric Correction Methods. Photogramm. Eng. Remote Sens. 2007, 73, 361–368. [Google Scholar] [CrossRef]
  54. R Core Team. R: A Language and Environment for Statistical Computing; R Foundation for Statistical Computing: Vienna, Austria, 2019. [Google Scholar]
  55. Papa, J.P.; Papa, L.P.; Pereira, D.R.; Pisani, R.J. A Hyperheuristic Approach for Unsupervised Land-Cover Classification. IEEE J. Sel. Top. Appl. Earth Obs. Remote Sens. 2016, 9, 2333–2342. [Google Scholar] [CrossRef]
  56. Brendel, A.S.; Ferrelli, F.; Piccolo, M.C.; Perillo, G.M.E. Assessment of the Effectiveness of Supervised and Unsupervised Methods: Maximizing Land-Cover Classification Accuracy with Spectral Indices Data. J. Appl. Remote Sens. 2019, 13, 014503. [Google Scholar] [CrossRef]
  57. Papa, J.; Papa, L.; Pisani, R.; Pereira, D. Unsupervised Land-Cover Classification through Hyper-Heuristic-Based Harmony Search. In Proceedings of the 2015 IEEE International Geoscience and Remote Sensing Symposium (IGARSS), IEEE, Milan, Italy, 26–31 July 2015; pp. 69–72. [Google Scholar] [CrossRef]
  58. Aswatha, S.M.; Mukherjee, J.; Biswas, P.K.; Aikat, S. Unsupervised Classification of Land Cover Using Multi-Modal Data from Multi-Spectral and Hybrid-Polarimetric SAR imageries. Int. J. Remote Sens. 2020, 41, 5277–5304. [Google Scholar] [CrossRef]
  59. Chatterjee, A.; Saha, J.; Mukherjee, J.; Aikat, S.; Misra, A. Unsupervised Land Cover Classification of Hybrid and Dual-Polarized Images Using Deep Convolutional Neural Network. IEEE Geosci. Remote Sens. Lett. 2021, 18, 969–973. [Google Scholar] [CrossRef]
  60. Chen, Q.; Kuang, G.; Li, J.; Sui, L.; Li, D. Unsupervised Land Cover/Land Use Classification Using PolSAR Imagery Based on Scattering Similarity. IEEE Trans. Geosci. Remote Sens. 2012, 51, 1817–1825. [Google Scholar] [CrossRef]
  61. Oyekola, M.A.; Adewuyi, G.K. Unsupervised Classification in Land Cover Types Using Remote Sensing and GIS Techniques. Int. J. Sci. Eng. Investig. 2018, 7, 11–18. [Google Scholar]
  62. Sinaga, K.P.; Yang, M.-S. Unsupervised K-Means Clustering Algorithm. IEEE Access 2020, 8, 80716–80727. [Google Scholar] [CrossRef]
  63. Dhanachandra, N.; Manglem, K.; Chanu, Y.J. Image Segmentation Using K -Means Clustering Algorithm and Subtractive Clustering Algorithm. Procedia Comput. Sci. 2015, 54, 764–771. [Google Scholar] [CrossRef] [Green Version]
  64. Congalton, R.G.; Green, K. Assessing the Accuracy of Remotely Sensed Data Principles and Practices, 3rd ed.; CRC Press Taylor Fr. Group: Boca Raton, FL, USA; London, UK, 2019. [Google Scholar] [CrossRef]
  65. Hao, F.; Lai, X.; Ouyang, W.; Xu, Y.; Wei, O.; Song, K. Effects of Land Use Changes on the Ecosystem Service Values of a Reclamation Farm in Northeast China. Environ. Manag. 2012, 50, 888–899. [Google Scholar] [CrossRef]
  66. Ongsomwang, S.; Pattanakiat, S.; Srisuwan, A. Impact of Land Use and Land Cover Change on Ecosystem Service Values: A Case Study of Khon Kaen City, Thailand. Environ. Nat. Resour. J. 2019, 17, 43–58. [Google Scholar] [CrossRef] [Green Version]
  67. Pullanikkatil, D.; Palamuleni, L.G.; Ruhiiga, T.M. Land use/Land Cover Change and Implications for Ecosystems Services in the Likangala River Catchment, Malawi. Phys. Chem. Earth Parts A/B/C 2016, 93, 96–103. [Google Scholar] [CrossRef]
  68. Hu, H.; Liu, W.; Cao, M. Impact of Land Use and Land Cover Changes on Ecosystem Services in Menglun, Xishuangbanna, Southwest China. Environ. Monit. Assess. 2007, 146, 147–156. [Google Scholar] [CrossRef] [PubMed]
  69. Li, R.-Q.; Dong, M.; Cui, J.-Y.; Zhang, L.-L.; Cui, Q.-G.; He, W.-M. Quantification of the Impact of Land-Use Changes on Ecosystem Services: A Case Study in Pingbian County, China. Environ. Monit. Assess. 2007, 128, 503–510. [Google Scholar] [CrossRef] [PubMed]
  70. Kreuter, U.P.; Harris, H.G.; Matlock, M.D.; Lacey, R. Change in Ecosystem Service Values in the San Antonio Area, Texas. Ecol. Econ. 2001, 39, 333–346. [Google Scholar] [CrossRef]
  71. Wang, Z.; Cao, J.; Zhu, C.; Yang, H. The Impact of Land Use Change on Ecosystem Service Value in the Upstream of Xiong’an New Area. Sustainability 2020, 12, 5707. [Google Scholar] [CrossRef]
  72. Yuan, K.; Li, F.; Yang, H.; Wang, Y. The Influence of Land Use Change on Ecosystem Service Value in Shangzhou District. Int. J. Environ. Res. Public Health 2019, 16, 1321. [Google Scholar] [CrossRef] [Green Version]
  73. Chuai, X.; Huang, X.; Wu, C.; Li, J.; Lu, Q.; Qi, X.; Zhang, M.; Zuo, T.; Lu, J. Land Use and Ecosystems Services Value Changes and Ecological Land Management in Coastal Jiangsu, China. Habitat Int. 2016, 57, 164–174. [Google Scholar] [CrossRef]
  74. Gashaw, T.; Tulu, T.; Argaw, M.; Worqlul, A.W.; Tolessa, T.; Kindu, M. Estimating the Impacts of Land use/Land Cover Changes on Ecosystem Service Values: The Case of the Andassa Watershed in the Upper Blue Nile Basin of Ethiopia. Ecosyst. Serv. 2018, 31, 219–228. [Google Scholar] [CrossRef]
  75. Ahmed, B.; Kamruzzaman; Zhu, X.; Rahman, S.; Choi, K. Simulating Land Cover Changes and Their Impacts on Land Surface Temperature in Dhaka, Bangladesh. Remote Sens. 2013, 5, 5969–5998. [Google Scholar] [CrossRef] [Green Version]
  76. Ibrahim, G.R.F. Urban Land Use Land Cover Changes and Their Effect on Land Surface Temperature: Case Study Using Dohuk City in the Kurdistan Region of Iraq. Climate 2017, 5, 13. [Google Scholar] [CrossRef] [Green Version]
  77. Wu, Y.; Li, S.; Yu, S. Monitoring Urban Expansion and Its Effects on Land Use and Land Cover Changes in Guang-Zhou City, China. Environ. Monit. Assess. 2016, 188, 54. [Google Scholar] [CrossRef] [PubMed]
  78. Rahman, M.M.; Hassan, S.; Bahauddin, K.; Ratul, A.K.; Hossain Bhuiyan, A.M. Exploring the Impact of rural–urban Migration on Urban Land Use and Land Cover: A Case of Dhaka City, Bangladesh. Migr. Dev. 2018, 7, 222–239. [Google Scholar] [CrossRef]
  79. Hossain, S. Migration, Urbanization and Poverty in Dhaka, Bangladesh. J. Asiat. Soc. Bangladesh 2013, 58, 369–382. [Google Scholar]
  80. Moniruzzaman; Thakur, P.; Kumar, P.; Alam, A.; Garg, V.; Rousta, I.; Olafsson, H. Decadal Urban Land Use/Land Cover Changes and Its Impact on Surface Runoff Potential for the Dhaka City and Surroundings Using Remote Sensing. Remote Sens. 2020, 13, 83. [Google Scholar] [CrossRef]
  81. Mao, D.; He, X.; Wang, Z.; Tian, Y.; Xiang, H.; Yu, H.; Man, W.; Jia, M.; Ren, C.; Zheng, H. Diverse Policies Leading to Contrasting Impacts on Land Cover and Ecosystem Services in Northeast China. J. Clean. Prod. 2019, 240. [Google Scholar] [CrossRef]
  82. Zhang, Y.; Zhao, L.; Liu, J.; Liu, Y.; Li, C. The Impact of Land Cover Change on Ecosystem Service Values in Urban Agglomerations Along the Coast of the Bohai Rim, China. Sustainability 2015, 7, 10365–10387. [Google Scholar] [CrossRef] [Green Version]
  83. Kaiser, G.; Burkhard, B.; Romer, H.; Sangkaew, S.; Graterol, R.; Haitook, T.; Sterr, H.; Sakuna-Schwartz, D. Mapping Tsunami Impacts on Land Cover and Related Ecosystem Service Supply in Phang Nga, Thailand. Nat. Hazards Earth Syst. Sci. 2013, 13, 3095–3111. [Google Scholar] [CrossRef] [Green Version]
  84. Wang, Z.; Zhang, B.; Zhang, S.; Li, X.; Liu, D.; Song, K.; Li, J.; Li, F.; Duan, H. Changes of Land Use and of Ecosystem Service Values in Sanjiang Plain, Northeast China. Environ. Monit. Assess. 2006, 112, 69–91. [Google Scholar] [CrossRef] [PubMed]
  85. Mishra, P.K.; Rai, A.; Rai, S.C. Land Use and Land Cover Change Detection Using Geospatial Techniques in the Sikkim Himalaya, India. Egypt. J. Remote. Sens. Space Sci. 2020, 23, 133–143. [Google Scholar] [CrossRef]
  86. Guo, L.; Xi, X.; Yang, W.; Liang, L. Monitoring Land Use/Cover Change Using Remotely Sensed Data in Guangzhou of China. Sustainability 2021, 13, 2944. [Google Scholar] [CrossRef]
  87. Collins, W.H.; Elekwachi, W. Geo-Spatial Analysis of Urban Wetlands Loss in Obio/Akpor Local Government Area of Rivers State, Nigeria. Asian J. Geogr. Res. 2020. [CrossRef] [Green Version]
  88. Wang, Y.; Zhang, X.; Peng, P. Spatio-Temporal Changes of Land-use/Land Cover Change and the Effects on Ecosystem Service Values in Derong County, China, from 1992–2018. Sustainability 2021, 13, 827. [Google Scholar] [CrossRef]
  89. Xie, G.D.; Zhen, L.; Lu, C.-x.; Xiao, Y.; Chen, C. Expert Knowledge Based Valuation Method of Ecosystem Services in China. J. Environ. Manag. 2018, 23, 911–919. [Google Scholar]
  90. Song, W.; Deng, X. Land-use/Land-Cover Change and Ecosystem Service Provision in China. Sci. Total. Environ. 2017, 576, 705–719. [Google Scholar] [CrossRef] [PubMed]
  91. Aschonitis, V.G.; Gaglio, M.; Castaldelli, G.; Fano, E.A. Criticism on Elasticity-Sensitivity Coefficient for Assessing the Robustness and Sensitivity of Ecosystem Services values. Ecosyst. Serv. 2016, 20, 66–68. [Google Scholar] [CrossRef]
  92. Zank, B.; Bagstad, K.J.; Voigt, B.; Villa, F. Modeling the Effects of Urban Expansion on Natural Capital Stocks and Ecosystem Service Flows: A Case Study in the Puget Sound, Washington, USA. Landsc. Urban. Plan. 2016, 149, 31–42. [Google Scholar] [CrossRef]
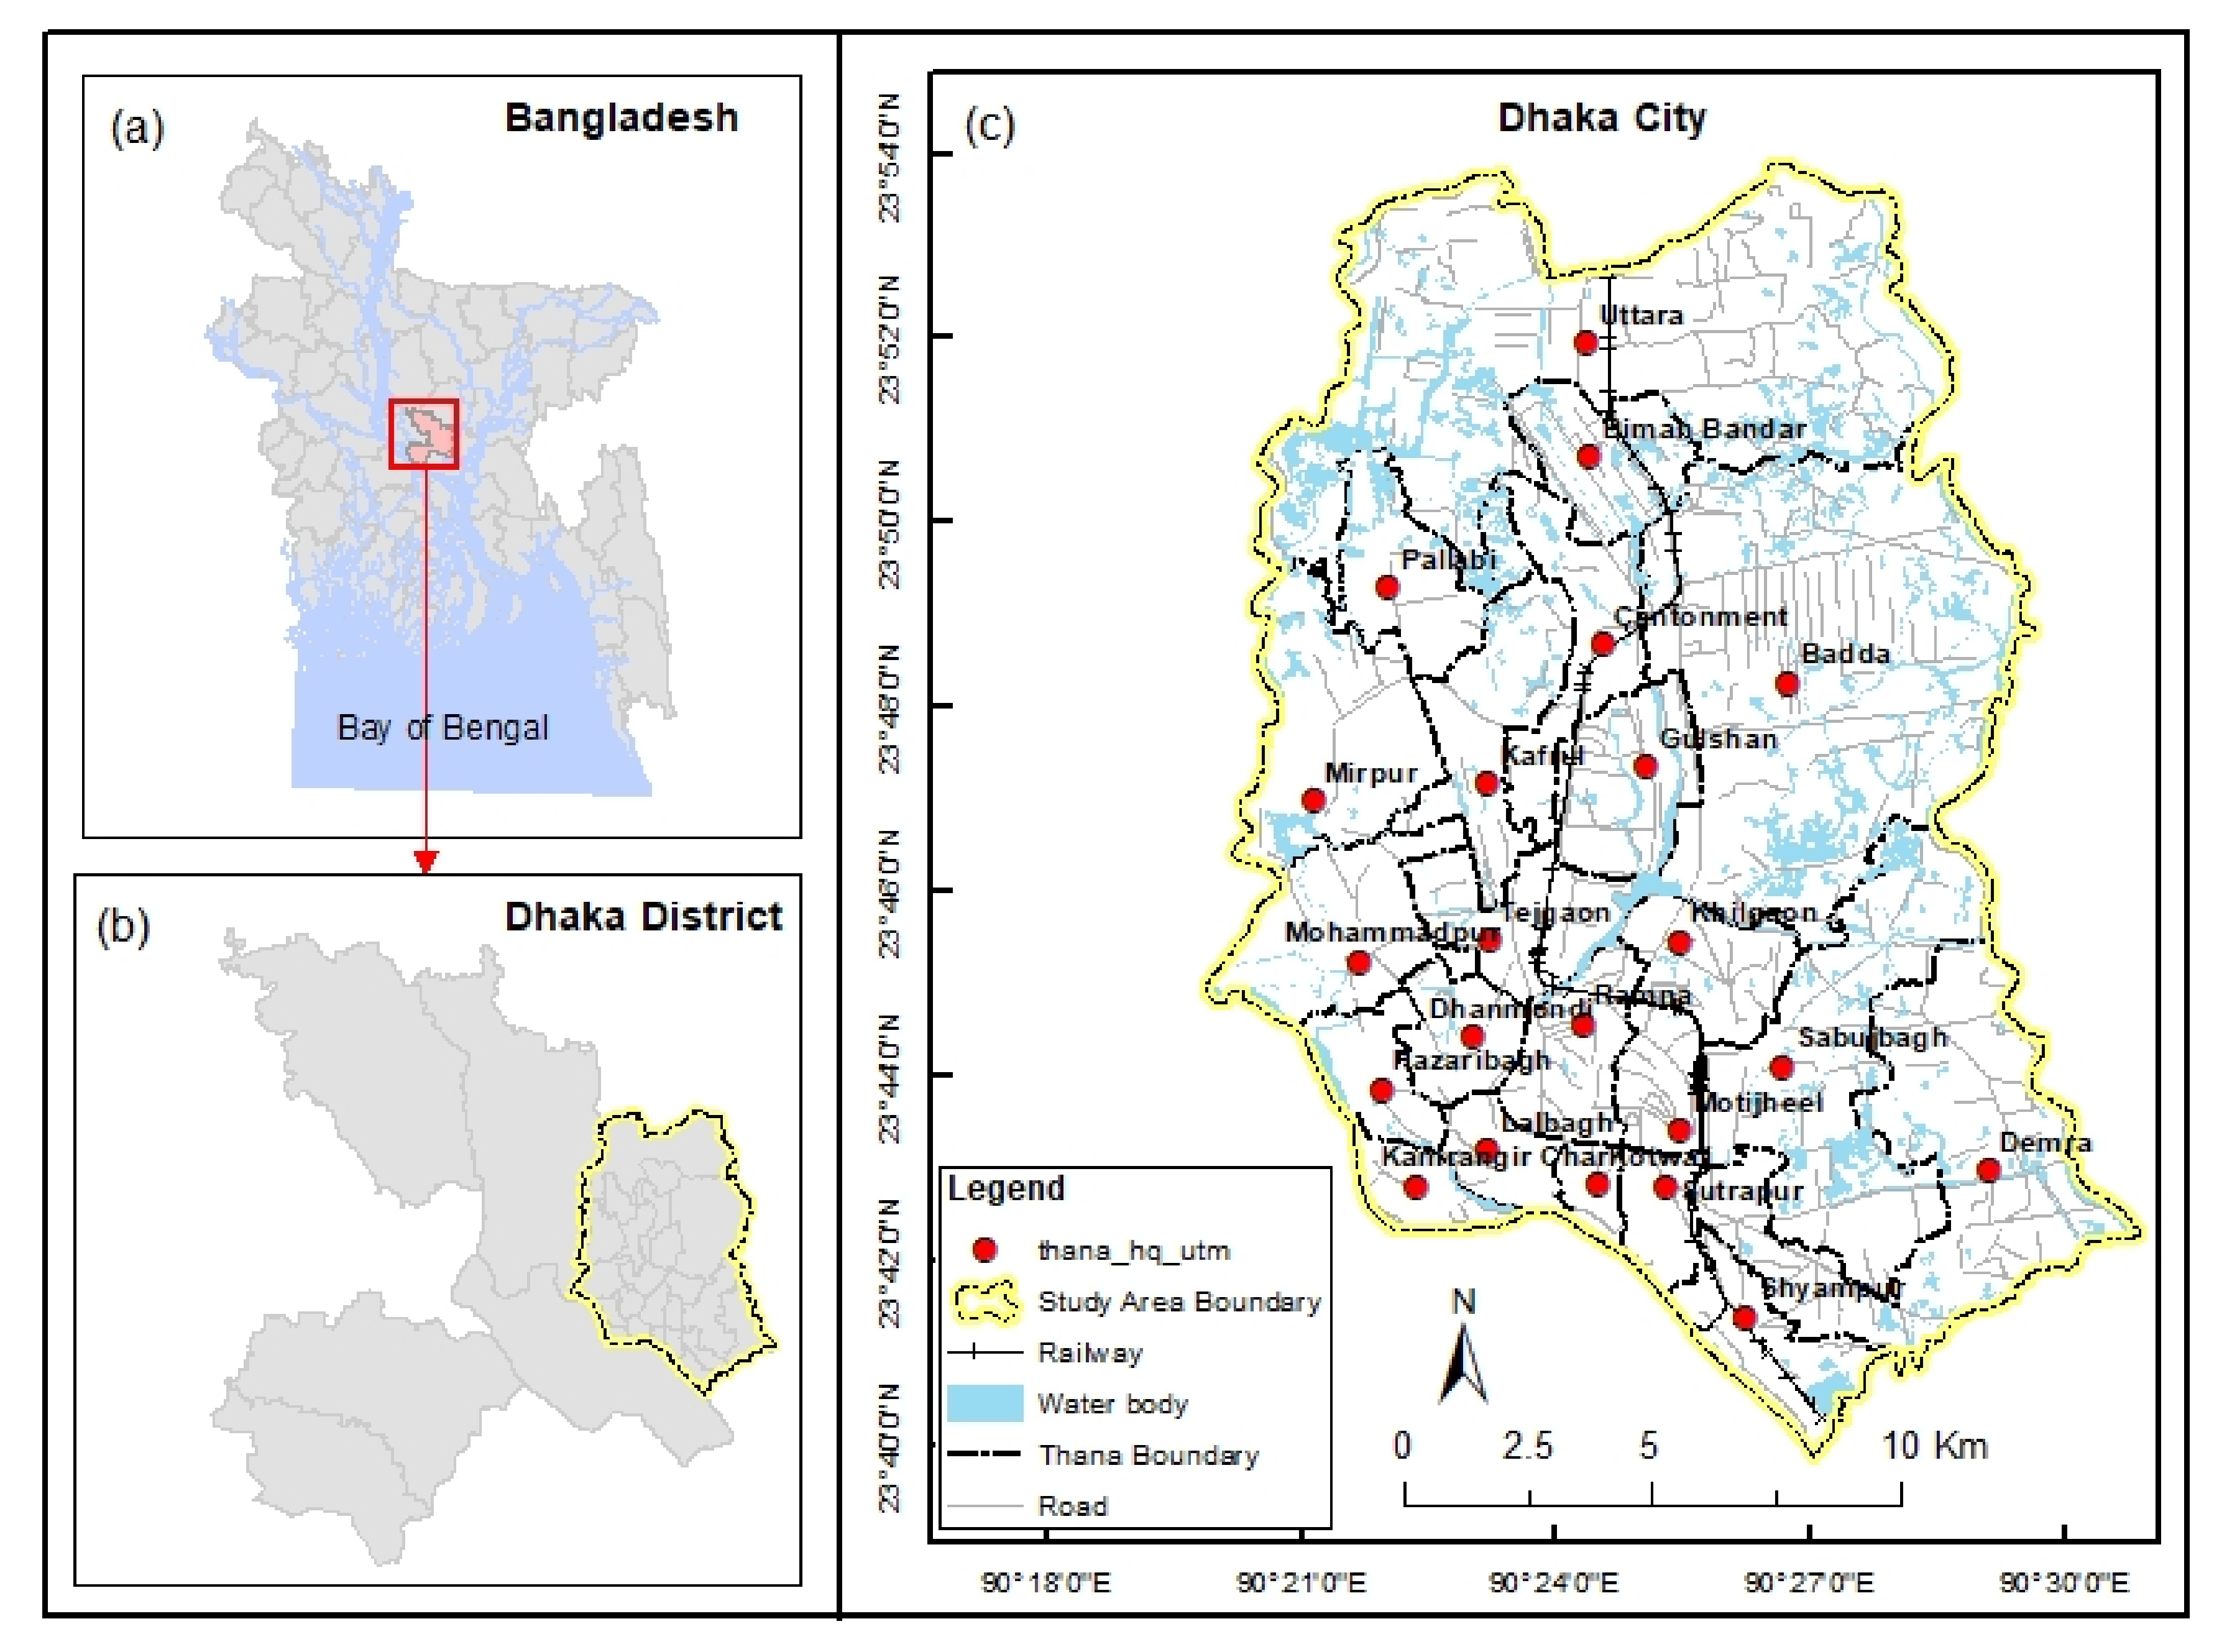
Figure 1. Location of (a) Dhaka district in Bangladesh; (b) the city of Dhaka in Dhaka district; and (c) base map of the city of Dhaka.
Land 10 00793 g001
Figure 2. Land use and land cover change map of Dhaka for the years 1990, 1995, 2000, 2005, 2010, 2015, and 2020.
Land 10 00793 g002
Figure 3. Figure showing trend of LULC change in Dhaka during 1990–2020.
Land 10 00793 g003
Figure 4. Trend of total ESV in Dhaka during 1990–2020.
Land 10 00793 g004
Figure 5. Spatial distribution of ESV (US$/ha/year) for the year 1990, 1995, 2000, 2005, 2010, 2015, and 2020.
Land 10 00793 g005
Figure 6. Contribution of individual ecosystem service to total ESV.
Land 10 00793 g006
Figure 7. Elasticity of ESV in response to LULC change.
Land 10 00793 g007
Figure 8. Relationship between ESV and LULC change.
Land 10 00793 g008
Table 1. Particulars of Landsat images used in this study.
Landsat Scene IDAcquisition DateTime (GMT)SatelliteSensorPath/RowResolution
LT51370441990343BKT009 December 199003:44:06.95Landsat 5TM137/4430
LT51370441995325BKT0021 November 199503:24:28.03Landsat 5TM137/4430
LE71370442000331SGS0026 November 200004:15:10.40Landsat 7ETM+137/4430
LT51370442005320BKT0116 November 200504:13:15.00Landsat 5TM137/4430
LT51370442010318KHC0014 November 201004:14:36.41Landsat 5TM137/4430
LC81370442015316LGN0212 November 201504:24:55.23Landsat 8OLI137/4430
LC81370442020330LGN0025 November 202004:25:09.27Landsat 8OLI137/4430
TM = thematic mapper; ETM+ = enhanced thematic mapper plus; OLI = operational land imager.
Table 2. Description of land cover types.
Land Cover TypeDescription
Built–up AreaUrban area, residential, commercial, industrial areas, mixed-use, settlements, transport, and other man-made structures
WaterbodyRiver, lake, pond, canal, low land, wetland, etc.
VegetationTrees, mixed forest, natural vegetation, gardens, parks, playground, etc.
Bare LandOpen space, construction site, Fallow land, land surface without vegetation, Sand, transitional areas, bare soil, etc.
Agricultural LandCropland and pasture, orchards, groves, nurseries, and other agricultural lands.
Table 3. Biome equivalents for the five land-use categories and the corresponding ecosystem values 1994   US   $   h a 1 y r 1 .
LULC TypesEquivalent BiomeEcosystem Service Value Coefficient
U S   $   h a 1 y r 1
Agricultural landCropland92
Water bodyWetland14,785
Forest and vegetationTropical forest2007
Built-up areaUrban0
Bare landDesert0
Table 4. Area and proportion of different LULC types.
Land Cover Class/YearAgricultural LandWaterbodiesForest and VegetationBuilt-Up LandBare Land
1990Area64.6685.8575.7454.9624.52
%21.1528.0824.7717.988.02
1995Area49.5974.6568.0185.2128.15
%16.2324.4322.2527.889.21
2000Area40.8567.4370.3394.4832.54
%13.3722.0623.0130.9110.65
2005Area33.7265.6258.77116.4331.11
%11.0321.4719.2338.0910.18
2010Area28.8662.0748.00132.5834.12
%9.4420.3115.7143.3811.16
2015Area27.3251.7140.56142.3943.74
%8.9416.9113.2746.5714.31
2020Area24.7034.9429.11158.4958.42
%8.0811.439.5251.8519.11
Table 5. LULC change dynamic index K (%) during 1990 to 2020.
Land Cover Class1990–19951995–20002000–20052005–20102010–20152015–20201990–2020
Agricultural Land−4.66−3.52−3.49−2.88−1.07−1.92−2.06
Waterbodies−2.61−1.93−0.54−1.08−3.34−6.49−1.98
Forest and Vegetation−2.040.68−3.29−3.66−3.10−5.65−2.05
Built-Up Land11.012.184.642.771.482.266.28
Bare Land2.963.12−0.881.945.646.714.61
Table 6. LULC transition matrix in Dhaka during the period 1990–2020.
LULC TypeLULC Allocation in 2020 (%)
Agricultural LandWaterbodiesForest and VegetationBuilt-Up LandBare LandGrand Total
LULC allocation in 1990 (%)Agricultural Land4.232.541.799.183.3821.15
Waterbodies2.786.911.405.4611.5228.08
Forest and Vegetation0.601.604.2215.582.7924.77
Built-Up Land0.050.071.3216.270.2917.98
Bare Land0.420.270.815.391.138.02
Grand Total8.0811.439.5251.8519.11100.00
Table 7. Individual ESV by LULC and year.
LULC/YearAgricultural LandWater BodyForest and VegetationBuilt-up AreaBare LandTotal ESV
1990ESV0.59126.9315.200.000.00142.72
%0.4288.9310.650.000.00100.00
1995ESV0.46110.3713.650.000.00124.47
%0.3788.6710.970.000.00100.00
2000ESV0.3899.6914.120.000.00114.18
%0.3387.3112.360.000.00100.00
2005ESV0.3197.0211.790.000.00109.12
%0.2888.9110.810.000.00100.00
2010ESV0.2791.779.630.000.00101.67
%0.2690.269.480.000.00100.00
2015ESV0.2576.458.140.000.0084.84
%0.3090.119.600.000.00100.00
2020ESV0.2351.655.840.000.0057.72
%0.3989.4910.120.000.00100.00
Table 8. Annual rate of change (%) of ESV for different LULC during the period 1990–2020.
Land Cover Class E S V c r
1990–19951995–20002000–20052005–20102010–20152015–20201990–2020
Agricultural Land−4.66−3.52−3.49−2.88−1.07−1.92−2.06
Waterbodies−2.61−1.93−0.54−1.08−3.34−6.49−1.98
Forest and Vegetation−2.040.68−3.29−3.66−3.10−5.65−2.05
Built-up area0000000
Bare Land0000000
Total ESV change−2.56−1.65−0.89−1.37−3.31−6.39−1.99
Table 9. Estimated individual ecosystem service function during the period 1990 to 2020.
Individual ESV Function1990199520002005201020152020
ESVf%ESVf%ESVf%ESVf%ESVf%ESVf%ESVf%
ProvisioningFood production2.791.952.41.932.171.92.051.881.91.871.61.891.121.94
Water supply32.722.928.422.825.722.52522.923.623.219.723.213.323
Raw material3.32.312.932.362.932.572.552.332.172.131.832.151.292.23
Genetic resources0.310.220.280.220.290.250.240.220.20.190.170.20.120.21
RegulatingWater regulation0.170.120.150.120.140.130.130.120.120.120.10.120.070.12
Waste treatment36.525.631.825.528.825.227.925.626.325.92225.914.825.7
Erosion control1.861.31.671.341.721.511.441.321.181.160.991.170.711.24
Climate regulation1.691.181.521.221.571.371.311.21.071.050.91.070.651.12
Biological control0.160.110.120.10.10.090.080.070.070.070.070.080.060.1
Gas regulation1.140.80.990.80.90.790.870.80.830.810.690.810.460.8
Disturbance regulation3927.333.927.230.626.829.827.328.227.723.527.715.927.5
SupportingNutrient cycling6.984.896.275.046.485.685.424.974.434.353.744.412.684.65
Pollination0.090.060.070.060.060.050.050.040.040.040.040.050.030.06
Soil formation0.080.050.070.050.070.060.060.050.050.050.040.050.030.05
Habitat/refugia2.611.832.271.822.051.81.991.831.891.861.571.851.061.84
CulturalRecreation5.784.055.054.054.664.084.424.054.14.033.424.032.334.04
Cultural7.585.316.595.295.955.215.795.315.485.394.565.383.085.34
Total142.72100124.47100114.18100109.12100102.6710084.8410057.72100
Table 10. Change in the value (million USD) of individual ecosystem service function during the period 1990 to 2020.
Ecosystem Service Function1990–19951995–20002005–20102010–20152015–20201990–2020
ProvisioningFood production−0.39−0.22−0.12−0.3−0.48−1.67
Water supply−4.26−2.74−0.7−3.94−6.38−19.38
Raw material−0.360−0.38−0.34−0.54−2.01
Genetic resources−0.030.01−0.05−0.03−0.05−0.19
RegulatingWater regulation−0.02−0.01−0.01−0.02−0.03−0.1
Waste treatment−4.75−3−0.86−4.39−7.1−21.67
Erosion control−0.190.06−0.28−0.18−0.28−1.14
Climate regulation−0.170.05−0.26−0.17−0.26−1.04
Biological control−0.04−0.02−0.020−0.01−0.1
Gas regulation−0.15−0.1−0.02−0.14−0.22−0.68
Disturbance regulation−5.09−3.28−0.83−4.71−7.62−23.13
SupportingNutrient cycling−0.710.21−1.07−0.69−1.06−4.3
Pollination−0.02−0.01−0.0100−0.06
Soil formation−0.010−0.01−0.01−0.01−0.05
Habitat/refugia−0.34−0.22−0.05−0.31−0.51−1.55
CulturalRecreation−0.73−0.39−0.23−0.68−1.09−3.44
Cultural−0.99−0.64−0.16−0.91−1.48−4.49
Table 11. Percentage change in estimated total ESV and coefficients of sensitivity (CSs) from an adjustment of ecosystem valuation coefficients (VC).
Adjusted Value Coefficient1990199520002005201020152020
C (%)CSC (%)CSC (%)CSC (%)CSC (%)CSC (%)CSC (%)CS
Agricultural land ± 50%0.2080.0040.1830.0040.1650.0030.1420.0030.1310.0030.1480.0030.1970.004
Waterbody ± 50%44.4660.88944.3340.88743.6540.87344.4540.88945.1320.90345.0540.90144.7430.895
Forest and Vegetation ± 50%5.3250.1075.4830.1106.1810.1245.4040.1084.7380.0954.7980.0965.0600.101
Built-up area ± 50%--------------
Bare Land ± 50%--------------
C (%) = percentage change in total ESV due to adjusted value coefficient.
Publisher’s Note: MDPI stays neutral with regard to jurisdictional claims in published maps and institutional affiliations.