Article

Identifying and Setting Linear Water Space Priorities in Co-Urbanized Area Based on Multiple Levels and Multiple Ecosystem Services

1
Department of Landscape Architecture, College of Architecture and Urban Planning, Tongji University, Shanghai 200092, China
2
Joint Laboratory of Ecological Urban Design (Research Centre for Land Ecological Planning, Design and Environmental Effects, International Joint Research Centre of Urban-Rural Ecological Planning and Design), College of Architecture and Urban Planning, Tongji University, Shanghai 200092, China
3
School of Mathematical Sciences, Peking University, Beijing 100871, China
*
Author to whom correspondence should be addressed.
Land 2021, 10(8), 794; https://doi.org/10.3390/land10080794
Submission received: 18 June 2021 / Revised: 17 July 2021 / Accepted: 27 July 2021 / Published: 29 July 2021
(This article belongs to the Section Landscape Ecology)

Abstract

:
Due to intense anthropogenic impacts, river networks in co-urbanized areas are severely degraded and fragmented, and their ability to supply multiple ecosystem services is greatly reduced. This study aimed to provide a novel technical approach to identify spatial priorities for complex and special linear water spaces in a co-urbanized area. This approach fully considers the features of river networks with multiple levels and multiple functions. We first identified two spatial configurations of river networks based on the river density: river cluster patches and river corridors, which were each divided into four spatial levels. We then assessed and mapped the multiple ecosystem services provided by each river level through a coupling evaluation model. Finally, based on the evaluation results and spatial clustering analysis, we identified priorities of linear water spaces using six priority grades. This priority identification method based on multiple levels and multiple ecosystem services of linear water spaces shows how a holistic catchment perspective can be applied to the practice of integrated river management in co-urbanized areas. Selecting conservation strategies for linear water spaces on the basis of their structural level and ecological contribution is a more targeted measure.

1. Introduction

Rivers, as linear water spaces with particular structures of landscape patterns, spatial configurations and connectivities, are important and precious linear landscape elements and ecological corridors connecting other ecological patches in urban and regional landscapes [1]. Humans derive benefits from ESs provided by river networks composed of rivers of different sizes [2,3]. However, due to intense anthropogenic impacts, global river networks have become increasingly degraded and altered or, in some cases, have even disappeared [4]. Especially in rapidly urbanized areas around large cities, ongoing population growth and economic development require rivers to provide people with more food, energy and other services [5,6]. The original spatial extent of river landscapes has been greatly reduced, and species-rich environments exist only as isolated fragments due to rapid changes in land use [4,7].
In the face of multiple ecological risks, it is challenging to protect linear water spaces and the networks that they form in co-urbanized areas. An effective spatial priority identification approach based on a multi-objective and multi-ecosystem service perspective is needed to identify rivers that have conservation value and interest in the network. In recent decades, ES assessment and mapping have become effective tools to support ecological function evaluation and ecological importance identification of ecological spaces [8,9,10,11]. This approach shows which spaces need to receive attention and be preferentially retained because of their high ES supply capacity or demand pressure [12,13]. However, the lack of targeted research is likely to lead to the neglect of some important ecological functions in complex river ecosystems. Additionally, only a small number of studies based on the ES approach have been carried out specifically on rivers. Some studies have mapped the biodiversity conservation service [14,15] and cultural services [16,17] provided by rivers. Other studies have comprehensively reviewed the types of ESs provided by rivers and the drivers and pressures associated with those services [18]. Several other studies have analyzed the effects of biophysical and social stressors on river service provision [12,14,19,20]. A few studies have performed ecological restoration of rivers through the evaluation of ecological importance based on the ES approach [21,22,23].
The above studies were carried out for a certain river or several specific rivers; that is, a single linear water space was taken as the research object, or multiple linear water spaces were regarded as independent entities. For the targeted protection of rivers, these assessments of independent rivers or key river systems are, of course, essential. However, these studies are not sufficient to provide a reference for restoration and optimization strategies of the entire linear water space system, because they fail to account for important characteristics of the whole river network, such as the hierarchical features of rivers of different sizes, habitat connectivity or the accessibility of recreational rivers [24]. In fact, with the increasing awareness of the importance of adopting a holistic catchment perspective and integrated river management, the issue of river network optimization and enhancement has received increasing attention from managers and practitioners [25].
In addition, a river network is a meta-ecosystem composed of interconnected, diverse rivers of different types and sizes and multiple levels [26]. The rivers themselves vary considerably in spatial size and extent: from small headwater streams to large navigable main-stem rivers, from densely aggregated river clusters to scattered individual channels, reflecting rich and varied hierarchies. Ignoring the ESs provided by rivers at any level within the river network will affect the analysis results of the overall ESs provided by the river network as a whole. However, previous studies on the ecological functions of river networks have only focused on linear water spaces at the same level on a single scale [1,17,27]. It has been proven that it is necessary to study the dynamics, processes and patterns of highly heterogeneous spaces from multi-scale and multi-level perspectives [28,29]. Previous studies have not involved the analysis of ESs provided by full-scale and multi-level rivers.
In view of the above research gaps and the need to protect complex linear water spaces in co-urbanized areas, this study proposes a novel approach to identify the ecological priorities of linear water spaces based on the hierarchical features of the river network structure and the functional features that allow it to provide multiple ecosystem services. This approach can provide a reference for the prioritization of river network restoration and optimization measures and further guide decision making in natural resource protection and overall regional ecological network construction, restoration and investment [30,31].

2. Materials and Methods

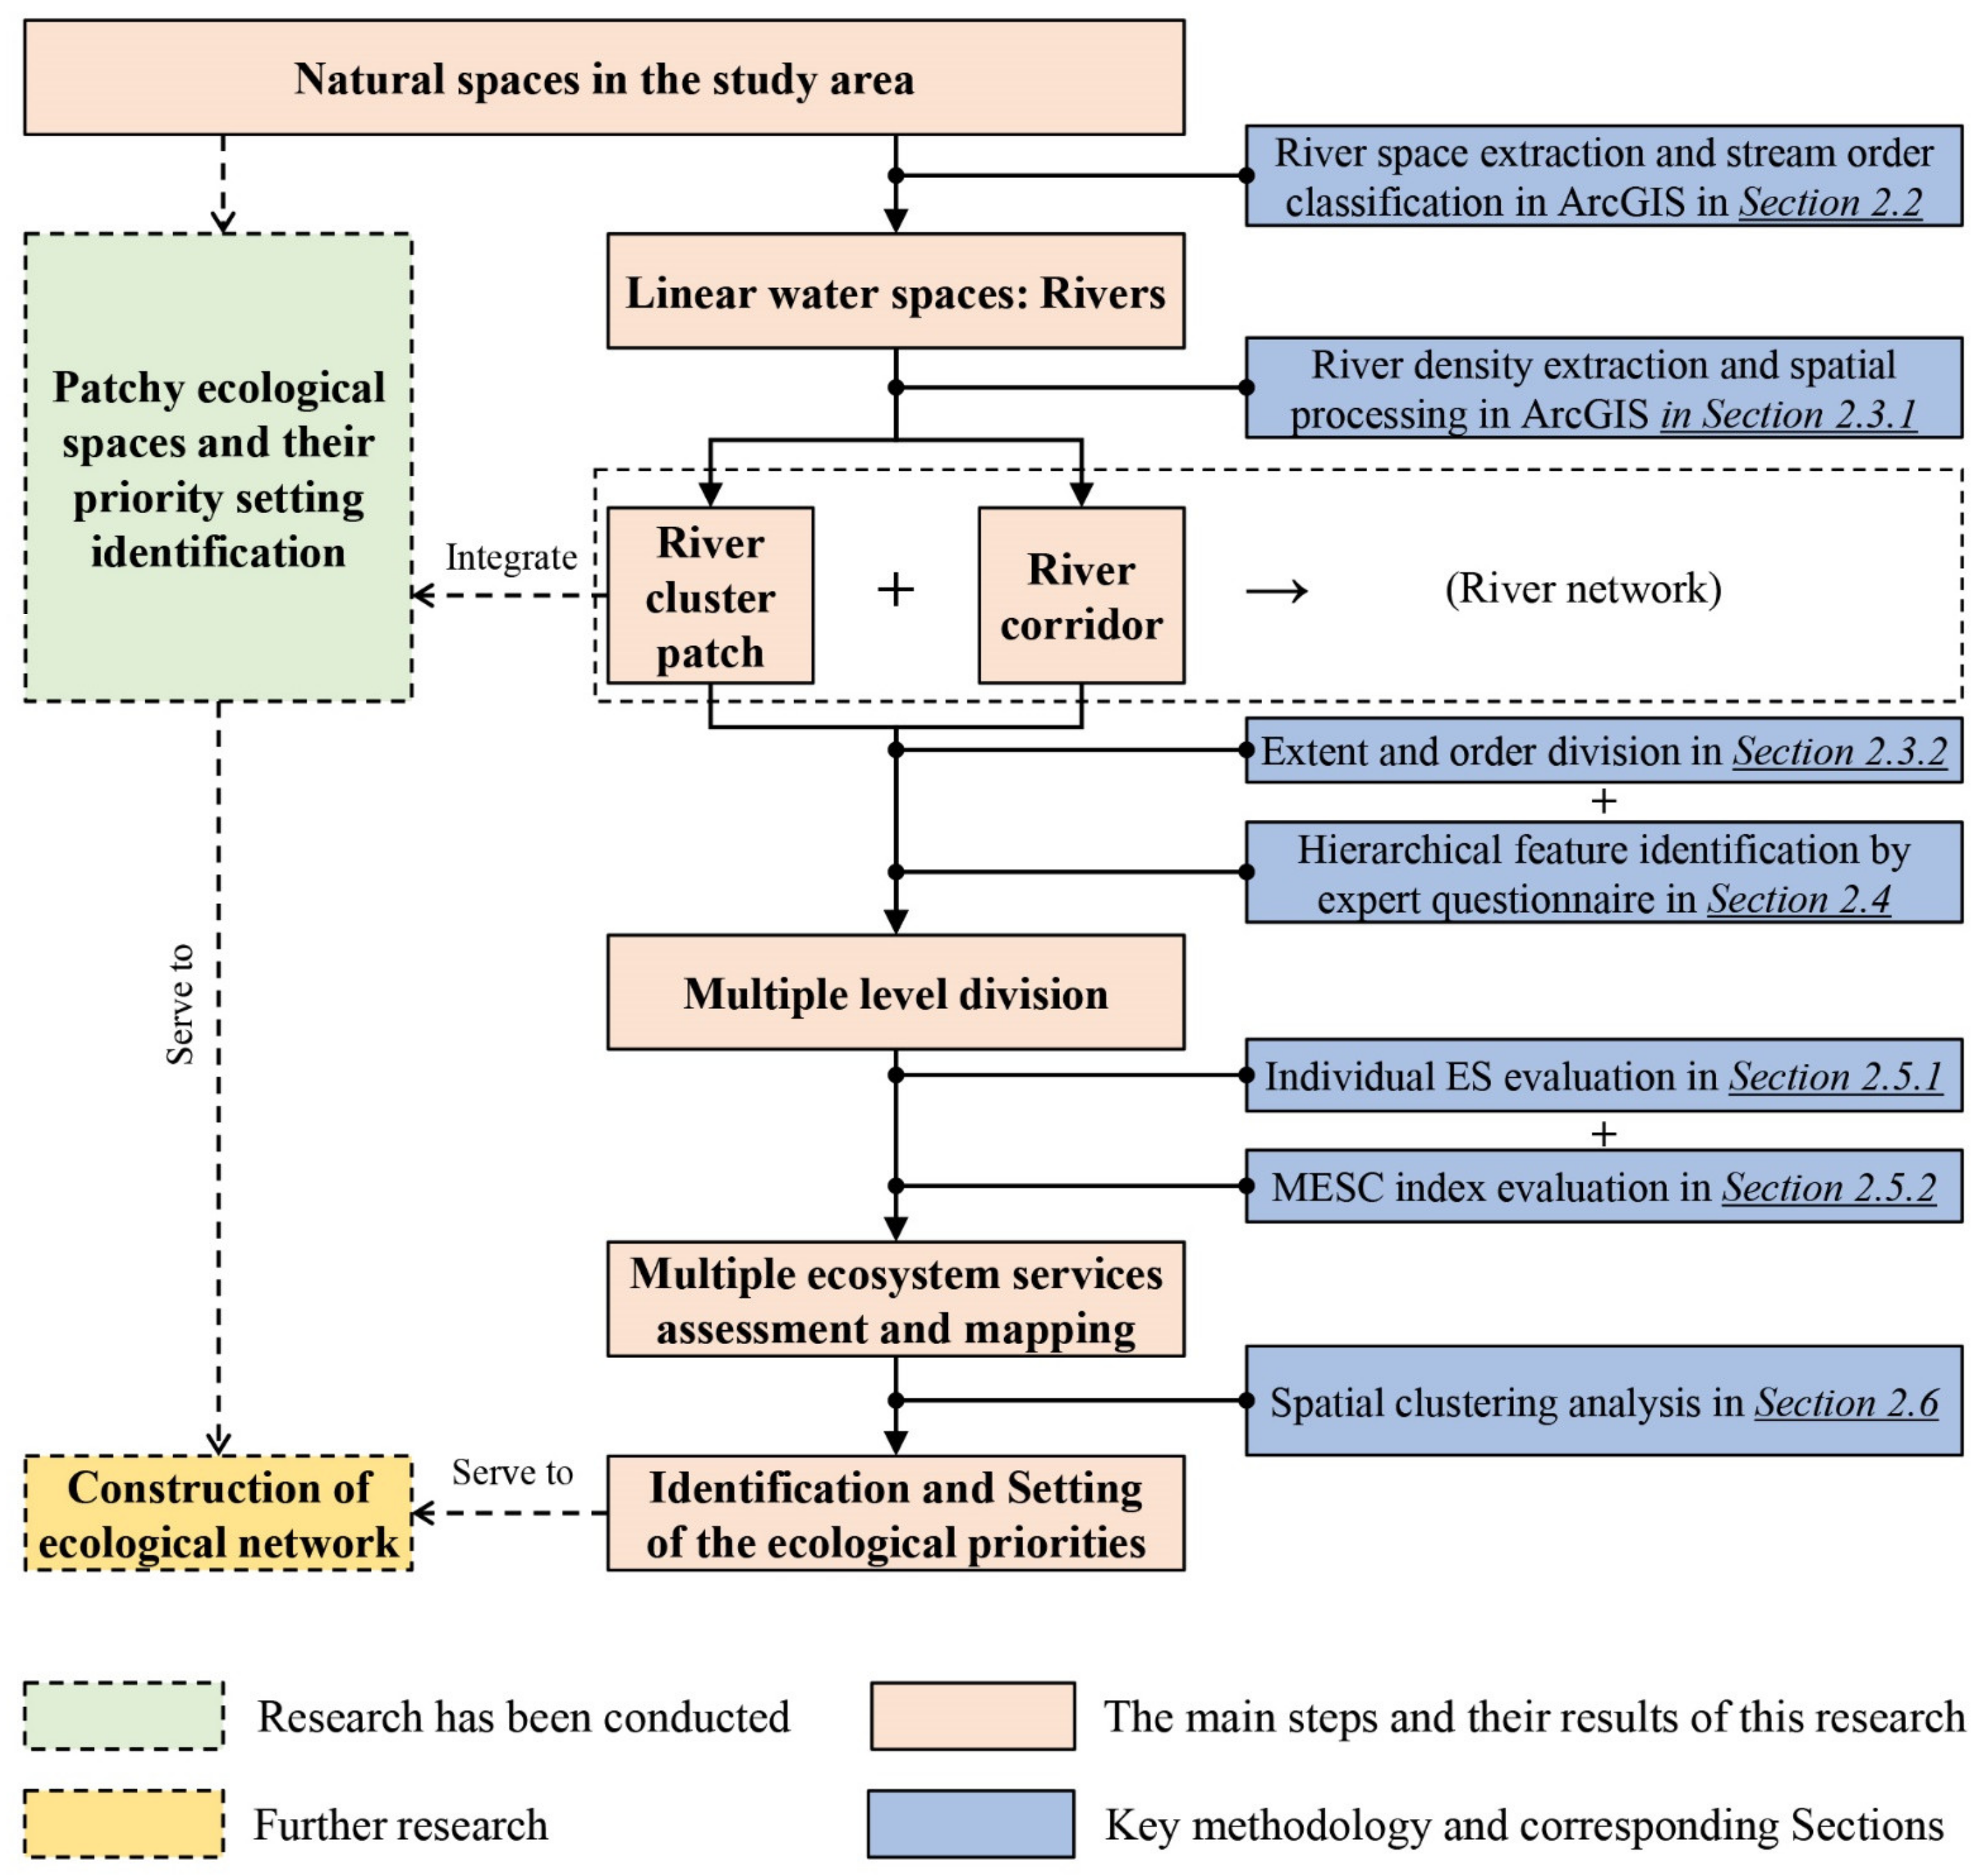
2.1. Research Scope and Methodological Framework

The object of this study is a network of linear water spaces that are markedly different from other patchy ecological spaces in terms of spatial configuration and structural characteristics, including diversified rivers with different sizes, lengths and widths in the study area. The linear space needs to receive special attention because the particularity of its structure will require different indicators for functional assessments. In order to respond to the needs of integrated river management practices from a holistic catchment perspective and highlight the hierarchical features, connectivity and network structure of rivers, we propose a novel technical approach to identify the priorities of linear water spaces (Figure 1).
Firstly, according to the indicator of river density, we further divided the linear water spaces into two spatial configurations: river cluster patches and river corridors. River cluster patches are aggregations with densely clustered and interconnected rivers, showing similar spatial characteristics to patchy ecological spaces, such as lakes, ponds and wetlands. River corridors are relatively independently distributed. Secondly, we divided the river network spatial configurations into multiple levels according to the cluster extent and corridor size, and the hierarchical features of ESs provided by each level of rivers were determined based on experts’ knowledge, including ES types and ecological importance weights of each ES. Thirdly, we used the multi-ecosystem services capacity index to assess and map the multiple ecosystem services provided by rivers at different levels. Finally, based on the evaluation results, a spatial clustering analysis was used to identify the ecological priorities of linear water spaces. The most effective regional ecological security pattern with structural and ecological integrity can be formed by further integrating river protection priorities into the overall ecological network of co-urbanized areas.

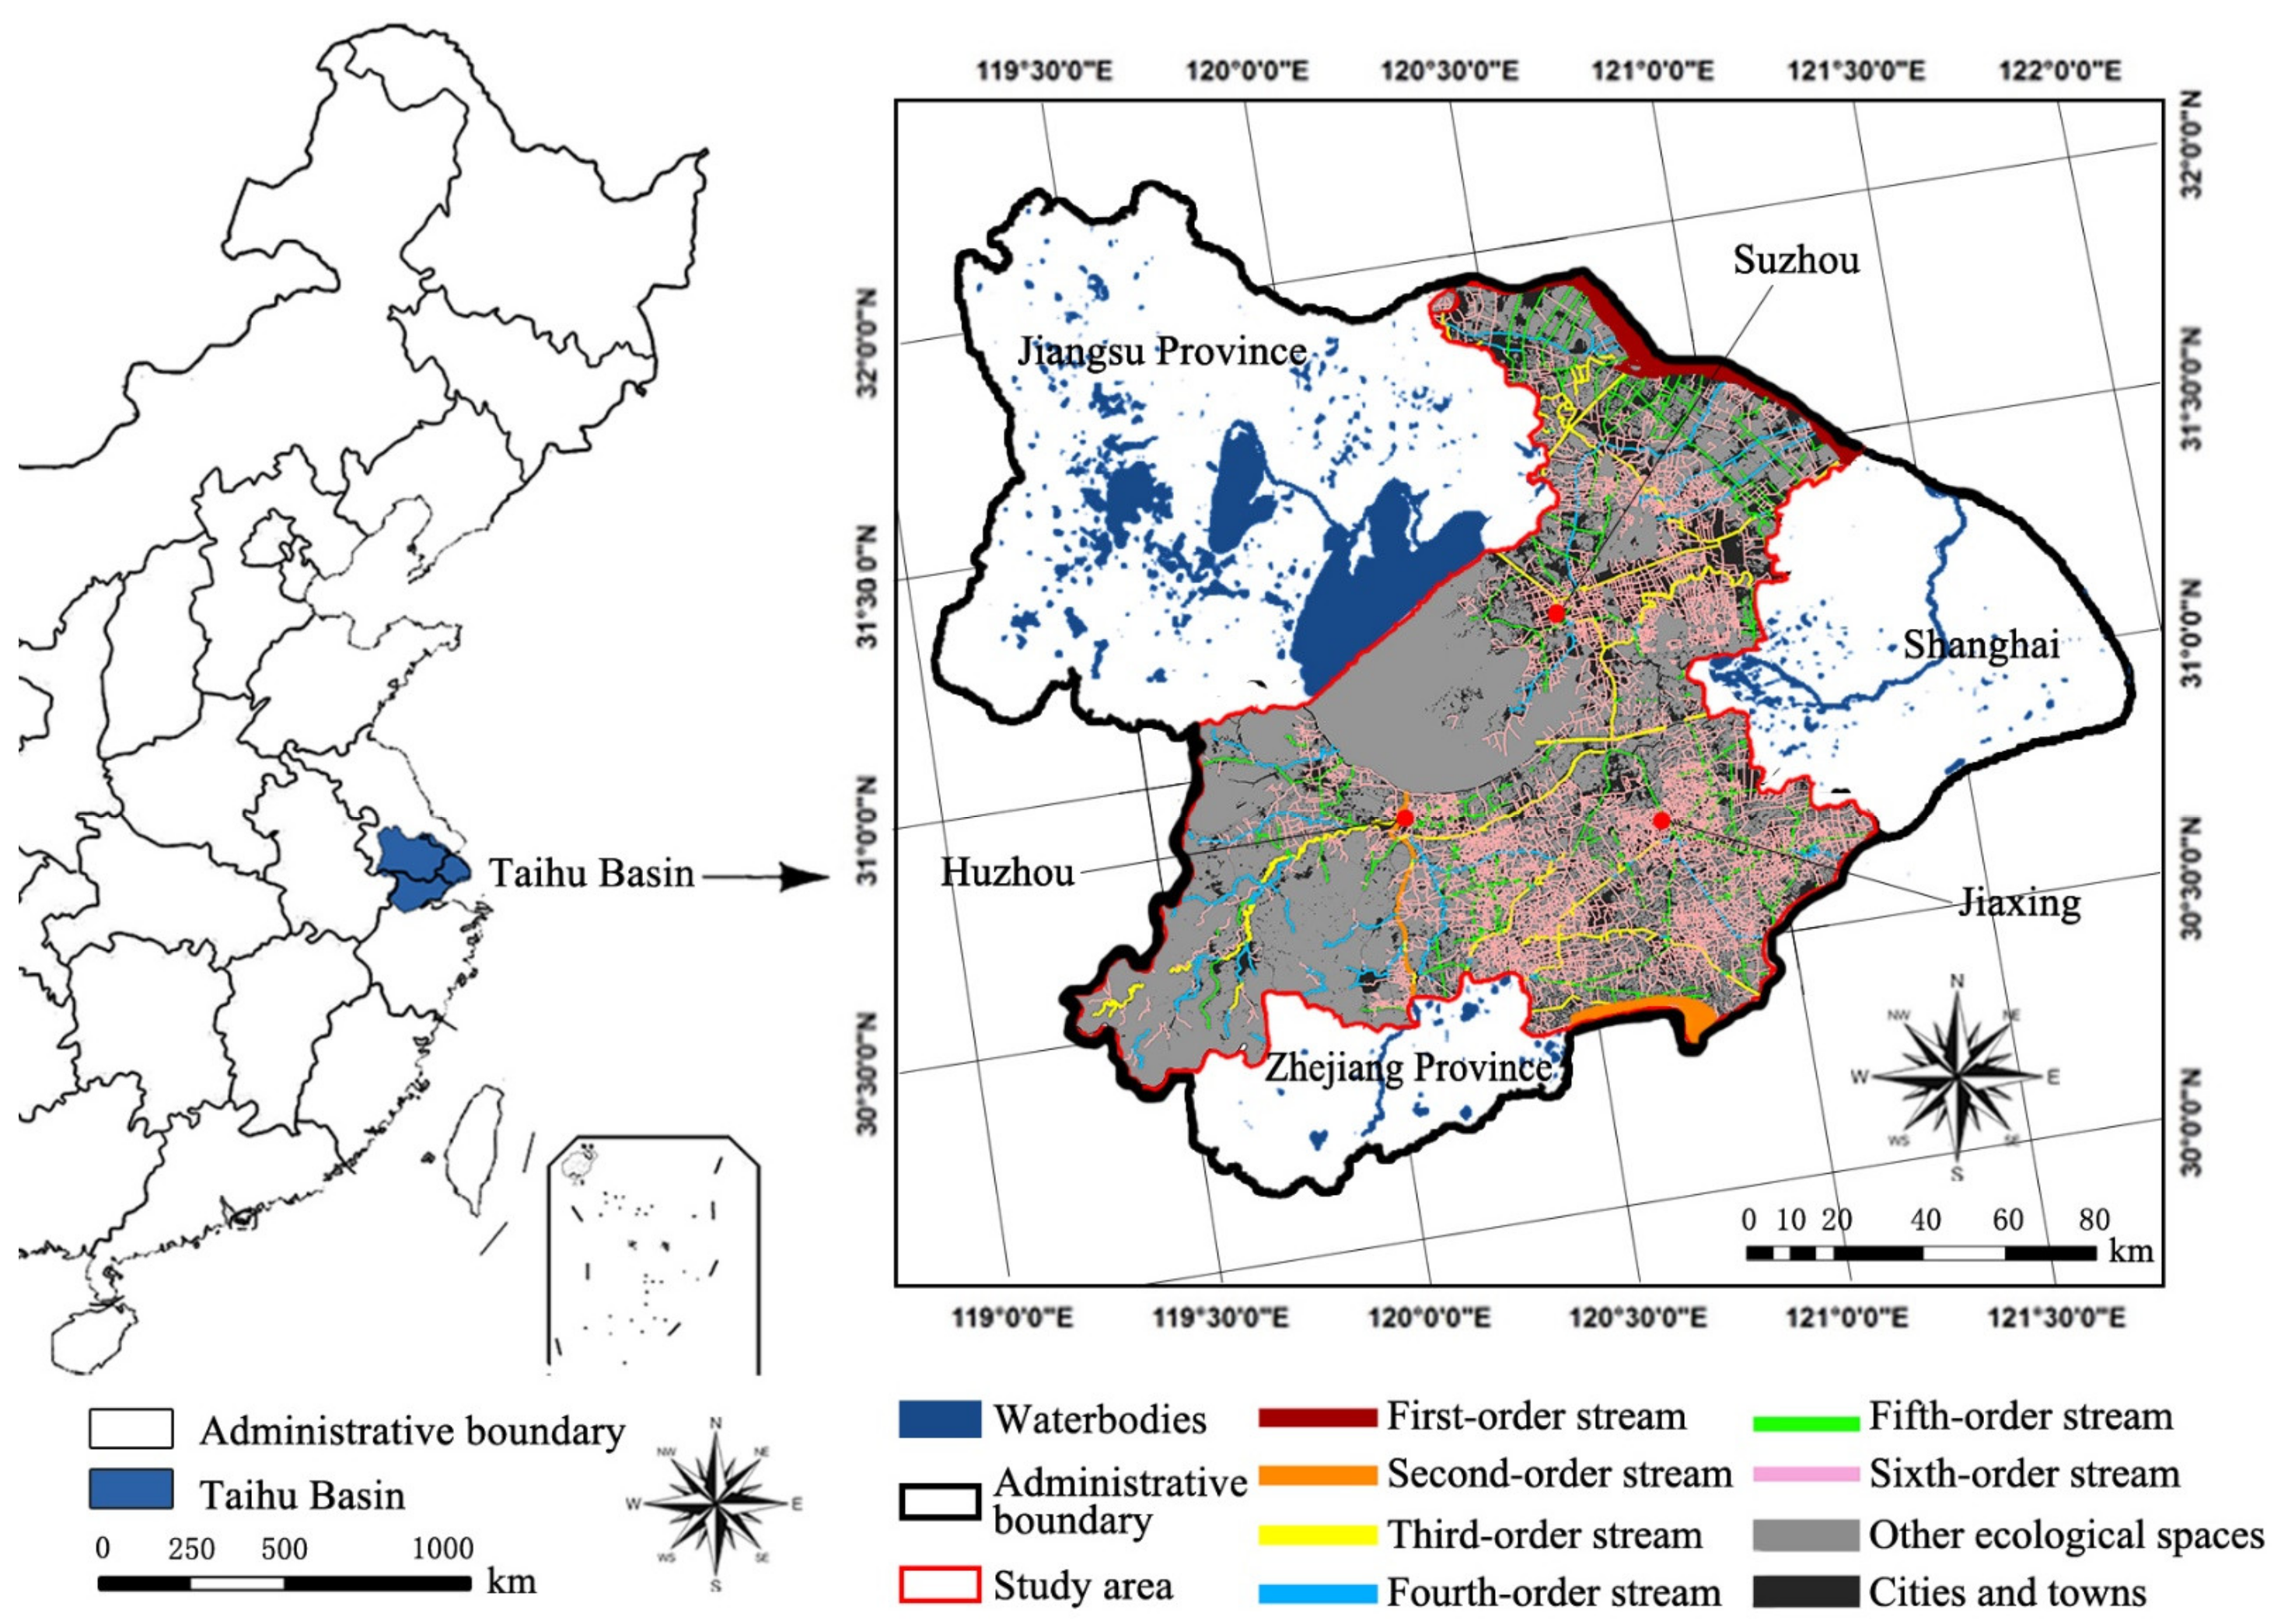
2.2. Study Area, Selected Crucial ESs and Extraction of Linear Water Spaces

Distributed along the east bank of the Taihu Lake, Huzhou, Suzhou and Jiaxing jointly form a co-urbanized area (hereafter called the Hu-Su-Jia area) (Figure 2). With a total area of 1,822,100 ha, the Hu-Su-Jia area has 18,315,000 permanent residents. Located in the world-famous Jiangnan Watertown, it has flat and low topography (less than 10 m above the mean sea level) [32]. This area has crisscross rivers, streams and watercourses. Rivers in this area have a density exceeding 1.5 km/km2.
In the process of rapid urbanization and the development of high-intensity land in China, the urbanization level of this area has been constantly improved, especially between 2000 and 2015 [33]. Encroachment of land resources, pollution from agriculture and industry, fragmentation of ecological spaces and other typical urbanization phenomena seriously threaten the health of the river ecosystem in the Hu-Su-Jia area, leading to great changes in the structure and connectivity of local linear water spaces [34] and causing the whole area to face the following three core ecological risks: urban heat island [35,36], flood disasters [37,38,39,40] and ecological degradation of the water environment [19,20,40].
Aiming at the restoration and optimization of the river network, and closely related to the ecological functions of linear water spaces at all levels, we selected five crucial ESs for linear water spaces to evaluate their ecological functions, namely: water purification service, micro-climate regulation service, flood regulation service, biodiversity conservation service and outdoor leisure service. The first four are regulation services, while the last one is a cultural service.
According to the classification in “Regulations of the People’s Republic of China on the Administration of River Courses” issued by the Ministry of Water Resources of the People’s Republic of China [41], 2960 rivers currently in the Hu-Su-Jia area were extracted and divided into six stream orders (Figure 2).

2.3. Identification and Multi-Level Division of River Network Spatial Configurations

2.3.1. Identification of Two River Network Spatial Configurations

Based on the linear density, that is, the total length of river sections per unit area, the ArcGIS 10.3 software was used to extract high-density river cluster patches of the Hu-Su-Jia area. The specific operation steps are as follows: (1) Create a 2 km × 2 km grid with the “Create Fishernet” command and convert it to a vector polygon grid with the “Feature to Polygon” function. (2) Use the “Intersect” tool to intersect the two layers of vector grid data and river vector data of the Hu-Su-Jia area and divide the rivers into sections within the 2 km × 2 km grids. (3) Summarize the total length of the river sections in each grid on the new layer generated by the intersection using the “Summarize” function of the field in the property table, and create the field “River network density” in the new table. Calculate the river density in each grid (km/km2) through “Total length of the river sections/Grid area”. (4) According to the characteristics of the river density data obtained, use the natural breakpoint method to divide the river into seven grades; the first four grades are identified as “high density” (namely, river density ≥ 2.38 km/km2). (5) Extract the grids with river density defined as “high density”, merge the neighboring grids using the “Dissolve” tool and screen out the patches with areas less than 24 km2 (namely, the patches made of fewer than six grids) to generate the extraction scopes of high-density river cluster patches. (6) Use the command “Clip” to extract river sections within the above scopes to generate river clusters with patchy spatial characteristics.

2.3.2. Multi-Level Division of Two River Network Spatial Configurations

According to the total area of river sections within the river clusters, the tool “Spatial clustering” was used to divide the river cluster patches into four levels: mega river cluster patch, large river cluster patch, medium-sized river cluster patch and small river cluster patch. The independent river corridors remaining after extracting the river cluster patches were also classified into the following four levels according to the six current stream orders provided by the river data of the Hu-Su-Jia area, as well as the spatial distribution characteristics of independent river corridors of each order: large river corridor (first-order streams and Qiantang River, which belongs to the second order), medium-sized river corridor (other second-order streams and third- and fourth-order streams), small river corridor (fifth-order streams) and small channels (all channels other than first- to fifth-order streams). The research scales corresponding to the above four levels of both river cluster patches and river corridors were municipal scale, district scale, township scale and village scale, respectively [42].

2.4. The Hierarchical Features of ESs Provided by Linear Water Spaces

In ecology, ESs provided by ecological spaces of different scales and levels show different characteristics [43,44]. In practice, the preferences of managers and residents significantly influence the selection, importance and related evaluation and management of crucial ESs. Through a questionnaire in the form of a scoring table completed by 20 experts whose research fields include ecosystem services mapping and trade-off, regional water resource management, ecological environmental planning, urban ecological planning, ecosystem services and landscape ecological planning, we obtained authoritative opinions based on expert knowledge, which provided an important reference for this study in the following two aspects: (1) the identification of the main ES types provided by the river cluster patches and river corridors at different levels; (2) the ecological importance weights of each ES on the corresponding research scale provided by the rivers at each level. The detailed questionnaire design and result statistics are shown in the Supplementary Materials.

2.5. Evaluation of Multiple Ecosystem Services of Linear Water Spaces

2.5.1. Evaluation of Single ES

The detailed indicators and calculation formulas for the assessment of five crucial ESs are shown in Table 1.
Biodiversity conservation service. The River Habitat Health and Quality Index (RHHQI) was constructed, and the total river area within the river cluster patches or river corridors and the distance from the nearest interference sources (highways and towns) were regarded as the composite surrogate indicators [45,46,47,48,49]. In addition, the effects of river network complexity [50,51] and river corridor level on service supply capacity were also considered.
Flood regulation service. The Regulation and Storage Ability Index (RSAI) was established, and the total river area within the river cluster patches, the number of river sections and the fractal dimensions of the river cluster patches were considered the composite surrogate indicators [42,51]. Based on the quantitative relationship between the absolute variation in the river level and river area, an evaluation model of the river corridor’s adjustable storage ability (RASA) was established [52,53], and the influence of the river corridor level on service supply capacity was also considered.
Micro-climate regulation service. Constructed River Cooling Effect Index (RCEI). Based on the impact of the total river area within the river cluster patches, river morphological complexity and the number of river sections on its cooling range and radius [53,54], the temperature regulation capacity of river cluster patches was evaluated. Based on the effect of the factors on the environmental micro-climate regulation capacity of river corridors in the urbanized area, including the corridor area, the distance from the nearest construction patches and the ratio of natural patches in the buffer zones along both sides of the river [54,55], the service supply capacity of river corridors was evaluated.
Water purification service. The Water Purification Ability Index (WPAI) of river cluster patches was constructed, and the total river area within the river cluster patches, river density and connectivity were used as composite surrogate indicators [51,56,57]. For river corridors, the proxy of the Total Nitrogen Retention (TNR) was used as a way to assess the water purification service capacity of each river corridor [40,58].
Outdoor leisure service. The River Outdoor Leisure Index (ROLI) was built, and the ability of rivers to provide this service was calculated as a function of the total river area within the river cluster patches or river corridor length, outdoor leisure opportunities within or around the river and distance to the nearest built-up areas and main roads (highway and provincial highway) [59,60].

2.5.2. Coupling Evaluation of Multiple Ecosystem Services

We directly used a coupling evaluation model constructed in our former work [61] to assess the multiple ecosystem services provided by linear water spaces at various levels, which provide multiple ESs that have synergetic effects. The model was based on the assumption that if the multiple ESs provided by an ecological space have synergetic effects with each other, then the overall effect of this ecological space that supplies these ESs is stronger than the direct superposition of the single ES supply [62,63]. Spearman’s rank correlation analysis was used to determine if there is a synergetic effect between pairings of single ESs provided by linear water spaces [62,64], which is the premise of using the coupling evaluation model. If the correlation coefficient is positive and significant, then there is a synergy between the two ESs. Otherwise, there is no synergy between them. Statistical analysis of data was conducted using SPSS 18.0, and statistical tests were performed at a level of 0.01 [65].
The five crucial ESs were numbered from 1 to 5: biodiversity conservation service—1; flood regulation service—2; micro-climate regulation service—3; water purification service—4; outdoor leisure service—5. The function f x 1 , x 2 , x 3 , x 4 , x 5 of the MESC index (the range of the scores is 0.0–5.0) of a certain linear water space can be set as follows:
f x 1 , x 2 , x 3 , x 4 , x 5 = β ω s i i = 1 N ω i x i + ω s y i = 1 N x i ω i
where i is each ES’s sequence number; Λ 1 ,   2 ,   3 ,   4 ,   5 is the set of sequence numbers corresponding to the multiple ESs provided by a linear water space; N = Λ (the number of elements in Λ set) is the sum of multiple ES types provided by a linear water space; x is the ranking value (the value range is 1–5) of a single ES provided by a linear water space; and ω i is the weight of influence of each single ES, defined by the following expression:
ω i = ω ˜ i j Λ ω ˜ j
where i Λ ω i = 1 ; j and i are the different sequence numbers of different single ESs; and ω ˜ i is each ES’s ecological importance weight provided by linear water spaces at each level on the corresponding research scale. The values of the weights of each level were derived from the average value of the results of 20 expert questionnaires. ω s i i Λ ω i x i is the total effect of the individual and independent influence of a single ES on the linear water space’s MESC index at a certain level; ω s i is the total weight of the effect of a single ES, and its formula is as follows:
ω s i = 1 N + 2
ω s y i Λ x i ω i is the overall contribution of the synergetic effects among all ES pairs provided by a linear water space at a certain level to its MESC index; ω s y is the overall weight of the contribution with the effects of synergy. The synergetic effect among all ESs is assumed to have a much greater influence on the level of the MESC index than the independent influence of each single ES on the index, and it can be calculated as follows:
ω s y = N + 1 N + 2
β is the scale factor and is calculated by the following formula:
β = N 5
The MESC index evaluation results of linear water spaces at all levels in the study area can be obtained through this coupling evaluation model.

2.5.3. Data Source and Processing and Spatial Analysis of Multiple Ecosystem Services

Five ESs provided by linear water spaces were calculated using six datasets: 1–10,000 river maps (polygons and lines); land use map; 1–100,000 road maps; thematic data of scenic spots, historical sites and green space parks; and statistical data (Table 2).
All spatial data were obtained in 2015, and ArcGIS 10.3 was used for data processing based on a resolution of 15 m × 15 m. The calculation results of each ES were summarized for each river cluster patch and river corridor. Spatial data were processed, analyzed and visualized in ArcGIS 10.3:
(1)
The natural breakpoint method was used to classify the evaluation results of a single ES into five ranks based on their data characteristics: 1 means lower, 2 means low, 3 means moderate, 4 means high and 5 means superior. The ranking values were input into ArcGIS 10.3, and the river cluster patches providing the same ES were combined with the river corridors according to the ranking values to form the maps of five single ESs in the Hu-Su-Jia area.
(2)
The coupling evaluation results of river cluster patches and river corridors’ MESC indexes were input into ArcGIS 10.3 to form a map of the multi-ecosystem service capability of linear water spaces in the study area.

2.6. Linear Water Space Priority Identification with Spatial Clustering Analysis

Spatial cluster analysis is a common method to determine spatial clusters based on ES supply capacities [66]. Therefore, a classification process can be performed to find the natural clusters existing in the data of the MESC index assessment results of each linear water space. This process was realized by using the “Grouping Analysis” function in the “Mapping Clusters” tool in ArcGIS 10.3 software. The “NO_SPATIAL_CONSTRAINT” option in the spatial constraint item was chosen, which is based on the K-means algorithm. This means that linear water spaces in the same cluster do not have to be spatially adjacent. By searching cluster division results that separate all linear water spaces into clusters by minimizing the differences within the cluster while maximizing differences between clusters [67,68], the river cluster patches and river corridors in each cluster were ensured to have the same levels of MESC indexes. To determine the optimal number of clusters for linear water space priority, this study used the Silhouette Measure to test the results of different clusters [62,69]. Finally, we obtained six priorities, which constitute the priorities of linear water spaces.

3. Results

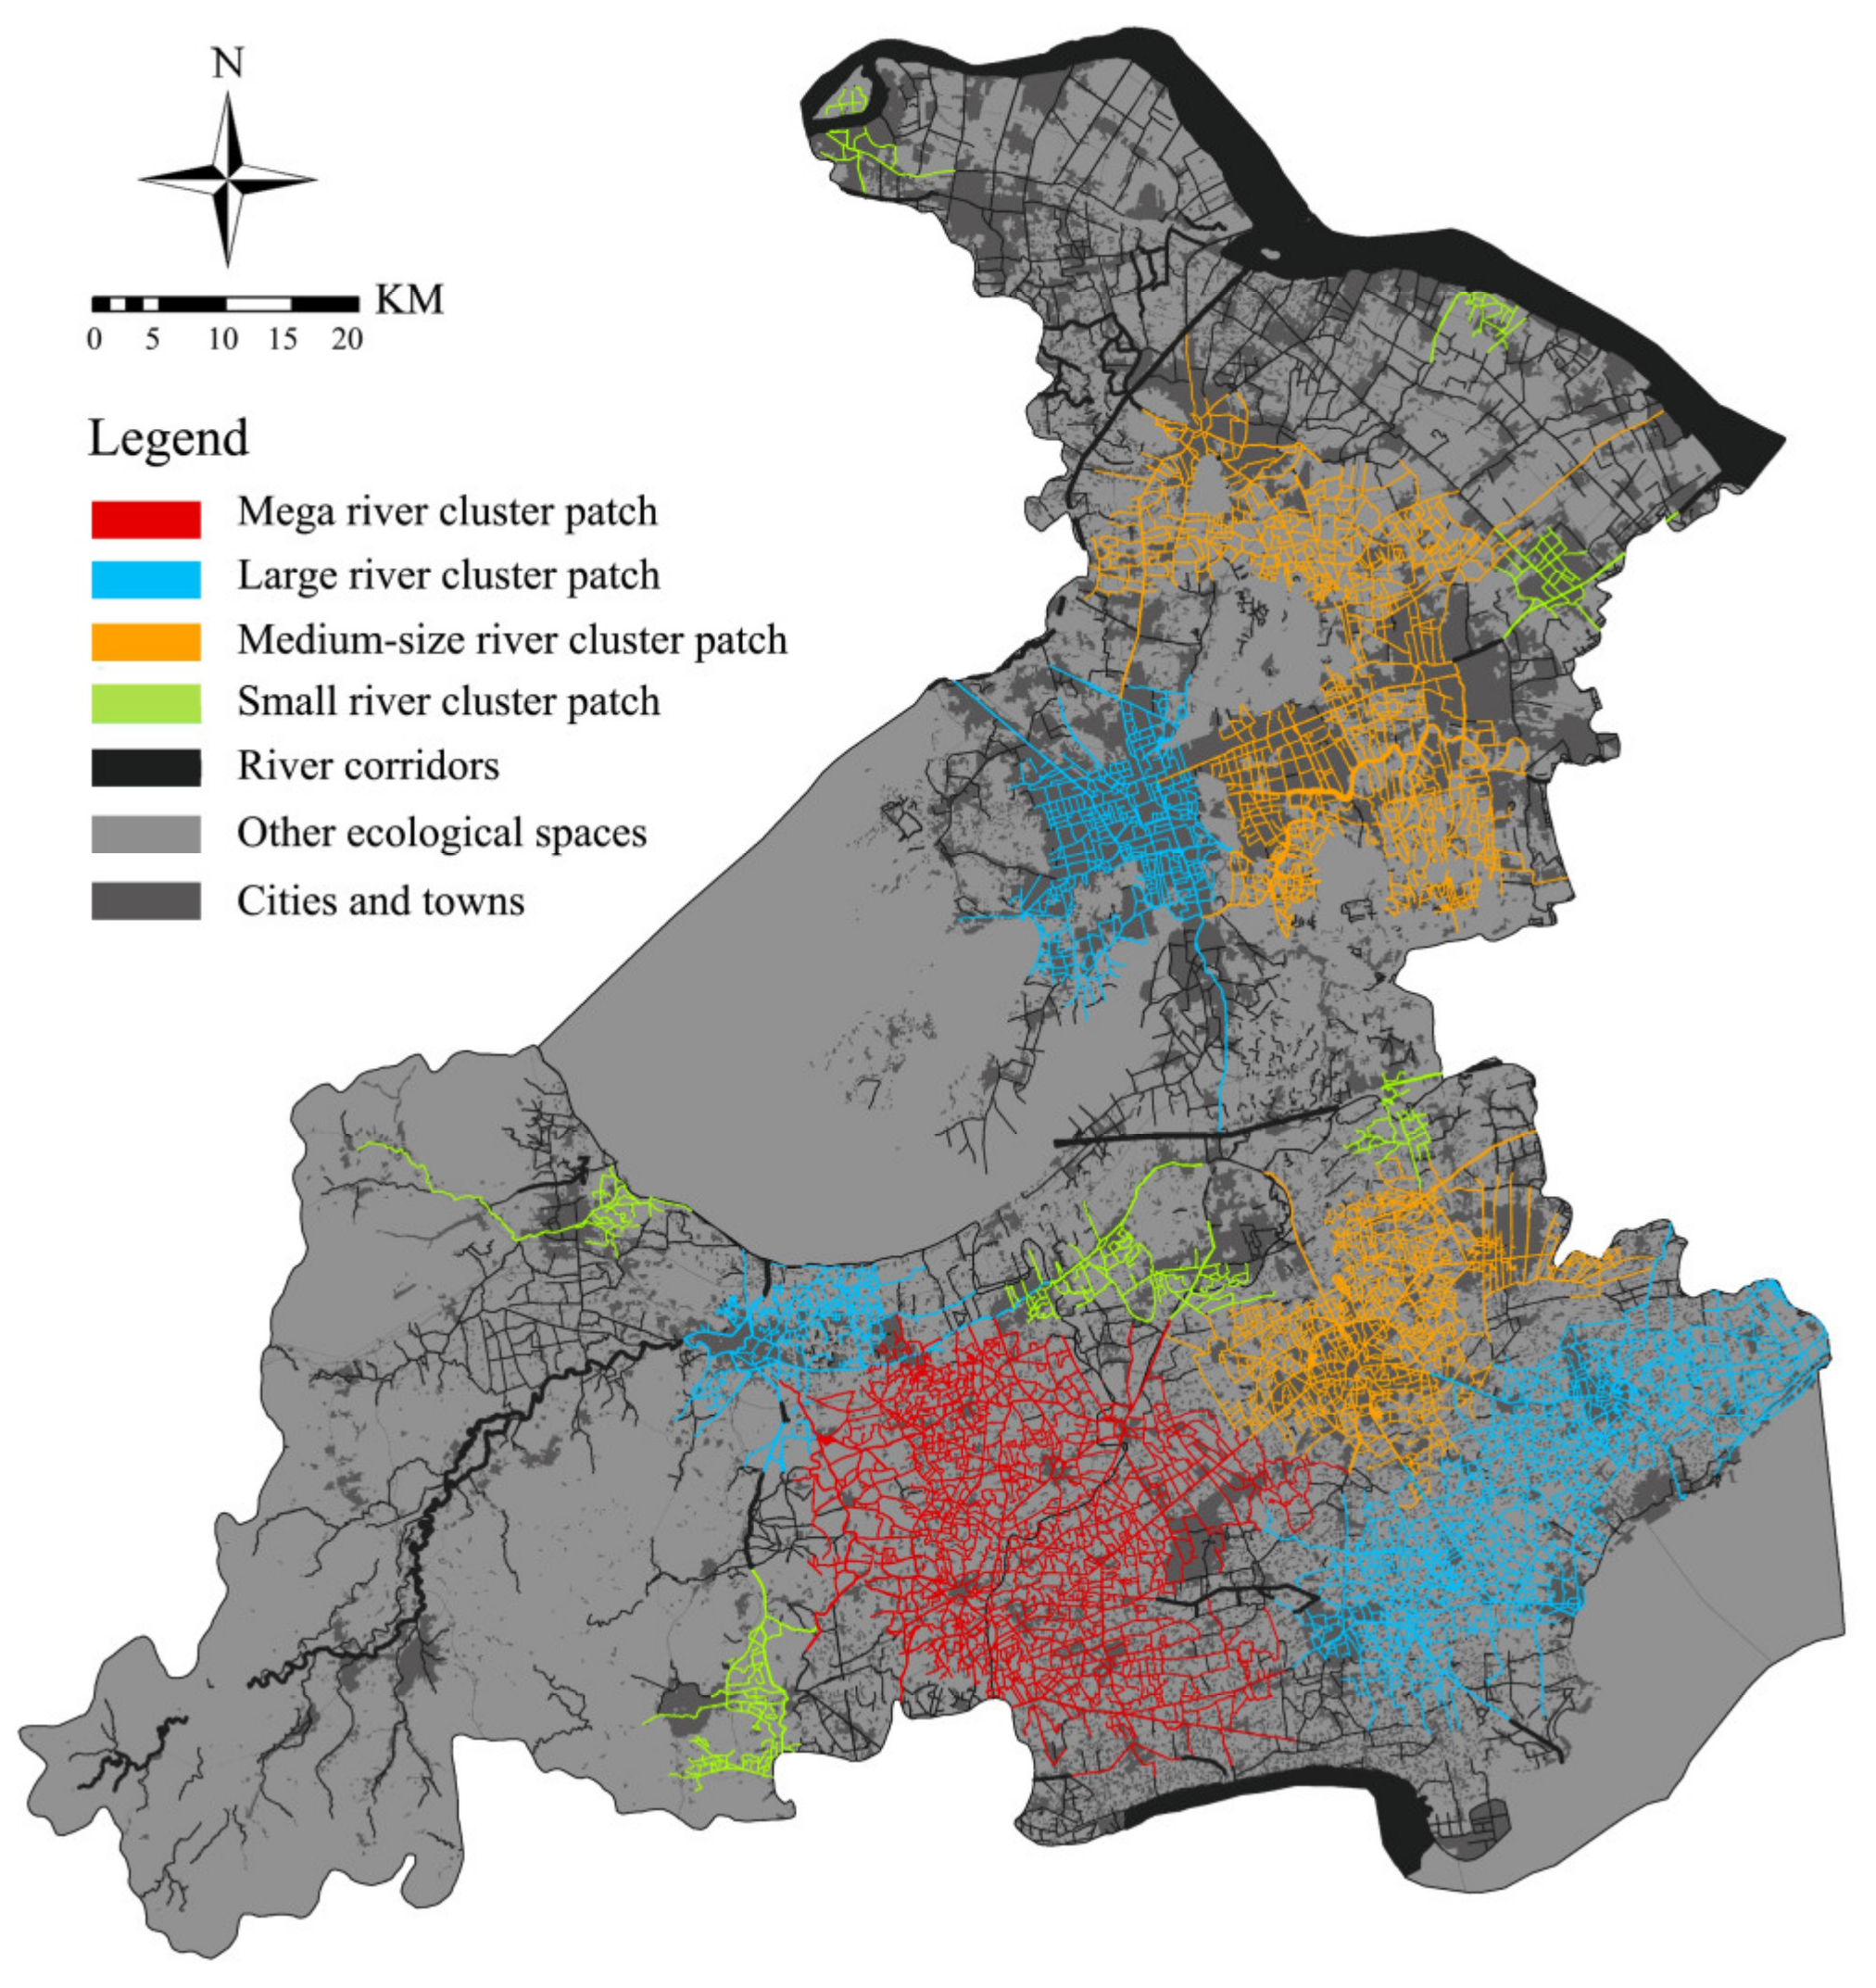
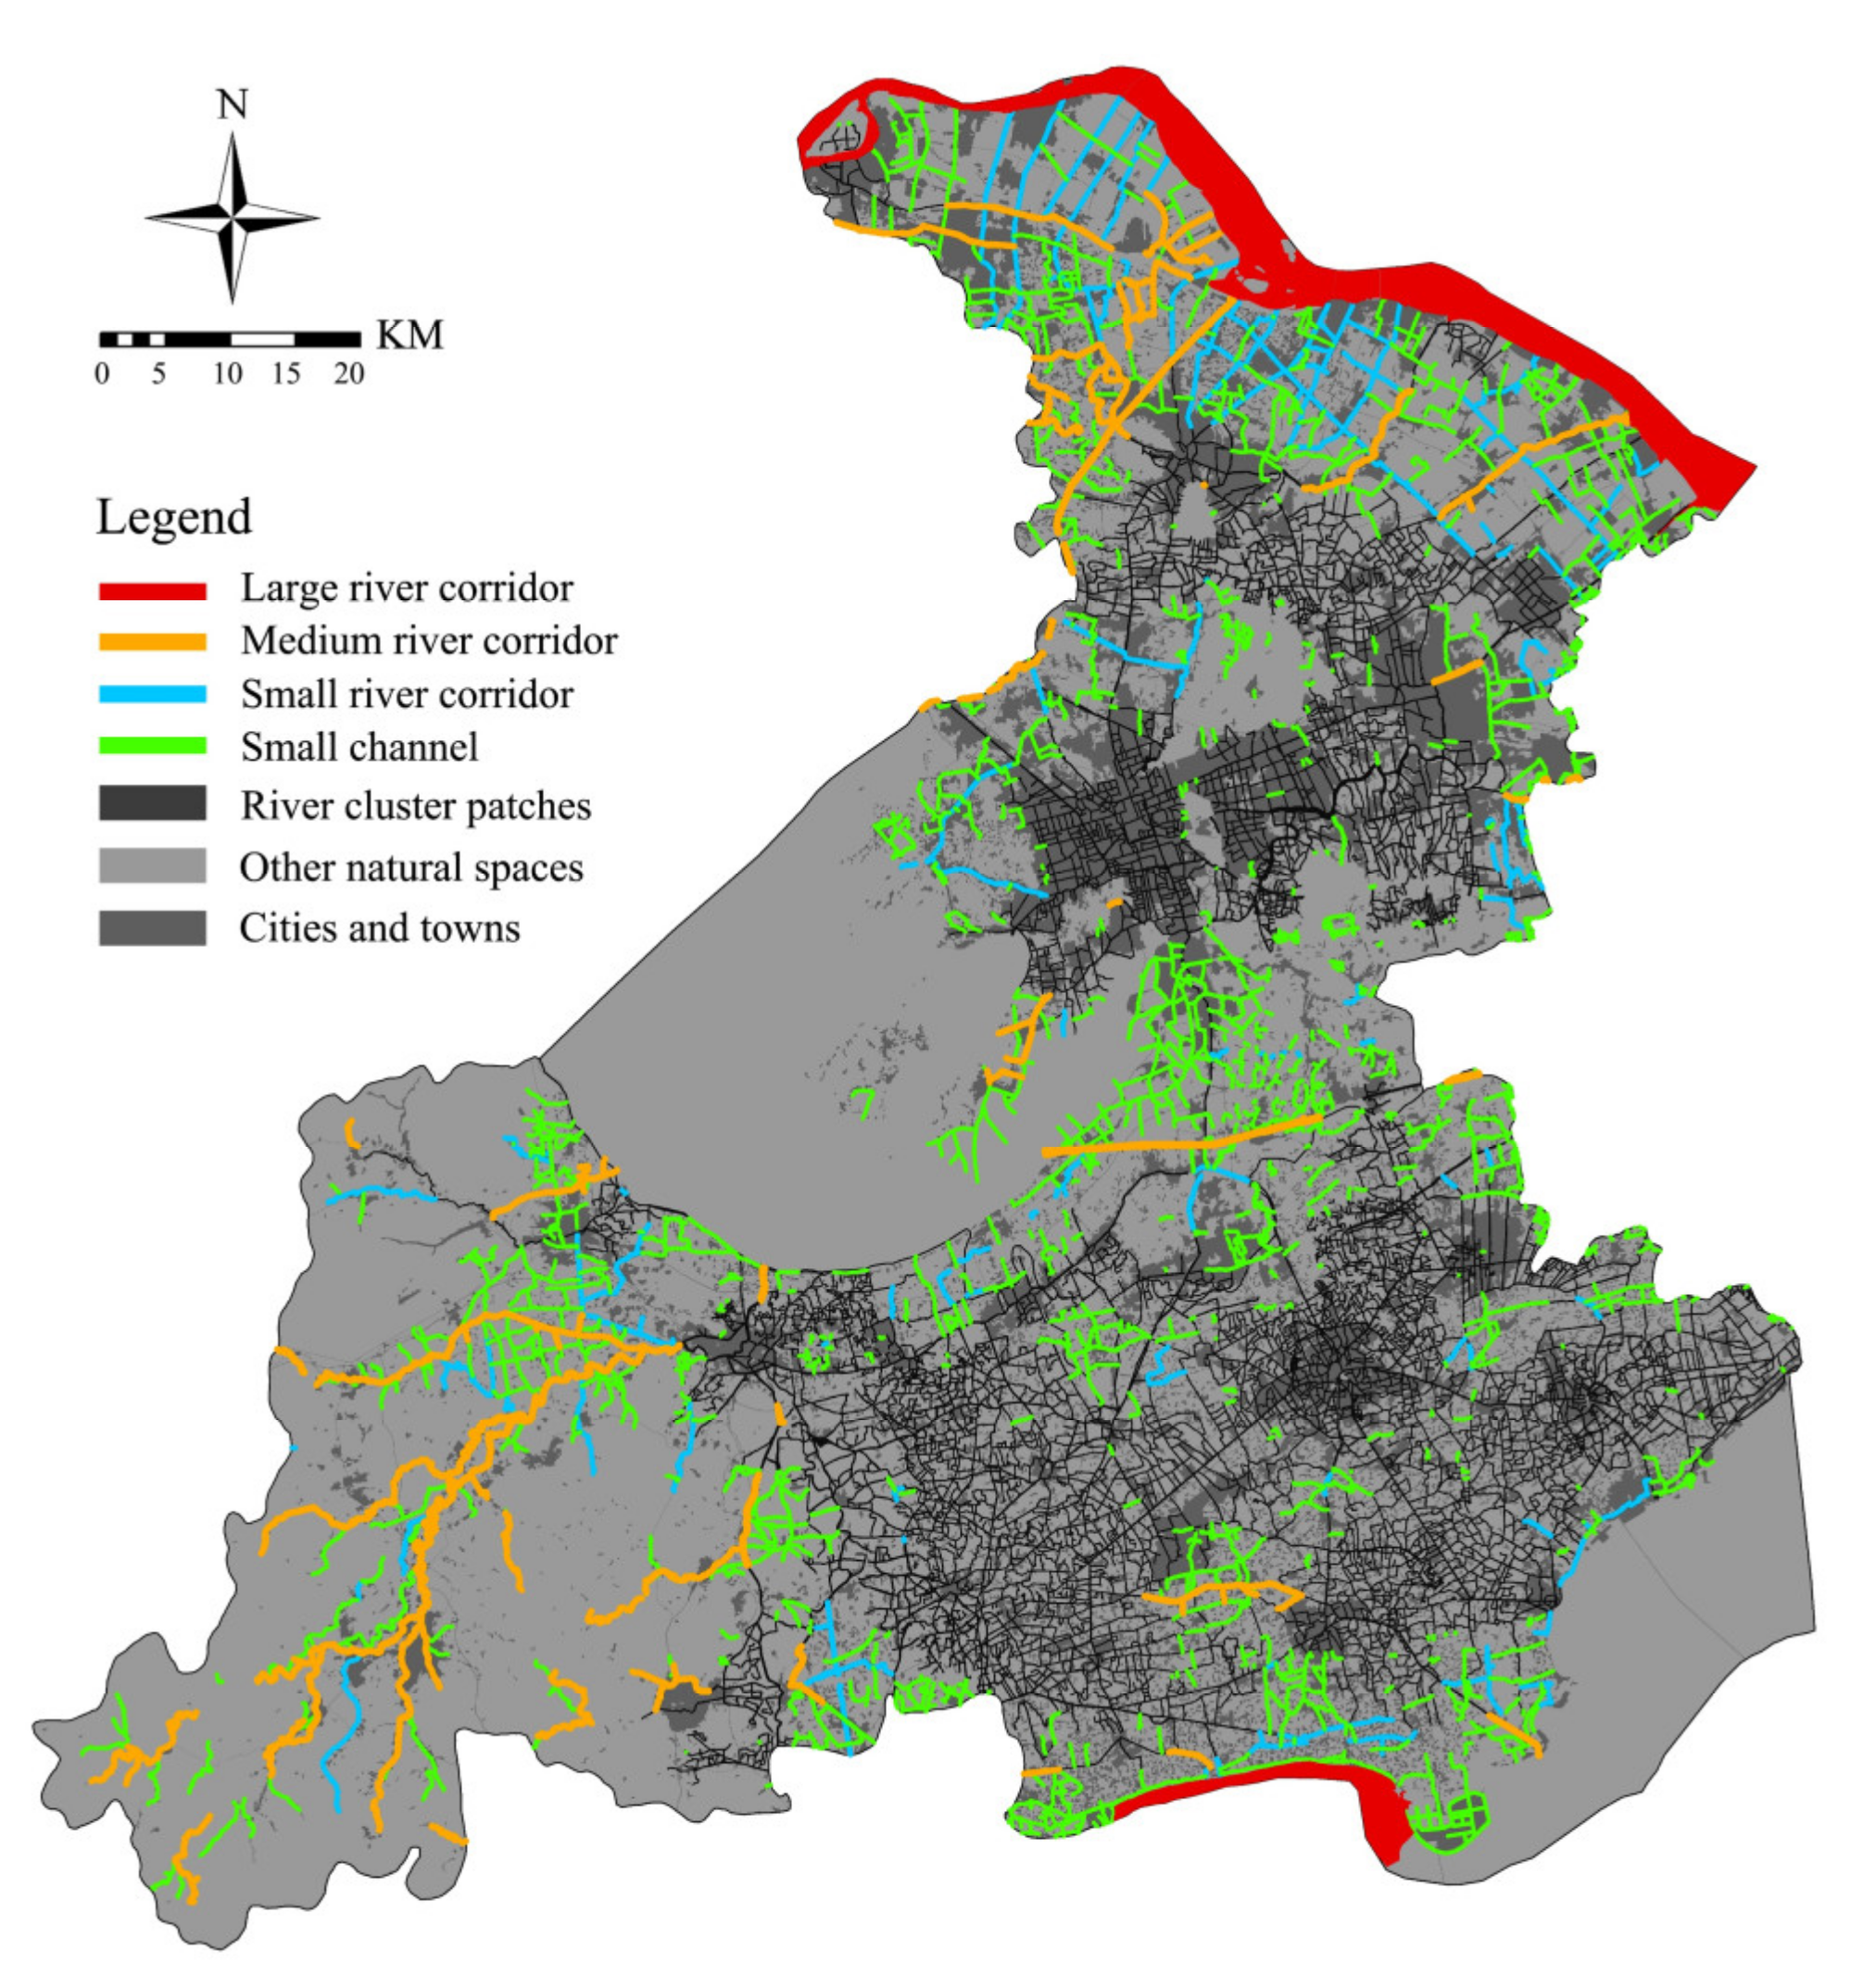
3.1. High-Density River Cluster Patches and Independent River Corridors

After intersecting the river map of the Hu-Su-Jia area with the 2 km × 2 km grid, 11,839 river sections were generated in total. A total of 17 river cluster patches were extracted based on linear density (Figure 3). The average river network density is 4.86 km/km2, the total river area is 332.72 km2, and the total length of river sections is 18,356.24 km. There is one mega river cluster patch at the municipal research scale, which is located across Huzhou and Jiaxing, at the junction of the two cities where the rivers are dense and connected to a large piece of land. There are three large river cluster patches on the district research scale, among which two are in the northern suburb and urban area of Suzhou, and one is in the northern suburb of Jiaxing. There are four medium-sized river cluster patches on the township research scale, among which one is in the urban area of Suzhou, one is in the northern urban area of Huzhou, and two are in the eastern suburb of Jiaxing. There are nine small river cluster patches on the village research scale, with three patches in each of the three cities. See Table A1 for the specific statistics of the spatial recognition and extraction results of 17 river cluster patches at each level.
The independent river corridors remaining after the extraction of river cluster patches were classified into four levels according to the stream orders (Figure 4). There are two large river corridor sections in total, including one first-order stream, which is the Yangtze River in the study area, and one second-order stream, which is the Qiantang River in the study area. There are a total of 145 sections of medium-sized river corridors, including four second-order stream sections belonging to Tiao River, 54 third-order stream sections and 87 fourth-order stream sections. There are 206 small river corridor sections in total, all of which are fifth-order stream sections. There are a total of 1552 sections of small channels, all of which are sixth-order stream sections, distributed throughout the study area. The specific statistics of spatial identification results of river corridors at each level are shown in Table A2.

3.2. Multiple Ecosystem Services and Ecological Importance Provided by Linear Water Spaces at Different Levels

This study summarized the findings of 20 experts on the types and ecological importance of multiple ecosystem services provided by river cluster patches and river corridors at different levels. The average weight of ecological importance (namely, ω ˜ i   in   Formula   2 ) provided by the experts was calculated. If an expert judged that a river at a certain level does not significantly provide an ES, that is, if they indicated “No” for the type of ES, then we marked its corresponding weight percentage of ecological importance as “0” and substituted it into the calculation of the average value. The specific statistical results of ecological importance weight are shown in Table A3.

3.3. Evaluation of Multiple Ecosystem Services of Linear Water Spaces

3.3.1. Evaluation and Mapping of Single ES

The mapping of five crucial ESs of linear water spaces in the Hu-Su-Jia area is shown in Figure 5. The statistical results of each ES are shown in detail in Table A4.
The high-supply spaces (4—High; 5—Superior) of the biodiversity conservation service consist of one mega, three large and one medium-sized river cluster patches due to their large extents and rich river composition levels, which provide sufficient and diverse breeding and habitat spaces for aquatic organisms. The Yangtze River and the Qiantang River in the study area are high-supply river corridors, which is related to their high stream order, wide riparian belts and relatively large distance from densely populated built-up areas.
For the flood regulation service, the mega river cluster patch, one large river cluster patch in the north of Jiaxing, and the Qiantang River and the Yangtze River are the high-supply spaces in the study area. This is due to the wide river channels and mature water systems, which can provide large and stable storage spaces for excessive flooding in urbanized areas.
For the micro-climate regulation service, the mega river cluster patch and two large river cluster patches in the urban area of Suzhou have a beneficial cooling impact on urban land surface temperature. The sections of the Yangtze River and the Qiantang River are river corridors with high supply capacity, which is related to their large area, long distance from buildings and large greening ratios on both riversides.
The high-supply spaces of the water purification service include two river corridors with high self-purification capacity, the Yangtze River and the Qiantang River, as well as the mega river cluster patch and all three large river cluster patches. These patches have higher water cycle efficiency and water nutrient transport capacity due to the good connectivity of the rivers within them, so the water quality purification capacity is relatively high.
The high-supply spaces of the outdoor leisure service are the Yangtze River, Qiantang River and the mega river cluster patch, which is mainly attributed to the larger area coverage of the cluster and the longer river corridor providing more recreational opportunities on both sides. Two large and one medium-sized river cluster patches in the urban area of Suzhou and one large river cluster patch in the urban area of Jiaxing are the high-supply spaces of the outdoor leisure service due to their high accessibility, with more possibilities to visit and use these spaces.

3.3.2. Evaluation and Mapping of Multiple Ecosystem Services

The Spearman’s rank correlation analysis results of ESs from each linear water space all show that the 10 ES pairs are significantly positively correlated (p < 0.01, and r > 0) (Table A5). This indicates that the ESs provided by river cluster patches and river corridors have synergetic effects, and they can enhance and promote each other on the supply level instead of weakening each other.
On the basis of Formula (1) of the MESC index serving as the general model, the evaluation models of rivers at different levels (Formulas (6)–(13)) were acquired according to the average values of the ecological importance weights of river cluster patches and river corridors at different levels assigned by experts (Table A3). The calculations were input into ArcGIS to map the MESC index distributions of the linear water spaces in the Hu-Su-Jia area (Figure 6). Detailed statistical results for the MESC indexes of the two kinds of river network spatial configurations are shown in Table A6.
Mega river cluster patch:
f x 1 , x 2 , x 3 , x 4 , x 5 = 1 7 × 0.23 x 1 + 0.24 x 2 + 0.21 x 3 + 0.18 x 4 + 0.13 x 5 + 6 7 x 1 0.23 x 2 0.24 x 3 0.21 x 4 0.18 x 5 0.13
Large river cluster patch:
f x 1 , x 2 , x 3 , x 4 , x 5 = 1 7 × 0.22 x 1 + 0.25 x 2 + 0.21 x 3 + 0.16 x 4 + 0.16 x 5 + 6 7 x 1 0.22 x 2 0.25 x 3 0.21 x 4 0.16 x 5 0.16
Medium-sized river cluster patch:
f x 1 , x 2 , x 3 , x 4 , x 5 = 1 7 × 0.24 x 1 + 0.25 x 2 + 0.20 x 3 + 0.13 x 4 + 0.18 x 5 + 6 7 x 1 0.24 x 2 0.25 x 3 0.20 x 4 0.13 x 5 0.18
Small river cluster patch:
f x 1 , x 2 , x 3 , x 4 , x 5 = 1 7 × 0.27 x 1 + 0.20 x 2 + 0.17 x 3 + 0.11 x 4 + 0.26 x 5 + 6 7 x 1 0.27 x 2 0.20 x 3 0.17 x 4 0.11 x 5 0.26
Large river corridor:
f x 1 , x 2 , x 3 , x 4 , x 5 = 1 7 × 0.22 x 1 + 0.34 x 2 + 0.19 x 3 + 0.15 x 4 + 0.10 x 5 + 6 7 x 1 0.22 x 2 0.34 x 3 0.19 x 4 0.15 x 5 0.10
Medium-sized river corridor:
f x 1 , x 2 , x 3 , x 4 , x 5 = 1 7 × 0.23 x 1 + 0.28 x 2 + 0.17 x 3 + 0.17 x 4 + 0.16 x 5 + 6 7 x 1 0.23 x 2 0.28 x 3 0.17 x 4 0.17 x 5 0.16
Small river corridor:
f x 1 , x 2 , x 3 , x 4 , x 5 = 1 7 × 0.24 x 1 + 0.23 x 2 + 0.15 x 3 + 0.16 x 4 + 0.23 x 5 + 6 7 x 1 0.24 x 2 0.23 x 3 0.15 x 4 0.16 x 5 0.23
Small channel:
f x 1 , x 2 , x 3 , x 4 , x 5 = 1 7 × 0.34 x 1 + 0.19 x 2 + 0.10 x 3 + 0.17 x 4 + 0.21 x 5 + 6 7 x 1 0.34 x 2 0.19 x 3 0.10 x 4 0.17 x 5 0.21
The range of the MESC indexes of river cluster patches is 1.3–5.0. The mega river cluster patch has the highest MESC index (5.0), and a large river cluster patch located in the north of Suzhou has the second highest (4.1). The MECS indexes of two large cluster patches and one medium-sized cluster patch located in Suzhou have relatively high levels in providing multiple ecosystem services (3.2–3.9). The range of the MESC indexes of the other three medium-sized river cluster patches and two small river cluster patches located in the south of Huzhou and at the junction of Suzhou and Huzhou is 2.0–2.8, which is a moderate level. The MESC index of the other seven small river cluster patches is relatively low (1.3–1.5).
The MESC indexes of river corridors range from 1.0 to 5.0. The MESC index of the Yangtze River in the Hu-Su-Jia area is the highest (5.0), followed by the Qiantang River (4.1). There are two river corridors with a relatively high MESC index (3.0), namely, Wangyu River and Taipu River. The MESC indexes of 16 river sections are at the medium level (2.0–2.2), while the remaining 1885 river sections are small river corridors or small channels with a low comprehensive capacity to provide multiple ecosystem services (1.0–1.8).

3.4. Setting Priorities of Linear Water Spaces

The spatial cluster analysis divided linear water spaces in the Hu-Su-Jia area into six priority grades based on their MESC indexes (Figure 7), and these six grades were named according to their main structural characteristics and ecological functions in the overall river network. The flower diagram characterizes the average ranking values (0.0–5.0) of river cluster patches and river corridors providing single ESs at each grade (Figure 7). The statistical results of detailed spatial analysis of each priority are shown in Table A7, and the statistical results of the two configurations of linear water spaces in the six priorities are shown in Table A8.
First priority grade: Large protected linear water spaces. The first grade is 73.87% of the total area of linear water spaces. It includes two large river corridors, which are the Yangtze River and the Qiantang River sections in the study area, as well as one mega, three large and one medium-sized river cluster patches located in Suzhou. These linear water spaces have the spatial characteristics of large extent, high level and complex structure. The average score of the MESC index of the first grade is 4.1, which is the highest.
Second priority grade: Core protected linear water spaces. The second grade is 10.767% of the total area of linear water spaces. It contains three medium-sized and two small river patches located in Huzhou and at the junction of Huzhou and Suzhou, as well as 18 river corridor sections, most of which are medium-sized river corridors (78%). The spaces in this grade are closely distributed around the first-grade spaces in the north and southeast of the study area and have good connectivity with them. The average score of the MESC index of the second grade is 2.2, which is the medium level.
Third priority grade: Connecting river corridor spaces. The third grade is 1.54% of the total area of linear water spaces. All of them are river corridors, with a total of 31 river sections, mainly including medium-sized (55%) and small (39%) river corridors. Although this grade has a small number of spaces and a scattered layout, the river sections are long and are closely connected with other grades (especially the first, second and sixth grades). The average score of the MESC index of the third grade is 1.8, which is moderately lower.
Fourth priority grade: Nodal linear water spaces. The fourth grade is 4.11% of the total area of linear water spaces. It is mainly composed of five small river cluster patches, of which one is in Suzhou, two are in Huzhou, and two are at the junction of Suzhou and Jiaxing. In addition, there are 69 river corridor sections in this grade, of which 40% are medium-sized river corridors, and small river corridors and small channels each account for about 30%. The average score of the MESC index of the fourth grade is 1.5, which is generally low.
Fifth priority grade: Stitching linear water spaces. The fifth grade is 3.21% of the total area of linear water spaces. It contains two small river cluster patches in the north of Suzhou and 168 river corridor sections. Among them, small channels account for 61%, and small and medium-sized river corridors are 26% and 13%, respectively. Spaces in this grade are small, short and widely distributed in the study area. The average score of the MESC index of the fifth grade is 1.2, which is lower.
Sixth priority grade: Supplementary linear water spaces. The sixth grade is 6.51% of the total area of linear water spaces. All of them are river corridors, with a total of 1617 river sections. Among them, small channels account for the majority, with a value of 88%. Small and medium-sized river corridors account for 8% and 4%, respectively. River corridors of this grade are small but large in number and have a wide range throughout the study area. The average score of the MESC index of the sixth grade is 1.0, which is the lowest.

4. Discussion

4.1. Impact of River Network Spatial Configurations on Assessment of Linear Water Spaces’ ESs

In the network formed by ecological spaces, patches and corridors are two important spatial configurations. Different configuration characteristics determine the roles of spaces in the overall network: the former serves as an important ecological source that provides ESs, determining regional ecological processes and functions [70], while the latter is of great significance in effectively connecting all elements of the ecosystem and forming a complete and full-structured network with high connectivity and accessibility [71]. In the face of the rich and complex linear water spaces in the study area, we did not evaluate the ESs of all rivers as independent bodies without distinction. In this study, according to the indicator of river density, the river network formed by linear water spaces was divided into two spatial configurations: river cluster patches composed of high-density aggregated rivers and relatively independent river corridors. This is because the densely gathered river cluster patches have distinct structural characteristics from the linear river corridors. Their internal network structure greatly influences the delivery process of flow-dependent ESs [72] by shaping the water flows in the network [25] and further influences the overall ecological function and evaluation of river cluster patches.
Therefore, in the technical approach proposed in this study, distinguishing different spatial configurations of river networks was regarded as a prerequisite for assessing single ESs of linear water spaces and also the basis for selecting service evaluation indicators. This means that the influence of the internal structure characteristics on the overall ecological function should be considered when evaluating the ESs of river cluster patches. For example, in the evaluation of the biodiversity conservation service, the effect of the complexity of the river network within river cluster patches on ES provision was considered. Some studies have indicated that the higher the complexity of the river network, the richer its composition level, and the higher the diversity and complexity of the river habitat, which is conducive to the reproduction and habitat of aquatic organisms [50,51]. Previous studies have shown that the regulation and storage capacity of a river network are jointly affected by the number of water surfaces and the structure of the river network and are significantly positively correlated with both [51]. Thus, in the evaluation of the flood regulation service, the fractal dimension, which is the general index of river network structure from the perspective of basin geomorphology, was used in this study to characterize the structural characteristics within the river cluster patches, and the total area of rivers and the number of channels were used as indicators to characterize the number of water surfaces. In addition, studies have suggested that an increase in river density is conducive to the reduction in total nitrogen concentrations in rivers [73]. In addition, river network connectivity further influences the river water quality by affecting water transport modes and flow paths [74] and water circulation efficiency [75]. In general, the better the connectivity of the river network, the stronger its water purification capacity [76]. River flow and area also affect water quality by affecting the movement of surface nutrients [32]. For these reasons, river density, river connectivity and total river area were selected to evaluate the water purification service of river cluster patches.

4.2. Impact of the Multiple Levels of Linear Water Spaces on the Assessment of Single ESs

Scale is a key issue to be considered in the research and decision making of ESs, because the supply, benefit, assessment and management of ESs are dependent on scale [77]. At different research scales, the ecological process and service flow by which ecological space provides ESs are different, and the generation of the specific ES value is determined by the scale of service production. Studies have shown that different scales may influence the identification of different ESs provided by ecological spaces [43,44]. In this study, the scale effect of linear water spaces that provide ESs was reflected in different river cluster patch extents and river corridor orders. On the one hand, the geographical scope of the study area, that is, the extent of the service supply unit, will lead to a change in ES supply [43,44]. As the geographical extent increases, the amount of environmental heterogeneity is expected to increase as well, which may lead to changes in ESs provided by various elements of the ecosystem. On the other hand, Yuan et al. (2005a) pointed out that there were differences in the regulation and storage functions of rivers of different orders in the river network. A higher order has a stronger water storage function, while a lower order has a significant regulation function, and the number and structure of lower-order streams have a greater impact on the regulation and storage capacity of the river network.
This study considered the influence of the multiple levels of linear water spaces on the assessment of single ESs. The consideration of hierarchical features of river cluster patches was reflected in the setting of indicators describing patch size and extent, such as the total river area and the number of rivers contained in the patch. The consideration of the hierarchical features of river corridors was reflected in the setting of indicators that characterize the volume and stream order of the corridor, such as the corridor area, length and level. For example, in the assessment of the biodiversity conservation service, the level of the river corridor was multiplied by other indicators. The higher the level of the corridor, the greater the coefficient, indicating that the linear water space is more capable of providing the service. This is due to the fact that the higher-level rivers contain more habitat spaces, which can provide adequate habitat conditions for aquatic organisms [78,79]. Similarly, the corridor level was considered in the assessment of the flood regulation service provided by river corridors because higher-level river corridors provide a larger basin coverage area, thus providing a greater capacity for flood peak water diversion and reduction.
Based on the characteristics of different levels, we evaluated the ES supply of linear water spaces, thus illustrating that the multi-level method is a tool for combining the linear water spaces’ information on both fine and coarse scales without losing details [64]. In addition, the spatial level concerned also affects the selection of corresponding ES indicators [56], so this method is crucial for assessing ESs provided by complex linear water spaces in co-urbanized areas.

4.3. Hierarchical and Coupling Evaluation of Multiple Ecosystem Services of Linear Water Spaces

It has been increasingly recognized that multiple facets of ecological functions must be taken into account when determining the conservation priorities of ecological spaces [57]. This necessitates the coupling evaluation of multiple ecosystem services of ecological spaces. The synergies between multiple ecosystem services tend to reinforce each other when they coexist [80], and the comprehensive results presented by this trend are often greater than the sum of the single ESs [81] and are manifested as the enhanced concurrent effects generated by the synergies between ESs [62,63]. In the technical approach proposed in this study, the coupling evaluation method used for the multiple ecosystem services of linear water spaces is based on the synergetic effects among multiple ESs. Therefore, the MESC index of linear water spaces, on the one hand, owed to the single ESs provided by the river, as shown in Formula (3); on the other hand, it is also attributed to the trends of mutual enhancement existing between ES pairs provided by the same river with synergetic relationships, which is represented in Formula (4). In addition, we assumed that the MESC index of a linear water space that provides more ES types would be higher, and this assumption was embodied in the design of the scale factor in Formula (5). Although it was not an accurate calculation of the total amount of multiple ecosystem services provided by linear water spaces, this coupling evaluation method provided a simple and intuitive tool for characterizing and comparing the ecological multi-functionality of different linear water spaces.
This study also considered the hierarchical features of multi-ecosystem service provision at different levels, which were embodied as the different ecological importance weights of each ES provided by river cluster patches and river corridors on each level. Based on experts’ knowledge and experiences, ES types and ecological importance weights were judged based on the following two hypotheses: (1) It was assumed that the dominant ESs provided by rivers at different levels are of different types, which reflects the scale effect of the ecological processes on which the ESs depend in the delivery process. The correlation between the river and the ES type can be judged by: the characteristics of rivers on a certain level, such as location, velocity, width, extent and network structure, as well as the main ecological risks facing rivers at this level. (2) It was assumed that the more important that a service was to the ecological function at this research scale, the higher the weight percentage would be. This ecological importance can be judged by: the core ecological risks and problems faced by the study area on this scale, the needs and well-being of the local people in the corresponding administrative area and the value and role of the ESs themselves on this scale.
According to the final statistical results of the expert questionnaire, there were no situations in which the correlation between a river at a certain level and a certain ES was marked “no” by all 20 experts. However, after the average was calculated, a lower ecological importance weight still reflected the opinion of most experts that rivers at this level do not significantly provide this ES. The experts’ judgment of whether a certain ES is significantly provided by a linear water space was substituted into Formula (2) as the weight value ( ω i ) of this ES, which became a part of the evaluation of its overall capacity to provide multiple ecosystem services. In this way, prior knowledge based on experts’ experiences was incorporated into the evaluation of the MESC index of linear water spaces at all levels and further applied to the identification of their priorities.

4.4. Linear Water Space Priority for Ecological Network Optimization in a Co-Urbanized Area and Limitations

An ecological network consists of ecological spaces with structural heterogeneity, including patch units and linear corridors [82]. In this study, linear water spaces were identified as river clusters with patchy features and linear river corridors. By integrating the river cluster patches with other natural patches and using the river corridors to connect the patchy ecological spaces, a multi-level and multi-functional ecological network with a complete structure could be formed. Based on the six priorities of linear water spaces identified in this study, rivers of each level can be included in the prioritization of the overall ecological network in the co-urbanized area.
First-grade linear water spaces should be regarded as a priority for protection. For large river corridors, there is a need to prevent further pollution of river waters and to control the infrastructure, land use development and the intensity of human activities along these rivers. Large river corridors are also carriers of precious natural and cultural heritage resources [27], so it is necessary to formulate scientific and effective cultural and landscape heritage management policies and protection measures for them. For large-extent river cluster patches, monitoring and controlling key indicators such as the extent of the water surface and structural connectivity within the patches are key to preventing further encroachment of high-density linear water spaces in co-urbanized areas.
Second-grade linear water spaces have good connectivity with the first grade. Functionally, they can be regarded as a supplement to the first grade and can disperse some of the demand pressure. However, the mean value of the MESC index of the second grade (2.2) is quite different from that of the first grade (4.1). Therefore, it is necessary to implement corresponding ecological promotion and restoration measures, such as improving the green space ratio along the river corridors and enhancing the connectivity within the river cluster patches, and to improve the capacity of multi-ecosystem service supply.
Third-grade linear water spaces are all long river corridors and serve the function of connecting and integrating spaces. While ensuring the integrity of the river corridors, the spatial connection between them and adjacent rivers should be strengthened. In addition, the average ranking value of the micro-climate regulation service is relatively low (1.2), which can be improved by increasing the green spaces or adjusting the layout of construction land on both sides of the river corridors.
Fourth-grade linear water spaces are dominated by small river cluster patches, which can be regarded as key ecological nodes in the river network. By increasing the number of rivers and extending the lengths of rivers in the cluster patches, the network structure of nodes can be reinforced and optimized locally to enhance the overall connectivity of the river network and reduce the ecological resistance at its key locations.
Although the fifth-grade linear water spaces are short in length and small in extent, they can be used to organize and stitch small scattered spaces that are adjacent to improve the local connectivity of the whole space system.
Small channels in the sixth grade are easy to ignore or abandoned, but they perfect the pattern of the river cluster patches as capillary rivers and extend the higher levels of river corridors as branches. Thus, efforts should be made to integrate them into the higher grades as complementary spaces to the river network pattern.
However, the novel technical approach proposed in this study still has limitations. First, the single ESs provided by rivers may be related to river water volume, flow rate, river morphology, river sediment and other river geomorphologic factors. However, limited by the availability of data, the impacts of the above factors on the provision of single ESs by rivers were not considered in this study, which may introduce some uncertainties to the river MESC index evaluation. Secondly, the evaluation model of the multi-ecosystem services capability index used in this study was only applicable to the coupling evaluation of ecosystem services with synergetic effects. Although significant synergies between ESs are frequent [80], trade-offs and their effects should also be addressed in the evaluation. Finally, although this study used the knowledge of 20 local experts to judge the hierarchical features of multiple ecosystem services provided by linear water spaces, in fact, rivers at different levels are subject to the concerns of managers at different levels and departments, as well as the preferences of stakeholders within different geographical scopes. Incomplete consideration of people’s preferences for river ES provision may lead to inaccuracy in ES evaluation and the setting of priorities of multi-level rivers.

5. Conclusions

Based on the multi-level structural features of linear water spaces in a co-urbanized area, this study evaluated their capacity to provide multiple ecosystem services and, on this basis, identified six priorities of the two spatial configurations of rivers in the Hu-Su-Jia area that provide five crucial ESs. The technical approach consisted of four main steps: the extraction and multi-level division of the spatial configurations of the river network, the judgment of the hierarchical features of the ESs provided by rivers, the evaluation and mapping of single and multiple ecosystem services and priority identification based on spatial clustering analysis.
The approach of this study provides an understanding of the linear water spaces’ heterogeneity from two aspects: configuration characteristics and hierarchical features. To distinguish the two spatial configurations of the river network, namely, river cluster patches and river corridors, on the one hand, the influence of the structural characteristics of the high-density river cluster patches on their functions was considered; on the other hand, it would be helpful to integrate the configurations with the spatial elements of the regional ecological network by deconstructing the river network. To classify rivers into multiple levels and judge the hierarchical features of ESs provided by each level, a method of functional evaluation of linear water spaces was applied from a holistic catchment perspective, integrating both fine-scale and coarse-scale river information. Explicitly considering multiple levels of the linear water spaces enhances the understanding of the complex ES dynamics provided by rivers. Furthermore, the MESC indexes of the linear water spaces make it possible to directly compare the overall capacity of ESs supplied among the rivers.
The results show that the mega river cluster patch and the Yangtze River section in the study area have the strongest capacity to provide multiple ecosystem services. The linear water spaces in the Hu-Su-Jia area were graded into six priorities: the first priority grade with the highest value for ecological conservation, the second priority grade with the necessity of ecological restoration, the third priority grade with the function of connecting higher grades, the fourth priority grade as key ecological nodes, the fifth priority grade with the function of stitching small adjacent spaces and the sixth priority grade with the complementary structural function.
The priority identification method proposed in this study based on multiple levels and multiple ecosystem services of linear water spaces embodies the principle of ecological priority and integrity and shows how to fully consider the full-scale, multi-level and multi-functional characteristics of linear water spaces in co-urbanized areas in the practice of integrated management of rivers. The results of this study provide a tool for river managers and urban planners, which can provide better information for the protection and restoration of rivers in co-urbanized areas in order to mitigate the impacts of urbanization on ESs of linear water spaces. To address the limitations of this study, subsequent research should be explored on this basis. First, while considering the availability of data, more effective evaluation indexes of ESs provided by rivers, especially independent river corridors, should be further enriched and explored. For example, a special study can be conducted on one or several rivers. Second, the comprehensive evaluation methods and models of ESs with trade-off effects still need to be further explored. Finally, through further questionnaire surveys of corresponding interest groups at each level, a more accurate hierarchical evaluation of ESs provided by multi-level linear water spaces should be obtained.

Supplementary Materials

The following are available online at https://www.mdpi.com/article/10.3390/land10080794/s1, Table S1: Design of expert questionnaire, Table S2: Statistical results of 20 experts’ questionnaires.

Author Contributions

J.S.: Conceptualization; Data curation; Formal analysis; Investigation; Methodology; Software; Visualization; Writing—original draft. Y.W.: Conceptualization; Funding acquisition; Project administration; Resources; Supervision; Validation; Writing—review & editing. X.G.: Methodology; Writing-original draft. All authors have read and agreed to the published version of the manuscript.

Funding

This work was supported by the China National R & D Program [grant numbers 2019YFD1100405].

Institutional Review Board Statement

Not applicable.

Informed Consent Statement

Not applicable.

Data Availability Statement

Publicly available datasets were analyzed in this study. The datasets can be found here: http://www.dview.com.cn/ and http://www.dsac.cn/.

Conflicts of Interest

The authors declare that they have no known competing financial interests or personal relationships that could have appeared to influence the work reported in this paper.

Appendix A

Table A1. Identification and extraction result statistics of river cluster patches at all levels.
LevelNumberNumber of River Sections of Each Stream OrderAverage River Density (km/km2)Total Area of Rivers (km2)Total Length of Rivers (km)
1st 2nd 3rd 4th 5th 6th Total
Mega river cluster patch1009254155199322944.23 84.15 4707.56
Large river cluster patch300111101194334137475.21 121.93 6355.33
Medium-sized river cluster patch40219683230271631464.65 92.60 5815.11
Small river cluster patch90124339805707445.35 34.04 1478.24
Total17033342277659862099314.86 332.7218356.24
Table A2. Identification result statistics of river corridors at all levels.
LevelNumber of River Sections of Each Stream OrderTotal Area of Rivers (km2)Total Length of Rivers (km)
1st 2nd 3rd 4th 5th 6th Total
Large river corridor1100002511.58620.03
Medium river corridor0454870014546.801512.34
Small river corridor0000206020628.72 1611.12
Small channel000001552155283.21 5975.40
Total15548720615521905670.319718.89
Table A3. Types and ecological importance weights of ES from all-level water linear spaces based on expert experiences.
Spatial ConfigurationLevelResearch ScaleMain Spatial Features of the Rivers at This LevelDoes This Level of Rivers Significantly Provide the Following ESs? (Y/N)Ecological Importance of Each ES at This Level
River cluster patchMegaMunicipal scaleContaining a large number of high density medium-sized and small river corridors and small channels (>2000), showing obvious network characteristics and good connectivity. The total area of rivers in the patch was 84.15 km2.BC aY23%
FR bY24%
MCR cY21%
WP dY18%
OL eY13%
Large District scaleContaining many high density medium-sized and small river corridors and small channels (900–1700), showing obvious network characteristics. The total area of rivers in the patches was between 35.08 and 45.94 km2.BC aY22%
FR bY25%
MCR cY21%
WP dY16%
OL eY16%
Medium-sized Township scaleContaining many high density small river corridors and small channels (440–840), showing obvious network characteristics. The total area of rivers in the patches was between 19.61 and 25.45 km2.BC aY24%
FR bY25%
MCR cY20%
WP dY13%
OL eY18%
Small Village scaleContaining a few high-density small river corridors and small channels (40–110), showing a degree of connectivity. The total area of rivers in the patches was between 1.58 and 6.84 km2.BC aY27%
FR bY20%
MCR cY17%
WP dY11%
OL eY26%
River corridorLarge Municipal scaleFirst-order streams as defined in the “Regulations of the People’s Republic of China on the Administration of River Courses”, and the Qiantang River (second-order stream) in the study areaBC aY22%
FR bY34%
MCR cY19%
WP dY15%
OL eY10%
Medium District scaleThird- and fourth-order streams and second-order streams except the Qiantang River as defined in the “Regulations of the People’s Republic of China on the Administration of River Courses”BC aY23%
FR bY28%
MCR cY17%
WP dY17%
OL eY16%
Small Township scaleFifth-order streams as defined in the “Regulations of the People’s Republic of China on the Administration of River Courses”BC aY24%
FR bY23%
MCR cY15%
WP dY16%
OL eY23%
Small channelVillage scaleStreams and watercourses other than first- to fifth-order streams as defined in the “Regulations of the People’s Republic of China on the Administration of River Courses”BC aY34%
FR bY19%
MCR cY10%
WP dY17%
OL eY21%
a—Biodiversity conservation service; b—Flood Regulation Service; c—Micro-climate Regulation Service; d—Water Purification Service; e—Outdoor Leisure Service.
Table A4. Descriptive statistics of spatial analysis results of five crucial ESs provided by water linear spaces.
ESs and Spatial Characteristics (km2)Ranking Values of the Service Supply Capacity
Low: 1Lower: 2Moderate: 3High: 4Superior: 5
Biodiversity conservation serviceMinimum river area5.48 × 10−50.234.2835.0822.23
Maximum river area4.865.5525.4578.79430.65
Total river area121.9955.4787.80113.86623.88
Number of river cluster patches351214
Number of river corridors18505411
Flood Regulation ServiceMinimum river area3.41 × 10−50.134.2845.9484.15
Maximum river area1.5825.3040.9178.79430.65
Total river area86.62142.59134.27124.72514.80
Number of river cluster patches110411
Number of river corridors1755146211
Micro-climate Regulation ServiceMinimum river area3.41 × 10−50.031.582.033.92
Maximum river area84.1522.236.3278.79430.65
Total river area418.5153.4510.1086.36434.57
Number of river cluster patches102221
Number of river corridors185547111
Water Purification ServiceMinimum river area3.41 × 10−50.080.982.031.58
Maximum river area40.9184.1535.0878.79430.65
Total river area116.49287.3476.6586.36436.16
Number of river cluster patches19322
Number of river corridors1679218611
Outdoor leisure ServiceMinimum river area3.41 × 10−50.050.771.583.92
Maximum river area84.1545.9435.085.55430.65
Total river area274.43128.1271.4515.65513.36
Number of river cluster patches53441
Number of river corridors1767133212
Table A5. Spearman’s rank correlation coefficient results between ES pairs provided by water linear spaces.
ESsBiodiversity Conservation ServiceFlood Regulation ServiceMicro-Climate Regulation ServiceWater Purification ServiceOutdoor Leisure Service
Biodiversity conservation service1.000 0.633 **0.380 **0.509 **0.491 **
Flood Regulation Service0.633 **1.000 0.364 **0.674 **0.625 **
Micro-climate Regulation Service0.380 **0.364 **1.000 0.354 **0.357 **
Water Purification Service0.509 **0.674 **0.354 **1.000 0.535 **
Outdoor Leisure Service0.491 **0.625 **0.357 **0.535 **1.000
** Correlation is significant at the 0.01 level (two-tailed).
Table A6. Statistical results of the MESC index of water linear spaces.
Water Linear Space and Spatial Characteristics (km2)The MESC Index (Score Range)
Low
(0.0–1.0)
Lower
(1.0–2.0)
Moderate
(2.0–3.0)
High
(3.0–4.0)
Superior
(4.0–5.0)
River cluster patchMinimum area01.585.5525.4540.91
Maximum area04.8625.3045.9484.15
Total area021.6579.53106.47125.05
Total number07532
River corridorMinimum area03.41 × 10−50.484.2878.79
Maximum area01.032.066.32430.65
Total area0132.4917.7710.60509.44
Total number018851622
Table A7. Statistical results of six water linear spaces priorities.
Priorities and Spatial Characteristics (km2)Type of Spatial Configurations of Rivers Providing ESs
River Cluster PatchRiver Corridor
First GradeMinimum area25.4578.79
Maximum area84.15430.65
Total area231.52509.44
Total number52
Second GradeMinimum area5.550.48
Maximum area25.306.32
Total area79.5328.37
Total number518
Third GradeMinimum area00.20
Maximum area01.03
Total area015.42
Total number031
Fourth GradeMinimum area2.030.13
Maximum area4.860.82
Total area17.8623.37
Total number569
Fifth GradeMinimum area1.580.03
Maximum area2.200.61
Total area3.7828.38
Total number2168
Sixth GradeMinimum area03.41 × 10−5
Maximum area00.26
Total area065.33
Total number01617
Table A8. Statistical results of two configurations of water linear spaces in six priorities.
Level of Water Linear SpacesWater Linear Spaces’ Priorities
1st 2nd 3rd 4th 5th 6th
River cluster patchMega100000
Large300000
Medium-sized130000
Small020520
Total number550520
River corridorLarge212001
Medium01417282260
Small02122043129
Small channels010211031427
Total number21831691681617

References

  1. Hua, J.; Chen, W.Y. Prioritizing urban rivers’ ecosystem services: An importance-performance analysis. Cities 2019, 94, 11–23. [Google Scholar] [CrossRef]
  2. Auerbach, D.A.; Deisenroth, D.B.; McShane, R.R.; McCluney, K.E.; LeRoy Poff, N. Beyond the concrete: Accounting for ecosystem services from free-flowing rivers. Ecosyst. Serv. 2014, 10, 1–5. [Google Scholar] [CrossRef]
  3. Yang, S.; Chen, B. Environmental Impact of Manwan Hydropower Plant on River Ecosystem Service. Energy Procedia 2014, 61, 2721–2724. [Google Scholar] [CrossRef] [Green Version]
  4. Shao, X.; Fang, Y.; Cui, B. A model to evaluate spatiotemporal variations of hydrological connectivity on a basin-scale complex river network with intensive human activity. Sci. Total Environ. 2020, 723, 138051. [Google Scholar] [CrossRef]
  5. Forio, M.A.E.; Villa-Cox, G.; Van Echelpoel, W.; Ryckebusch, H.; Lock, K.; Spanoghe, P.; Deknock, A.; De Troyer, N.; Nolivos-Alvarez, I.; Dominguez-Granda, L.; et al. Bayesian Belief Network models as trade-off tools of ecosystem services in the Guayas River Basin in Ecuador. Ecosyst. Serv. 2020, 44, 101124. [Google Scholar] [CrossRef]
  6. Zhao, Y.; Wei, Y.; Wu, B.; Lu, Z.; Fu, L. A connectivity-based assessment framework for river basin ecosystem service management. Curr. Opin. Environ. Sustain. 2018, 33, 34–41. [Google Scholar] [CrossRef]
  7. Luo, Z.; Zuo, Q.; Shao, Q. A new framework for assessing river ecosystem health with consideration of human service demand. Sci. Total Environ. 2018, 640–641, 442–453. [Google Scholar] [CrossRef] [PubMed]
  8. Sannigrahi, S.; Chakraborti, S.; Joshi, P.K.; Keesstra, S.; Sen, S.; Paul, S.K.; Kreuter, U.; Sutton, P.C.; Jha, S.; Dang, K.B. Ecosystem service value assessment of a natural reserve region for strengthening protection and conservation. J. Environ. Manag. 2019, 244, 208–227. [Google Scholar] [CrossRef]
  9. Assessment, M.E. Ecosystems and Human Well-Being: Synthesis; Island Press: Washington, DC, USA, 2005. [Google Scholar]
  10. Costanza, R.; D’Arge, R.; Naeem, S.; O’Neil, R.V.; Paruelo, J.; Raskin, R.G.; Sutton, P.; Van Den Belt, M. The value of the world’s ecosystem services and natural capital. World Environ. 1997, 25, 3–15. [Google Scholar] [CrossRef]
  11. Burnett, W.C.; Aggarwal, P.K.; Aureli, A.; Bokuniewicz, H.; Cable, J.E.; Charette, M.A.; Kontar, E.; Krupa, S.; Kulkarni, K.M.; Loveless, A.; et al. Quantifying submarine groundwater discharge in the coastal zone via multiple methods. Sci. Total Environ. 2006, 367, 498–543. [Google Scholar] [CrossRef]
  12. Martínez-Harms, M.J.; Balvanera, P. Methods for mapping ecosystem service supply: A review. Int. J. Biodivers. Sci. Ecosyst. Serv. Manag. 2012, 8, 17–25. [Google Scholar] [CrossRef]
  13. Balvanera, P.; Daily, G.C.; Ehrlich, P.R.; Ricketts, T.H.; Bailey, S.A.; Kark, C.; Pereira, H. Conserving biodiversity and ecosystem services. Science 2001, 291, 2047. [Google Scholar] [CrossRef]
  14. Spackman, S.C.; Hughes, J.W. Assessment of minimum stream corridor width for biological conservation: Species richness and distribution along mid-order streams in Vermont, USA. Biol. Conserv. 1995, 71, 325–332. [Google Scholar] [CrossRef]
  15. Yousefi, M.; Jouladeh-Roudbar, A.; Kafash, A. Using endemic freshwater fishes as proxies of their ecosystems to identify high priority rivers for conservation under climate change. Ecol. Indic. 2020, 112, 106137. [Google Scholar] [CrossRef]
  16. Thiele, J.; Albert, C.; Hermes, J.; von Haaren, C. Assessing and quantifying offered cultural ecosystem services of German river landscapes. Ecosyst. Serv. 2020, 42, 101080. [Google Scholar] [CrossRef]
  17. Hale, R.L.; Cook, E.M.; Beltrán, B.J. Cultural ecosystem services provided by rivers across diverse social-ecological landscapes: A social media analysis. Ecol. Indic. 2019, 107, 105580. [Google Scholar] [CrossRef]
  18. Rashleigh, B.; Lagutov, V.; Salathe, T. Ecosystem Services of Rivers: The Don River (Russian Federation) and the Roanoke River (USA). In Environmental Security in Watersheds: The Sea of Azov; Springer: Dordrecht, The Netherlands, 2012; pp. 63–77. [Google Scholar]
  19. Wang, L.; Cai, Y.; Fang, L. Pollution in Taihu Lake, China: Causal chain and policy options analyses. Front. Earth Sci. China 2009, 3, 437–444. [Google Scholar] [CrossRef]
  20. Wang, S.-r.; Meng, W.; Jin, X.-c.; Zheng, B.-h.; Zhang, L.; Xi, H.-y. Ecological security problems of the major key lakes in China. Environ. Earth Sci. 2015, 74, 3825–3837. [Google Scholar] [CrossRef]
  21. Riegels, N.; Lynggaard-Jensen, A.; Krogsgaard Jensen, J.; Gerner, N.V.; Anzaldua, G.; Mark, O.; Butts, M.; Birk, S. Making the ecosystem services approach operational: A case study application to the Aarhus River, Denmark. Sci. Total Environ. 2020, 707, 135836. [Google Scholar] [CrossRef]
  22. Polizzi, C.; Simonetto, M.; Barausse, A.; Chaniotou, N.; Känkänen, R.; Keränen, S.; Manzardo, A.; Mustajärvi, K.; Palmeri, L.; Scipioni, A. Is ecosystem restoration worth the effort? The rehabilitation of a Finnish river affects recreational ecosystem services. Ecosyst. Serv. 2015, 14, 158–169. [Google Scholar] [CrossRef]
  23. Gerner, N.V.; Nafo, I.; Winking, C.; Wencki, K.; Strehl, C.; Wortberg, T.; Niemann, A.; Anzaldua, G.; Lago, M.; Birk, S. Large-scale river restoration pays off: A case study of ecosystem service valuation for the Emscher restoration generation project. Ecosyst. Serv. 2018, 30, 327–338. [Google Scholar] [CrossRef]
  24. Kuemmerlen, M.; Reichert, P.; Siber, R.; Schuwirth, N. Ecological assessment of river networks: From reach to catchment scale. Sci. Total Environ. 2019, 650, 1613–1627. [Google Scholar] [CrossRef]
  25. Xu, H.; Lv, D.; Fan, Y. A Pragmatic Framework for Urban River System Plan in Plain River Network Area of China. Procedia Eng. 2012, 28, 494–500. [Google Scholar] [CrossRef] [Green Version]
  26. Wollheim, W.M. Chapter 8—From Headwaters to Rivers to River Networks: Scaling in Stream Ecology. In Stream Ecosystems in a Changing Environment; Jones, J.B., Stanley, E.H., Eds.; Academic Press: Boston, MA, USA, 2016; pp. 349–388. [Google Scholar]
  27. Thiele, J.; von Haaren, C.; Albert, C. Are river landscapes outstanding in providing cultural ecosystem services? An indicator-based exploration in Germany. Ecol. Indic. 2019, 101, 31–40. [Google Scholar] [CrossRef]
  28. Bian, H.; Gao, J.; Wu, J.; Sun, X.; Du, Y. Hierarchical analysis of landscape urbanization and its impacts on regional sustainability: A case study of the Yangtze River Economic Belt of China. J. Clean. Prod. 2021, 279, 123267. [Google Scholar] [CrossRef]
  29. Wilson, M.C.; Hu, G.; Jiang, L.; Liu, J.; Liu, J.; Jin, Y.; Yu, M.; Wu, J. Assessing habitat fragmentation’s hierarchical effects on species diversity at multiple scales: The case of Thousand Island Lake, China. Landsc. Ecol. 2020, 35, 501–512. [Google Scholar] [CrossRef]
  30. Verhagen, W.; van Teeffelen, A.J.A.; Verburg, P.H. Shifting spatial priorities for ecosystem services in Europe following land use change. Ecol. Indic. 2018, 89, 397–410. [Google Scholar] [CrossRef]
  31. Zhang, L.; Fu, B.; Lü, Y.; Zeng, Y. Balancing multiple ecosystem services in conservation priority setting. Landsc. Ecol. 2015, 30, 535–546. [Google Scholar] [CrossRef]
  32. Deng, X. Correlations between water quality and the structure and connectivity of the river network in the Southern Jiangsu Plain, Eastern China. Sci. Total Environ. 2019, 664, 583–594. [Google Scholar] [CrossRef]
  33. Xie, H.-B.; Yu, X.-G.; Zhang, Y.-l. Preliminary study on the coincident relationship between water environment and human activity in taihu lake basin. Resour. Environ. Yangtze Basin 2001, 10, 393–400. [Google Scholar]
  34. Deng, X.; Xu, Y.; Han, L.; Song, S.; Yang, L.; Li, G.; Wang, Y. Impacts of Urbanization on River Systems in the Taihu Region, China. Water 2015, 7, 1340–1358. [Google Scholar] [CrossRef]
  35. Zhu, Y.; Zhu, L. An analysis on summer urban heat island in Suzhou using satellite data. Sci. Meteorol. Sin. 2009, 29, 81–87. [Google Scholar]
  36. Xu, X.; Yang, G.; Tan, Y.; Tang, X.; Jiang, H.; Sun, X.; Zhuang, Q.; Li, H. Impacts of land use changes on net ecosystem production in the Taihu Lake Basin of China from 1985 to 2010. J. Geophys. Res. Biogeosci. 2017, 122, 690–707. [Google Scholar] [CrossRef]
  37. Yu, X.; Wu, T.; Jiang, J.; Mao, R. 1999 Heavy Flooding in the Taihu Basin:Investigation, Analysis and Further Suggestions on the Integrated Harnessing in the Basin. J. Lake Sci. 2000, 12, 1–5. [Google Scholar]
  38. Chen, Y.; Xu, Y.; Yin, Y. Impacts of land use change scenarios on storm-runoff generation in Xitiaoxi basin, China. Quat. Int. 2009, 208, 121–128. [Google Scholar] [CrossRef]
  39. Zhou, F.; Xu, Y.; Chen, Y.; Xu, C.Y.; Gao, Y.; Du, J. Hydrological response to urbanization at different spatio-temporal scales simulated by coupling of CLUE-S and the SWAT model in the Yangtze River Delta region. J. Hydrol. 2013, 485, 113–125. [Google Scholar] [CrossRef]
  40. Xu, X.; Yang, G.; Tan, Y.; Zhuang, Q.; Li, H.; Wan, R.; Su, W.; Zhang, J. Ecological risk assessment of ecosystem services in the Taihu Lake Basin of China from 1985 to 2020. Sci. Total Environ. 2016, 554–555, 7–16. [Google Scholar] [CrossRef] [PubMed]
  41. The Ministry of Water Resources of the People’s Republic of China. Regulations of the People’s Republic of China on the Administration of River Courses; State Council of China: Beijing, China, 2017.
  42. Yuan, W.; Yang, K.; Xu, Q. Effect of urbanization on growth of shanghai river function and stream structure. Resour. Environ. Yangtze Basin 2005, 14, 133–138. [Google Scholar]
  43. Steur, G.; Verburg, R.W.; Wassen, M.J.; Verweij, P.A. Shedding light on relationships between plant diversity and tropical forest ecosystem services across spatial scales and plot sizes. Ecosyst. Serv. 2020, 43, 101107. [Google Scholar] [CrossRef]
  44. Calderón-Contreras, R.; Quiroz-Rosas, L.E. Analysing scale, quality and diversity of green infrastructure and the provision of Urban Ecosystem Services: A case from Mexico City. Ecosyst. Serv. 2017, 23, 127–137. [Google Scholar] [CrossRef]
  45. Yan, R.; Gao, J.; Dong, C.; Huang, J. Assessment of Ecosystem Services for Polder Terrestrial Ecosystem in Taihu Basin. Res. Environ. Sci. 2015, 28, 393–400. [Google Scholar]
  46. Guo, C.; Zhu, Y.; Sun, W.; Song, J. China 1km biological abundance index distribution data set. J. Glob. Chang. Data Discov. 2017, 1, 60–65. [Google Scholar]
  47. Peng, J.; Liu, Y.; Liu, Z.; Yang, Y. Mapping spatial non-stationarity of human-natural factors associated with agricultural landscape multifunctionality in Beijing–Tianjin–Hebei region, China. Agric. Ecosyst. Environ. 2017, 246, 221–233. [Google Scholar] [CrossRef]
  48. Lin, S.; Wu, R.; Yang, F.; Wang, J.; Wu, W. Spatial trade-offs and synergies among ecosystem services within a global biodiversity hotspot. Ecol. Indic. 2018, 84, 371–381. [Google Scholar] [CrossRef]
  49. Wei, H.; Liu, H.; Xu, Z.; Ren, J.; Lu, N.; Fan, W.; Zhang, P.; Dong, X. Linking ecosystem services supply, social demand and human well-being in a typical mountain–oasis–desert area, Xinjiang, China. Ecosyst. Serv. 2018, 31, 44–57. [Google Scholar] [CrossRef]
  50. Wang, Y. Multi-Scale Evaluation of River Habitats in Taihu Lake Basin. Master’s Thesis, East China Normal University, Shanghai, China, 2019. [Google Scholar]
  51. Yuan, W.; Yang, K.; Tang, M.; Xu, Q. Stream structure characteristics and their impact on storageand flood control capacity in the urbanized plain river network. Geogr. Res. 2005, 24, 717–724. [Google Scholar]
  52. Wang, B.; Zhang, B.; Wang, J.; Yang, X.; Yang, Y.; Zhang, C. Water Ecosystem Services and Their Spatial Variability in Taihu Basin. Bull. Soil Water Conserv. 2011, 31, 219–225. [Google Scholar]
  53. Yan, R.; Gao, J.; Huang, Q.; Zhao, J.; Dong, C.; Chen, X.; Zhang, Z.; Huang, J. The assessment of aquatic ecosystem services for polder in Taihu Basin. Acta Ecol. Sin. 2015, 035, 5197–5206. [Google Scholar]
  54. WANG, L.; ZHU, Y.; WEI, B.; LI, Y. Surface Thermal Environment and Water Temperature Regulation of Rapidly Growing Small and Medium-sized Cities—Exemplified by Binzhou City of Shandong Province. Bull. Soil Water Conserv. 2018, 38, 108–115. [Google Scholar]
  55. Yang, K.; Tang, M.; Liu, Y.; Wu, A.; Fan, Q. Analysis of Microclimate Effects around River and Waterbody in Shanghai Urban District. J. East China Norm. Univ. (Nat. Sci. ) 2004, 9, 105–114. [Google Scholar]
  56. Roces-Díaz, J.V.; Vayreda, J.; Banqué-Casanovas, M.; Cusó, M.; Anton, M.; Bonet, J.A.; Brotons, L.; De Cáceres, M.; Herrando, S.; Martínez de Aragón, J.; et al. Assessing the distribution of forest ecosystem services in a highly populated Mediterranean region. Ecol. Indic. 2018, 93, 986–997. [Google Scholar] [CrossRef] [Green Version]
  57. Jiang, Z.; Dai, B.; Wang, C.; Xiong, W. Multifaceted biodiversity measurements reveal incongruent conservation priorities for rivers in the upper reach and lakes in the middle-lower reach of the largest river-floodplain ecosystem in China. Sci. Total Environ. 2020, 739, 140380. [Google Scholar] [CrossRef] [PubMed]
  58. Grizzetti, B.; Liquete, C.; Pistocchi, A.; Vigiak, O.; Zulian, G.; Bouraoui, F.; Roo, A.; Cardoso, A. Relationship between ecological condition and ecosystem services in European rivers, lakes and coastal waters. Sci. Total Environ. 2019, 671, 452–465. [Google Scholar] [CrossRef]
  59. Qiao, X.; Gu, Y.; Zou, C.; Xu, D.; Wang, L.; Ye, X.; Yang, Y.; Huang, X. Temporal variation and spatial scale dependency of the trade-offs and synergies among multiple ecosystem services in the Taihu Lake Basin of China. Sci. Total Environ. 2019, 651, 218–229. [Google Scholar] [CrossRef] [PubMed]
  60. Qiu, J.; Turner, M.G. Spatial interactions among ecosystem services in an urbanizing agricultural watershed. Proc. Natl. Acad. Sci. USA 2013, 110, 12149–12154. [Google Scholar] [CrossRef] [PubMed] [Green Version]
  61. Shen, J.; Guo, X.; Wang, Y. Identifying and setting the natural spaces priority based on the multi-ecosystem services capacity index. Ecol. Indic. 2021, 125, 107473. [Google Scholar] [CrossRef]
  62. Schirpke, U.; Candiago, S.; Vigl, L.E.; Jager, H.; Labadini, A.; Marsoner, T.; Meisch, C.; Tasser, E.; Tappeiner, U. Integrating supply, flow and demand to enhance the understanding of interactions among multiple ecosystem services. Sci. Total Environ. 2019, 651, 928–941. [Google Scholar] [CrossRef]
  63. Bennett, E.M.; Peterson, G.D.; Gordon, L.J. Understanding relationships among multiple ecosystem services. Ecol. Lett. 2009, 12, 1394–1404. [Google Scholar] [CrossRef] [PubMed]
  64. Cui, F.; Tang, H.; Zhang, Q.; Wang, B.; Dai, L. Integrating ecosystem services supply and demand into optimized management at different scales: A case study in Hulunbuir, China. Ecosyst. Serv. 2019, 39, 100984. [Google Scholar] [CrossRef]
  65. Arbuckle, J.L. IBM®sPSS®AmosTMuser’s Guide; IBM Corp: Chicago, IL, USA, 2012. [Google Scholar]
  66. Quintas-Soriano, C.; Garcia-Llorente, M.; Norstrom, A.; Meacham, M.; Peterson, G.; Castro, A.J. Integrating supply and demand in ecosystem service bundles characterization across Mediterranean transformed landscapes. Landsc. Ecol. 2019, 34, 1619–1633. [Google Scholar] [CrossRef]
  67. Mouchet, M.A.; Lamarque, P.; Martín-López, B.; Crouzat, E.; Gos, P.; Byczek, C.; Lavorel, S. An interdisciplinary methodological guide for quantifying associations between ecosystem services. Glob. Environ. Chang. 2014, 28, 298–308. [Google Scholar] [CrossRef]
  68. Yang, Y.; Zheng, H.; Kong, L.; Huang, B.; Xu, W.; Ouyang, Z. Mapping ecosystem services bundles to detect high- and low-value ecosystem services areas for land use management. J. Clean. Prod. 2019, 225, 11–17. [Google Scholar] [CrossRef]
  69. Kodinariya, T.; Makwana, P.R. Review on Determining of Cluster in K-means Clustering. Int. J. Adv. Res. Comput. Sci. Manag. Stud. 2013, 1, 90–95. [Google Scholar]
  70. Dong, R.; Zhang, X.; Li, H. Constructing the Ecological Security Pattern for Sponge City: A Case Study in Zhengzhou, China. Water 2019, 11, 284. [Google Scholar] [CrossRef] [Green Version]
  71. Dakos, V.; Soler-Toscano, F. Measuring complexity to infer changes in the dynamics of ecological systems under stress. Ecol. Complex. 2017, 32, 144–155. [Google Scholar] [CrossRef]
  72. Syrbe, R.-U.; Walz, U. Spatial indicators for the assessment of ecosystem services: Providing, benefiting and connecting areas and landscape metrics. Ecol. Indic. 2012, 21, 80–88. [Google Scholar] [CrossRef]
  73. Nash, M.S.; Heggem, D.T.; Ebert, D.; Wade, T.G.; Hall, R.K. Multi-scale landscape factors influencing stream water quality in the state of Oregon. Environ. Monit. Assess. 2009, 156, 343–360. [Google Scholar] [CrossRef]
  74. Michaelides, K.; Chappell, A. Connectivity as a concept for characterising hydrological behaviour. Hydrol. Process. 2009, 23, 517–522. [Google Scholar] [CrossRef]
  75. Turnbull, L.; Wainwright, J.; Brazier, R.E. A conceptual framework for understanding semi-arid land degradation: Ecohydrological interactions across multiple-space and time scales. Ecohydrology 2008, 1, 23–34. [Google Scholar] [CrossRef] [Green Version]
  76. Stieglitz, M.; Shaman, J.; McNamara, J.; Engel, V.; Shanley, J.; Kling, G. An Approach to Understanding Hydrologic Connectivity on the Hillslope and the Implications for Nutrient Transport. Glob. Biogeochem. Cycles 2003, 17. [Google Scholar] [CrossRef]
  77. Hou, Y.; Li, B.; Müller, F.; Fu, Q.; Chen, W. A conservation decision-making framework based on ecosystem service hotspot and interaction analyses on multiple scales. Sci. Total Environ. 2018, 643, 277–291. [Google Scholar] [CrossRef]
  78. Covich, A.P. Geographical and Historical Comparisons of Neotropical Streams: Biotic Diversity and Detrital Processing in Highly Variable Habitats. J. North Am. Benthol. Soc. 1988, 7, 361–386. [Google Scholar] [CrossRef]
  79. Brönmark, C.; Herrmann, J.; Malmqvist, B.; Otto, C.; Sjöström, P. Animal community as a function of stream size. Hydrobiologia 1984, 112, 73–79. [Google Scholar] [CrossRef]
  80. Li, T.; Lü, Y.; Fu, B.; Hu, W.; Comber, A.J. Bundling ecosystem services for detecting their interactions driven by large-scale vegetation restoration: Enhanced services while depressed synergies. Ecol. Indic. 2019, 99, 332–342. [Google Scholar] [CrossRef] [Green Version]
  81. Field, R.D.; Parrott, L. Multi-ecosystem services networks: A new perspective for assessing landscape connectivity and resilience. Ecol. Complex. 2017, 32, 31–41. [Google Scholar] [CrossRef]
  82. Schippers, P.; Grashof-Bokdam, C.J.; Verboom, J.; Baveco, J.M.; Jochem, R.; Meeuwsen, H.A.M.; Van Adrichem, M.H.C. Sacrificing patches for linear habitat elements enhances metapopulation performance of woodland birds in fragmented landscapes. Landsc. Ecol. 2008, 24, 1123. [Google Scholar] [CrossRef]
Figure 1. Technical and methodological framework.
Land 10 00794 g001
Figure 2. Location and six orders of streams of the study area.
Land 10 00794 g002
Figure 3. Extraction and multi-level division of river cluster patches in the Hu-Su-Jia area.
Land 10 00794 g003
Figure 4. Identification and multi-level division of river corridors in the Hu-Su-Jia area.
Land 10 00794 g004
Figure 5. Mapping of five single ESs of linear water spaces in the Hu-Su-Jia area: (a) Biodiversity conservation service; (b) Flood regulation service; (c) Micro-climate regulation service; (d) Water purification service; (e) Outdoor leisure service.
Land 10 00794 g005
Figure 6. Mapping of MESC indexes of linear water spaces in the Hu-Su-Jia area.
Land 10 00794 g006
Figure 7. Six priority grades of linear water spaces in the Hu-Su-Jia area.
Land 10 00794 g007
Table 1. Assessment indicators and calculation formulas of five crucial ESs provided by linear water spaces.
ESSpatial ConfigurationES Indicator Calculation MethodExplanation
Biodiversity conservation serviceRiver cluster patchRiver Habitat Health and Quality Index (RHHQI) RHHQIp,i = Si × (1 − R o a d i ) × (1 − C T i ) × CRi
CRi = Mx,i × (Li/Lm,i)
Where i is the river cluster patch i; RHHQIp is the habitat health and quality index of river cluster patches; S is the total river area (km2) within the river cluster patches; Road is the distance (km) between the river cluster patch and the nearest main road; CT is the distance (km) between the river cluster patch and the nearest construction land patch; CR is the river network complexity of the river cluster patches; Mx is the number of stream orders within the river cluster patches; x is the stream order of the rivers in the river cluster patches, which is defined as 1, 2, 3, 4, 5 and 6 from first- to sixth-order streams, respectively; L is the total river length (km) in the river cluster patches; Lm is the total length (km) of the trunk rivers in the river cluster patches, according to the specific situation of the Hu-Su-Jia area, we summarized first- to fifth-order streams as the trunk rivers and sixth-order streams as the capillary rivers (Standardize the range of Road and CT values to make them between 0 and 1)
River corridorRHHQIc,i = Si × (1 − R o a d i ) × (1 − C T i ) × 1/MiWhere i is the river corridor i; RHQIc is the habitat health and quality index of river corridors; S is the river corridor area (km2); Road is the distance (km) between the river corridor and the nearest main road; CT is the distance (km) between the river corridor and the nearest construction land patch; M is the level of river corridor, and large, medium-sized and small river corridors and small channels are defined as 1, 2, 3 and 4 levels respectively (Standardize the range of Road and CT values to make them between 0 and 1)
Flood Regulation ServiceRiver cluster patchRegulation and Storage Ability Index (RSAI)RSCIi = Si × Pi × Di
Di = LogMRb/LogMRL
MRb = ( R b x ( N x + N x 1 ) ) / N x + N x 1
MRL = ( R L x ( L x + L x 1 ) ) / L x + L x 1
R b x = N x / N x 1
R L x = L x / L x 1
Where i is the river cluster patch i; RSCI is the regulation and storage ability index of river cluster patches; S is the total river area (km2) within the river cluster patches; P is the number of river sections in the river cluster patches; D is the fractal dimension of river cluster patches; MRb is mean branch ratio; MRL is the mean length ratio; N x , N x 1 are the numbers of river sections of order x and a higher order in the river cluster patches; L x ,   L x 1 are the total length (km) of river sections of order x and a higher order in the river cluster patches; R b x is the branch ratio between the river sections of order x and a higher order; R L x is the length ratio between the river sections of order x and a higher order; x is the stream order of the rivers in the river cluster patches, which is defined as 1, 2, 3, 4, 5 and 6 from first- to sixth-order stream, respectively
River corridorRiver Adjustable Storage Ability (RASA)RASCi = Si × Δh × 1/MiWhere i is the river corridor i; RASA is the adjustable storage ability of river corridors; S is the river corridor area (km2); Δh is the discrepancy in elevation between the maximum and the average height of river level (m)—in 2015, the annual maximum water level of the Taihu Lake Basin was 4.19 m, the annual average water level was 3.42 m, and the annual average absolute variation of water level was 0.77 m; M is the level of river corridor, and large, medium-sized and small river corridors and small channels are defined as 1, 2, 3 and 4 levels respectively
Micro-climate Regulation ServiceRiver cluster patchRiver Cooling Effect Index (RCEI)RCEIp,i = Si × (1 − Li/Si) × PiWhere i is the river cluster patch i; RCEIp is the cooling effect index of river cluster patches; S is the total river area (km2) within the river cluster patches; L is the total river length (km) within the river cluster patches; P is the number of river sections in the river cluster patches (Standardize the range of L/S value to make it between 0 and 1)
River corridorRCEIc,i = Si × 1 + C T i × (1 + Bn,i/Bi)Where i is the river corridor i; RCEIc is the cooling effect index of river corridors; S is the river corridor area (km2); CT is the distance (km) between the river corridor and the nearest construction land patch; Bn is the ecological space area (km2) in the 500 m buffer zones along the both sides of the river corridor, and the land use types include: forest, grassland and unused land; B is the total area of the buffer zones along the both sides of the river corridor (km2)
Water Purification ServiceRiver cluster patchWater Purification Ability Index (WPAI)WPAIi = Si × Ri × γi;
Ri = Li/Ai;
γi = Pi/3 × (ni − 2)
Where i is the river cluster patch i; WPAI is the water purification ability index of river cluster patches; S is the total river area (km2) within the river cluster patches; R is the river density of river cluster patches (km/km2); γ is the connection degree of river cluster patches; L is the total river length (km) within the river cluster patches; A is the area (km2) of the river cluster patch extraction scope; P is the number of river sections in the river cluster patches; N is the number of nodes formed by the trunk rivers (first- to fifth-order streams) in the river cluster patches (The value of γ was standardized to be greater than 0)
River corridorTotal Nitrogen Retention (TNR)TNRm,i = FN,m × Sm,i × βN
FN,m = Tm/WAm × 0.004%
Where m is the city m; i is the river corridor i in city m; TNR is the total nitrogen retention amount of river corridors (t); FN is the total quantity of the nitrogen pollutants flowing into the river per unit area (t/km2); S is the river corridor area (km2); βN is the average removal rate of nitrogen (%)—according to relevant literature, the average nitrogen removal rate of rivers in Taihu Basin was 32.8%; T is the total waste water discharge (t) of a city, and the data of three cities in 2015 were: Huzhou 2.291348 × 10⁸ t, Jiaxing 3.9315 × 10⁹ t and Suzhou 1.3965934 × 10⁹ t; WA is the total area of urban waterbodies (km2), including rivers, lakes and ponds and wetlands; 0.004% is the average nitrogen content of the Taihu Lake Basin
Outdoor leisure ServiceRiver cluster patchRiver Outdoor Leisure Index (ROLI)ROLIp,i = Si × O p t u i × (1 − T D i ) × (1 − R o a d i )Where i is the river cluster patch i; ROLIp is the outdoor leisure index of river cluster patches; S is the total river area (km2) within the river cluster patches; Optu is the number of outdoor leisure opportunities in river cluster patches; TD is the total distance (km) between the river cluster patch and the nearest construction land patch; Road is the distance (km) between the river cluster patch and the nearest main road (Standardize the range of Road and TD values to make them between 0 and 1. Assign the Optu on a 10-point scale: 3 points—provides basic recreation functions, 5 points—provides 1~10 recreational opportunities, 8 points—provides 10~50 recreational opportunities, 10 points—provides more than 50 recreational opportunities. For the rivers providing no specific recreation opportunities, it is conservatively assumed that these rivers provide at least basic recreation functions, such as bird watching on the riversides, hiking along the rivers and picnics by the rivers, thus giving them a value of 3.)
River corridorROLIc,i = Li × O p t u i × (1 − T D i ) × (1 − R o a d i )Where i is the river corridor i; ROLIc is the outdoor leisure index of river corridors; L is the length of the river corridor (km); Optu is the number of outdoor leisure opportunities in the 500 m buffer zones along the both sides of the river corridor; TD is the total distance (km) between the river corridor and the nearest construction land patch; Road is the distance (km) between the river corridor and the nearest main road (Standardize the range of Road and TD values to make them between 0 and 1. Assign the Optu on a 10-point scale: 3 points—provides basic recreation functions, 5 points-provides 1~10 recreational opportunities, 8 points—provides 10~50 recreational opportunities, 10 points-provides more than 50 recreational opportunities. For the rivers providing no specific recreation opportunities, it is conservatively assumed that these rivers provide at least basic recreation functions, such as bird watching on the riversides, hiking along the rivers and picnics by the rivers, thus giving them a value of 3.)
Table 2. Six datasets for the evaluation of the five ESs provided by linear water spaces.
DataRange and FormatSourceApplication
1 to 10,000 River MapHu-Su-Jia area, vector shapefile (polygon)Beijing Digital View Technology Co., Ltd. (http://www.dview.com.cn/, acessed date: 18 March 2021)
Geographical Information Monitoring Cloud Platform (http://www.dsac.cn/, acessed date: 18 March 2021)
Assessment of all ESs
1 to 10,000 River MapHu-Su-Jia area, linear vector shapefileAssessment of biodiversity conservation service and flood regulation service (from river cluster patches)
Land Use/CoverHu-Su-Jia area, gridAssessment of biodiversity conservation service, micro-climate regulation service (from river corridors) and outdoor leisure service
1 to 100,000 Road MapHu-Su-Jia area, linear vector shapefileAssessment of biodiversity conservation service and outdoor leisure service
Electronic Atlas (Thematic data of scenic spots and historical sites and green space parks)Hu-Su-Jia area, point vector shapefileAssessment of outdoor leisure service
Statistical dataMunicipality, province or basin, spreadsheetHuzhou Statistical Yearbook 2016 (http://tjj.huzhou.gov.cn/, acessed date: 21 March 2021)
Suzhou Environmental Bulletin 2015 (http://sthjj.suzhou.gov.cn/, acessed date: 21 March 2021)
Jiaxing Water Resource Bulletin 2015 (http://www.jiaxing.gov.cn/, acessed date: 21 March 2021)
Assessment of water purification service (from river corridors)
Publisher’s Note: MDPI stays neutral with regard to jurisdictional claims in published maps and institutional affiliations.

