Article

The Exudation of Surplus Products Links Plant Functional Traits and Plant-Microbial Stoichiometry

1
Faculty of Science, University of South Bohemia, Branišovská 1760, 370 05 České Budějovice, Czech Republic
2
Nova Information Management School (NOVA IMS), Universidade Nova de Lisboa, 1070-312 Lisbon, Portugal
*
Author to whom correspondence should be addressed.
Land 2021, 10(8), 840; https://doi.org/10.3390/land10080840
Submission received: 15 July 2021 / Revised: 7 August 2021 / Accepted: 8 August 2021 / Published: 11 August 2021

Abstract

:
The rhizosphere is a hot spot of soil microbial activity and is largely fed by root exudation. The carbon (C) exudation flux, coupled with plant growth, is considered a strategy of plants to facilitate nutrient uptake. C exudation is accompanied by a release of nutrients. Nitrogen (N) and phosphorus (P) co-limit the productivity of the plant-microbial system. Therefore, the C:N:P stoichiometry of exudates should be linked to plant nutrient economies, plant functional traits (PFT) and soil nutrient availability. We aimed to identify the strongest links in C:N:P stoichiometry among all rhizosphere components. A total of eight grass species (from conservative to exploitative) were grown in pots under two different soil C:nutrient conditions for a month. As a result, a wide gradient of plant–microbial–soil interactions were created. A total of 43 variables of plants, exudates, microbial and soil C:N:P stoichiometry, and PFTs were evaluated. The variables were merged into four groups in a network analysis, allowing us to identify the strongest connections among the variables and the biological meaning of these groups. The plant–soil interactions were shaped by soil N availability. Faster-growing plants were associated with lower amounts of mineral N (and P) in the soil solution, inducing a stronger competition for N with microorganisms in the rhizosphere compared to slower-growing plants. The plants responded by enhancing their N use efficiency and root:shoot ratio, and they reduced N losses via exudation. Root growth was supported either by reallocated foliar reserves or by enhanced ammonium uptake, which connected the specific leaf area (SLA) to the mineral N availability in the soil. Rapid plant growth enhanced the exudation flux. The exudates were rich in C and P relative to N compounds and served to release surplus metabolic products. The exudate C:N:P stoichiometry and soil N availability combined to shape the microbial stoichiometry, and N and P mining. In conclusion, the exudate flux and its C:N:P stoichiometry reflected the plant growth rate and nutrient constraints with a high degree of reliability. Furthermore, it mediated the plant–microbial interactions in the rhizosphere.

1. Introduction

The rhizosphere, i.e., the soil directly impacted by the activity of roots [1,2], is one of the most important zones for biogeochemical cycles in terrestrial ecosystems. It closely connects the following two main actors: plants and soil microorganisms. Plant-microbial interactions in the rhizosphere involve multiple components and factors [3]. The root exudation of organic compounds alleviates the C limitation that microbes commonly encounter in bulk soils, and stimulates rhizosphere microbial activity [4,5,6]. Enhanced microbial activity feeds back to plants through changes in nutrient availability [7] and plant development [8,9]. This complexity represents a major challenge for the understanding of ecological processes.
The application of stoichiometric and functional ecology to soil research has enabled a synthesis of the complexity of soil and plants components, both of which are needed to understand rhizosphere processes. The availability of nutrients determines plant growth as well as the stoichiometric restrictions controlling microbial growth, activity, and organic matter decomposition. It also shapes plant–microbe interactions [10,11,12,13,14,15,16]. The rhizosphere is generally a C-surplus and nutrient-limited environment due to the exudation flux of organic compounds and the increased needs of plants and microbes for nutrients. Exudation stimulates microbial growth and the synthesis of exoenzymes that mine nutrients from the soil organic matter (SOM) to fulfil their requirements [17]. Root exudation increases with plant growth rate and nutrient uptake. Consequently, it has been recognised as an important plant strategy for controlling soil nutrient cycling [16,18]. Faster-growing plants are associated with greater microbial activity, faster SOM dynamics, lower N in the microbial biomass, and a different functional community composition than slower-growing plants [15,16,19,20,21,22,23]. Those results are a part of the growing knowledge that link plant functional traits (PFTs) with soil nutrient availability, soil microbial activity-stoichiometry, and SOM decomposition. The current data on PFTs are, however, largely independent of ecological stoichiometry, which limits the capacity of PFT to be a useful indicator [24].
Living roots release not only C compounds but also nutrients in organic and mineral forms, even under nutrient limiting conditions for plants [25]. Such nutrient limiting conditions restrict plant metabolism and generate an excess of some compounds/elements that the plant needs to release. The root exudation flux, thus, partly consists of compounds in excess of the actual plant metabolic requirements [26,27], which should be associated with the variability in both PFT and tissue C:N:P stoichiometry. However, besides the well-established dependence of C exudation fluxes on plant biomass and their stimulation of microbial activity [15,28,29], associations of PFTs with nutrients exuded by roots and their roles in rhizosphere ecology are unknown. The fluxes and stoichiometry of exudates have been suggested as drivers of microbial activity in the rhizosphere [20,30,31], but this is difficult to measure [32]. Identifying PFTs that can predict relevant information about C and nutrient exudation would enable their integration into C cycling models and budgets [33].
In this study, we explored the connections among rhizosphere components, stoichiometry, and PFTs, focusing on the role of exudation stoichiometry in plant–soil interactions. We hypothesised that (H1) faster-growing plants take up more nutrients, which results in greater depletion from the soil solution compared to slower-growing plants. (H2) Plants adapt to decreasing soil nutrient availability by altering the PFT and stoichiometry of tissues and exudates to optimise the uptake and use of nutrients, and (H3) changes in the soil solution and exudation stoichiometry related to plant growth lead to adjustments of the biomass stoichiometry and enzymatic activity of rhizosphere microorganisms. We set up a greenhouse experiment in which we planted eight grass species ranging in nutritional strategy, from conservative to exploitative, in pots with soils adjusted to two different C:nutrient ratios. We changed soil stoichiometry by adding complex C, which intensifies microbial activity and nutrient demands. This is in contrast to most other studies, which have changed soil stoichiometry by adding nutrients (fertiliser) and, thus, alleviating the nutrient limitations of plant production. Diverse plant strategies ensured a gradient in the PFTs and the stoichiometric ratios linked to different soil C:nutrient ratios. We measured and calculated 43 variables defining PFTs, microbial activity, and plant-exudate-microbe-enzyme-soil C:N:P stoichiometry. We performed a network analysis to sort the tightly connected variables into groups with biological (functional) meaning, as demonstrated in previous applications of network analysis [34].

2. Materials and Methods

We used a set of 8 grass species common in European grasslands. The selected species varied along a gradient of increasing specific leaf area (SLA) [35] and ecological strategies [22]; conservative: Festuca rubra, Poa pratensis, and Bromus erectus; intermediate: Dactylis glomerata and Lolium perenne; and exploitative: Holcus lanatus, Phleum pratense, and Poa trivialis.
The soil was classified as cambisol (IUSS Working Group WBR 2015, FAO), collected in an annually mown grassland site (Ceske Budejovice, Czech Republic, 48.9° N, 14.3° E, 450 m a.s.l.). The main soil properties were soil organic C of 12.8 ± 0.3 g kg−1, total N of 1.3 ± 0.03 g kg−1, total P of 0.21 ± 0.04 g kg−1, a C:N ratio of 11.76 ± 0.19 (n = 5) and pH of 5.74 (soil:water mixture, 1:5, w/v); texture loam (55% of sand, 15% of clay). After sieving (2 mm) and removing roots, the soil was split into two parts; one was kept without any treatment, and the other was amended with an agar powder (Fluka agar for microbiology, Millipore Sigma, containing 47% of C) in the final amount of 6.8 g kg−1 (3.2 g C kg−1) [36,37]. The addition enhanced the total C of the soil to 16.0 ± 0.1 g kg−1 and soil C:N to 14.2 ± 0.6 (n = 5). The polysaccharide addition aimed to ensure a long-term supply of C to the soil microbial community, promoting its growth [36,37] and related N requirements, thus strengthening the plant–microbial competition for the available N. Agar was chosen to represent mucilage polysaccharides rich in galactose, which are secreted from plant roots [38,39,40,41], suggesting that agar-like polymers are present in the rhizosphere. In support, agar-degrading bacteria are commonly found in roots and the rhizosphere [42,43,44,45]. The soil, either non-amended or amended, was put in pots (8 cm × 8 cm × 13 cm; 800 g) and planted with seeds of one grass species (15 seeds per pot, 4 replications per soil treatment, 5 unplanted pots per non-amended or amended soil as controls). Plants grew from seed in a greenhouse (exposed to natural light, temperature conditions of 25 °C for 18 h of daytime; 16 °C for 6 h of night-time). Soil water content was adjusted to field capacity at the beginning of the experiment. Pots were irrigated with tap water twice per week to keep the soil moisture at the field water capacity, which was checked by weighing the pots. The experiment lasted one month, from May until June. Then, the plant and soil characteristics were evaluated for each pot (soil parameters only in unplanted pots) as follows.

2.1. Exudates

Intact plants were used for measuring exudation flux. The plants were removed from the pot together with the block of soil. The soil was carefully separated from roots by hand, starting from the outside of the block towards the core with the highest root density. About 30 g of the (core) soil that remained attached to the roots (defined here as the rhizosphere soil) was carefully cleaned from the roots by hand and tweezers in an effort to minimise root disturbance. This rhizosphere soil was used for posterior analyses. The complete removal of soil particles and of metabolites lost from potentially damaged roots was completed by gentle washing and pre-soaking of the roots in 500 mL of distilled water [32]. We tried to reduce root damage effects during the whole procedure, but we are aware that it cannot be totally eliminated. Despite the limitations, the described method of exudate sampling is considered to give results closest to real conditions and is widely used (e.g., [25,46]). All plants from the pot were placed in a beaker with roots submerged in 500 mL of redistilled water and left in daylight in the conditioned greenhouse at 25 °C. After 4 h, the plants were removed and the root exudate solution was vacuum-filtered through a 0.2-micrometre express plus PES (polyethersulfone) membrane filter (GPWP14250, Merck Milipore Ltd., Carrigtwohill, Ireland) to remove microbial cells and root debris if present, and immediately analysed. The soluble exuded C and N (C.exu, N.exu) were determined with a TOC-L analyser equipped with the total N measuring unit TNM-L (Shimadzu, Tokyo, Japan). The concentrations of N-NH4+ (NH4.exu), N-NO3 (NO3.exu) and soluble reactive P in exudates (P.exu) were measured with a Flow Injection Analyzer (FIA Lachat QC8500, Lachat Instruments, Milwaukee, WI, USA). The principal colorimetric methods used in FIA were the ascorbic acid reduction of phosphomolybdic acid for analysis of soluble reactive phosphates, a phenol-hypochlorite assay with the sodium nitroprussite as the catalyst (Berthelot reaction) for ammonium-N measurement, and the diazotisation of sulfanilic acid and subsequent coupling with N-(1-naphthyl)-ethylenediamine in strongly acid solution for nitrate-N analysis. All exudation characteristics are expressed per pot (total plant biomass) and hour.

2.2. Plant Properties and Functional Traits (PFTs)

After exudation measurements, 10 fresh leaves per pot were immersed in tap water overnight, then wiped, scanned using WinRhizo (Regent Instruments, Québec, QC, Canada), then dried at 70 °C for 48 h and weighed. The remaining plant biomass was separated into shoot and root biomass, also dried at 70 °C for 48 h and weighed. Dry tissues were milled and analysed for C and N contents (C.plant, N.plant) after combustion of approximately 3–4 mg of a sample weighted in the tin capsule at 980 °C in the elemental analyser (vario MICRO cube, Elementar, Germany) and for P content (P.plant) after acid digestion [47] using FIA.
The following set of PFTs were evaluated: the plant biomass (Plant.BMS) calculated as the sum of dry shoot and root biomass per pot; and biomass elemental compositions (C.plant, N.plant, P.plant) and appropriate molar stoichiometric ratios. These are all aspects of growth, which are related to the ecological strategy of a species and the soil nutrient availability in a particular pot system. The specific leaf area (SLA), calculated by dividing the fresh leaf area by the dry mass of scanned leaves (10 leaves), is related to the ability of the canopy to capture light per the mass invested in leaf growth, linked to leaf photosynthetic capacity. The root:shoot ratio (RS), the ratio of root over shoot dry biomass of each pot, is an indicator of resource allocation strategy to capture nutrient/water versus light in a given condition. The exudation flux (per pot; C.exu, N.exu, P.exu, NH4.exu, NO3.exu) shows the release of compounds from the roots, which should partially reflect the metabolic C surplus and imbalance in nutrient availability according to actual plant needs [27]. This is considered to be a component of a species ecological strategy [16]. The specific exudation (spc.C.exu, spc.N.exu, spc.P.exu), calculated by dividing the exudation flux of C, N, and P over the root biomass, then shows the “losses” of the compounds containing the respective elements per root mass.

2.3. Physico-Chemical Properties of Soil and Soil Solution

After harvesting, a part of the rhizosphere soil was air-dried, milled, and analysed for the total C and N contents, as was performed for plant tissues. The total soil P was analysed according to [47]. Part of the soil was frozen at −18 °C and the rest of the fresh soil was stored at 4 °C and analysed for soluble organic C and N (DOC and DON), ammonium-N (NH4.ss) and nitrate-N (NO3.ss) within a week. Fresh soils were extracted with 0.5 M of K2SO4 (1:4, w/v) and analysed as performed for exudates. Extractable P (PO4.ss) was determined in 0.5 M of NaHCO3 (1:15, w/v, pH = 8.5) and measured with a spectrophotometer at a wavelength of 890 nm (Genesys 10 S, UV–Vis, Thermo Scientific, Waltham, MA, USA) after reacting with molybdenum blue. The pH was determined in a soil:water mixture (1:5, w/v) using a glass electrode.

2.4. Soil Microbial Biomass and Soil Activities

Microbial C (Cmic), N (Nmic), and P (Pmic) were determined using chloroform fumigation–extraction [48,49,50]. The extraction before and after the fumigation of the soil with amylene-stabilised chloroform for 24 h was performed with 0.5 M of K2SO4 (1:4, w/v) for C and N, and with 0.5 M of NaHCO3 (1:15, w/v, pH = 8.5) for P. The Cmic, Nmic, and Pmic were calculated as differences in the concentrations of organic C, total N (measured on TOC-L analyser) and extractable P (measured after the molybdenum blue reaction on a spectrophotometer at a wavelength of 890 nm [50]) in soil extracts before and after fumigation. The values were corrected for extraction efficiencies using kEC = 0.41 [51], kEN = 0.45 [52], and kEP = 0.4 [50]. Total microbial DNA was extracted from 0.25 g of defrosted soil using a PowerSoil Isolation Kit (MO BIO laboratories, Inc. Carlsbad, CA, USA) according to the suggested protocol, using PowerBeat tubes and tube mixer 693TC5. The extracted DNA was quantified using QuantiFluor® dsDNA Dye in a Quantus Flourometr (Promega, Madison, WI, USA) following the manufacturer’s protocol. Cmic, Nmic, and Pmic were considered to be measures of the total microbial biomass and its molar stoichiometric ratios, whereas microbial DNA served as an indicator of microbial growth and the biomass responsive (activated) to soil C inputs from plants and the added substrate.
Respiration of the rhizosphere soil was measured to characterise microbial activity as the cumulative CO2 production after a 3-day incubation of 10 g of soil in airtight-sealed 100-millilitre flasks at 20 °C, determined using an Agilent 6850 GC system (Agilent Technologies, Santa Clara, CA, USA). Potential activities of five hydrolytic enzymes in the rhizosphere characterised the microbial potential to release C, N, and P from organic substrates. The activity of C-mining (β-glucosidase and cellobiosidase), N-mining (Ala-aminopeptidase and chitinase), and P-mining enzymes (phosphatase) [53] were determined using a microplate fluorometric assay [54]. Defrosted soil samples (1 g) were homogenised in distilled water (100 mL) and sonicated for 4 min; 200 μL of soil suspension was added to 50 μL of methylumbelliferyl solution for β-glucosidase, cellobiosidase, phosphatase, and chitinase (NAG) determination, or to 50 μL of 7-aminomethyl-4-coumarin substrate solution for measurement of Ala-aminopeptidase. From three pre-tested concentrations of each fluorogenic substrate (50, 100, and 300 μM), the one with the highest enzymatic activity was chosen [55,56]. Plates were incubated at 20 °C for 2 h. The fluorescence was measured with an INFINITE F200 microplate reader (TECAN, Crailsheim, Germany) at an excitation wavelength of 365 nm and an emission wavelength of 450 nm.

2.5. Statistical Analyses

A factorial combination of two soil C treatments with eight plant species classified into 3 different ecological strategies (3 conservatives, 2 intermediates, and 3 exploitatives) was performed in order to find a controlled gradient of soil conditions, visible in the distinctive C:N ratio of total soil, as well as a non-controlled gradient of PFTs. After comparing correlation matrices of variables using three different analyses, Pearson, Kendall, and Spearman, the Pearson method was chosen because it showed the best matrix determinant reflected in most links. The Pearson correlation analysis requires numerical variables, for which we had to replace the categorical “plant ecological strategy” with another numerical variable from the measured PFTs. A hierarchical clustering of PFTs (plant biomass, SLA, RS, specific exudation of C, N, and P) using the package clustofvar [57] identified plant biomass as the best representative of a plant ecological strategy. The algorithm uses the Spearman correlation when non-continuous variables are present. Figure S1 shows how we chose the PFT. Plant biomass (g per pot) expressed the species-specific growth rate (the increase in biomass of 15 seedlings per pot and month). All three conservative species had low biomass, whereas plants of the intermediate and exploitative categories had more variable biomass, including the largest biomass values (Figure S1). After selecting only countable variables, we applied the Box–Cox transformation to the 43 numerical variables to reduce the effect of skewed distributions [58], and performed a network analysis that included the relationships with correlation coefficients higher than 0.3 or lower than −0.3 (|r| > 0.3) and an adjusted p-value < 0.05 (Pearson, London, UK). The variables were then distributed into groups according to the maximal modularity using the cluster_optimal function of the library qgraph(v. 1.2.6) [34,59]. All the analyses including the additional correlations (Figures 1–4 and the supplementary matrices) were performed in R software.

3. Results

3.1. C, N, and P Content and Stoichiometry in All Pools

The C:N:P stoichiometry of plant–microbial–soil pools for all species and both soil C:N treatments (64 experimental units) are summarised in Table 1. The coefficients of variance (in %), which represent the flexibility of the respective pools, show that the characteristics of the total soil were the most stable, whereas those of exudates were the most variable. The N concentration and respective stoichiometric ratios were most variable in the plant biomass and soil solution, whereas the P concentration and related elemental ratios were most variable in root exudates and microbial biomass. Microbial respiration was, on average, 20.5 µg C g−1 (±38%), and the total microbial DNA in soil was 7.5 µg g−1 (±18%). Table S1.

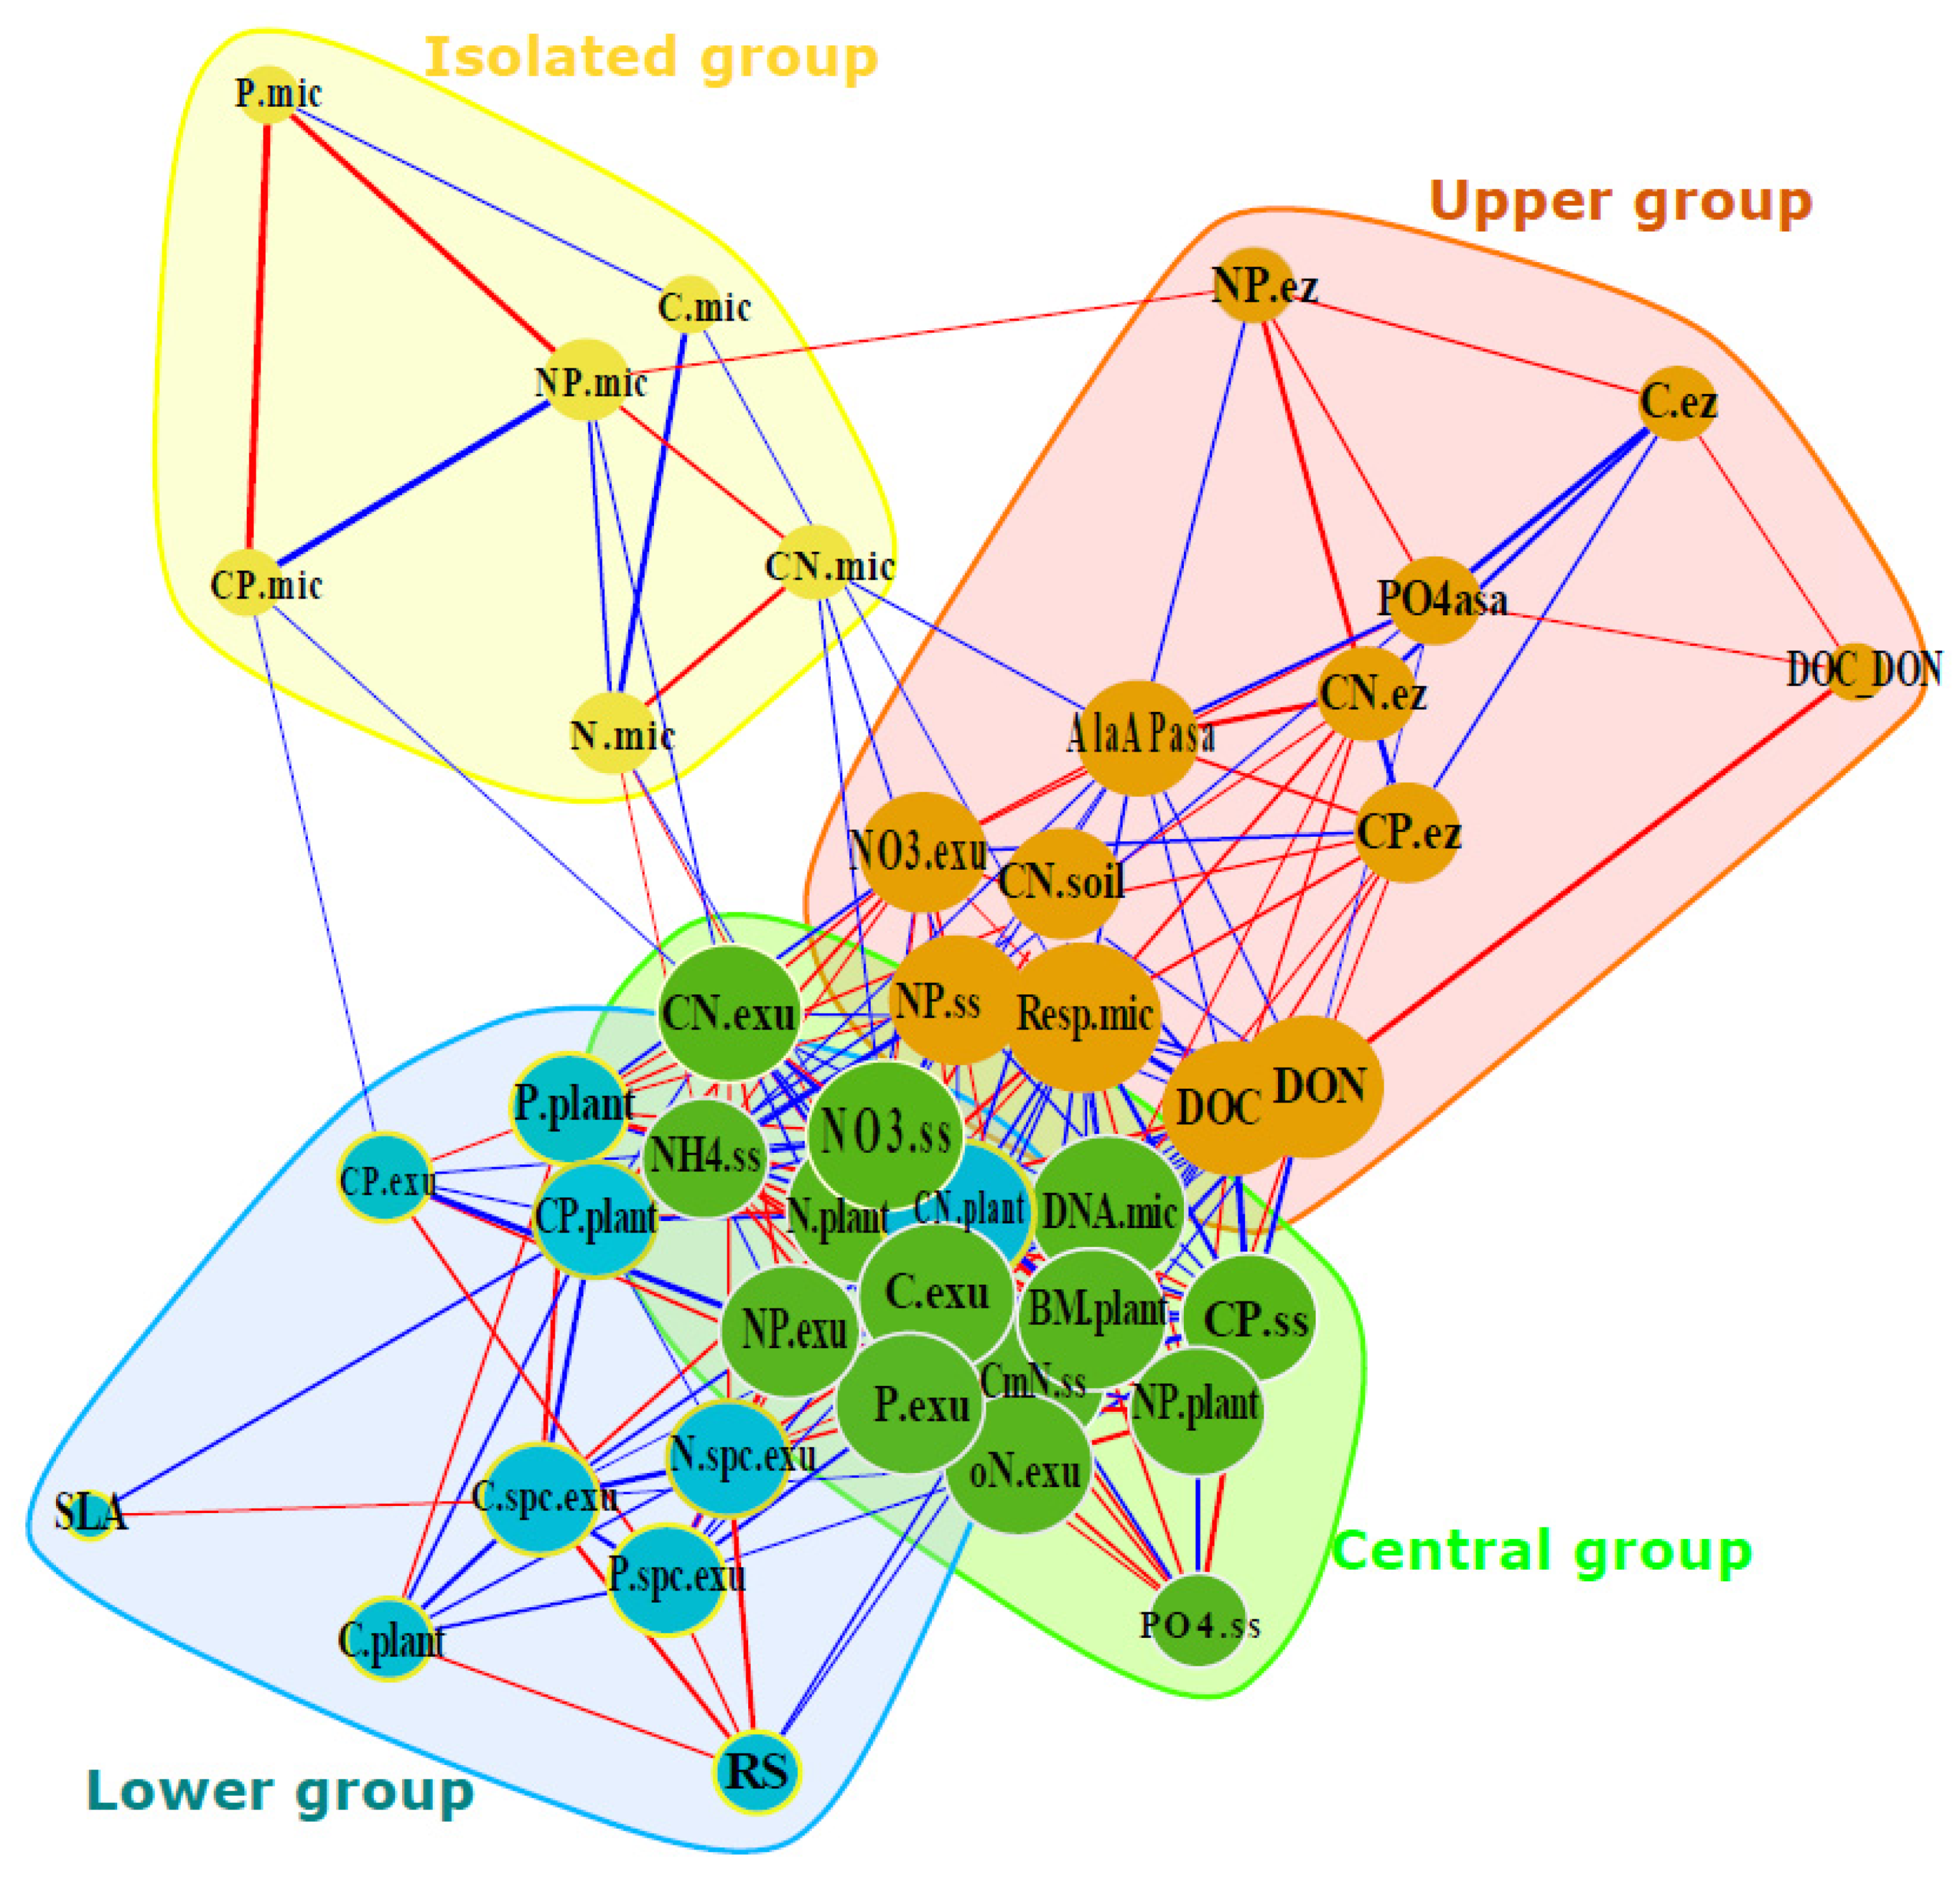
3.2. Variable Clustering and Correlation

3.2.1. Central Group: Close Link to Plant Biomass

The 43 variables characterising interactions in the plant–soil system were sorted into four groups in the network analysis (Figure 1). Details of the correlations (r and p-value) between variables within each group and variables connecting the groups are given in correlation matrices in the supplementary information (Figures S2–S6). Group 1 was in the centre to the network and contained most of the strongest linked variables. It consists of plant biomass (representing plant growth rate) and variables expressing plant C excess and N economy (Figure 1). Faster-growing plants decreased the N content in tissues (N.plant) and enhanced the N use efficiency, which was evidenced by reduced N:P and enhanced C:N ratios of their tissues (Figures S2 and S6). They were also associated with a larger exudation flux of C, P, and organic N, and with higher microbial DNA contents in the rhizosphere soil. The higher C:N (CN.exu) and lower N:P ratio (NP.exu) of exudates correlated with plant C:N:P stoichiometry (Figures S1 and S4). It also reflected the higher N use efficiency and regulation of N losses of the faster-growing plants. This group also includes the variables characterising nutrient availability in the soil (NO3.ss, NH4.ss, PO4.ss). Faster plant growth caused a stronger depletion of mineral nutrients from the soil, which resulted in increased C:N and C:P ratios of the soil solution (CN.ss, CP.ss) (Figure S2).

3.2.2. Upper Group: DOC, Microbial Respiration, and Enzymatic Activity

The second, upper group of variables was connected to the central group. It was strongly influenced by the C:N ratio of total soil. The group consisted mainly of the organic compounds in the soil solution, microbial respiration, and exoenzymatic activity (Figure 1). The correlation matrix showed the following relations among the variables (Figure S3). The soils with higher C:N ratios contained more dissolved organic matter (DOC and DON) than soils of lower C:N ratios. The plants growing in soils with a high DOC concentration, originating from both added soil C and the large exudation flux, released root exudates poor in nitrates (NO3.exu). Under high DOC, the microbial communities had higher respiration (Resp.mic) and invested more into N-mining enzyme activity (AlaAPasa). The increase in N-mining was further accompanied by enhanced phosphatase activity, which resulted in a lower C:N and C:P but a higher N:P of enzymatic activities under a high soil C:N (Figure S3). All these relations indicate a deepening nutrient limitation in plant–soil systems under high DOC concentrations.

3.2.3. Lower Group: Plant and Exudates Stoichiometry

The third, lower group includes variables that were linked to plant growth less than those in the central group (Figure 1). The strongest variable of the group was the CN.plant, which increased with plant growth and with the soil CN (Figure S6). The plants with enhanced tissue C:N were also poor in P (having a higher biomass C:P). The C.plant and P.plant were negatively correlated and together formed the CP.plant. The plants with increasing CP.plant exuded compounds enriched in P (decreasing CP.exu, Figure S4). Another important PFT in the group was the RS, which was controlled by plant growth after a certain threshold. Small slower-growing plants/species had comparable RSs, but they started to increase, when the plant biomass exceeded 3 g (Figure 2). Faster-growing plants, which invested more in root growth (increasing RS), released less exudates per root-mass (C.spc.exu, N.spc.exu, and P.spc.exu). Decreasing C.spc.exu was associated with a larger SLA (Figure 1 and Figure S4) and with ammonium availability in the soil solution (Figure S6).

3.2.4. Isolated Group: Microbial Biomass and Stoichiometry

The fourth, most isolated group includes all the variables of microbial biomass and C:N:P stoichiometry (Figure 1). All microbially bound elements, C, N, and P, were correlated (Figure S5). However, microbial C and P (C.mic, P.mic) were decoupled from non-microbial variables in other groups. Microbial and exudate C:P ratios were positively correlated (Figure 3a), which points to a close link between plant and rhizosphere microorganisms mediated via exudation. Microbial and enzymatic N:P ratios were negatively correlated (Figure 1, Figure S6), and phosphatase activity was linked to the N:P ratio of the soil solution (Figure 3b), in support of the microbial adaptation to the actual nutrient availability by shifts in exoenyzmatic activity. The strongest variables of this group were related to microbial N (N.mic), which connects the microbial biomass and stoichiometry with N.plant, mineral forms of N in the soil solution and enzymatic activity (Figure 4). An increasing microbial N was linked to decreasing N concentrations in the plant (Figure 4a) and decreasing NH4+ concentrations in the soil solution (Figure 4b). The lower C:N of the microbial biomass was related to NO3 depletion (Figure 4c) and lower Ala-aminopeptidase activity (Figure 4d).

4. Discussion

4.1. Larger Plants Optimised Their Utilisation of N, the Most Limiting Element

The central group was composed of variables characterising plant growth and related nutrient economics. The size of the plants was proportional to the depletion of mineral nutrients from the soil solution, with the strongest decline for nitrate availability, followed by ammonia and phosphates (Figure 1, central group), in support of H1. The reductions in nitrate and ammonium availability due to plant size are in line with the widespread evidence that plants preferentially take up N in its mineral forms [60,61,62,63] and rapidly deplete the highly mobile NO3 [64]. Plant biomass was further strongly negatively linked with the N content in tissues and exudates. Larger plants, associated with lower mineral N concentrations in the soil solution, were forced to optimise their N use. They reduced N contents in the tissues (demonstrated by a lowering of N.plant and NP.plant) and in exudates, which had higher C:N and lower N:P ratios. These N savings resulted in the higher efficiency in the N use of the larger plants. The close connections among the C:N stoichiometry of the soil solution, plant biomass, and exudates suggests that the N availability in the plant–soil system played a key role in controlling the plant production and N economy, supporting H2. The soluble phosphate pool was more strongly linked to the plant N:P ratio than to plant biomass (Figure 1, central group, Figure S2), in support of a stronger control of plant production by N than P availability in our experiment. The change in tissue stoichiometry (shown by both the absolute and relative lowering of the N content) was accompanied by differential biomass allocation. The large plants in which the biomass exceeded a certain threshold (3 g in our case) enhanced their RS ratio (Figure 2). Such a response has been observed in plants under conditions of N deficiency [65,66]. We, thus, suggest that larger (faster-growing) plants induced a strong N limitation in the soils due to their high N demands, supporting H2.

4.2. Root Exudation Served to Get Rid of Surplus Elements

Plant biomass was associated with a larger C exudation flux (Figure 1, central group), which has been previously observed [15,16,28,67,68]. Notably, we report here for the first time that the larger exudation of C compounds was accompanied by a larger release of organic N and total P from the roots. This increased net exudation of nutrients. However, it contradicts the assumption that root exudation serves as a plant investment of C aimed at stimulating nutrient mining from the soil organic matter by microorganisms. Instead, we observed that the exudation of larger plants was mostly composed of products that plants could not immobilise due to their actual N limitation. Larger plants that faced lower soil N availability had an excess of C and P compounds in relation to their needs. Therefore, they released C and P compounds via exudation, which had higher C:N and lower N:P ratios than smaller plants, reflecting the plant tissue stoichiometry (H2) (Figure 1, central group). Additionally, the fast-growing plants also reduced their mass-specific exudation of N but not that of C and P, in accordance with their “N saving” economy and higher N use efficiency compared to the smaller plants. In summary, our results well support the concept that exudation is more a release of surplus products than a targeted investment of plants [27].

4.3. Fast Growth Implied an Adjustment of PFT to Depletion of Mineral N

Fast growing plants, with their large root systems and, thus, high RS, released fewer exudates per root-mass (Figure 1, lowest group). The C that is fixed aboveground in excess to other limiting biogenic nutrients is exported from leaves to prevent damage to photosynthetic structures caused by sugar accumulation [27]. The flow goes belowground, where transported sucrose serves as a signal for root growth. The N required for building root tissues [69] can be obtained either from remobilised shoot reserves, which alters PFT (e.g., SLA, plant N content) or from the soil solution, which affects the concentration of N-forms in the soil solution. Graminoids growing under low N availability increase their phloem load with C and amino acids to support root growth [69,70,71]. The active remobilisation of leaf reserves may reduce leaf thickness and result in an increase in SLA. Therefore, SLA can be used as an indicator of leaf storage. In our experiment, an increasing SLA was connected to a higher NH4+ availability in the soil solution. We, thus, speculate that those species having a higher SLA remobilised their N reserves from leaves to supply root growth, and did not take up extra amounts of NH4+ from the soil. In contrast, those plants with a lower SLA kept their reserves in leaves and supplemented their N-needs for root growth via increased NH4+ uptake from the soil solution. They were, thus, associated with lower available NH4+. This agrees with findings that plants tend to take up more NH4+ from the soil when they have high concentrations of carbohydrates in roots to support amino acids’ synthesis [72,73]. Though our suggestions are highly speculative and include processes and variables that are rarely linked in the existing literature, it is worth noting them, since these links should be relevant in plant soil interactions. Our pot experiment with species monocultures excluded potential competition between species with different economic traits for aboveground resources (namely light). This explains why SLA was linked to soil conditions but not to plant growth, as has been found in some field experiments [74,75].

4.4. Plant Microbe Links Were Mediated through the Competition for N and Exudation Stoichiometry

The grouping of enzymatic activity and microbial respiration with DOM availability that we observed in the second (upper) group is well supported by the literature [15,16,76,77,78,79]. Microbial growth (indicated by microbial DNA amounts) and respiration, though also closely connected, belonged to different groups (Figure 1, central and upper groups). Microbial DNA was tightly linked with variables of plant growth, in support of the key role of easy-available exudation stimulating growth and turnover in rhizospheric microorganisms (Henneron et al., 2020b).
Variables of microbial C:N:P stoichiometry were located in a separate group from the rest of the variables, which could reflect the relatively strict homeostasis of this pool [10,80,81,82]. The network analysis further revealed that the microbial N and P stoichiometry was influenced by different plant and soil characteristics. Microbial P and related ratios were the most variable within the microbial stoichiometry (Table 1), which agrees with Chen et al. [83]. The variation in P ratios reflects microbial growth activity and the ability of microbes to store it [84,85]. Microbial and exudate C:P ratios were coupled (Figure 3a), suggesting that exuded P was an important source for the P-demanding rhizospheric microbial community. The P exudation and, thus, the P supply of root-associated microbes increased with deepening plant N starvation, occurring proportional to plant size, as discussed above. The enzymatic P-mining from SOM via phosphatase activity was negatively linked to the N:P stoichiometry of the soil solution and of the microbial biomass (Figure 1 and Figure 3b). Microbes, thus, invested in exoenzyme P mining when P availability started to be limited in relation to N, supporting the theory of ecological stoichiometry [53]. We, thus, suggest that microorganisms associated with fast-growing N-limited plants are efficiently supplied by P-rich exudates, while those associated with slower-growing plants facing higher N availability (higher N:P of the soil solution and higher concentrations of mineral N forms) are forced to mine P from SOM more via enhanced phosphatase activity, in support of H3. This agrees with Drake et al. [31], who suggested that root exudate stoichiometry determines microbial activity in the rhizosphere.
Fast-growing plants extracted more N from the soil, which almost certainly resulted from accelerated N mineralisation compared to small plants, as already demonstrated [16]. They further observed that fast-growing plants were accompanied by a soil microbial biomass with a higher C:N ratio than slow-growing species. However, we found the opposite trend, with a depletion of mineral N forms in soil under fast-growing plants, stimulating N immobilisation in microorganisms and resulting in a low C:N microbial biomass (Figure 4). We attribute this contradiction to the difference in soil fertility between the experiments. The soil C and N contents were eight times lower in our case (Table 1), representing a stronger microbial C and N co-limitation, expressed also in a much lower microbial biomass in our experiment (Table 1) [15]. In the short term, microorganisms are superior competitors to plants for organic N and also better competitors for mineral N, especially under very low concentrations [86]. Of the mineral forms, they preferentially consume available NH4+ over NO3 [86,87,88], while plants preferentially take up mobile nitrates, which alleviates their competition for N through chemical niche separation [89]. However, we observed a strong depletion of both mineral N forms from the soil solution under fast-growing plants, indicating conditions of strong competition for N and high energy expenses in N incorporation into the microbial biomass [90]. The microbial biomass built under such conditions had a low C:N ratio. It was associated with low alanine aminopeptidase activity (H3) (Figure 4c,d). This supports the suggestion that very low mineral N availability limits microbial investments into the highly N-demanding production of exoenzymes [31,91,92,93,94]. In our case, microorganisms reduced only N mining but not the activity of other hydrolytic enzymes. This suggests that the repression of N mining is a coordinated microbial strategy for the efficient N use and competition for N uptake by fast-growing plants under very low N availability, supporting H3. Such conditions push plants to adapt their metabolism and PFTs to increase N use efficiency (CN.plant) and N uptake (RS) by the optional re-translocation of leaf reserves (SLA) and decreased specific N exudation.

5. Conclusions

The plant growth-related uptake of nutrients from the soil reduced the availability of both mineral N and P in the soil. The nutrient uptake was proportional to the plant biomass. The depletion of nutrients from the soil solution caused by fast plant growth forced large plants to reduce N concentrations in tissues and losses via exudation, and to relocate biomass to intensify soil exploration by increasing SLA and RS. The exudation of plants facing low N availability was relatively richer in C and P against N, which indicates that exudation served to release surplus elements from plants. The exudation C:P ratio correlated with the C:P of the microbial biomass, suggesting that root exudation serves as an important source of C and P for soil microbes. Therefore, exudation mediates the coupling of plant and microbe nutrient requirements. Microorganisms responded to deepening N limitation by enhancing N immobilisation over N mining, which strengthened the plant-microbe competition for N and resulted in tightly closed N recycling. Our data showed that soil nutrient availability and soil solution stoichiometry control plant–microbe interactions.
Our results cast light over the use of plant stoichiometry and PFT as indicators of exudation and microbial stoichiometry. There is a need for similar studies, which would focus on plant–exudates–microbial links under a strong P limitation to complement the knowledge. We propose field studies evaluating these links as the next step for their validation under complex natural conditions.

Supplementary Materials

The following are available online at https://www.mdpi.com/article/10.3390/land10080840/s1, Figure S1: Dendrogram of correlations among plant category (X.qualy) and biomass (bm.plant), SLA, RS and specific exudation of C, N and P (_.spc.exu) (a). Spearman correlation analysis between plant category and biomass (b), SLA (c), and RS (d), Figure S2: Pearson correlation matrix of variables included in the central group. Under the diagonal are writen the correlation coeffients proportional to the colour of each cell, Figure S3: Pearson correlation matrix of variables included in the upper group. Under the diagonal are writen the correlation coeffients proportional to the colour of each cell, Figure S4: Pearson correlation matrix of variables included in the lower group. Under the diagonal are writen the correlation coeffients proportional to the colour of each cell, Figure S5: Pearson correlation matrix of variables included in the microbial biomass stoichiometry group. Under the diagonal are writen the correlation coeffients proportional to the colour of each cell, Figure S6: Pearson correlation matrix of variables from different groups. Under the diagonal are writen the correlation coeffients proportional to the colour of each cell, Supplementary Table S1: Strenght of the variables by groups in Figure 1. Strength means the numeber of linkns of each variable.

Author Contributions

Conceptualisation, J.C. and E.K.; methodology, J.C. and E.K.; software, J.C. and F.S.; validation, E.K.; formal analysis and investigation, J.C., F.S. and E.K.; resources, E.K.; data curation, J.C. and F.S.; writing—original draft preparation, J.C.; writing—review and editing, F.S. and E.K.; visualisation, J.C.; supervision, E.K.; project administration, E.K.; funding acquisition, E.K. All authors have read and agreed to the published version of the manuscript.

Funding

This study was supported by the Czech Science Foundation (GACR, project 19-17139S) and by the Ministry of Education, Youth and Sports of the Czech Republic (MEYS; projects LM2015075, EF16_013/0001782–SoWa Ecosystems Research).

Data Availability Statement

Acknowledgments

We thank our technicians Ondra Žampach, DanVaněk, Katka Kučerová, Lenka Čapková and Hana Petrásková for their help with destructive samplings and laboratory analyses.

Conflicts of Interest

The authors declare no conflict of interest. The funders had no role in the design of the study; in the collection, analyses, or interpretation of data; in the writing of the manuscript, or in the decision to publish the results.

References

  1. De Graaff, M.A.; Classen, A.T.; Castro, H.F.; Schadt, C.W. Labile soil carbon inputs mediate the soil microbial community composition and plant residue decomposition rates. New Phytol. 2010, 188, 1055–1064. [Google Scholar] [CrossRef] [Green Version]
  2. Orwin, K.H.; Buckland, S.M.; Johnson, D.; Turner, B.L.; Smart, S.; Oakley, S.; Bardgett, R.D. Linkages of plant traits to soil properties and the functioning of temperate grassland. J. Ecol. 2010, 98, 1074–1083. [Google Scholar] [CrossRef] [Green Version]
  3. Bai, Z.; Liang, C.; Bodé, S.; Huygens, D.; Boeckx, P. Phospholipid 13C stable isotopic probing during decomposition of wheat residues. Appl. Soil Ecol. 2016, 98, 65–74. [Google Scholar] [CrossRef]
  4. Cheng, W.; Zhang, Q.; Coleman, D.C.; Carroll, C.R.; Hoffman, C.A. Is available carbon limiting microbial respiration in the rhizosphere? Soil Biol. Biochem. 1996, 28, 1283–1288. [Google Scholar] [CrossRef]
  5. Blagodatskaya, E.; Blagodatsky, S.; Anderson, T.H.; Kuzyakov, Y. Microbial growth and carbon use efficiency in the rhizosphere and root-free soil. PLoS ONE 2014, 9, e93282. [Google Scholar] [CrossRef]
  6. Kuzyakov, Y. Review: Factors affecting rhizosphere priming effects. J. Plant Nutr. Soil Sci. 2002, 165, 382–396. [Google Scholar] [CrossRef]
  7. Hunter, P. Plant microbiomes and sustainable agriculture: Deciphering the plant microbiome and its role in nutrient supply and plant immunity has great potential to reduce the use of fertilizers and biocides in agriculture. EMBO Rep. 2016, 17, 1696–1699. [Google Scholar] [CrossRef] [PubMed] [Green Version]
  8. Lu, T.; Ke, M.; Lavoie, M.; Jin, Y.; Fan, X.; Zhang, Z.; Fu, Z.; Sun, L.; Gillings, M.; Peñuelas, J.; et al. Rhizosphere microorganisms can influence the timing of plant flowering. Microbiome 2018, 6, 231. [Google Scholar] [CrossRef] [PubMed]
  9. Senthil Kumar, C.M.; Jacob, T.K.; Devasahayam, S.; Thomas, S.; Geethu, C. Multifarious plant growth promotion by an entomopathogenic fungus Lecanicillium psalliotae. Microbiol. Res. 2018, 207, 153–160. [Google Scholar] [CrossRef]
  10. Čapek, P.; Manzoni, S.; Kaštovská, E.; Wild, B.; Diáková, K.; Bárta, J.; Schnecker, J.; Biasi, C.; Martikainen, P.J.; Alves, R.J.E.; et al. A plant–microbe interaction framework explaining nutrient effects on primary production. Nat. Ecol. Evol. 2018, 2, 1588–1596. [Google Scholar] [CrossRef] [Green Version]
  11. Manzoni, S. Flexible carbon-use efficiency across litter types and during decomposition partly compensates nutrient imbalances-results from analytical stoichiometric models. Front. Microbiol. 2017, 8, 661. [Google Scholar] [CrossRef] [Green Version]
  12. Manzoni, S.; Trofymow, J.A.; Jackson, R.B.; Porporato, A. Stoichiometric controls on carbon, nitrogen, and phosphorus dynamics in decomposing litter. Ecol. Monogr. 2010, 80, 89–106. [Google Scholar] [CrossRef]
  13. Manzoni, S.; Taylor, P.; Richter, A.; Porporato, A.; Ågren, G.I. Environmental and stoichiometric controls on microbial carbon-use efficiency in soils. New Phytol. 2012, 196, 79–91. [Google Scholar] [CrossRef] [PubMed]
  14. Zechmeister-Boltenstern, S.; Keiblinger, K.M.; Mooshammer, M.; Peñuelas, J.; Richter, A.; Sardans, J.; Wanek, W. The application of ecological stoichiometry to plant-microbial-soil organic matter transformations. Ecol. Monogr. 2015, 85, 133–155. [Google Scholar] [CrossRef] [Green Version]
  15. Henneron, L.; Kardol, P.; Wardle, D.A.; Cros, C.; Fontaine, S. Rhizosphere control of soil nitrogen cycling: A key component of plant economic strategies. New Phytol. 2020, 228, 1269–1282. [Google Scholar] [CrossRef]
  16. Henneron, L.; Cros, C.; Picon-Cochard, C.; Rahimian, V.; Fontaine, S. Plant economic strategies of grassland species control soil carbon dynamics through rhizodeposition. J. Ecol. 2020, 108, 528–545. [Google Scholar] [CrossRef]
  17. Craine, J.M.; Morrow, C.; Fierer, N. Microbial nitrogen limitation increases decomposition. Ecology 2007, 88, 2105–2113. [Google Scholar] [CrossRef]
  18. Guyonnet, J.P.; Cantarel, A.A.M.; Simon, L.; Haichar, F.Z. Root exudation rate as functional trait involved in plant nutrient-use strategy classification. Ecol. Evol. 2018, 8, 8573–8581. [Google Scholar] [CrossRef] [Green Version]
  19. Ordoñez, J.C.; Van Bodegom, P.M.; Witte, J.P.M.; Wright, I.J.; Reich, P.B.; Aerts, R. A global study of relationships between leaf traits, climate and soil measures of nutrient fertility. Glob. Ecol. Biogeogr. 2009, 18, 137–149. [Google Scholar] [CrossRef]
  20. Carrillo, Y.; Bell, C.; Koyama, A.; Canarini, A.; Boot, C.M.; Wallenstein, M.; Pendall, E. Plant traits, stoichiometry and microbes as drivers of decomposition in the rhizosphere in a temperate grassland. J. Ecol. 2017, 105, 1750–1765. [Google Scholar] [CrossRef] [Green Version]
  21. Freschet, G.T.; Cornelissen, J.H.C.; van Logtestijn, R.S.P.; Aerts, R. Substantial nutrient resorption from leaves, stems and roots in a subarctic flora: What is the link with other resource economics traits? New Phytol. 2010, 186, 879–889. [Google Scholar] [CrossRef]
  22. de Vries, F.T.; Bardgett, R.D. Plant community controls on short-term ecosystem nitrogen retention. New Phytol. 2016, 210, 861–874. [Google Scholar] [CrossRef] [Green Version]
  23. De Deyn, G.B.; Cornelissen, J.H.C.; Bardgett, R.D. Plant functional traits and soil carbon sequestration in contrasting biomes. Ecol. Lett. 2008, 11, 516–531. [Google Scholar] [CrossRef]
  24. Meunier, C.L.; Boersma, M.; El-Sabaawi, R.; Halvorson, H.M.; Herstoff, E.M.; Van de Waal, D.B.; Vogt, R.J.; Litchman, E. From elements to function: Toward unifying ecological stoichiometry and trait-based ecology. Front. Environ. Sci. 2017, 5, 1–10. [Google Scholar] [CrossRef] [Green Version]
  25. Edwards, K.R.; Kaštovská, E.; Borovec, J.; Šantrůčková, H.; Picek, T. Species effects and seasonal trends on plant efflux quantity and quality in a spruce swamp forest. Plant Soil 2018, 426, 179–196. [Google Scholar] [CrossRef]
  26. Canarini, A.; Kaiser, C.; Merchant, A.; Richter, A.; Wanek, W. Root exudation of primary metabolites: Mechanisms and their roles in plant responses to environmental stimuli. Front. Plant Sci. 2019, 10, 157. [Google Scholar] [CrossRef] [Green Version]
  27. Prescott, C.E.; Grayston, S.J.; Helmisaari, H.S.; Kaštovská, E.; Körner, C.; Lambers, H.; Meier, I.C.; Millard, P.; Ostonen, I. Surplus Carbon Drives Allocation and Plant–Soil Interactions. Trends Ecol. Evol. 2020, 35, 1110–1118. [Google Scholar] [CrossRef]
  28. Baptist, F.; Aranjuelo, I.; Legay, N.; Lopez-Sangil, L.; Molero, G.; Rovira, P.; Nogués, S. Rhizodeposition of organic carbon by plants with contrasting traits for resource acquisition: Responses to different fertility regimes. Plant Soil 2015, 394, 391–406. [Google Scholar] [CrossRef] [Green Version]
  29. Kaštovská, E.; Edwards, K.; Šantrůčková, H. Rhizodeposition flux of competitive versus conservative graminoid: Contribution of exudates and root lysates as affected by N loading. Plant Soil 2017, 412, 331–344. [Google Scholar] [CrossRef]
  30. Bengtson, P.; Barker, J.; Grayston, S.J. Evidence of a strong coupling between root exudation, C and N availability, and stimulated SOM decomposition caused by rhizosphere priming effects. Ecol. Evol. 2012, 2, 1843–1852. [Google Scholar] [CrossRef] [PubMed]
  31. Drake, J.E.; Darby, B.A.; Giasson, M.A.; Kramer, M.A.; Phillips, R.P.; Finzi, A.C. Stoichiometry constrains microbial response to root exudation-insights from a model and a field experiment in a temperate forest. Biogeosciences 2013, 10, 821–838. [Google Scholar] [CrossRef] [Green Version]
  32. Oburger, E.; Jones, D.L. Sampling root exudates—Mission impossible? Rhizosphere 2018, 6, 116–133. [Google Scholar] [CrossRef]
  33. Gougherty, S.W.; Bauer, J.E.; Pohlman, J.W. Exudation rates and δ13C signatures of tree root soluble organic carbon in a riparian forest. Biogeochemistry 2018, 137, 235–252. [Google Scholar] [CrossRef]
  34. Kolaczyk, E.D.; Csardi, G. Statistical Analysis of Network Data with R Introduction; Springer: Berlin, Germany, 2014; Volume 65. [Google Scholar]
  35. Miles, J.; Grime, J.P.; Hodgson, J.G.; Hunt, R.; Davy, A.J. Comparative Plant Ecology. A Functional Approach to Common British Species; Springer: Berlin, Germany, 1988. [Google Scholar] [CrossRef]
  36. Reischke, S.; Rousk, J.; Bååth, E. The effects of glucose loading rates on bacterial and fungal growth insoil. Soil Biol. Biochem. 2014, 70, 88–95. [Google Scholar] [CrossRef]
  37. Reischke, S.; Kumar, M.G.K.; Bååth, E. Threshold concentration of glucose for bacterial growth in soil. Soil Biol. Biochem. 2015, 80, 218–223. [Google Scholar] [CrossRef]
  38. Knee, E.M.; Gong, F.C.; Gao, M.; Teplitski, M.; Jones, A.R.; Foxworthy, A.; Mort, A.J.; Bauer, W.D. Root mucilage from pea and its utilization by rhizosphere bacteria as a sole carbon source. Mol. Plant-Microbe Interact. 2001, 14, 775–784. [Google Scholar] [CrossRef] [PubMed] [Green Version]
  39. Chaboud, A.; Rougier, M. Identification and Localization of Sugar Components of Rice (Oryza sativa L.) Root Cap Mucilage. J. Plant Physiol. 1984, 116, 323–330. [Google Scholar] [CrossRef]
  40. Bacic, A.; Moody, S.F.; Clarke, A.E. Structural Analysis of Secreted Root Slime from Maize ( Zea mays L.). Plant Physiol. 1986, 80, 771–777. [Google Scholar] [CrossRef] [PubMed] [Green Version]
  41. Moody, S.F.; Clarke, A.E.; Bacic, A. Structural analysis of secreted slime from wheat and cowpea roots. Phytochemistry 1988, 27, 2857–2861. [Google Scholar] [CrossRef]
  42. Song, T.; Zhang, W.; Wei, C.; Jiang, T.; Xu, H.; Cao, Y.; Cao, Y.; Qiao, D. Isolation and characterization of agar-degrading endophytic bacteria from plants. Curr. Microbiol. 2015, 70, 275–281. [Google Scholar] [CrossRef]
  43. Song, T.; Cao, Y.; Xu, H.; Zhang, W.; Fei, B.; Qiao, D.; Cao, Y. Purification and characterization of a novel β-agarase of Paenibacillus sp. SSG-1 isolated from soil. J. Biosci. Bioeng. 2014, 118, 125–129. [Google Scholar] [CrossRef]
  44. Hosoda, A.; Sakai, M.; Kanazawa, S. Isolation and Characterization of Agar-degrading Paenibacillus spp. Associated with the Rhizosphere of Spinach. Biosci. Biotechnol. Biochem. 2003, 67, 1048–1055. [Google Scholar] [CrossRef] [Green Version]
  45. Sakai, M.; Hosoda, A.; Ogura, K.; Ikenaga, M. The growth of steroidobacter agariperforans sp. nov., a novel agar-degrading bacterium isolated from soil, is enhanced by the diffusible metabolites produced by bacteria belonging to rhizobiales. Microbes Environ. 2014, 29, 89–95. [Google Scholar] [CrossRef] [Green Version]
  46. Canarini, A.; Merchant, A.; Dijkstra, F.A. Drought effects on Helianthus annuus and Glycine max metabolites: From phloem to root exudates. Rhizosphere 2016, 2, 85–97. [Google Scholar] [CrossRef]
  47. Kopáček, J.; Borovec, J.; Hejzlar, J.; Porcal, P. Spectrophotometric determination of iron, aluminum, and phosphorus in soil and sediment extracts after their nitric and perchloric acid digestion. Commun. Soil Sci. Plant Anal. 2001, 32, 1431–1443. [Google Scholar] [CrossRef]
  48. Brookes, P.C.; Landman, A.; Pruden, G.; Jenkinson, D.S. Chloroform fumigation and the release of soil nitrogen: A rapid direct extraction method to measure microbial biomass nitrogen in soil. Soil Biol. Biochem. 1985, 17, 837–842. [Google Scholar] [CrossRef]
  49. Vance, E.D.; Brookes, P.C.; Jenkinson, D.S. An extraction method for measuring soil microbial biomass C. Soil Biol. Biochem. 1987, 19, 703–707. [Google Scholar] [CrossRef]
  50. Brookes, P.C.; Powlson, D.S.; Jenkinson, D.S. Measurement of microbial biomass phosphorus in soil. Soil Biol. Biochem. 1982, 14, 319–329. [Google Scholar] [CrossRef]
  51. Sparling, G.P.; Shepherd, T.G.; Schipper, L.A. Topsoil characteristics of three contrasting New Zealand soils under four long-term land uses. N. Z. J. Agric. Res. 2000, 43, 569–583. [Google Scholar] [CrossRef]
  52. Chen, X.; Daniell, T.J.; Neilson, R.; O’Flaherty, V.; Griffiths, B.S. Microbial and microfaunal communities in phosphorus limited, grazed grassland change composition but maintain homeostatic nutrient stoichiometry. Soil Biol. Biochem. 2014, 75, 94–101. [Google Scholar] [CrossRef]
  53. Sinsabaugh, R.L.; Hill, B.H.; Follstad Shah, J.J. Ecoenzymatic stoichiometry of microbial organic nutrient acquisition in soil and sediment. Nature 2009, 462, 795–798. [Google Scholar] [CrossRef]
  54. Marx, M.C.; Wood, M.; Jarvis, S.C. A microplate fluorimetric assay for the study of enzyme diversity in soils. Soil Biol. Biochem. 2001, 33, 1633–1640. [Google Scholar] [CrossRef]
  55. Bárta, J.; Šlajsová, P.; Tahovská, K.; Picek, T.; Šantrůčková, H. Different temperature sensitivity and kinetics of soil enzymes indicate seasonal shifts in C, N and P nutrient stoichiometry in acid forest soil. Biogeochemistry 2014, 117, 525–537. [Google Scholar] [CrossRef]
  56. Burns, R.G.; DeForest, J.L.; Marxsen, J.; Sinsabaugh, R.L.; Stromberger, M.E.; Wallenstein, M.D.; Weintraub, M.N.; Zoppini, A. Soil enzymes in a changing environment: Current knowledge and future directions. Soil Biol. Biochem. 2013, 58, 216–234. [Google Scholar] [CrossRef]
  57. Chavent, M.; Kuentz-Simonet, V.; Liquet, B.; Saracco, J. ClustOfVar: An R package for the clustering of variables. J. Stat. Softw. 2012, 50. [Google Scholar] [CrossRef] [Green Version]
  58. Box, G.E.P.; Cox, D.R. An Analysis of Transformations. J. R. Stat. Soc. Ser. B 1964, 26, 211–243. [Google Scholar] [CrossRef]
  59. Brandes, U.; Delling, D.; Gaertler, M.; Görke, R.; Hoefer, M.; Nikoloski, Z.; Wagner, D. On modularity clustering. IEEE Trans. Knowl. Data Eng. 2008, 20, 172–188. [Google Scholar] [CrossRef] [Green Version]
  60. Biernath, C.; Fischer, H.; Kuzyakov, Y. Root uptake of N-containing and N-free low molecular weight organic substances by maize: A 14C/15N tracer study. Soil Biol. Biochem. 2008, 40, 2237–2245. [Google Scholar] [CrossRef]
  61. Harrison, K.A.; Bol, R.; Bardgett, R.D. Preferences for different nitrogen forms by coexisting plant species and soil microbes. Ecology 2007, 88, 989–999. [Google Scholar] [CrossRef] [PubMed]
  62. Rasmussen, J.; Sauheitl, L.; Eriksen, J.; Kuzyakov, Y. Plant uptake of dual-labeled organic N biased by inorganic C uptake: Results of a triple labeling study. Soil Biol. Biochem. 2010, 42, 524–527. [Google Scholar] [CrossRef]
  63. Xu, X.; Stange, C.F.; Richter, A.; Wanek, W.; Kuzyakov, Y. Light affects competition for inorganic and organic nitrogen between maize and rhizosphere microorganisms. Plant Soil 2008, 304, 59–72. [Google Scholar] [CrossRef]
  64. Tinker, P.B.; Nye, P. Solute Movement in the Rhizosphere; Oxford University Press (OUP): Oxford, UK, 2000. [Google Scholar]
  65. Bélanger, G.; Gastal, F.; Warembourg, F.R. Carbon Balance of Tall Fescue (Festuca arundinacea Schreb.): Effects of Nitrogen Fertilization and the Growing Season. Ann. Bot. 1994, 74, 653–659. [Google Scholar] [CrossRef]
  66. Brouwer, R. Distribution of dry matter in the plant. Neth. J. Agric. Sci. 1962, 10, 361–376. [Google Scholar] [CrossRef]
  67. Jílková, V.; Sim, A.; Thornton, B.; Jandová, K.; Cajthaml, T.; Paterson, E. Impact of plant species and atmospheric CO2 concentration on rhizodeposition and soil microbial activity and community composition. J. Plant Nutr. Soil Sci. 2020, 183, 327–337. [Google Scholar] [CrossRef]
  68. Kaštovská, E.; Edwards, K.; Picek, T.; Šantrůčková, H. A larger investment into exudation by competitive versus conservative plants is connected to more coupled plant–microbe N cycling. Biogeochemistry 2015, 122, 47–59. [Google Scholar] [CrossRef]
  69. Wang, Q.; Zhu, Y.; Zou, X.; Li, F.; Zhang, J.; Kang, Z.; Li, X.; Yin, C.; Lin, Y. Nitrogen Deficiency-Induced Decrease in Cytokinins Content Promotes Rice Seminal Root Growth by Promoting Root Meristem Cell Proliferation and Cell Elongation. Cells 2020, 9, 916. [Google Scholar] [CrossRef] [Green Version]
  70. Foito, A.; Byrne, S.L.; Hackett, C.A.; Hancock, R.D.; Stewart, D.; Barth, S. Short-term response in leaf metabolism of perennial ryegrass (Lolium perenne) to alterations in nitrogen supply. Metabolomics 2013, 9, 145–156. [Google Scholar] [CrossRef]
  71. Liang, Z.; Bao, A.; Li, H.; Cai, H. The effect of nitrogen level on rice growth, carbon-nitrogen metabolism and gene expression. Biologia 2015, 70, 1340–1350. [Google Scholar] [CrossRef]
  72. Cramer, M.D.; Lewis, O.A.M. The influence of NO3- and NH4+ nutrition on the carbon and nitrogen partitioning characteristics of wheat (Triticum aestivum L.) and maize (Zea mays L.) plants. Plant Soil 1993, 154, 289–300. [Google Scholar] [CrossRef]
  73. Schjoerring, J.K.; Husted, S.; Mäck, G.; Mattsson, M. The regulation of ammonium translocation in plants. J. Exp. Bot. 2002, 53, 883–890. [Google Scholar] [CrossRef] [Green Version]
  74. Wright, I.J.; Reich, P.B.; Westoby, M.; Ackerly, D.D.; Baruch, Z.; Bongers, F.; Cavender-Bares, J.; Chapin, T.; Cornellssen, J.H.C.; Diemer, M.; et al. The worldwide leaf economics spectrum. Nature 2004, 428, 821–827. [Google Scholar] [CrossRef]
  75. Withington, J.M.; Reich, P.B.; Oleksyn, J.; Eissenstat, D.M. Comparisons of structure and life span in roots and leaves among temperate trees. Ecol. Monogr. 2006, 76, 381–397. [Google Scholar] [CrossRef]
  76. German, D.P.; Chacon, S.S.; Allison, S.D. Substrate concentration and enzyme allocation can affect rates of microbial decomposition. Ecology 2011, 92, 1471–1480. [Google Scholar] [CrossRef] [PubMed]
  77. Khalid, M.; Soleman, N.; Jones, D.L. Grassland plants affect dissolved organic carbon and nitrogen dynamics in soil. Soil Biol. Biochem. 2007, 39, 378–381. [Google Scholar] [CrossRef]
  78. Kuzyakov, Y.; Biryukova, O.V.; Kuznetzova, T.V.; Molter, K.; Kandeler, E.; Stahr, K. Carbon partitioning in plant and soil, carbon dioxide fluxes and enzyme activities as affected by cutting ryegrass. Biol. Fertil. Soils 2002, 35, 348–358. [Google Scholar] [CrossRef]
  79. Tian, P.; Razavi, B.S.; Zhang, X.; Wang, Q.; Blagodatskaya, E. Microbial growth and enzyme kinetics in rhizosphere hotspots are modulated by soil organics and nutrient availability. Soil Biol. Biochem. 2020, 141, 107662. [Google Scholar] [CrossRef]
  80. Cleveland, C.C.; Liptzin, D. C:N:P stoichiometry in soil: Is there a “Redfield ratio” for the microbial biomass? Biogeochemistry 2007, 85, 235–252. [Google Scholar] [CrossRef]
  81. Fujita, K.; Miyabara, Y.; Kunito, T. Microbial biomass and ecoenzymatic stoichiometries vary in response to nutrient availability in an arable soil. Eur. J. Soil Biol. 2019, 91, 1–8. [Google Scholar] [CrossRef]
  82. Kirkby, C.A.; Kirkegaard, J.A.; Richardson, A.E.; Wade, L.J.; Blanchard, C.; Batten, G. Stable soil organic matter: A comparison of C:N:P:S ratios in Australian and other world soils. Geoderma 2011, 163, 197–208. [Google Scholar] [CrossRef]
  83. Chen, J.; Seven, J.; Zilla, T.; Dippold, M.A.; Blagodatskaya, E.; Kuzyakov, Y. Microbial C:N:P stoichiometry and turnover depend on nutrients availability in soil: A 14 C, 15 N and 33 P triple labelling study. Soil Biol. Biochem. 2019, 131, 206–216. [Google Scholar] [CrossRef]
  84. Bünemann, E.K.; Oberson, A.; Liebisch, F.; Keller, F.; Annaheim, K.E.; Huguenin-Elie, O.; Frossard, E. Rapid microbial phosphorus immobilization dominates gross phosphorus fluxes in a grassland soil with low inorganic phosphorus availability. Soil Biol. Biochem. 2012, 51, 84–95. [Google Scholar] [CrossRef]
  85. Bünemann, E.K.; Prusisz, B.; Ehlers, K. Characterization of Phosphorus Forms in Soil Microorganisms. In Phosphorus in Action; Soil Biology; Springer: Berlin/Heidelberg, Germany, 2011. [Google Scholar]
  86. Kuzyakov, Y.; Xu, X. Competition between roots and microorganisms for nitrogen: Mechanisms and ecological relevance. New Phytol. 2013, 198, 656–669. [Google Scholar] [CrossRef]
  87. Azam, F.; Ifzal, M. Microbial populations immobilizing NH4+-N and NO3--N differ in their sensitivity to sodium chloride salinity in soil. Soil Biol. Biochem. 2006, 38, 2491–2494. [Google Scholar] [CrossRef]
  88. Rice, C.W.; Tiedje, J.M. Regulation of nitrate assimilation by ammonium in soils and in isolated soil microorganisms. Soil Biol. Biochem. 1989, 21, 597–602. [Google Scholar] [CrossRef]
  89. Liu, M.; Wang, Z.; Li, S.; Lü, X.; Wang, X.; Han, X. Changes in specific leaf area of dominant plants in temperate grasslands along a 2500-km transect in northern China. Sci. Rep. 2017, 7, 10780. [Google Scholar] [CrossRef] [PubMed]
  90. Wang, J.; Zhu, B.; Zhang, J.; Müller, C.; Cai, Z. Mechanisms of soil N dynamics following long-term application of organic fertilizers to subtropical rain-fed purple soil in China. Soil Biol. Biochem. 2015, 91, 222–231. [Google Scholar] [CrossRef]
  91. Allison, S.D.; Vitousek, P.M. Responses of extracellular enzymes to simple and complex nutrient inputs. Soil Biol. Biochem. 2005, 37, 937–944. [Google Scholar] [CrossRef]
  92. Ekenler, M.; Tabatabai, M.A. β-glucosaminidase activity of soils: Effect of cropping systems and its relationship to nitrogen mineralization. Biol. Fertil. Soils 2002, 36, 367–376. [Google Scholar] [CrossRef]
  93. Jezierska-Tys, S.; Frac, M. Impact of dairy sewage sludge on enzymatic activity and inorganic nitrogen concentrations in the soils. Int. Agrophysics 2009, 23, 31–37. [Google Scholar]
  94. Michel, K.; Matzner, E. Response of enzyme activities to nitrogen addition in forest floors of different C-to-N ratios. Biol. Fertil. Soils 2003, 38, 102–109. [Google Scholar] [CrossRef]
Figure 1. Network of rhizosphere-related variables including soil characteristics, plant functional traits, and indicators of microbial growth and activity. The variables are grouped into 4 groups, which are differently coloured. The size of the circles represents the strength of the variables (number of connections). Lines represent significant correlations between variables (ǀ r ǀ > 0.3, p < 0.05). Line width is proportional to the absolute value of the correlation coefficient and the colour indicates whether they are positive, blue, or negative, red.
Land 10 00840 g001
Figure 2. Pearson correlation between plant biomass and root:shoot ratio. The complete data (64 units) had r = 0.54, p = 2.9 × 10⁻⁶. Small plants with biomass lower than 3 g (42 units) had r = −0.32, p = 0.02. Large plants with biomass exceeding 3 g (22 units) had r = 0.79, p = 2.1 × 10⁻⁵.
Land 10 00840 g002
Figure 3. Correlation between C:P ratio of exudates and microbial biomass (a) and between soil solution N:P ratio and phosphatase potential activity (b).
Land 10 00840 g003
Figure 4. Correlation of microbial N with plant N (a) and with N-NH4+ amount in soil solution (b), and of microbial C:N ratio with N-NO3 in soil solution (c) and with alanine-aminopeptidase potential activity in soil (d).
Land 10 00840 g004
Table 1. C, N, P contents and their molar ratios in plant, microbial, and soil pools calculated over all planted treatments (mean and coefficient of variance in %, n = 64).
MeanCoefficient of Variance (%)
POOLUnitCNPC:NC:PN:PCNPC:NC:PN:P
Plant biomassmg·g−1414.619.64.024.7266.510.82.131.918.330.921.929.2
Root exudatesµg·plant−1·h−1793.640.229.622.688.04.261.156.374.731.463.757.6
Spec. Exudationµg·g−1 root·h−11073.959.241.6 42.046.360.1
Soil solutionµg·g−122.02.91.19.253.46.022.026.717.930.630.924.5
Soil microbesµg·g−1200.429.677.97.96.60.820.628.442.620.640.551.4
Enzym. activitynM·g−1·h−148.516.129.53.01.70.618.215.516.716.712.911.8
Total soilmg·g−114.21.30.212.9173.413.69.47.419.06.512.213.5
Publisher’s Note: MDPI stays neutral with regard to jurisdictional claims in published maps and institutional affiliations.

