Article

The Spatial Distribution Characteristics of the Cultivated Land Quality in the Diluvial Fan Terrain of the Arid Region: A Case Study of Jimsar County, Xinjiang, China

1
Arid Region Rural Development Resarch Center, Xinjiang Agricultural University, Urumchi 830052, China
2
Xinjiang Institute of Ecology and Geography, Chinese Academy of Sciences, Urumchi 830011, China
3
College of Earth Sciences, Jilin University, Changchun 130012, China
*
Author to whom correspondence should be addressed.
Land 2021, 10(9), 896; https://doi.org/10.3390/land10090896
Submission received: 3 August 2021 / Revised: 18 August 2021 / Accepted: 20 August 2021 / Published: 25 August 2021
(This article belongs to the Special Issue Geospatial Techniques in Advancing Land-Change Science and Management)

Abstract

:
Environmental constraints are not only important aspects that affect the cultivated land quality but also necessary factors that shall be considered when evaluating the cultivated land quality scientifically. Moreover, identifying the quality condition of cultivated land accurately is the premise for guaranteeing food security. Based on the case study of diluvial fan terrain in Jimsar County, Xinjiang in the arid region of Northwest China, this study utilizes a geographic information system spatial analysis and a multifactor comprehensive evaluation method and constructs a comprehensive evaluation index system for cultivated land quality on account of three dimensions, namely soil properties, farming conditions, and natural environmental conditions. To reduce the Modifiable Areal Unit Problem (MAUP) effect and improve the accuracy of the quality evaluation results of cultivated land, this study compares the spatial interpolation methods of Inverse Distance Weighted Matrix (IDW), Ordinary Kriging (OK), and Spline Functions (Spline) based on different cultivated land evaluation units. Through the assessment on the comparison results, we finally adopted large-scale cultivated land as the quality evaluation unit of cultivated land and Ordinary Kriging (OK) as the spatial interpolation method. The results indicated that the average grade of the quality index of cultivated land in the diluvial fan terrain of Jimsar County is 6.66 at the middle or lower level; the quality of cultivated land and natural environment conditions reduce with the rise of elevation of the diluvial fan terrain, indicating a vertical zonality differentiation rule; the farming conditions keep sliding from the middle part of diluvial fan terrain to the edge of the diluvial fan terrain and the piedmont slope. The major factors affecting the quality of the cultivated land include the soil capacity, soil pH, soil organic matter, the quantity of straw returning to the field, source of irrigation water, water delivery method, part of the diluvial fan, groundwater level depth, and geomorphic type. Therefore, the measures to improve the quality of the cultivated land are put forward, mainly including improving the soil, carrying out land consolidation projects, and developing highly efficient water-saving irrigation agriculture. This study provides favorable references and directions for the sustainable utilization and quality improvement of cultivated land resources in arid regions.

1. Introduction

As a special natural resource, cultivated land is not only an important agricultural means of production but also an important material foundation for guaranteeing food security, coordinating ecological security(See Appendix A for the definition of ecological security and the role of cultivated land in coordinating ecological security), and promoting the stable and sustainable development of human society [1,2]. In the past four decades since the reform and opening of China, rapid economic development and urban expansion has led to the occupation and loss of high-yield cultivated land gradually, while the quality of newly increased cultivated land by means of land consolidation has been uneven [3,4]. Meanwhile, problems such as soil contamination, water and soil loss, land desertification, and the bottleneck of water resource utilization have decreased the quality and suitability of the cultivated land of China, particularly of the arid region in the northwest [5,6,7,8]. According to the Main Data Results of National Cultivated Land Quality Grade Updated Evaluation in 2015 issued by the Ministry of Natural Resources, the area of medium- and low-grade cultivated land nationwide is 60.08% of the total area [9], illustrating an unoptimistic situation of the cultivated land quality. Therefore, facing increasingly severe problems and situations of cultivated land the quantity, quality, and ecology [10,11,12,13], we need to strengthen the “trinity” protection of the cultivated land quantity, quality, and ecology so as to increase the capacity of cultivated land to meet food security, material supply, and ecological service. At the same time, it is particularly necessary to study the quality of cultivated land to understand the quality characteristics and its internal change rules in a scientific way.
The quality of cultivated land is affected by various factors. Previous research paid more attention to relevant factors such as soil fertility and soil health in the quality evaluation of cultivated land [14,15,16]. With social and economic development, changes have taken place in human demands, and cultivated land is being utilized in a multifunctional way, making humans gain an increasingly deeper understanding of the connotation of cultivated land quality. Sustainable utilization, ecological security, biological properties, and other factors are gradually incorporated into the evaluation index system [17]. The quality of cultivated land is comprehensively evaluated from the perspective of the utilization condition and ecological environment [18,19]. The multi-perspective and comprehensiveness trend of cultivated land quality evaluation is more obvious. Thus, it is necessary to build a comprehensive evaluation index system, including the physical and chemical properties of soil, farming conditions, natural environment, and other factors to evaluate the cultivated land quality.
The quality of cultivated land is affected by multidimensional factors, such as soil properties, the utilization condition, natural environment, ecological security, and spatial pattern [20]. According to previous research, soil properties such as soil physical, chemical, and biological characteristics and geography and climate conditions such as landforms, rainfall, and accumulated temperature are all natural factors influencing the quality of cultivated land. Farmland infrastructure construction, irrigation water conditions, farmland protection construction, and cadastral ownership are human factors influencing the quality of cultivated land [21]. By dividing the quality evaluation index system of cultivated land into various dimensions based on natural factors and human factors, we may assume that the quality of cultivated land is a synthesis composed of different dimensions of quality. Moreover, utilizing a multifactor comprehensive evaluation method and other relevant methods to measure the quality level at different dimensions can reveal the quality condition and spatial change rules in a more scientific way.
The index selection varies in terms of the research perspective. Previous research on cultivated land quality evaluations mainly focused on soil properties and utilization conditions and paid less attention to ecological security and the natural environment and failed to consider the environmental constraints systematically. Therefore, it was difficult to effectively satisfy the management demand to construct the “three-in-one” protection pattern of the quantity, quality, and ecology of cultivated land. Though some recent research includes part of the environmental constraints into cultivated land quality evaluation from the perspective of the natural environment [22], the construction of an index system is still under exploration. The cultivated land resource is a natural economic synthesis reflecting human activities composed of climate, landforms, hydrology, soil, infrastructure, utilization, and cadastral ownership [23]. However, most of the existing research utilized administrative division, such as province, municipality, and county, as the evaluation unit for the quality of cultivated land [24,25,26], which separated the natural properties of cultivated land artificially and influenced the accuracy of the evaluation results.
In the area of geographical and agricultural science, when analyzing social, economic, and resource environment data, it is frequently necessary to combine the data into specific fundamental areal units. When spatial phenomenon data based on a point is aggregated or diffused into area data, the Modifiable Areal Unit Problem will emerge [27]. When basic area units are changeable or modifiable, the differences in the statistical results caused by changes in the polymeric spatial unit are called MAUP [28,29]. Due to the MAUP effect, the spatial analysis results may change in terms of the differences of the granularity or division, influencing the accuracy of the evaluation results [30,31,32,33]. Therefore, how to reduce the MAUP effect and formulate universal and suitable processing method are tasks for further research.
The arid region in Northwest China is located in the backland of the Asian continent at middle latitude in the Northern Hemisphere. It responds sensitively to global climate change, and the oasis economic system and desert ecological system are obviously influenced by the climate and water resources [34]. Under the background of global warming, the water resource system based on ice and snow melting water in the arid region of Northwest China becomes more vulnerable. In addition, the rapid growth of water resource demand by industry and agriculture and unreasonable land and water resource exploitation activity makes the water scarcity problem become severer [35]. Meanwhile, the lack of rainfall and high dryness are classic climate characteristics of this region [36]. Xinjiang is located in the arid region of Northwest China. The more and more obvious trend of water resource scarcity and frequent outbreak of extreme climates such as drought disturbs the agricultural production activity there [37] and affects the quality of cultivated land in an oasis or piedmont diluvial fan terrain. Taking the diluvial fan terrain of Jimsar County at the northern piedmont of Tianshan Mountain in Xinjiang, the arid region of Northwest China, as the study region, this study mainly tries to: (1) consider the two environmental constraints, namely water resource and climate, in the arid region and utilize multisource data to evaluate the cultivated land quality from three dimensions, which are soil properties, farming, and natural environmental conditions; (2) describe the spatial distribution characteristics of the quality of cultivated land and soil properties, farming conditions, and natural environment conditions index grades in the diluvial fan terrain and extract the primary factors that affect the quality of cultivated land. Concretely speaking, this study is based on three dimensions: soil properties, farming, and the natural environment conditions of cultivated land and considers water resource factors such as irrigation water conditions and underground water depth and climate factors in the process of constructing a cultivated land quality evaluation index system and utilizes a multifactor comprehensive evaluation method to assess the quality of cultivated land. To reduce the MAUP effect and enhance the accuracy of the evaluation, the research compares various spatial interpolation methods at different quality evaluation units of cultivated land. In terms of the cultivated land quality influence on the factors within the entire scope of the diluvial fan terrain and the small region scope at different parts, this study puts forward the directions and measures to improve the quality of cultivated land. In addition, this study is of great significance to the sustainable utilization of cultivated land resources and ecological civilization construction in arid regions. Meanwhile, this study provides evidence for land consolidation, permanent basic farmland delineation, and land acquisition compensation standard measurements.

2. Research Region and Data

2.1. Overview of Research Region

Located at the northern piedmont of Tianshan Mountain in Xinjiang, the arid region of Northwest China, the diluvial fan terrain of Jimsar County is at the southeast edge of the Junggar Basin with an east longitude of 88°30′~89°30′ and northern latitude of 43°30′~45°30′; the altitude is between 500 and 4344.8 m. The south part of the diluvial fan terrain is high mountains covered by snow, and the north part is the Gurbantunggut Desert. The region is divided into five parts, namely the piedmont slope, upper part of the diluvial fan, middle part of the diluvial fan, lower part of the diluvial fan, and edge of the diluvial fan, which is 57% of the total area of Jimsar County (Figure 1). The region is within the scope of a continental desert climate in a temperate zone. Therefore, the region has long winters and summers and short springs and autumns, with rare rainfall and a dry climate. The average rainfall all year round in the plain and hilly area is between 120 mm and 230 mm and in mountain area is between 200 mm and 700 mm. The annual average temperature in the plain and hilly area is between 5.0 °C and 8.1 °C and, in mountain area, is 5.2 °C. The rainfall capacity increases from the plain to mountain areas with the elevation of the altitude, but the temperature is the opposite, both of which indicate an obvious vertical zonality differentiation rule. The irrigation water for the cultivated land is mainly from surface rivers and underground water. As the recharge of ice and snow melting water to rivers decreases and underground water has been overexploited in recent years, the irrigation water capacity decreased from 19,603 × 104 m3 in 2016 to 18,301 × 104 m3 in 2020, with a reduction of 1302 × 104 m3. Therefore, it is increasingly in shortage.
The total cultivated land area of the diluvial fan terrain is 59,472.99 hm2, among which, the piedmont slope is 27.62%, the upper part of the diluvial fan is 17.92%, the middle part is 38.09%, the lower part is 14.91%, and the edge is 1.46%. The soil of the cultivated land is mainly divided into seven types, which are meadow soil, moisture soil, irrigation farming soil, chernozem, chestnut soil, brown soil, and grey desert soil, respectively. The region mainly cultivates food crops such as wheat and corn and industrial crops such as cotton, potatoes, and oil plants.

2.2. Data Source and Processing

The research data mainly includes land utilization data, soil data, geographical environment data, climate data, cultivated land management conditions, and infrastructure data. The cultivated land utilization and spatial distribution data in land utilization comes from the cultivated land quality grade monitoring project of Xinjiang [38]. The physical and chemical properties of soil and the nutrient data of soil are obtained through collecting the 15~30-cm-deep ploughing soil of 150 sampling sites relatively uniformly distributed in five regions of the diluvial fan, recording their coordinate positions, and performing physical and chemical analyses in the laboratory(See Appendix B for the determination of soil sampling points and the principles and methods of point arrangement). The DEM data in the geographical environment data comes from the Resource and Environment Science and Data Center of the Chinese Academy of Sciences (https://www.resdc.cn/ (accessed on 25 May 2021)), with a resolution ratio of 90 × 90 m. The slope data is acquired by processing with the Raster surface tool set in Arcgis (Arcgis’ Version 10.2) software based on the DEM data [39]; the underground water level data comes from the monitoring data of 116 long-term fixed monitoring points in Jimsar County (Figure 1); the climate data comes from the China Meteorological Data Service Center (http://www.data.cma.cn/ (accessed on 25 May 2021)) and selects average rainfall capacity all year round and accumulated temperatures ≥10 °C, among which, the average rainfall capacity all year round is identified by calculating the average value of the annual average rainfall capacity between 2000 and 2018; the management condition and irrigation water condition data come from interviews with the government sectors and farmers in Jimsar County and filed surveys.

3. Research Methods

3.1. The Construction of an Index System and Identification of Weights

The quality of cultivated land is determined by the combined actions of natural, social, and economic factors [40]. According to the previous research, soil properties such as soil texture, salinization, soil organic matter, and the relevant cultivated land soil basic conditions are major factors influencing the fertility of a cultivated land [41] and the foundation for the high yield and high efficiency of cultivated land and important aspects of the quality evaluation [42,43]. The soil property dimensions in this research mainly include the physical and chemical properties and nutrient status of the soil.
The Regulation for Gradation on Agriculture Land Quality, Rules for Grading of Agricultural Land and Cultivated Land Quality Grade use the natural, social, economic, and locational factors as the three dimensions to evaluate the quality of the cultivated land [44,45,46,47,48]. The cultivated land quality evaluation index system is constructed by the aspects of landform patterns, soil conditions, the water resource status, the infrastructure conditions, cultivation convenience, land utilization status, traffic conditions, locational conditions, and climate factors. The farming condition dimensions and natural environment condition dimensions in this study mainly include the natural factors and social and economic factors related to the cultivated land quality. The farming condition dimensions are constructed with the management conditions and irrigation water conditions as the first-grade indexes. The natural environment condition dimensions are constructed with the geographical conditions and climate conditions as the first-grade indexes.
The water resource and climate are important environmental factors that restrict the sustainable development of agriculture in arid regions [49,50], exerting inevitable and considerable influence on the quality of the cultivated land in arid regions. To indicate the influence of environmental constraints on the cultivated land quality and enhance the synthesis of the cultivated land quality evaluation, this study established the irrigation water conditions as the first-grade index under the dimension of the farming conditions and established the climate conditions as the first-grade index and the underground water depth as the second-grade index under the dimension of the natural environment conditions.
In conclusion, this study assumes that the soil properties, farming conditions, and natural environment conditions determined the quality of the cultivated land jointly based on the research of relevant scholars and the regulations such as the Regulation for Gradation on Agriculture Land Quality. In combination with the important environmental constraints on the quality of cultivated land in the diluvial fan terrain of the arid region, the research constructs the evaluation index system, which is divided into 3 dimensions, 6 first-grade indexes, and 34 s-grade indexes. The scores and weights of the indexes at each level are calculated by the Delphi method and analytic hierarchy process. The detailed method is as follows: (1) Each dimension index is scored by the Delphi method. Twelve experts from the Natural Resources Department of Xinjiang, Xinjiang Agricultural University and Xinjiang Institute of Ecology and Geography Chinese Academy of Sciences scored each dimension index. All experts are authoritative scholars of the research area involved in this paper and have rich experiences. (2) The experts will assess the importance of each dimension index. Then, the Analytic Hierarchy process will be used to determine the weight of each index. (Table 1) [51,52]. As for determination of the scores of the indexes at each level, please see Table S1 in the Supplementary Materials.

3.2. Computation of Cultivated Land Quality Index

(1)
Standardization processing of the evaluation index
To facilitate the comparison and weighting of the evaluation indexes of different units and magnitudes, it is necessary to make standardization processing for each evaluation index. This study utilizes the extremum method to make standardization processing for the original data of the evaluation index. The computational formula is indicated as:
x i = x i min x i max x i min x i
In the formula, xi refers to the standardized value of the evaluation index, minxi indicates the minimum value of the evaluation index, and maxxi represents the maximum value of the evaluation index.
(2)
Computation of the soil properties index, farming conditions index, and natural environment conditions index
The soil properties index, farming conditions index, and natural environment conditions index are identified by the weighted sum of the affiliated and standardized second-grade evaluation index. The computational formula is indicated as:
S = i = 1 n P i × w p i
C = i = 1 n F i × w f i
N = i = 1 n G i × w g i
In the formula, S, C, and N represent the soil properties index, farming conditions index, and natural environment conditions index, respectively; Pi, Fi, and Gi respectively represent the standardized treatment values of the ith secondary index belonging to the three dimensions of the soil characteristics, farming conditions, and natural environment conditions; wpi, wfi, and wgi refer to the weighted values of the ith second-grade index affiliated with the soil properties, farming conditions, and natural environment conditions.
(3)
Computation of the cultivated land quality
The cultivated land quality index is computed in terms of the soil properties, farming conditions, and natural environment conditions of the cultivated land and identified by multiplying the three dimensions values in the evaluation index system. The computation formula is indicated as:
I = S × C × N
In the formula, I refers to the cultivated land quality index, and S, C, and N indicate the soil properties index, farming conditions index, and natural environment conditions index, correspondingly.

3.3. Cultivated Land Quality Index Grading

The cultivated land quality index, soil properties index, farming conditions index, and natural environment conditions index are determined in terms of the computation of the sampling points data within the research scope, utilizing the natural discontinuity point grading method in Arcgis software to divide the grade. For the detailed cultivated land quality index grades and the identification of the three dimensions index grades, see Table S2 in the Supplementary Materials.

3.4. Establishment of Research Program

When implementing a spatial analysis, it is necessary to aggregate data to specific areal units in terms of the actual situation. Owing to the multiparticle and multiscale properties of spatial data, the relationship between attribute data changes as the research scale and division method change, which may lead to the Modifiable Areal Unit Problem (MAUP) effect [53,54]. The MAUP effect includes the scale effect and division effect. When implementing a spatial analysis on certain geographic areas with different resolutions or scales, deviations may happen frequently, and the generation of deviations is the scale effect; when implementing a spatial analysis on certain geographical areas with different division methods, deviations may happen as well, which is called the division effect [55]. Considering that the MAUP effect may exert a certain amount of influence on the accuracy of the analysis results during the geospatial analysis, it is necessary to decrease the MAUP effect to enhance the accuracy of the results when analyzing the cultivated land quality and its spatial distribution characteristics.
To increase the accuracy of the cultivated land quality comprehensive evaluation and spatial distribution characteristics analysis, the research reduces the MAUP effect by division adjustment and optimization. The detailed procedures of cultivated land quality comprehensive evaluation are indicated below:
(1)
Data processing. Select cultivated land patterns in the Xinjiang cultivated land quality grade monitoring project for vectorization and the formulate soil, geographical environment, climate, cultivated land management conditions, and infrastructure database.
(2)
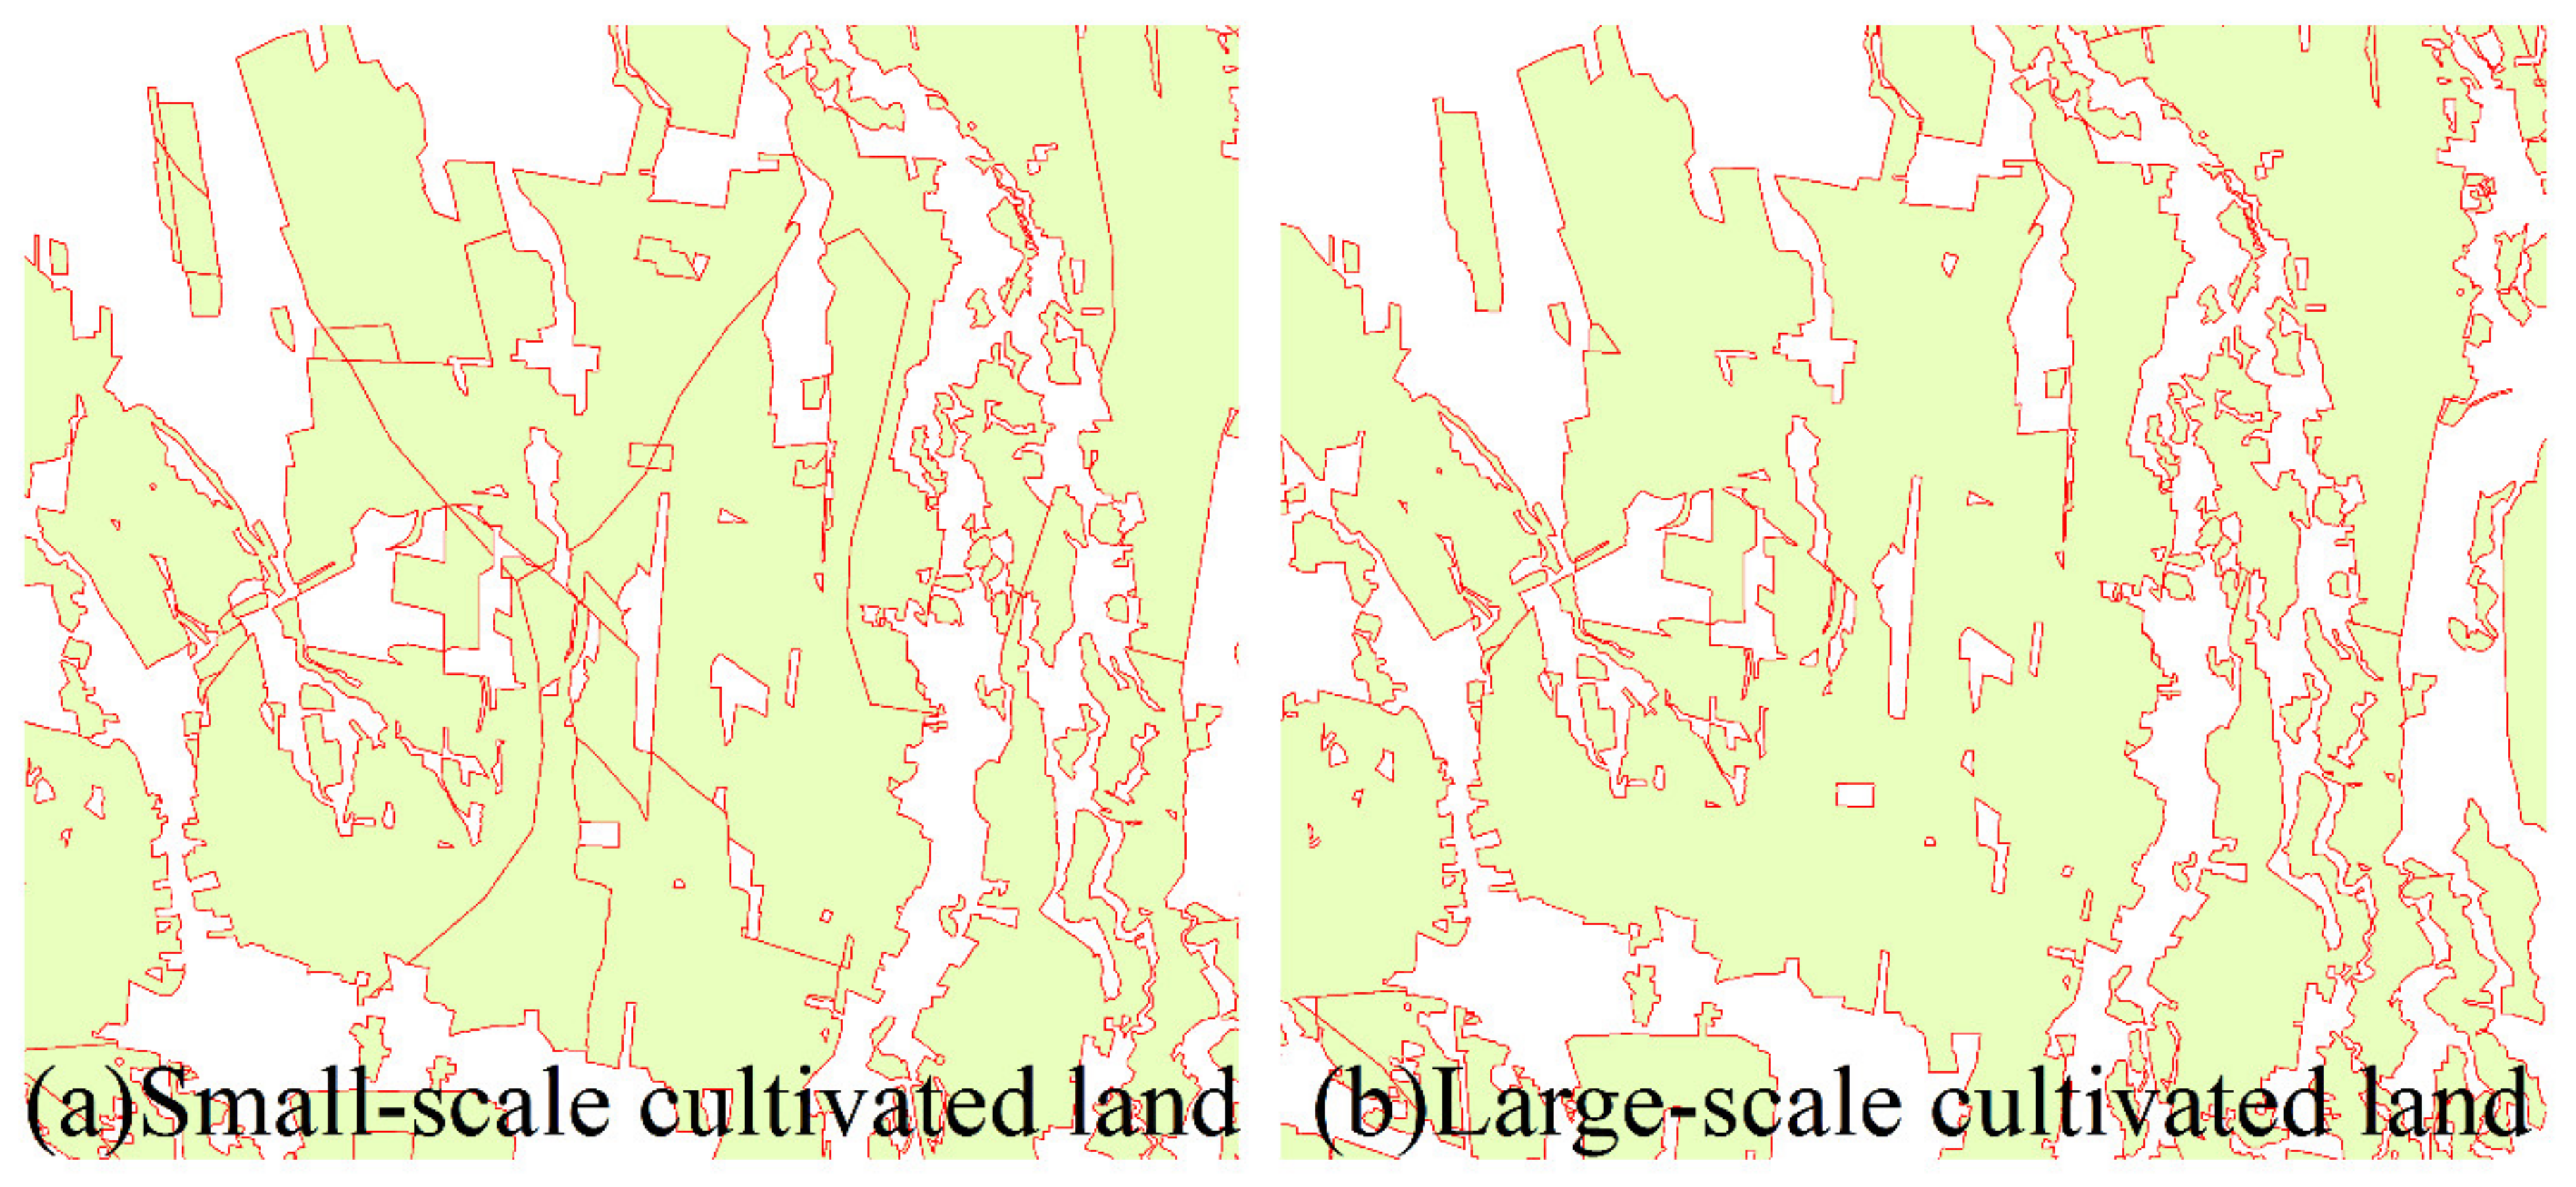
Adjust land division. Aggregate the cultivated land in terms of the principles of adjacency, administrative division, landform part, and similar slope. Unaggregated cultivated land is small-scale land (Figure 2).
(3)
The small-scale and large-scale cultivated land evaluation units acquire the evaluation index properties of the soil, geographical environment, climate, cultivated land management conditions, and infrastructure database and formulate two final evaluation units.
(4)
Based on the small-scale cultivated land evaluation unit and large-scale cultivated land evaluation unit, establish two groups of spatial interpolation programs and evaluate the cultivated land quality correspondingly as follows:
Program I: Based on the small-scale cultivated land evaluate unit, utilize the Inverse Distance Weighted Matrix (IDW), Ordinary Kriging (OK), and Spline Functions (Spline) interpolation methods to evaluate the cultivated land quality.
Program II: Based on the large-scale cultivated land evaluation unit, utilize the Inverse Distance Weighted Matrix (IDW), Ordinary Kriging (OK), and Spline Functions (Spline) interpolation methods to evaluate the cultivated land quality.
The two groups of programs generate six groups of results, which are verified. Select the optimal evaluation unit scale of the spatial interpolation method for the research region so as to enhance the accuracy of the cultivated land quality comprehensive evaluation and its spatial distribution characteristics analysis.
(5)
When the special interpolation method and evaluation unit scale are identified, utilize ArcGIS to compute the indexes of all the dimensions and cultivated land quality within the scope of the research region, complete the index grading, and formulate the cultivated land quality comprehensive evaluation results.

3.5. Validation of the Spatial Interpolation Method and Evaluation Accuracy

A cross-validation method is utilized in this research to verify different spatial interpolation methods and the evaluation accuracy. The cross-validation method can compare the interpolation results of different preferences in a single or different methods, and all data can be used for the prediction [56]. In detail, the sampling points data is divided into a spatial interpolation group and validation group. The data about sampling points of the spatial interpolation group is utilized to predict the data about sampling points of the validation group. The accuracy of the spatial interpolation results can be analyzed by comparing the predicted value of the sampling points data of the validation group with the actual value [57]. The research divided the 150 sampling points within the scope of the research region into the spatial interpolation group (including 137 sampling points) and validation group (including 13 sampling points).
The prediction accuracy evaluation indexes mainly include the Mean Error (ME), Mean Absolute Error (MAE), Root Mean Square Error (RMSE), and Average Kriging Standard Error (AKSE). This research used the Mean Error (ME) and Root Mean Square Error (RMSE) to evaluate the spatial interpolation error. The detailed formulas are indicated below:
M E = 1 N N = 1 N m i m i
R M S E = 1 N i = 1 N m i m i 2
In the formula, N refers to the number of validation points, mi indicates the measured value of the validation points, and mi represents the predicted value of the validation points. The closer the ME value is to 0, the closer the method will be to error-free. The smaller the RMSE value is, the more accurate the spatial interpolation method will be.
IP is the index of imprecision, which is utilized to measure the prediction quality. The smaller the IP value is, the better the spatial interpolation will be. The detailed formula is indicated below:
I P 2 = R M S E 2 M E 2

3.6. Determination of the Spatial Interpolation Group and Validation Group

The research divides 150 sampling points into a spatial interpolation group and validation group, among which, the spatial interpolation group includes 137 sampling points and the validation group includes 13 sampling points for the purpose of cross-validation. The distribution of the sampling points of the spatial interpolation group and validation group is indicated in Figure S1 in the Supplementary Materials.
The independent samples t-test was conducted for the 13 sampling points in the validation group and the 137 sampling points in the spatial interpolation group to verify their interrelation. According to the inspection results, the 13 sampling points in the validation group had no significant correlativity with the 137 sampling points in the spatial interpolation group (p > 0.05), indicating that the 13 sampling points in the validation group are representative.

4. Results Analyses

4.1. Evaluation of the Unit Scale and Spatial Interpolation Method Selection

According to the cross-validation results, the error values of the validation indexes of large-scale cultivated land are overall smaller than those of the small-scale cultivated land (Table 2 and Figure 3). Therefore, this research selected the large-scale cultivated land as the quality evaluation unit, which means the measurements of the cultivated land quality index, soil properties, farming conditions, and natural environment conditions index were based on the large-scale cultivated land evaluation unit. Comparing the error values of the spatial interpolation method validation indexes of the cultivated land quality, soil properties, farming conditions, and natural environment conditions indexes with large-scale cultivated land as the evaluation unit, it can be concluded that the overall error value of Ordinary Kriging (OK) was lower than that of the Inverse Distance Weight matrix method (IDW) and Spline Functions (Spline). Thus, this research selected the Ordinary Kriging (OK) method for spatial interpolation (Table 3 and Figure 3d).

4.2. Characteristics of the Cultivated Land Quality Grades in the Diluvial Fan Terrain and Spatial Distribution

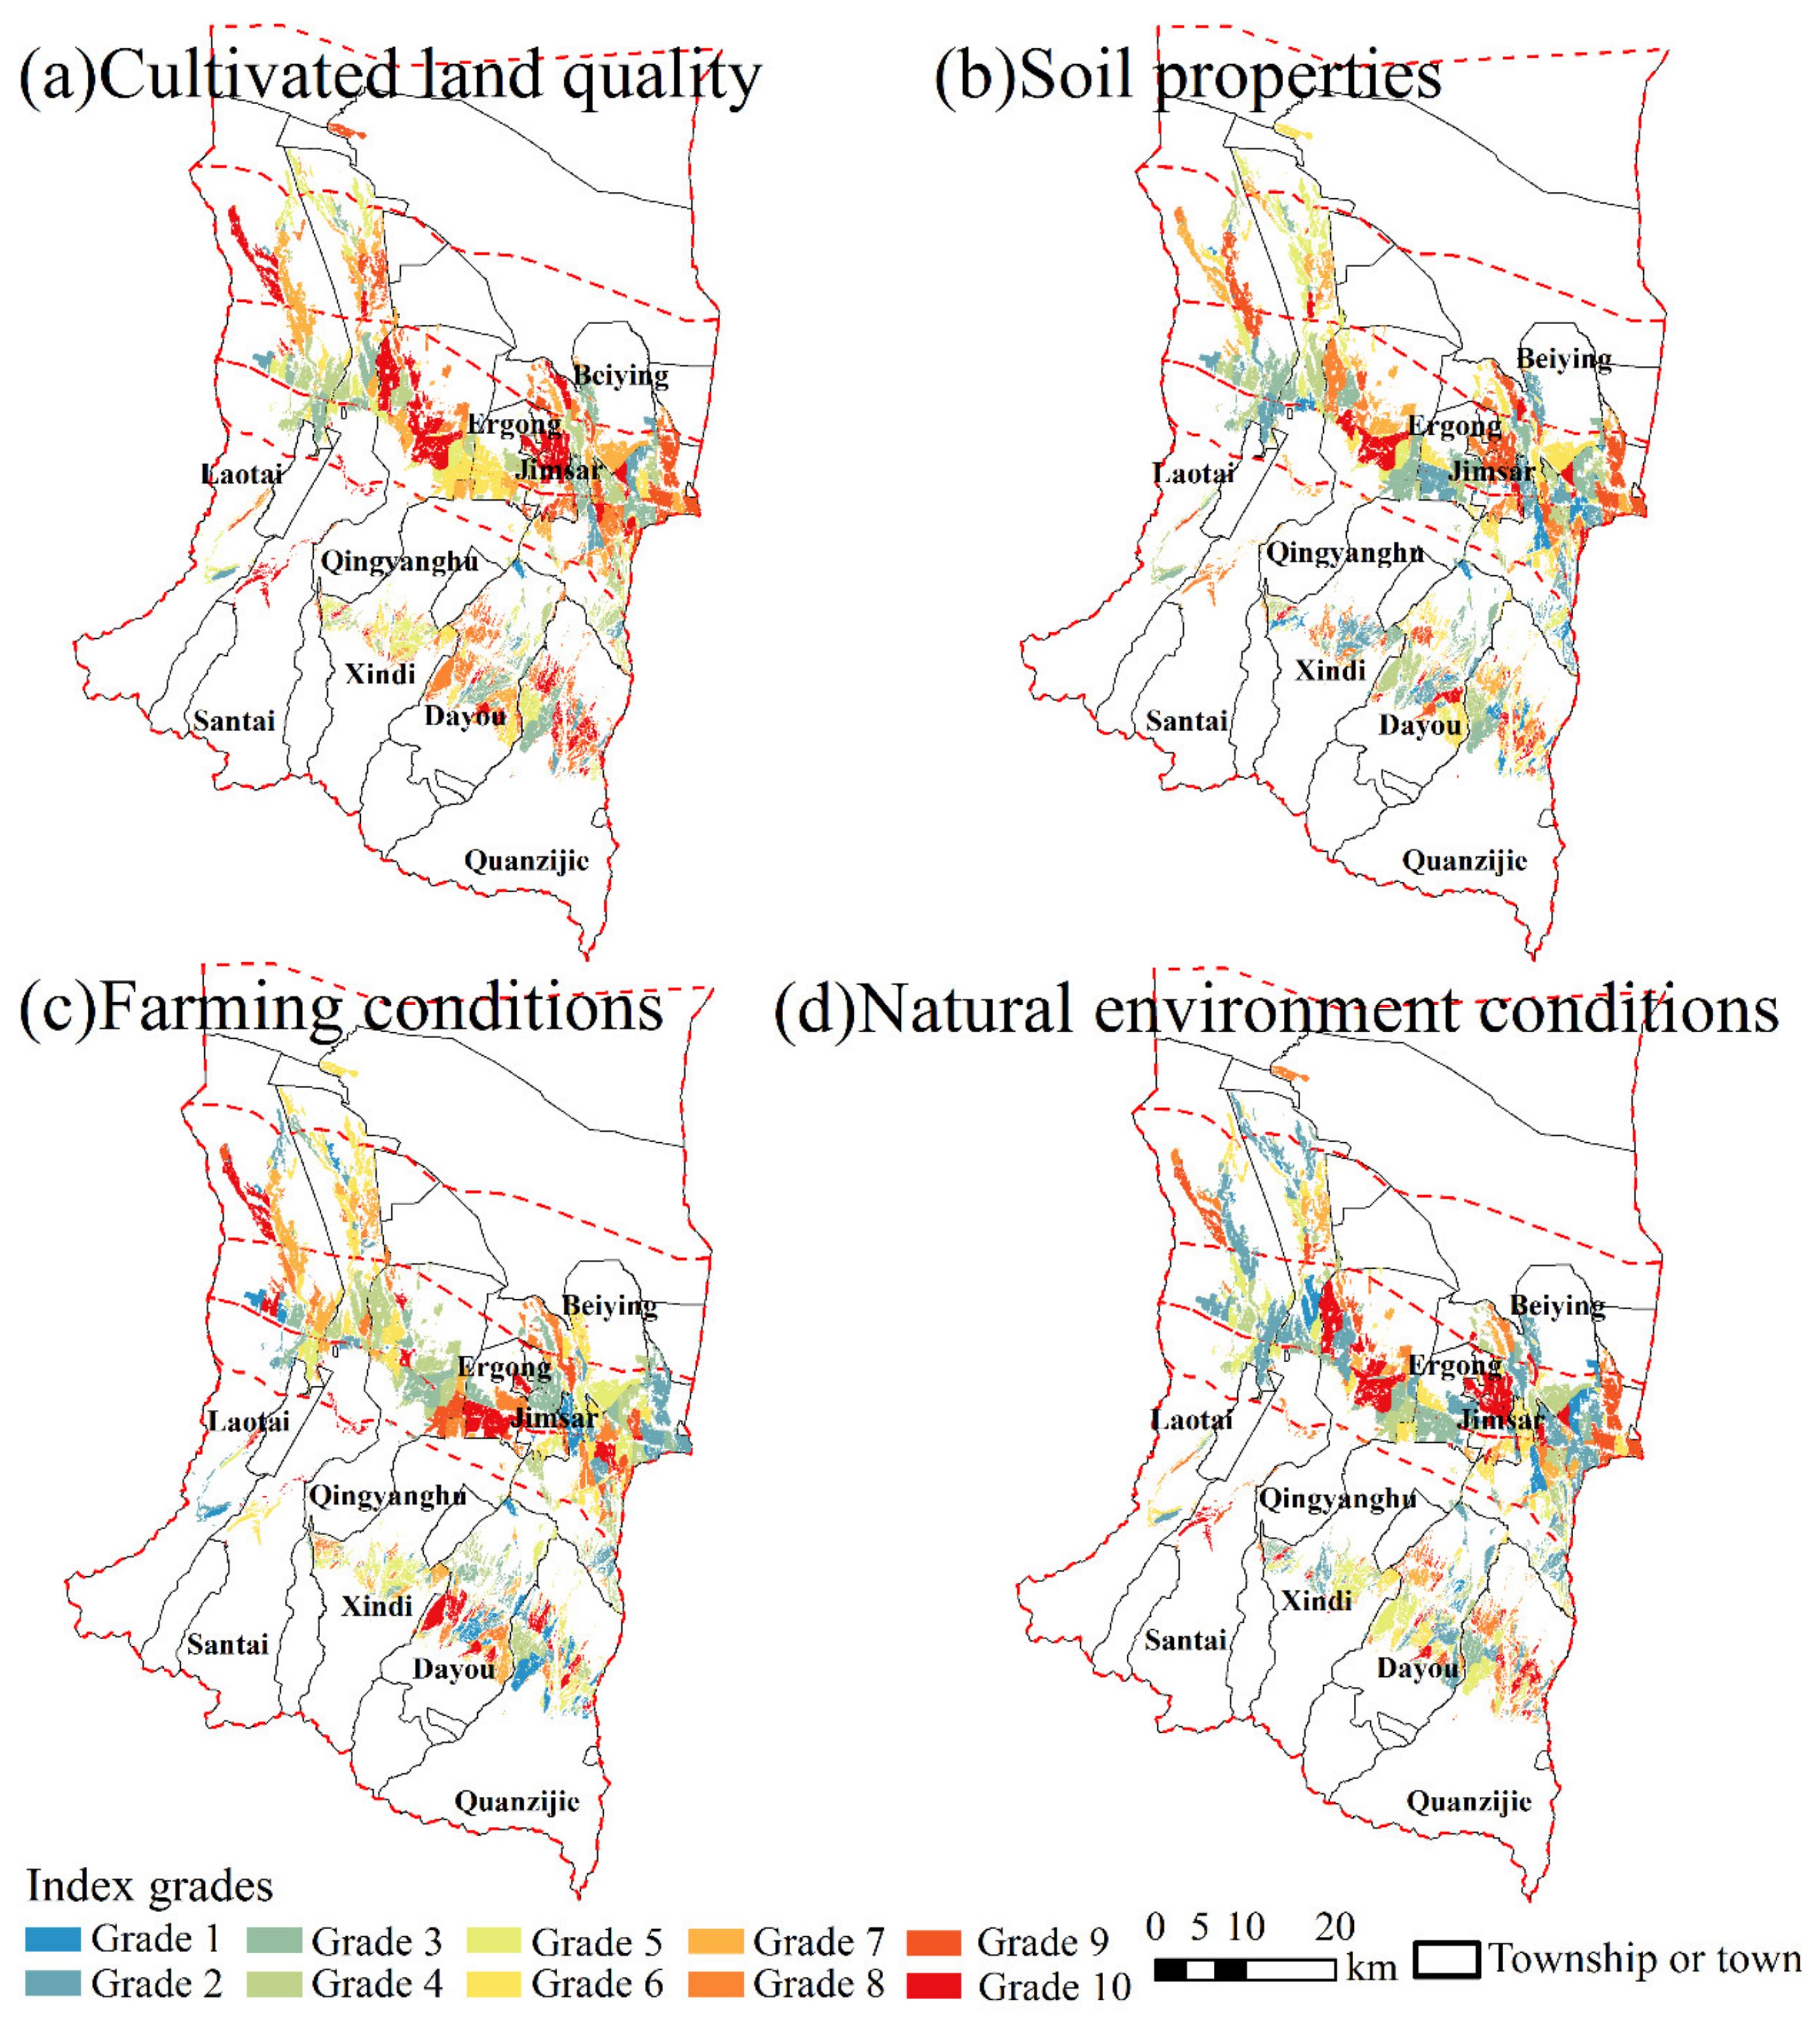
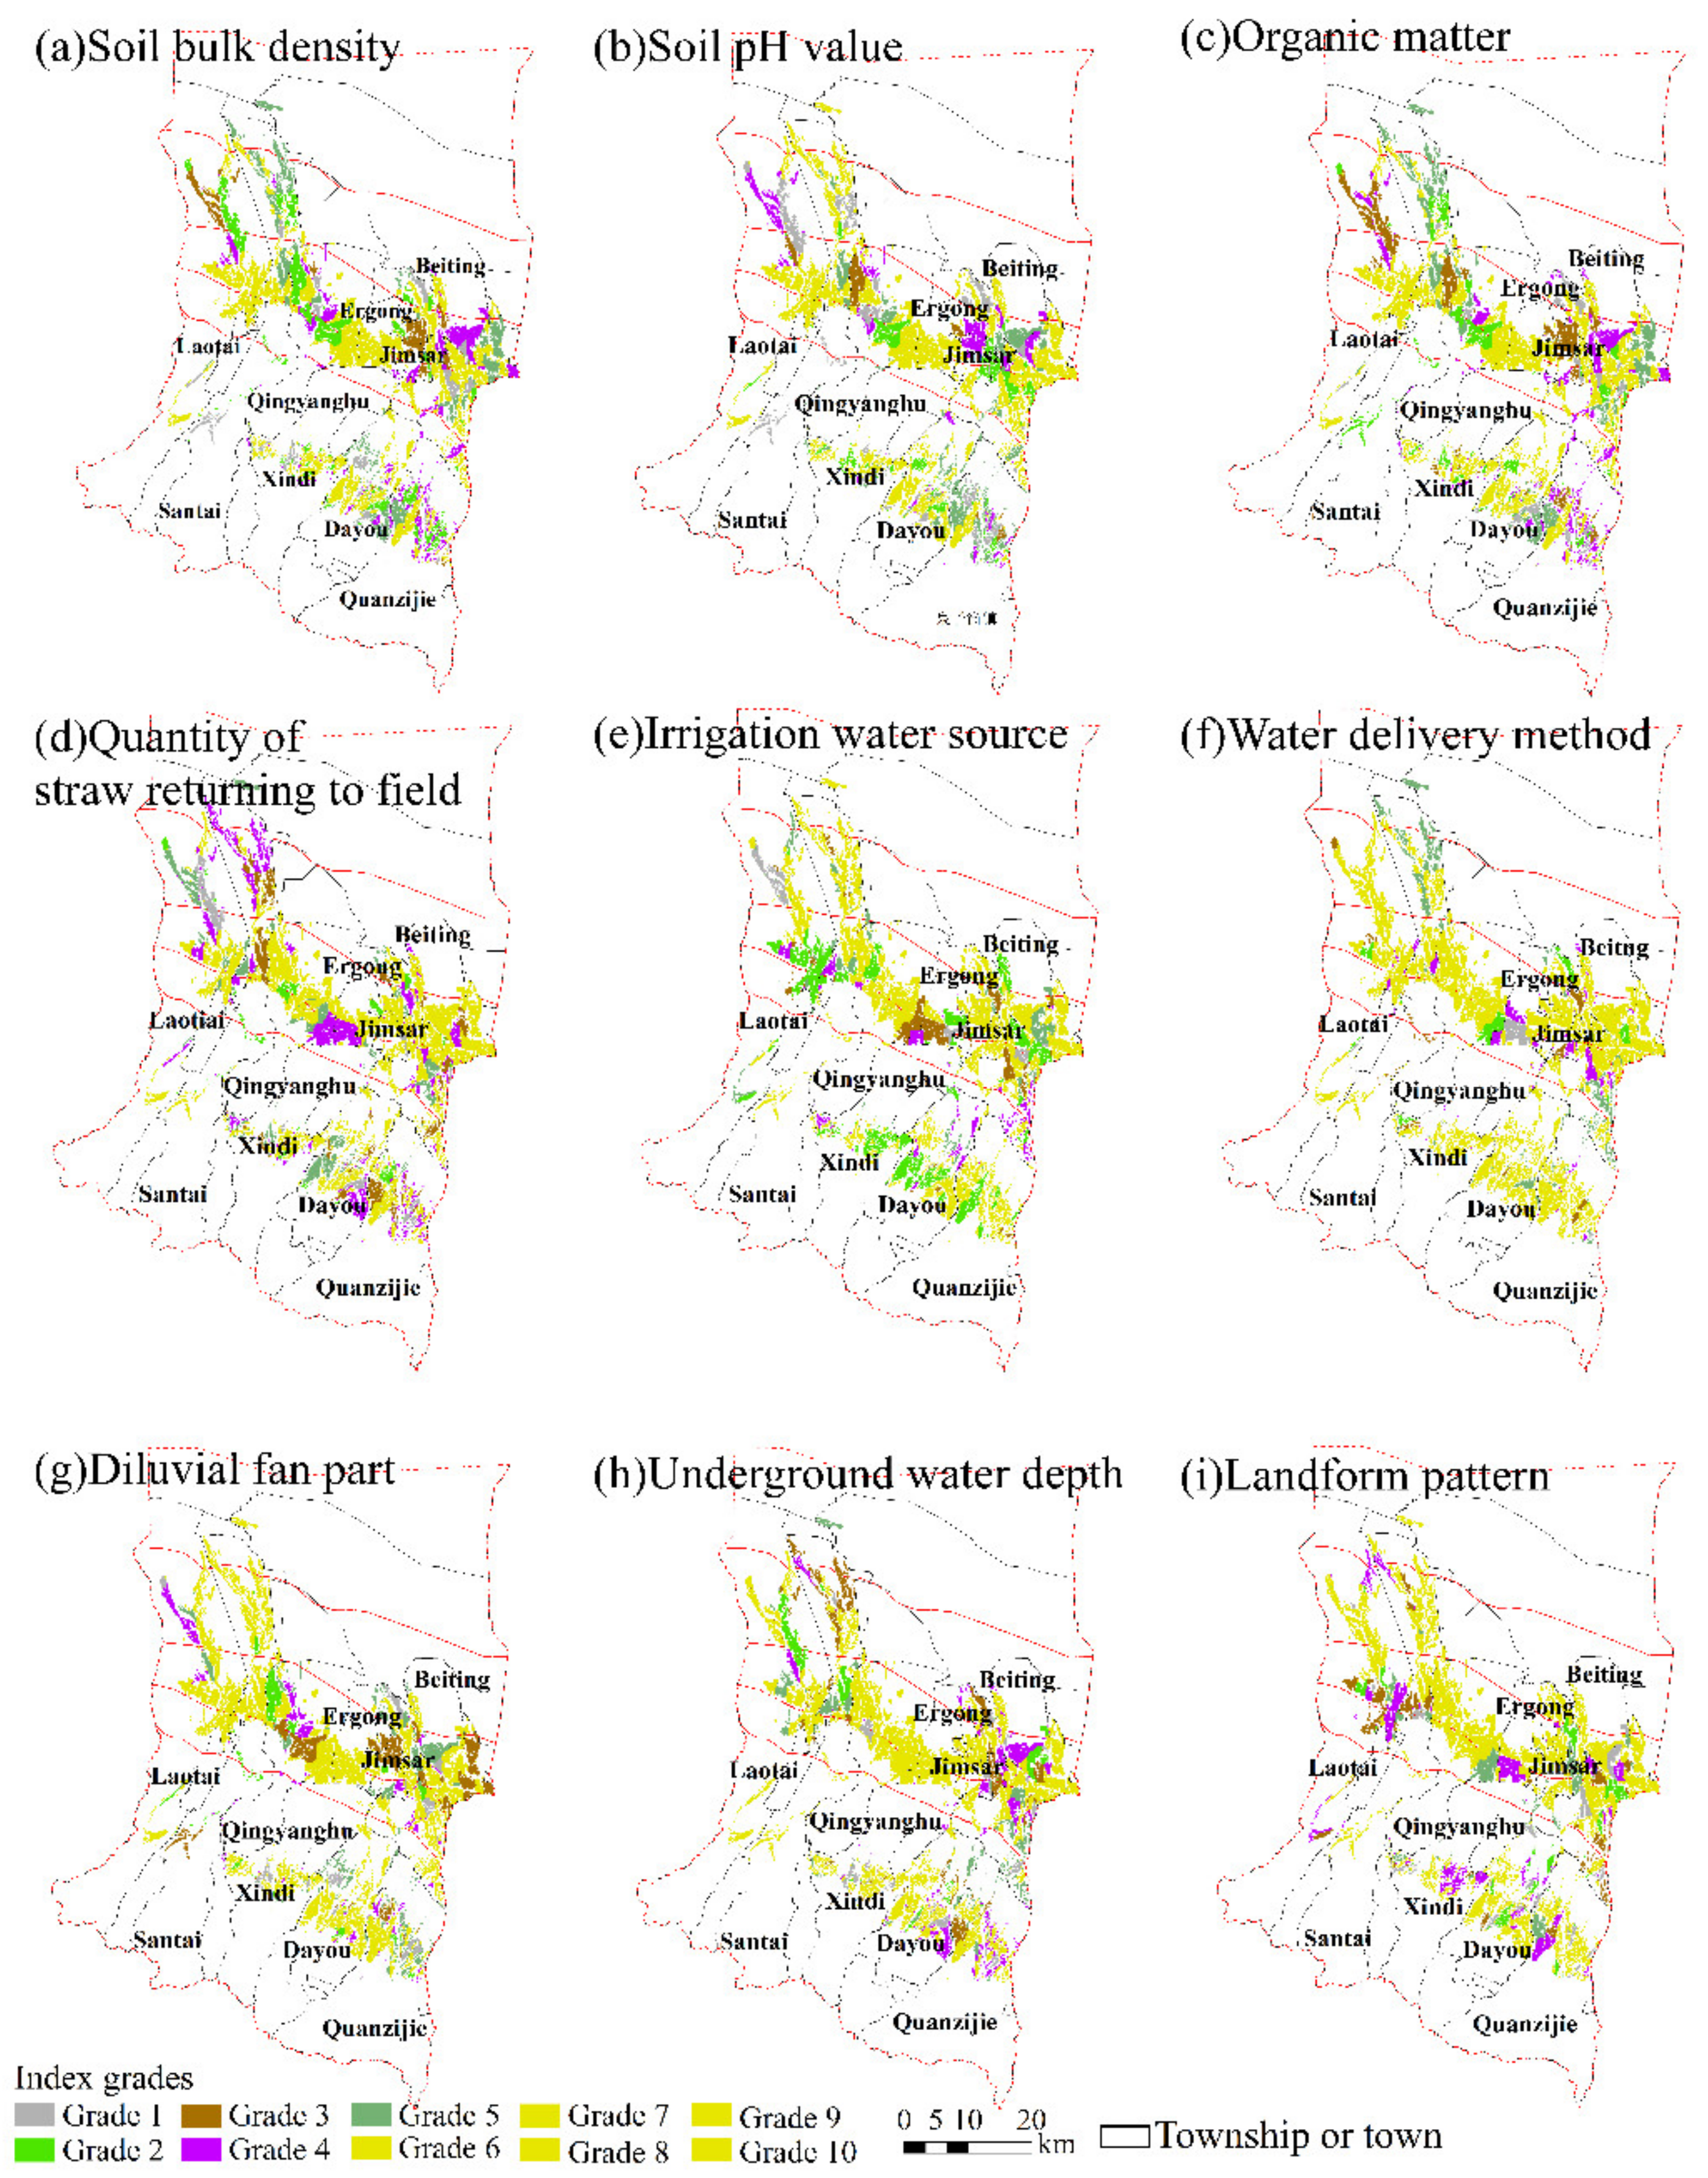
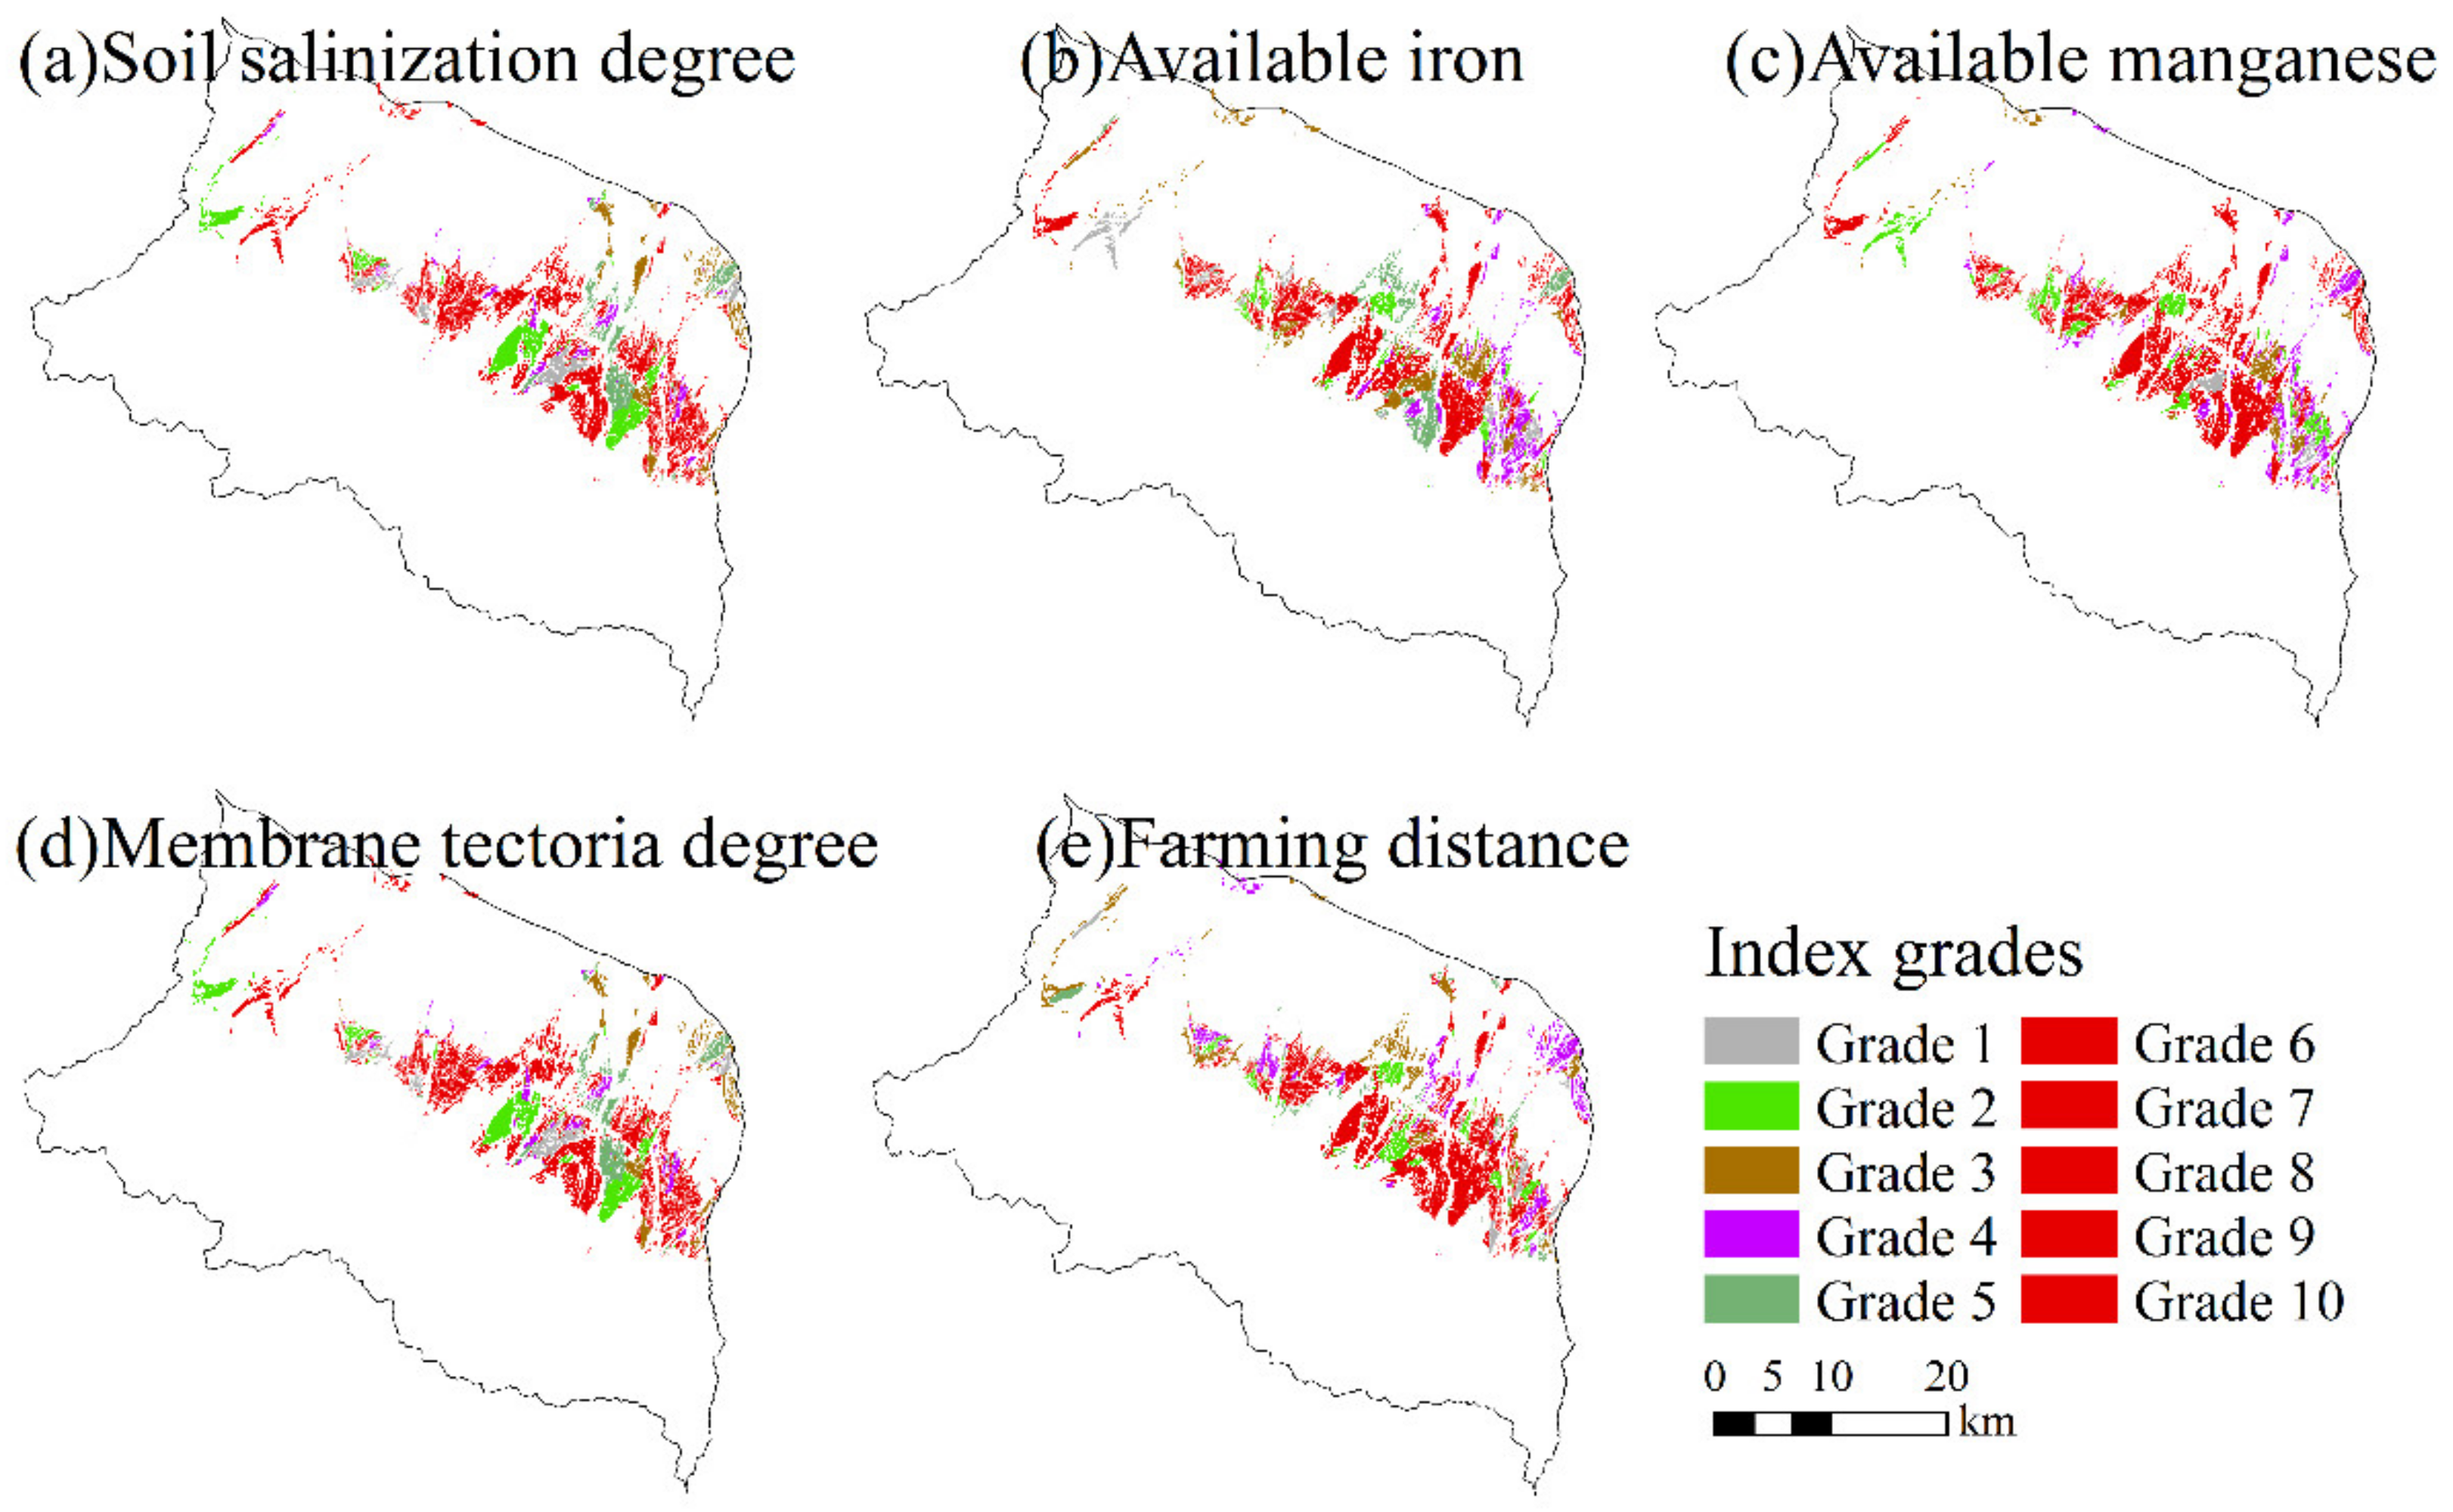
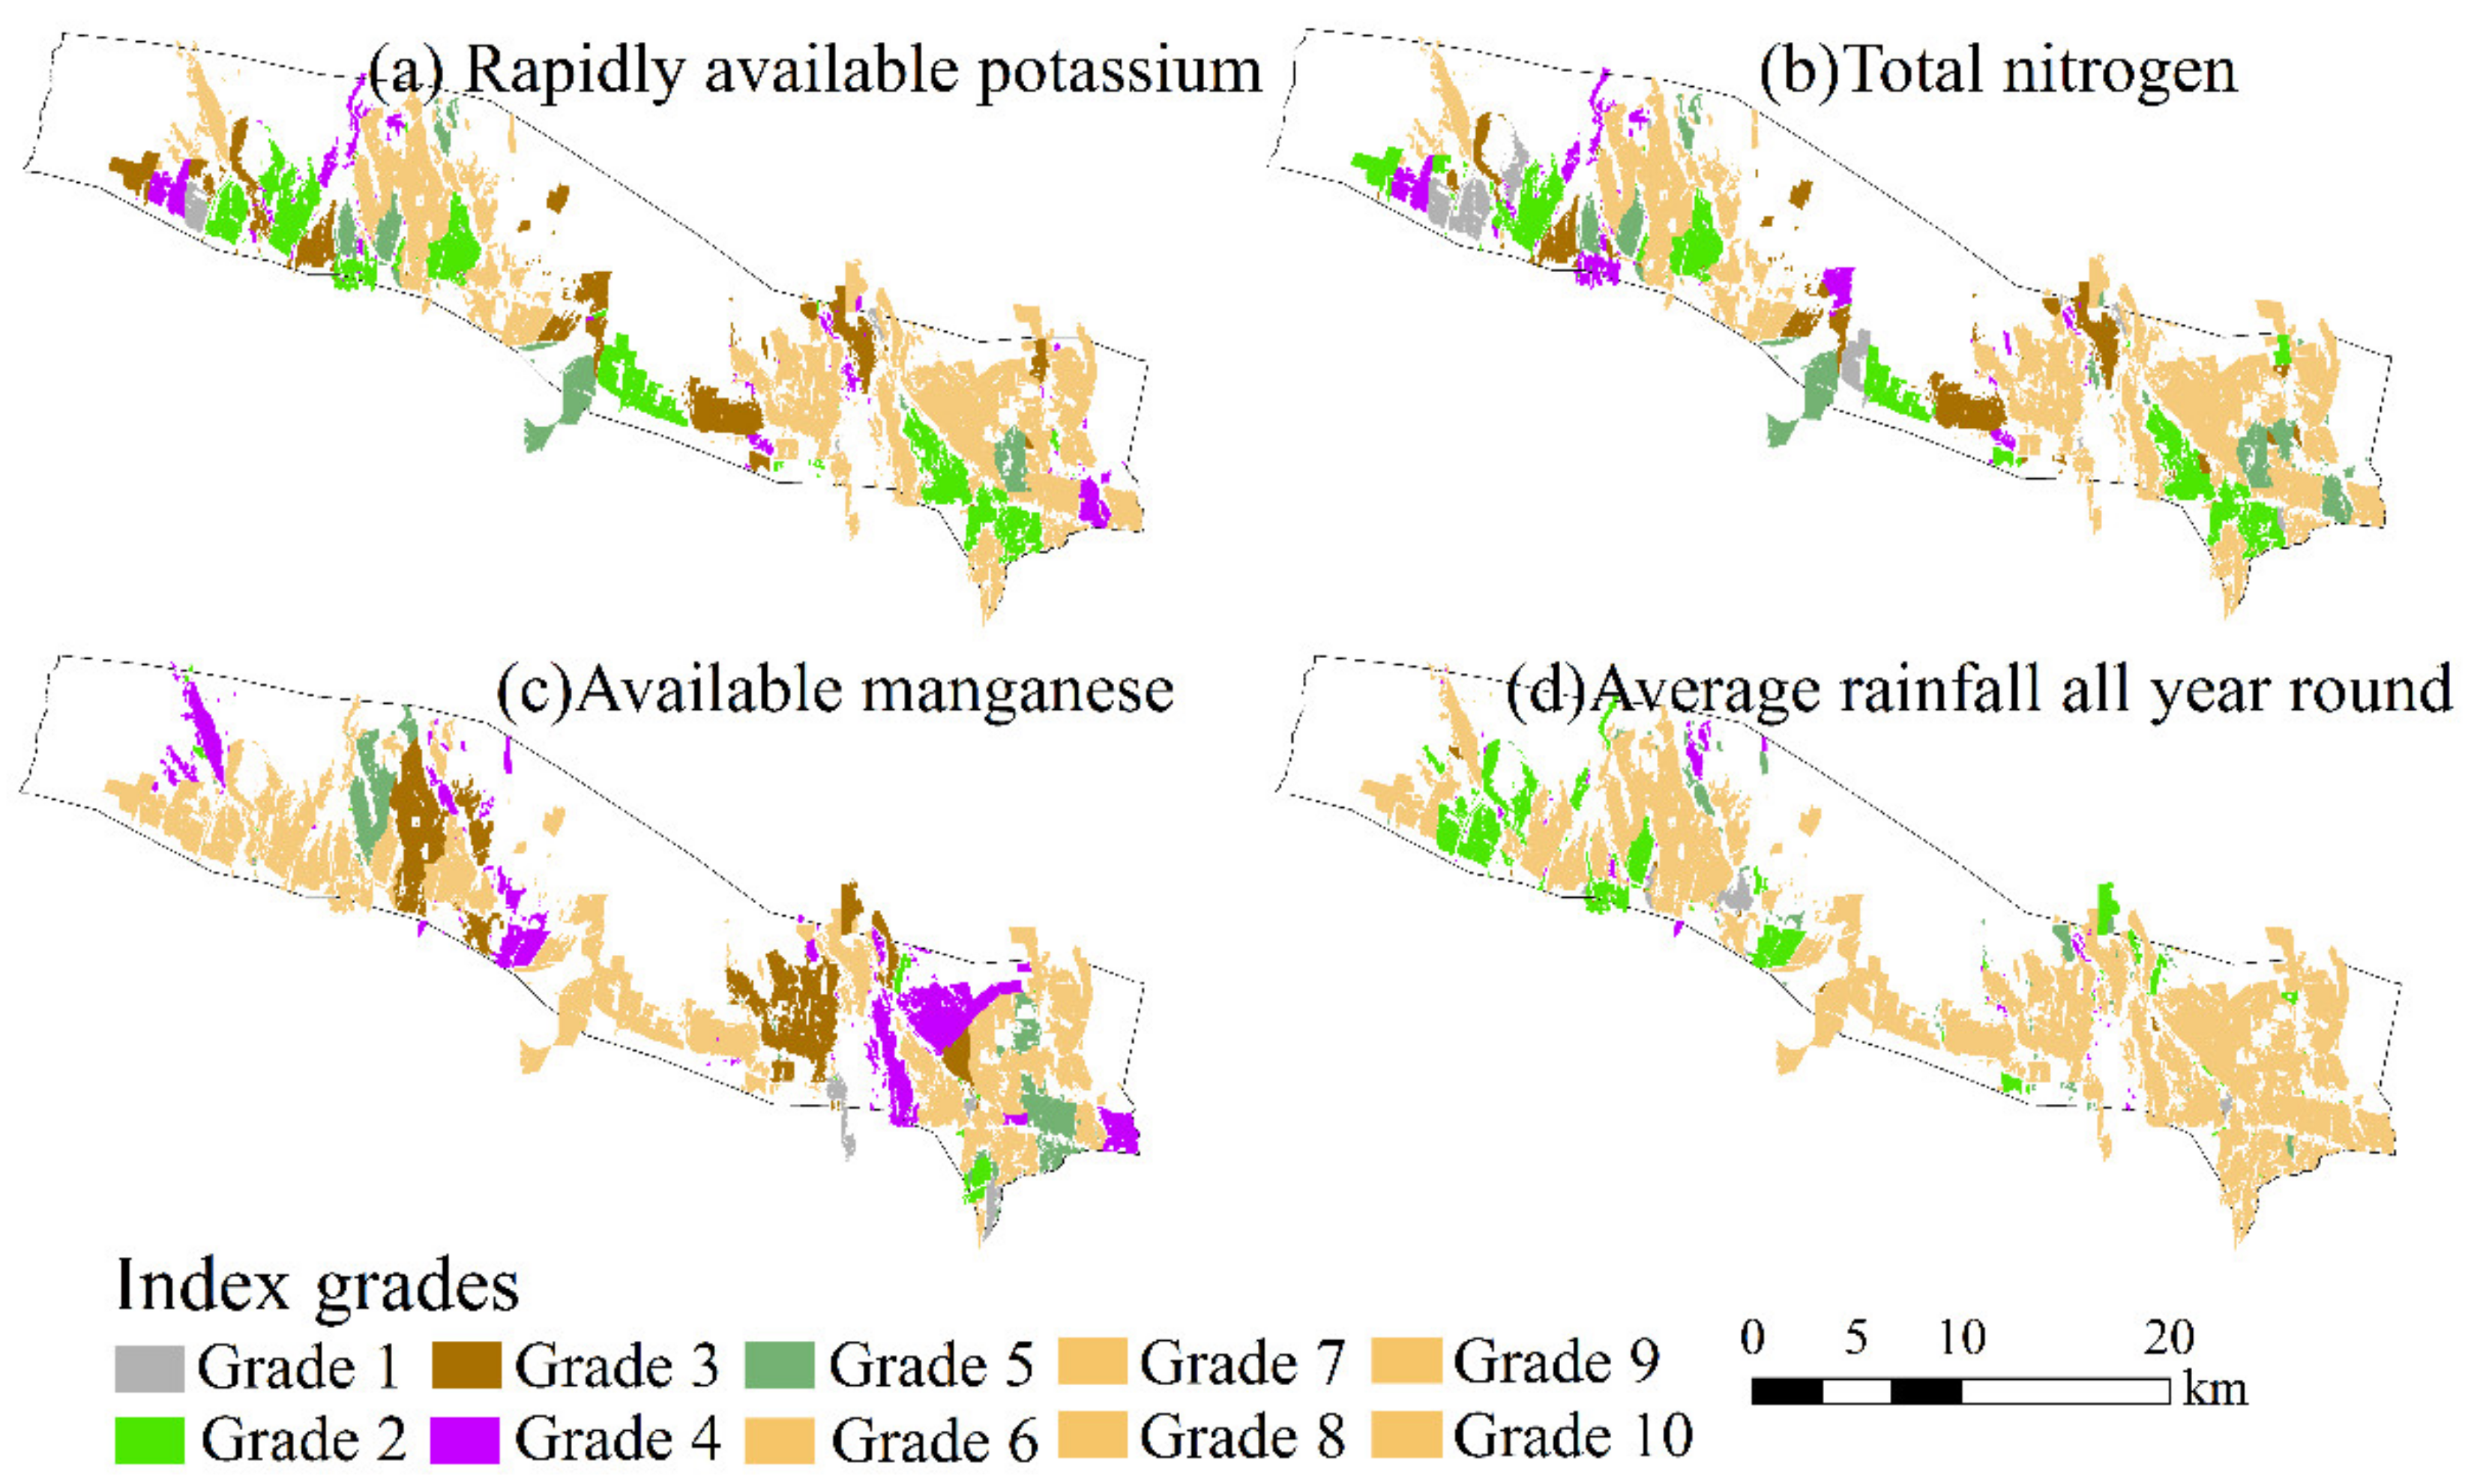
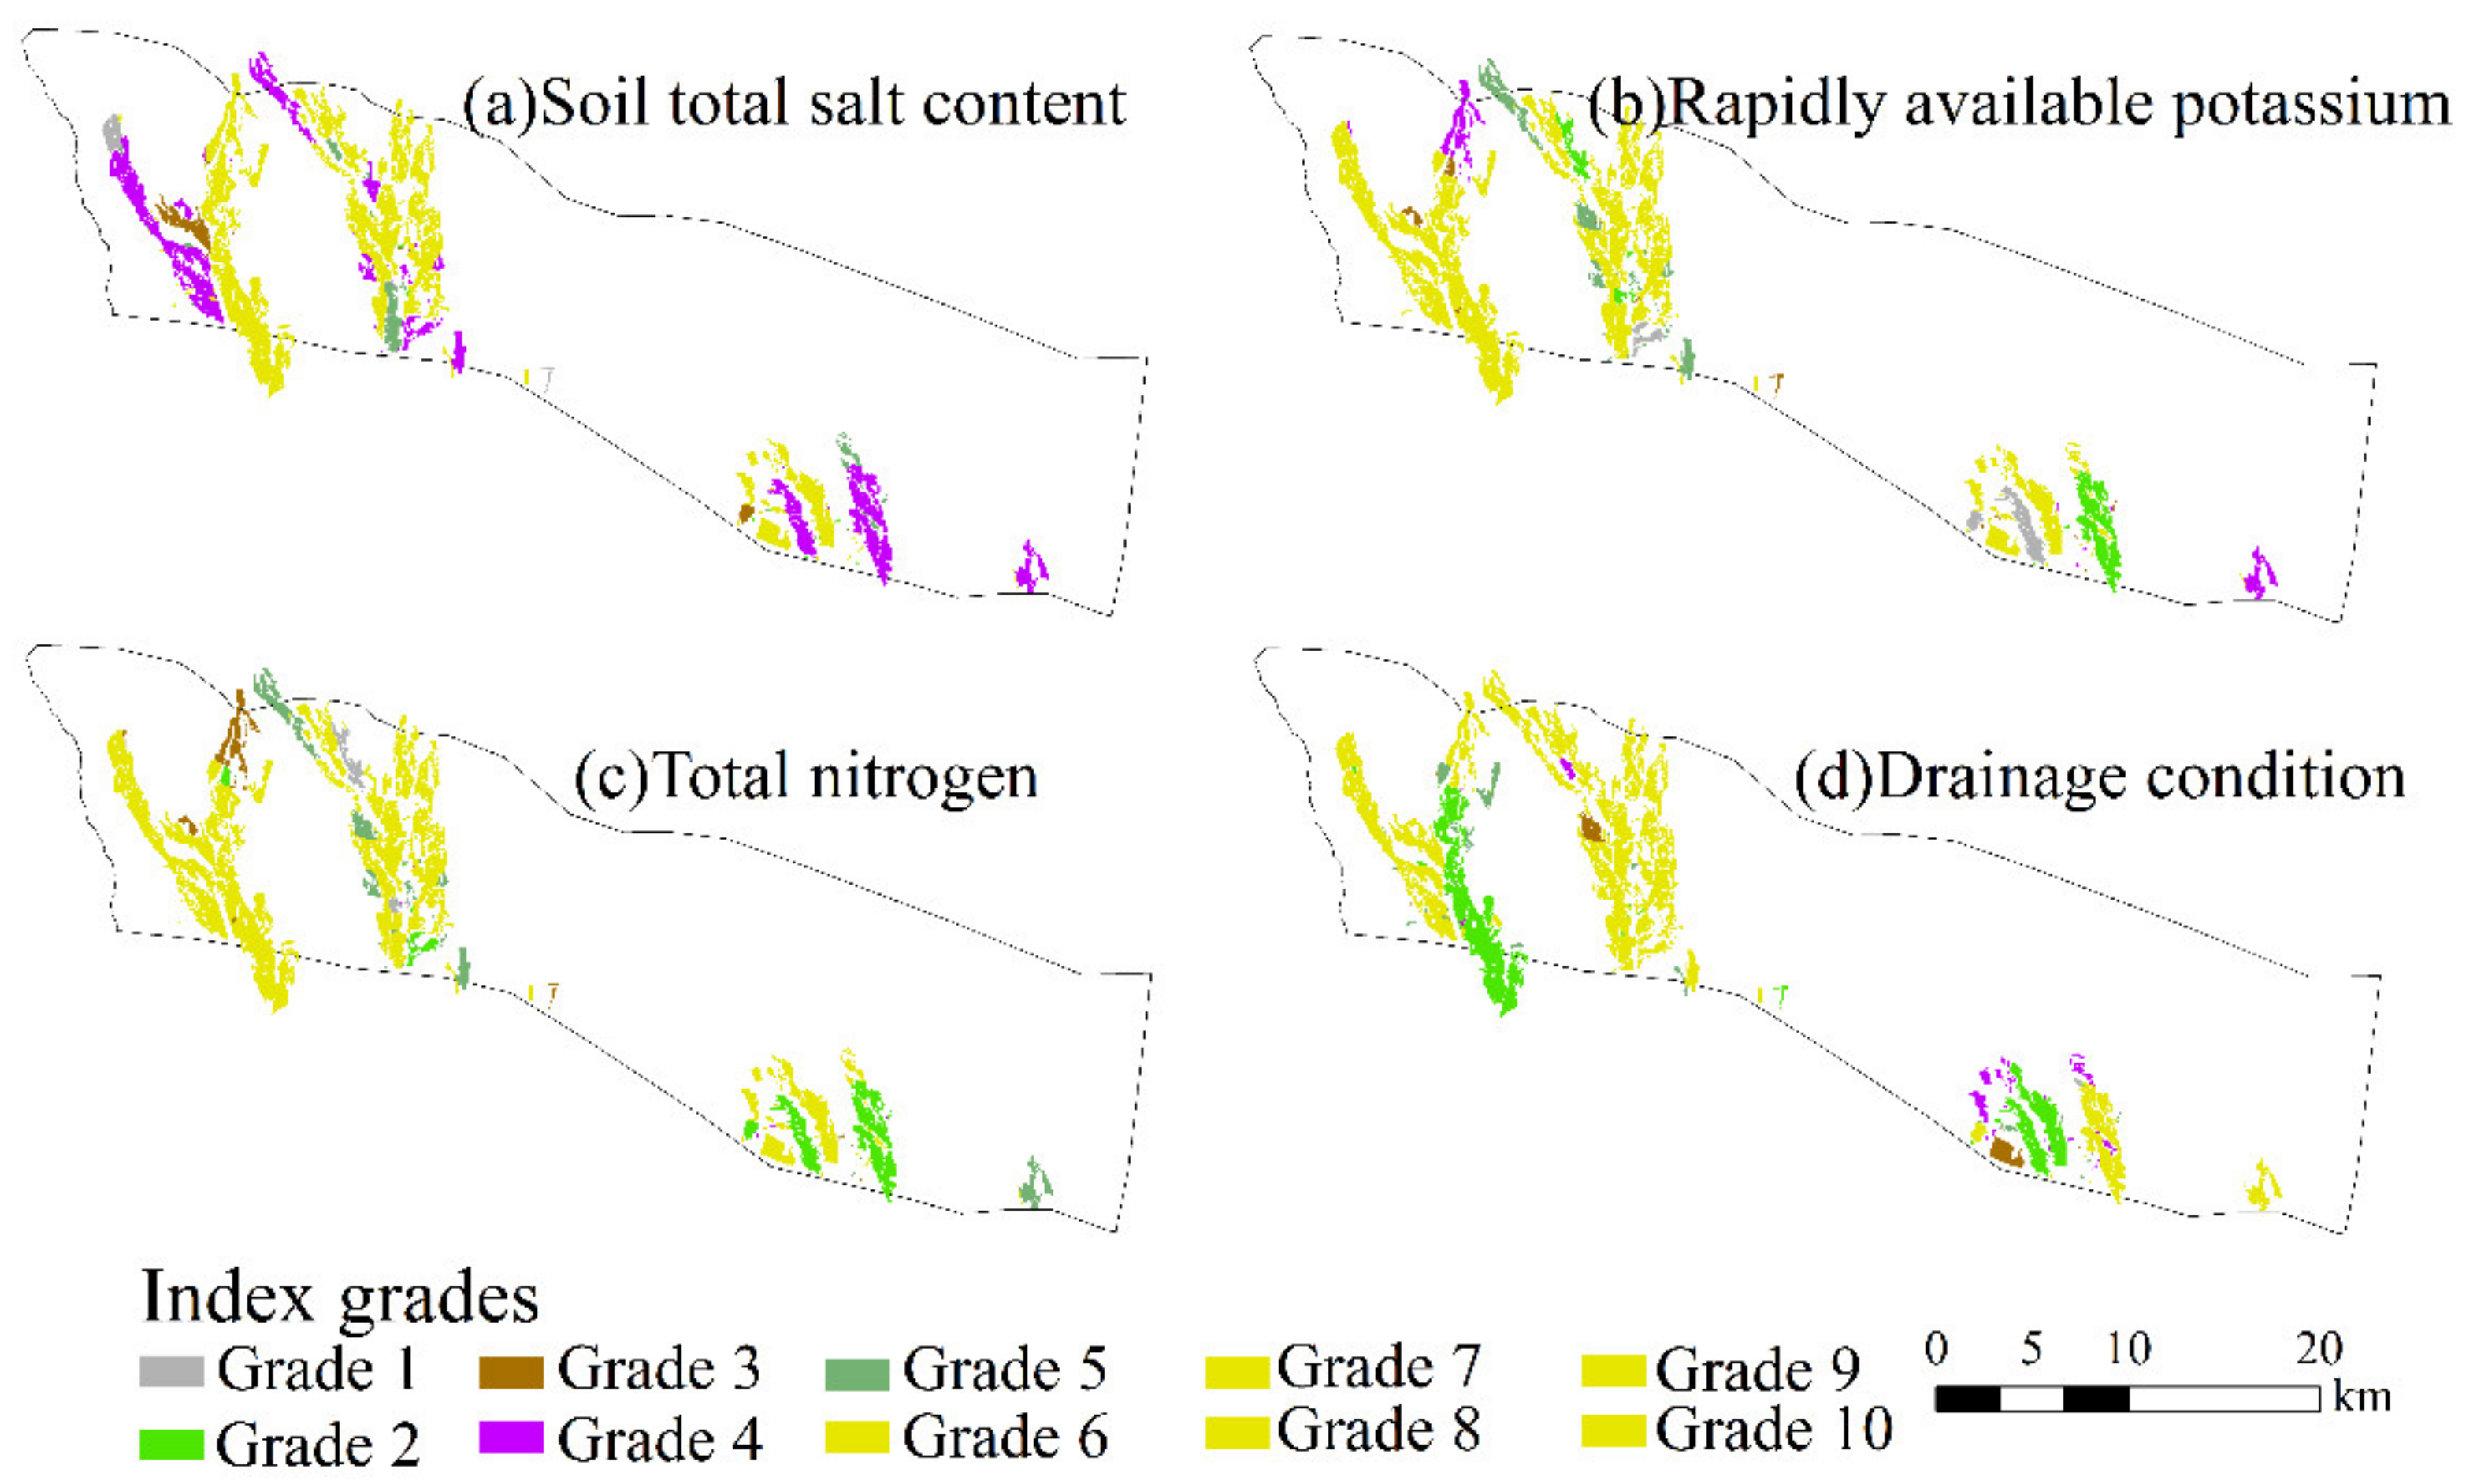
4.2.1. Characteristics of the Three Dimensions Grades and Spatial Distribution

The cultivated land soil properties index grades in the research region mainly include the third grade, fourth grade, fifth grade, and sixth grade. The total area of the four grades is 49.38% of the cultivated land area, with the higher grades distributed in Dayou Township, Ergong Township, and Laotai Township (Figure 4b). The mean value of the soil properties index is 5.42 at the middle level. According to the research, the distribution area with soil bulk density, soil pH, and soil organic matter lower than the fifth grade is 61.19%, 67.95%, and 63.31%, respectively (Figure 5a–c). These are the primary factors influencing the soil properties index. The available soil thickness in Beiting Town is thin; the soil pH in Laotai Township is alkalified, with scarce organic matter; and the soil texture in Qingyanghu Township is sandy, with a lower grade of rapidly available phosphorus and rapidly available potassium, total nitrogen, available copper, and zinc.
The primary grades of the farming conditions index in the research region are the fourth, fifth, sixth, and seventh grades. The total area of the four grades is 48.52% of the cultivated land, with higher grades distributed in Ergong Township and Qingyanghu Township (Figure 4c). The mean value of the farming condition index is 5.38 at the middle level. According to the research, the distribution area with the quantity of straw returning to the field, the irrigation water source, and water delivery method lower than the fifth grade is 55.59%, 63.12%, and 78.38%, respectively (Figure 5d–f). These are the factors influencing the farming conditions index. The cultivated land in Dayou Town is mainly irrigated through flood irrigation and low-lying irrigation, causing a serious waste of water resources. These irrigation methods are unreasonable; the quantity of straw returning to the field in Jimsar Town is relatively low, with a longer farming distance; the irrigation water is inadequate in Laotai Township, and the drainage conditions are unsatisfactory; the quantity of straw returning to the field in Qingyanghu Township is relatively low, with basin irrigation and hollow irrigation as the major water delivery methods; the membrane tectoria degree in Quanzijie Town is low, which goes against preservation of the soil moisture. The irrigation water source is single, mainly dependent on the rivers.
The primary grades of the natural environment conditions index in the research region include the second, third, fourth, and fifth grades. The total area of the four grades is 53.54% of the cultivated land, with the higher grades mainly distributed in Beijing Town, Ergong Township, and Santai Town (Figure 4d). The mean value of the natural environment conditions index is 5.43 at the middle level. According to the research, the distribution area with a diluvial fan part, underground water depth, and landform pattern lower than the fifth grade is 65.04%, 64.16%, and 64.21% of the total area, respectively (Figure 5g–i). These are the primary factors influencing the natural environment conditions index. Part of the cultivated land in Laotai Township is located at the lower part of the diluvial fan and is close to the Gobi Desert in the northwest, with poor natural environment conditions; the underground water in Qingyanghu Township is deep, not easy for farm irrigation; the major part of the cultivated land in Quanzijie Town is located in the piedmont, with a relatively large slope gradient.

4.2.2. Characteristics of Cultivated Land Quality Grades and Spatial Distribution

The mean value of the cultivated land quality grade in the research region is 6.66 at middle and low levels. The seventh, eighth, nineth, and tenth grades took the dominant position, making up 52.93% of the cultivated land area in total (Figure 4a). Cultivated land with higher grades is mainly located in Beiting Town, Ergong Township, Laotai Township, and Santai Town. In combination with the factors that have a larger influence on the three dimensions index, the major factors influencing the cultivated land quality in the diluvial fan terrain mainly include: the soil bulk density, soil pH, soil organic matter, quantity of straw returning to the field, irrigation water source, water delivery method, part of the diluvial fan, underground water depth, and landform pattern (Figure 5).

4.3. Characteristics of Cultivated Land Quality Grades of Different Parts of Diluvial Fan and Spatial Distribution

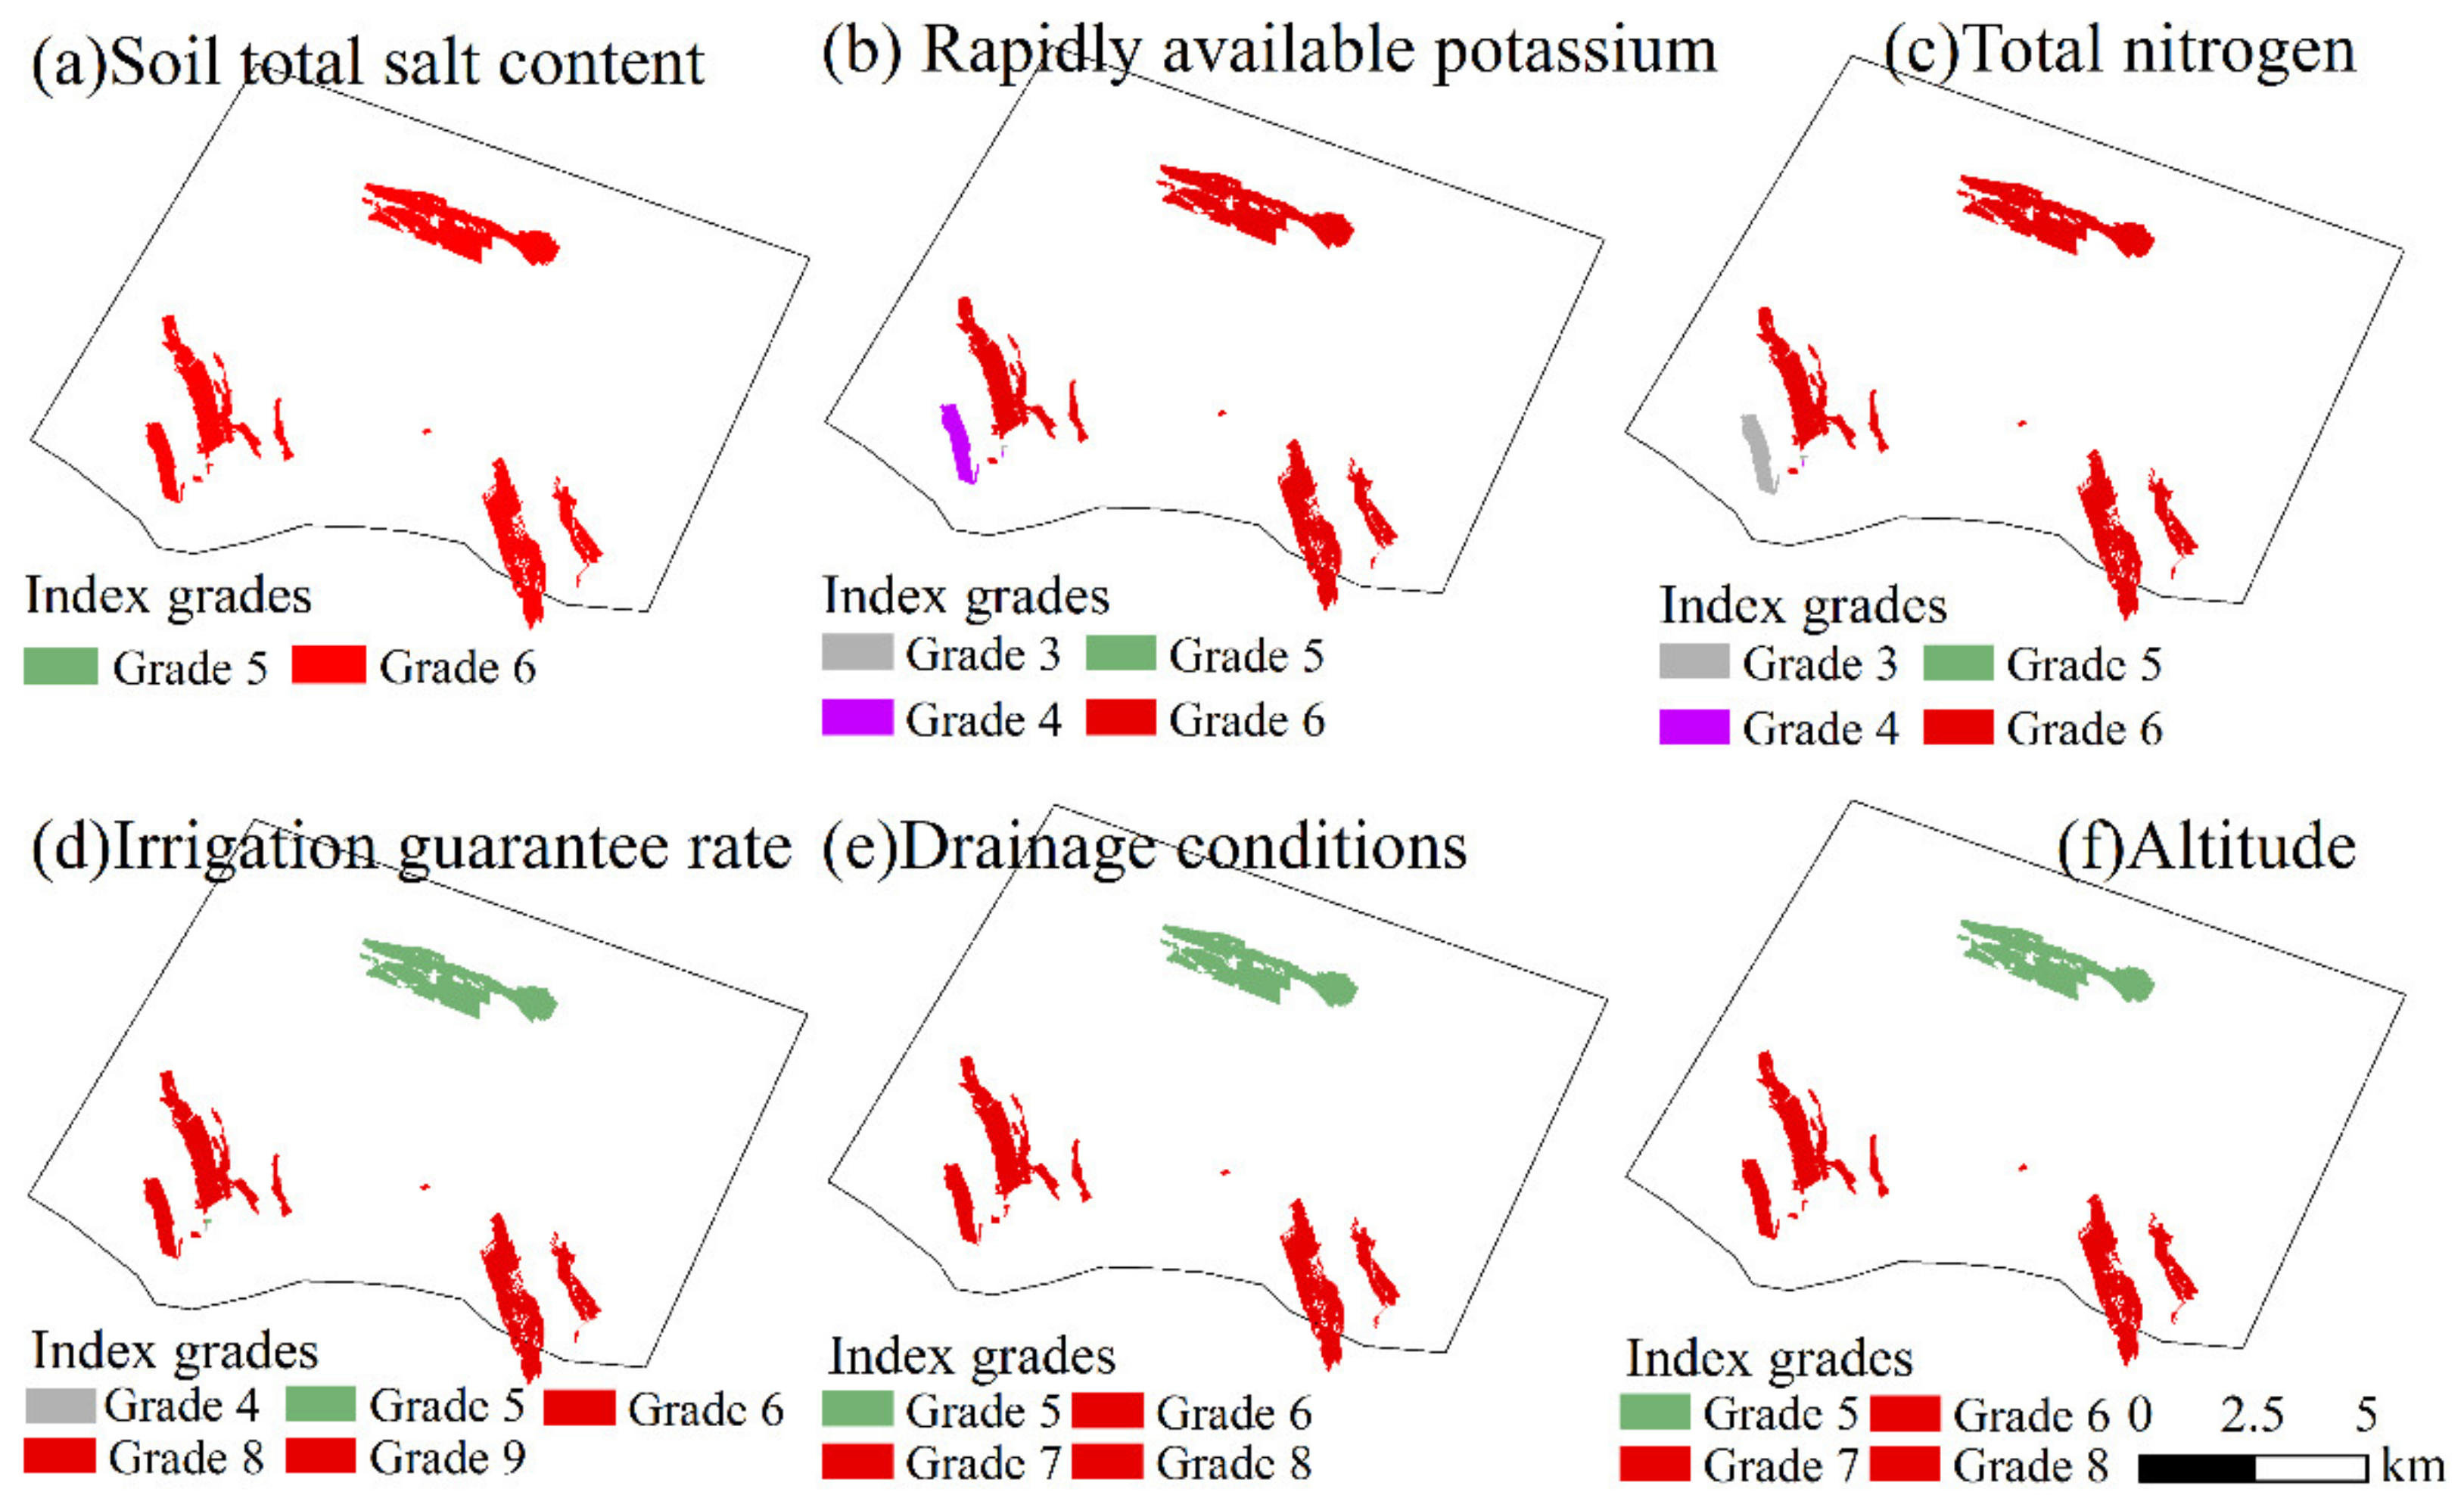
4.3.1. Characteristics of Cultivated Land Quality Grades at Piedmont Slope

The primary grades of the soil properties index and farming conditions index at the piedmont slope include the fourth, fifth, sixth, and seventh grades. The total area of the four grades accounts for 43.60% and 48.56% of the cultivated land area, respectively; the primary grades of the natural environment conditions index include the fifth, sixth, seventh, and eighth grades. The total area of the four grades accounts for 53.31% of the cultivated land area (Figure 4b–d). The mean value of the soil properties index grades is 5.61, that of the farming conditions index grades is 5.29, and that of the natural environment conditions index grades is 5.77 (Figure 6). According to the research, in comparison with the major factors influencing the cultivated land quality in the diluvial fan terrain, the area of the soil salinization degree, available iron, and available manganese lower than the fifth grade is 53.25%, 51.82%, and 56.00% of the cultivated land area, respectively (Figure 6a–c), which are major factors influencing the soil properties index of the piedmont slope. The area of the membrane tectoria degree and farming distance lower than the fifth grade is 55.55% and 58.62% of the cultivated land area, correspondingly (Figure 6d,e), which are the major factors influencing the farming conditions index.
The mean value of the cultivated land quality grade of piedmont slope is 6.87, with the fifth, sixth, seventh, and eighth grades as the dominant position, making up 53.93% of the cultivated land area (Figures 11 and 12). In combination with the factors that have a larger influence on the three dimensions index, the primary factors influencing the piedmont slope cultivated land quality include: the soil salinization degree, available iron, available manganese, membrane tectoria degree, and farming distance.

4.3.2. Characteristics of the Cultivated Land Quality Grades at Upper Part of the Diluvial Fan

The soil properties index, farming conditions index, and natural environment conditions index grades at the upper part of the diluvial fan mainly include four grades, namely the third, fourth, fifth, and sixth grades. The total area of the four grades accounts for 44.54%, 50.54%, and 58.89% of the cultivated land area, respectively (Figure 4b–d). The mean value of the soil properties index grades is 4.89, that of the farming conditions index grades is 5.29, and that of the natural environment conditions index is 5.35 (Figure 6). According to the research, in comparison with the major factors influencing the cultivated land quality of the diluvial fan terrain, the areas of available iron and available manganese lower than the fifth grade is 66.16% and 64.72% of the cultivated land area, respectively (Figure 7a,b). These are the major factors influencing the soil properties index at the upper part of the diluvial fan. The area of protection of the forest system and irrigation method is 59.76% and 60.67% of the cultivated land area (Figure 7c,d). These are the primary factors influencing the farming conditions index.
The mean value of the cultivated land quality grade at the upper part of the diluvial fan is 6.42, with the sixth, seventh, and eighth grades as the dominant position, making up 50.54% of the cultivated land area (Figures 11 and 12). In combination with the factors that have a larger influence on the three dimensions index, the primary factors influencing the cultivated land quality of the upper part of the diluvial fan include: the available iron, available manganese, protection forest system, and irrigation method.

4.3.3. Characteristics of the Cultivated Land Quality Grades at Middle Part of the Diluvial Fan

The soil properties index grades at the middle part of the diluvial fan mainly include the third, fourth, fifth, and sixth grades. The total area of the four grades accounts for 50.84% of the cultivated land area. The farming conditions index grades mainly are distributed in the third, fourth, and fifth grades. The total area of the three grades accounts for 48.85% of the cultivated land area. The natural environment conditions index grades mainly are distributed in the second, third, and fourth grades. The total area of the three grades accounts for 43.78% of the cultivated land area (Figure 4b–d). The mean value of the soil properties index grade is 5.15, that of the farming conditions index grade is 5.28, and that of the natural environment conditions index grades is 4.87 (Figure 6). According to the research, in comparison with the primary factors influencing the cultivated land quality in the diluvial fan terrain, the rapidly available potassium, total nitrogen, and available manganese lower than the fifth grade are 51.80%, 51.18%, and 54.25% of the cultivated land area, respectively (Figure 8a–c). These are the primary factors influencing the soil properties index at the middle part of the diluvial fan; the area of average rainfall below the fifth grade is 80.46% of the cultivated land area (Figure 8d). It is the main factor influencing the natural environment conditions index.
The mean value of the cultivated land quality grade at the middle part of the diluvial fan is 6.23, with the seventh, eighth, nineth, and tenth grades as the dominant position, making up 50.76% of the cultivated land area (Figures 11 and 12). In combination with factors that have a larger influence on the three dimensions index, the primary factors influencing the cultivated land quality at the middle part of the diluvial fan include: the rapidly available potassium, total nitrogen, available manganese, and the average rainfall all year round.

4.3.4. Characteristics of the Cultivated Land Quality Grades at the Lower Part of the Diluvial Fan

The soil properties index grades at the lower part of the diluvial fan are mainly distributed in the seventh, eighth, and nineth grades. The total area of the three grades accounts for 49.50% of the cultivated land area. The farming conditions index grades mainly include the sixth, seventh, and eighth grades. The total area of the three grades accounts for 65.96% of the cultivated land area. The natural environment conditions index grades are mainly distributed in the second, third, and fourth grades. The total area of the three grades accounts for 45.22% of the cultivated land rea (Figure 4b–d). The mean value of the soil properties index grades is 5.53, that of the farming conditions index grades is 6.25, and that of the natural environment conditions index grades is 4.83 (Figure 6). According to the research, in comparison with the major factors influencing the cultivated land quality of the diluvial fan terrain, the soil salt content, rapidly available potassium, and total nitrogen lower than the fifth grade is 60.11%, 72.39%, and 72.35% of the cultivated land area, respectively (Figure 9a–c). These are the primary factors influencing the soil properties index of the lower part of the diluvial fan. The drainage conditions lower than the fifth grade make up 66.12% of the cultivated land area (Figure 9d). This is the primary factor influencing the farming conditions index.
The mean value of the cultivated land quality grades at the lower part of the diluvial fan is 6.75, with the seventh, eighth, nineth, and tenth grades as the dominant position, making up 73.21% of the cultivated land area (Figures 11 and 12). In comparison with the factors that have a larger influence on the three dimensions index, the primary factors influencing the cultivated land quality at the lower part of the diluvial fan include the soil total salt content, rapidly available potassium, total nitrogen, and drainage conditions.

4.3.5. Characteristics of the Cultivated Land Quality at Edge of the Diluvial Fan

The quantity and area of the cultivated land at edge of the diluvial fan is small, and the cultivated land quality and three dimensions index grades are mainly distributed in several cross-grade levels. The soil properties index grades are mainly distributed the fifth level, making up 57.55% of the cultivated land area; the farming conditions index grades are mainly distributed in the sixth grade, making up 92.11% of the cultivated land area; and the natural environment conditions index grades are mainly distributed in the second and eighth grades. The total area of the two grades accounts for 76.04% of the cultivated land area (Figure 4b–d). The mean value of the soil properties index grades is 4.78, that of the farming conditions index grades is 5.83, and that of the natural environment conditions index grade is 3.61 (Figure 6). According to the research, in comparison with the major factors restricting the cultivated land quality of the diluvial fan terrain, the soil total salt content, rapidly available potassium, and total nitrogen lower than the fifth grade is 99.97%, 92.11%, and 90.04%, respectively (Figure 10a–c). These are the primary factors influencing the soil properties index at the edge of the diluvial fan. The irrigation guarantee rate, drainage conditions, and irrigation water source lower than the fifth grade are 65.21%, 65.41%, and 92.11% of the cultivated land area, respectively (Figure 10d,e). These are the major factors influencing the farming conditions index. The altitude lower than the fifth grade is 65.41% of the cultivated land area (Figure 10f). It is the primary factor influencing the natural environment conditions index.
The mean value of the cultivated land quality grade at the edge of the diluvial fan is 5.72, with the fifth grade as the dominant position, making up 56.60% of the cultivated land area (Figure 11 and Figure 12). In combination with the factors that have a larger influence on the three dimensions index, the primary factors influencing the cultivated land quality at the edge of the diluvial fan include: the soil total salt content, rapidly available potassium, total nitrogen, irrigation guarantee rate, and drainage conditions.

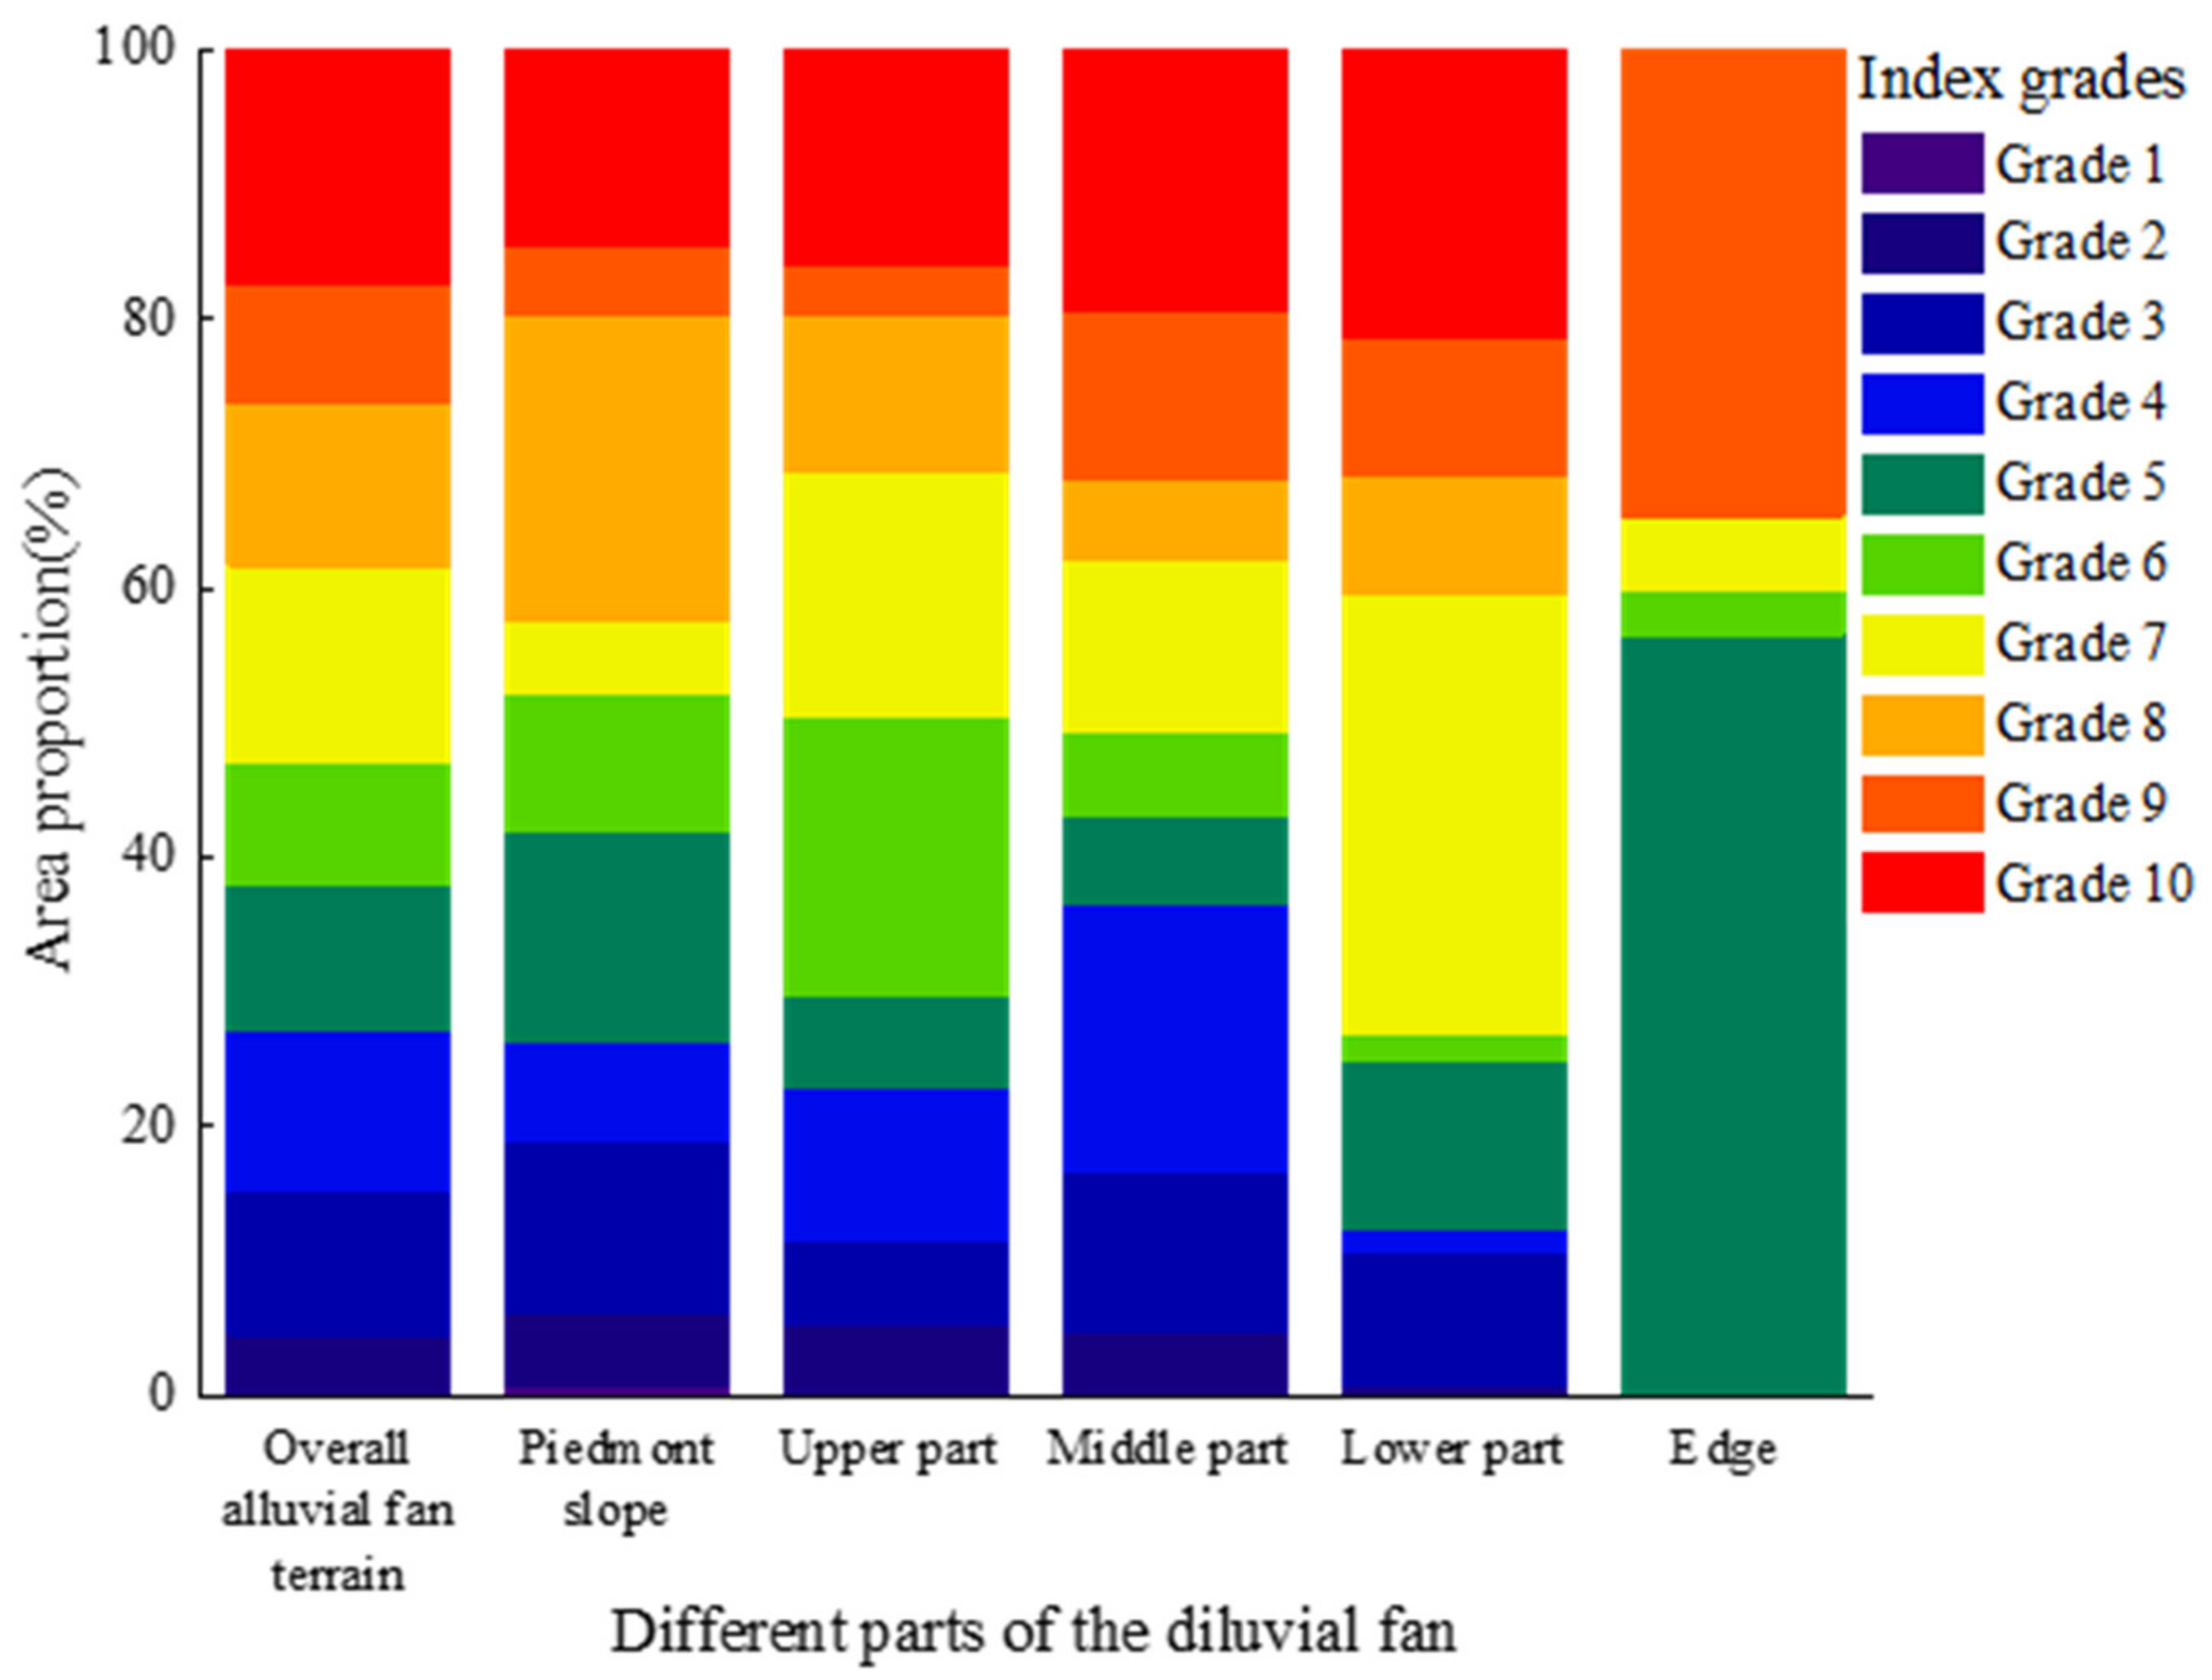
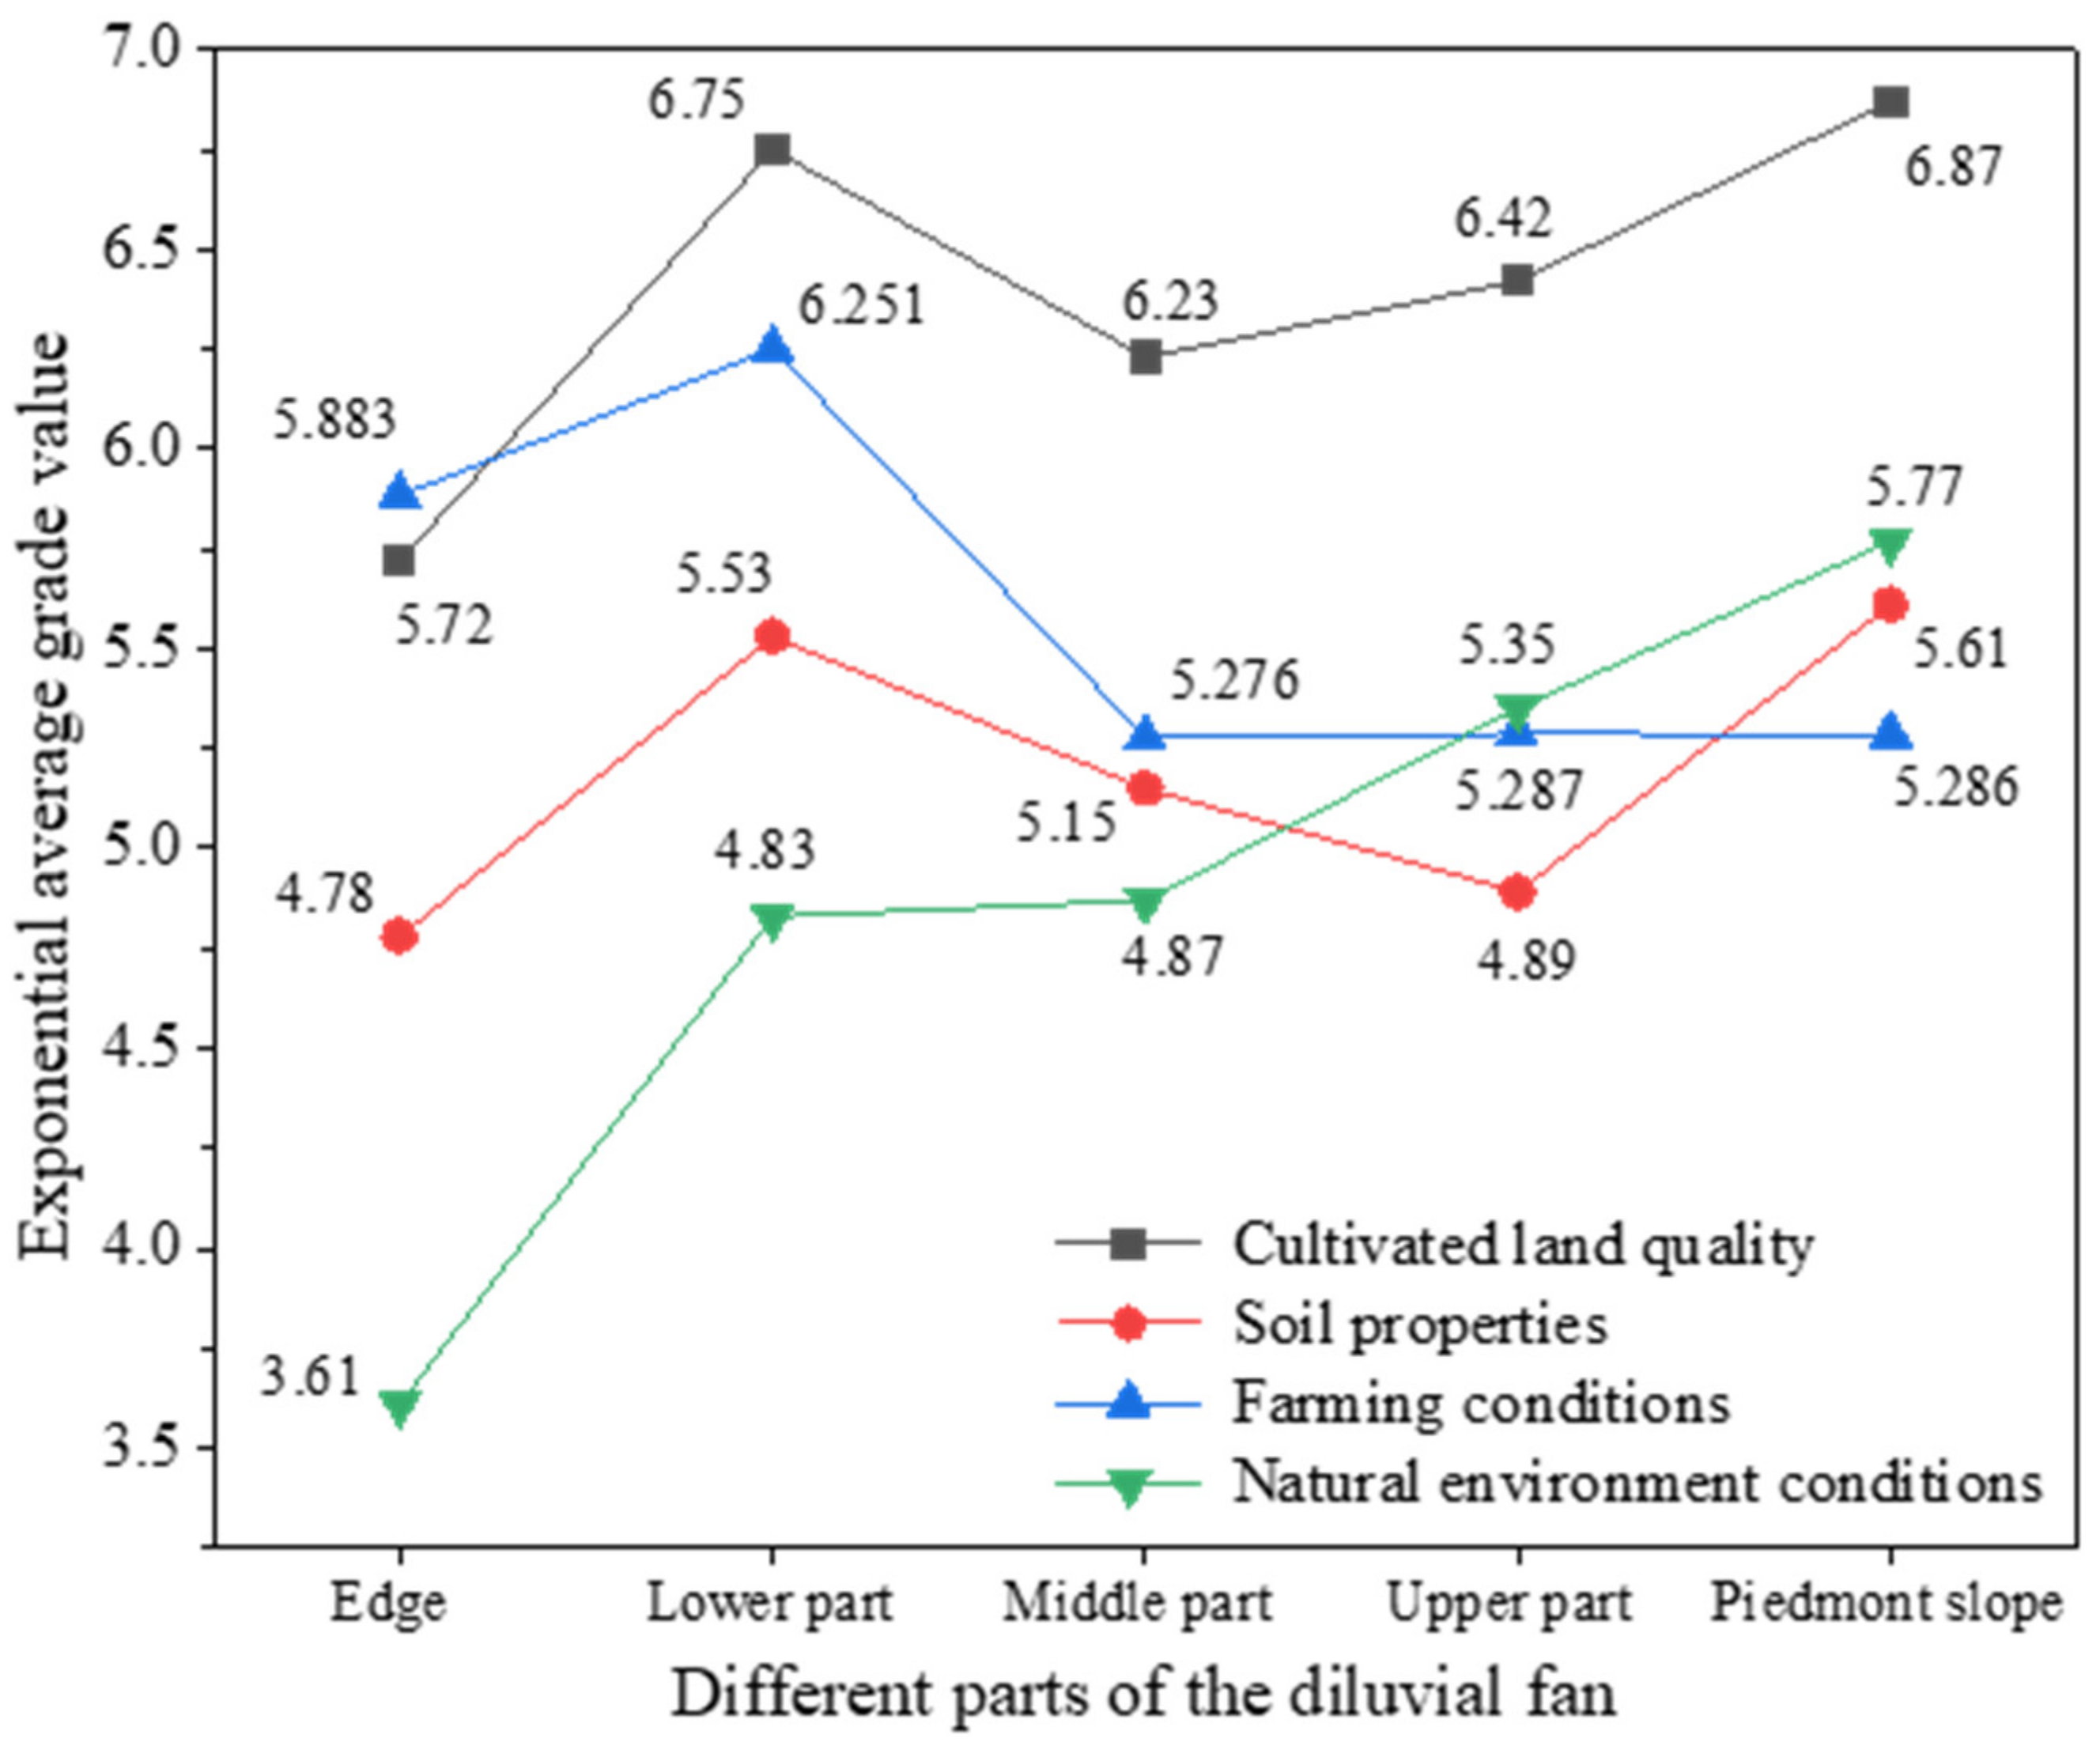
4.3.6. Spatial Distribution Characteristics of the Cultivated Land Quality Grades at Different Parts of the Diluvial Fan

The three dimensions index and cultivated land quality grades at various parts of the diluvial fan are different and are ranked from favorable to unfavorable below:
(1)
Soil properties: edge of the diluvial fan (4.78) > lower part of the diluvial fan (5.53) > middle part of the diluvial fan (5.15) > upper part of the diluvial fan (4.89) > piedmont slope (5.61) (Figure 13).
(2)
Farming conditions: middle part of the diluvial fan (5.276) > piedmont slope (5.286) > upper part of the diluvial fan (5.287) > edge of the diluvial fan (5.883) > lower part of the diluvial fan (6.251) (Figure 13).
(3)
Natural environment conditions: edge of the diluvial fan (3.61) > lower part of the diluvial fan (4.83) > middle part of the diluvial fan (4.87) > upper part of the diluvial fan (5.35) > piedmont slope (5.77) (Figure 13).
The sequence above indicates that the soil properties index grades at different parts of the diluvial fan are distributed at about the middle level; the farming conditions index grades are distributed from high to low and interspersed mainly below the middle level; the distribution of the natural environment conditions index grade is located above the middle level. The natural environment conditions index grades increase as the rise of the altitude of the diluvial fan part, indicating the vertical zonality differentiation rule, and the farming conditions index grades decrease from the middle part to the edge and the piedmont slope.
(4)
Cultivated land quality grade: edge of the diluvial fan (5.72) > lower part of the diluvial fan (6.75) > upper part of the diluvial fan (6.42) > middle part of the diluvial fan (6.23) > piedmont slope (6.87) (Figure 13). According to the sequence, the cultivated land quality stays at the middle and lower levels. As the altitude of the diluvial fan part rises, the cultivated land quality tends to decline, indicating a vertical zonality differentiation rule.

5. Discussion

5.1. The Construction of the Evaluation Index System

When utilizing a multifactor, comprehensive evaluation method or other methods to evaluate the cultivated land quality, the index or perspective selected by researchers may lead to a difference of research priorities. Shi et al. used multisource data to evaluate the cultivated land quality based on a resource–asset–capital attribute analysis framework of the cultivated land and analyzed the spatial distribution characteristics of the three attribute qualities, discovering that the three attribute qualities and the spatial distribution patterns are different [58]. Cheng et al. constructed the evaluation index system from the perspective of the soil health and measured metals such as copper, chromium, zinc, and manganese in the soil and rapidly available phosphorus, chloride, soluble salt, and pH and evaluated the heavy metal pollution status of the soil. According to the research [59], the fertilizer application, usage of insecticides, and pollution are the primary causes for middle-level manganese pollution and middle-level-to-severe zinc pollution. From the perspective of the influence of land reclamation on the cultivated land quality, Kuang et al. identified the sensitivity and stabilizing factors and established an assessment index system based on agricultural land classification and absorbing the modifying factors of land reclamation to the natural quality of the cultivated land and production conditions. Through research, it has been found that the assessment index system can effectively reflect the influence of land reclamation on the cultivated land quality [60]. Meanwhile, Zhao et al. selected the perspective of ecological security to evaluate the cultivated land quality and its constraints and put forward policy suggestions on improving the cultivated land quality [25].
According to the existing research on the cultivated land quality evaluation, most scholars focused on the natural conditions, soil health, or ecological environment [61,62,63]. Some scholars selected different perspectives and combined the cultivated land management conditions and ecological security factors to evaluate the cultivated land quality and its spatial differentiation characteristics [64]. The cultivated land quality evaluation index system constructed by this research has its own emphasis. At present, the construction of the cultivated land quality evaluation index system is still short of schematism and needs to be promoted further. As cultivated land is a natural resource, its quality is determined not only by its basic conditions but also its regional environment. Therefore, absorbing the regional environmental constraints into the index system can reflect the cultivated land quality more accurately. The arid region in Northwest China lacks a water resource, with scarce rainfall and a dry climate [65,66]. When evaluating the cultivated land quality in this region, we shall fully consider the water resource and climate factors, which are constraints influencing the agricultural development. Therefore, this research selected the irrigation water condition-related indexes and two climate indexes, namely the average rainfall all year round and ≥10 °C accumulated temperature. In combination with the soil physical and chemical properties, soil nutrient, management conditions, and natural environment conditions, this research established a relatively comprehensive cultivated land quality evaluation index system. At the same time, considering that the research region is a specific geographical unit, the diluvial fan in the arid region, the diluvial fan parts, altitude, slope, and relevant indexes are included into the evaluation index system. This research utilized a multifactor, comprehensive evaluation method to compute the cultivated land quality index and divided the index into different grades. Qi et al. divided the cultivated land quality index into four grades [67]. To refine the difference, we divided the cultivated land quality index into 10 grades. In addition, based on the cultivated land quality evaluation index, this research constructed three dimensions, namely soil properties, farming conditions, and natural environment conditions, to compute the dimensions index and divide the index into 10 grades. Thus, the cultivated land quality can be evaluated from the three dimensions.
The cultivated land quality grade evaluation provides evidence for the orderly delineation of permanent basic farmland, cultivated land occupation or protection compensation, and computation of land expropriation compensation. Meanwhile, land use planning and land reclamation planning can carry out differentiated management for cultivated land in terms of the spatial distribution of the cultivated land quality grade [43]. The research not only quantifies the quality of the cultivated land and three dimensions but also describes the spatial distribution pattern of the cultivated land and three dimensions quality grades, indicating the quality of the cultivated land and its difference in a more multidimensional way. At the same time, this research displays the status of all the indexes, facilitating extracting the factors restricting the improvement of the cultivated land quality.
Protecting the food security and defending the 1.8 billion mu cultivated land red line are the national policies of China, and the cultivated land quality plays a fundamental role in it [68]. To grade and classify the cultivated land quality effectively and scientifically, the Chinese government published the Regulation for Gradation on Agriculture Land Quality, which combines the natural, social, and economic, as well as regional factors of China, and refers to the important evaluation indexes in international research, indicating a high applicability. On that basis, the research added irrigation water conditions, the climate conditions-related index, and underground water depth index. Therefore, with the gradual improvement of the evaluation index system, the factors influencing the cultivated land quality can be shown much more accurately, and the evaluation results will be more objective and authentic. Considering that the territorial scope of the diluvial fan is relatively small, the climate conditions-related index only selects the average rainfall all year round and ≥10 °C accumulated temperature.
As a natural resource, cultivated land itself is an indispensable part of the ecological environment system. If we part off the natural attributes of a cultivated land artificially and evaluate the cultivated land quality or extract the influencing factors with administrative division as the geographical unit [69], the evaluation results will be inaccurate, and the extraction will be unscientific. Such a practice has certain disadvantages. Therefore, this research utilized the diluvial fan in the arid region as the geographical unit to evaluate the cultivated land quality. On account of the considerable differences of the land and water resource conditions and landform patterns among the different parts of the diluvial fan, this research included the geographical conditions-related index of the diluvial fan terrain into the evaluation index system.

5.2. Evaluation Accuracy

The MAUP effect is a common problem in the process of the geographical region spatial analysis. Kolaczyk and Huang proposed to adjust and optimize the geographical unit scale to make a statistical analysis in order to reduce the MAUP effect [70]. Qi and Bai utilized national agricultural county-level statistic data and the second economic census data of Beijing in 2008 and acquired different scales of geographical units in terms of certain rules of aggregation, exploring the hotspot variation law of statistical data under different scales and its influencing factors [71]. Chen et al. used simulated data and the per capital GDP in China to explore the spatial autocorrelated MAUP effect and its influence [72]. According to the research mentioned above, the MAUP effect in the geographical region spatial statistical analysis can be effectively solved by selecting the appropriate geographical evaluation unit in combination with the spatial interpolation method. Taking the soil heavy metal As and Cd in Enshi, Hubei, China as an example, Ma et al. utilized a multimethod interpolation on the premises of data analysis conversion and the selection of optimal interpolation parameters and used cross-validation and evaluation for the interpolation results and selected the optimal spatial interpolation method [73]. This research also utilized different spatial interpolation methods for the cultivated land evaluation units with different scales to reduce the MAUP effect. In accordance with the cross-validation and evaluation results, this research selected a large-scale cultivated land evaluation unit and Ordinary Kriging spatial interpolation method.

5.3. Improvement of Cultivated Land Quality
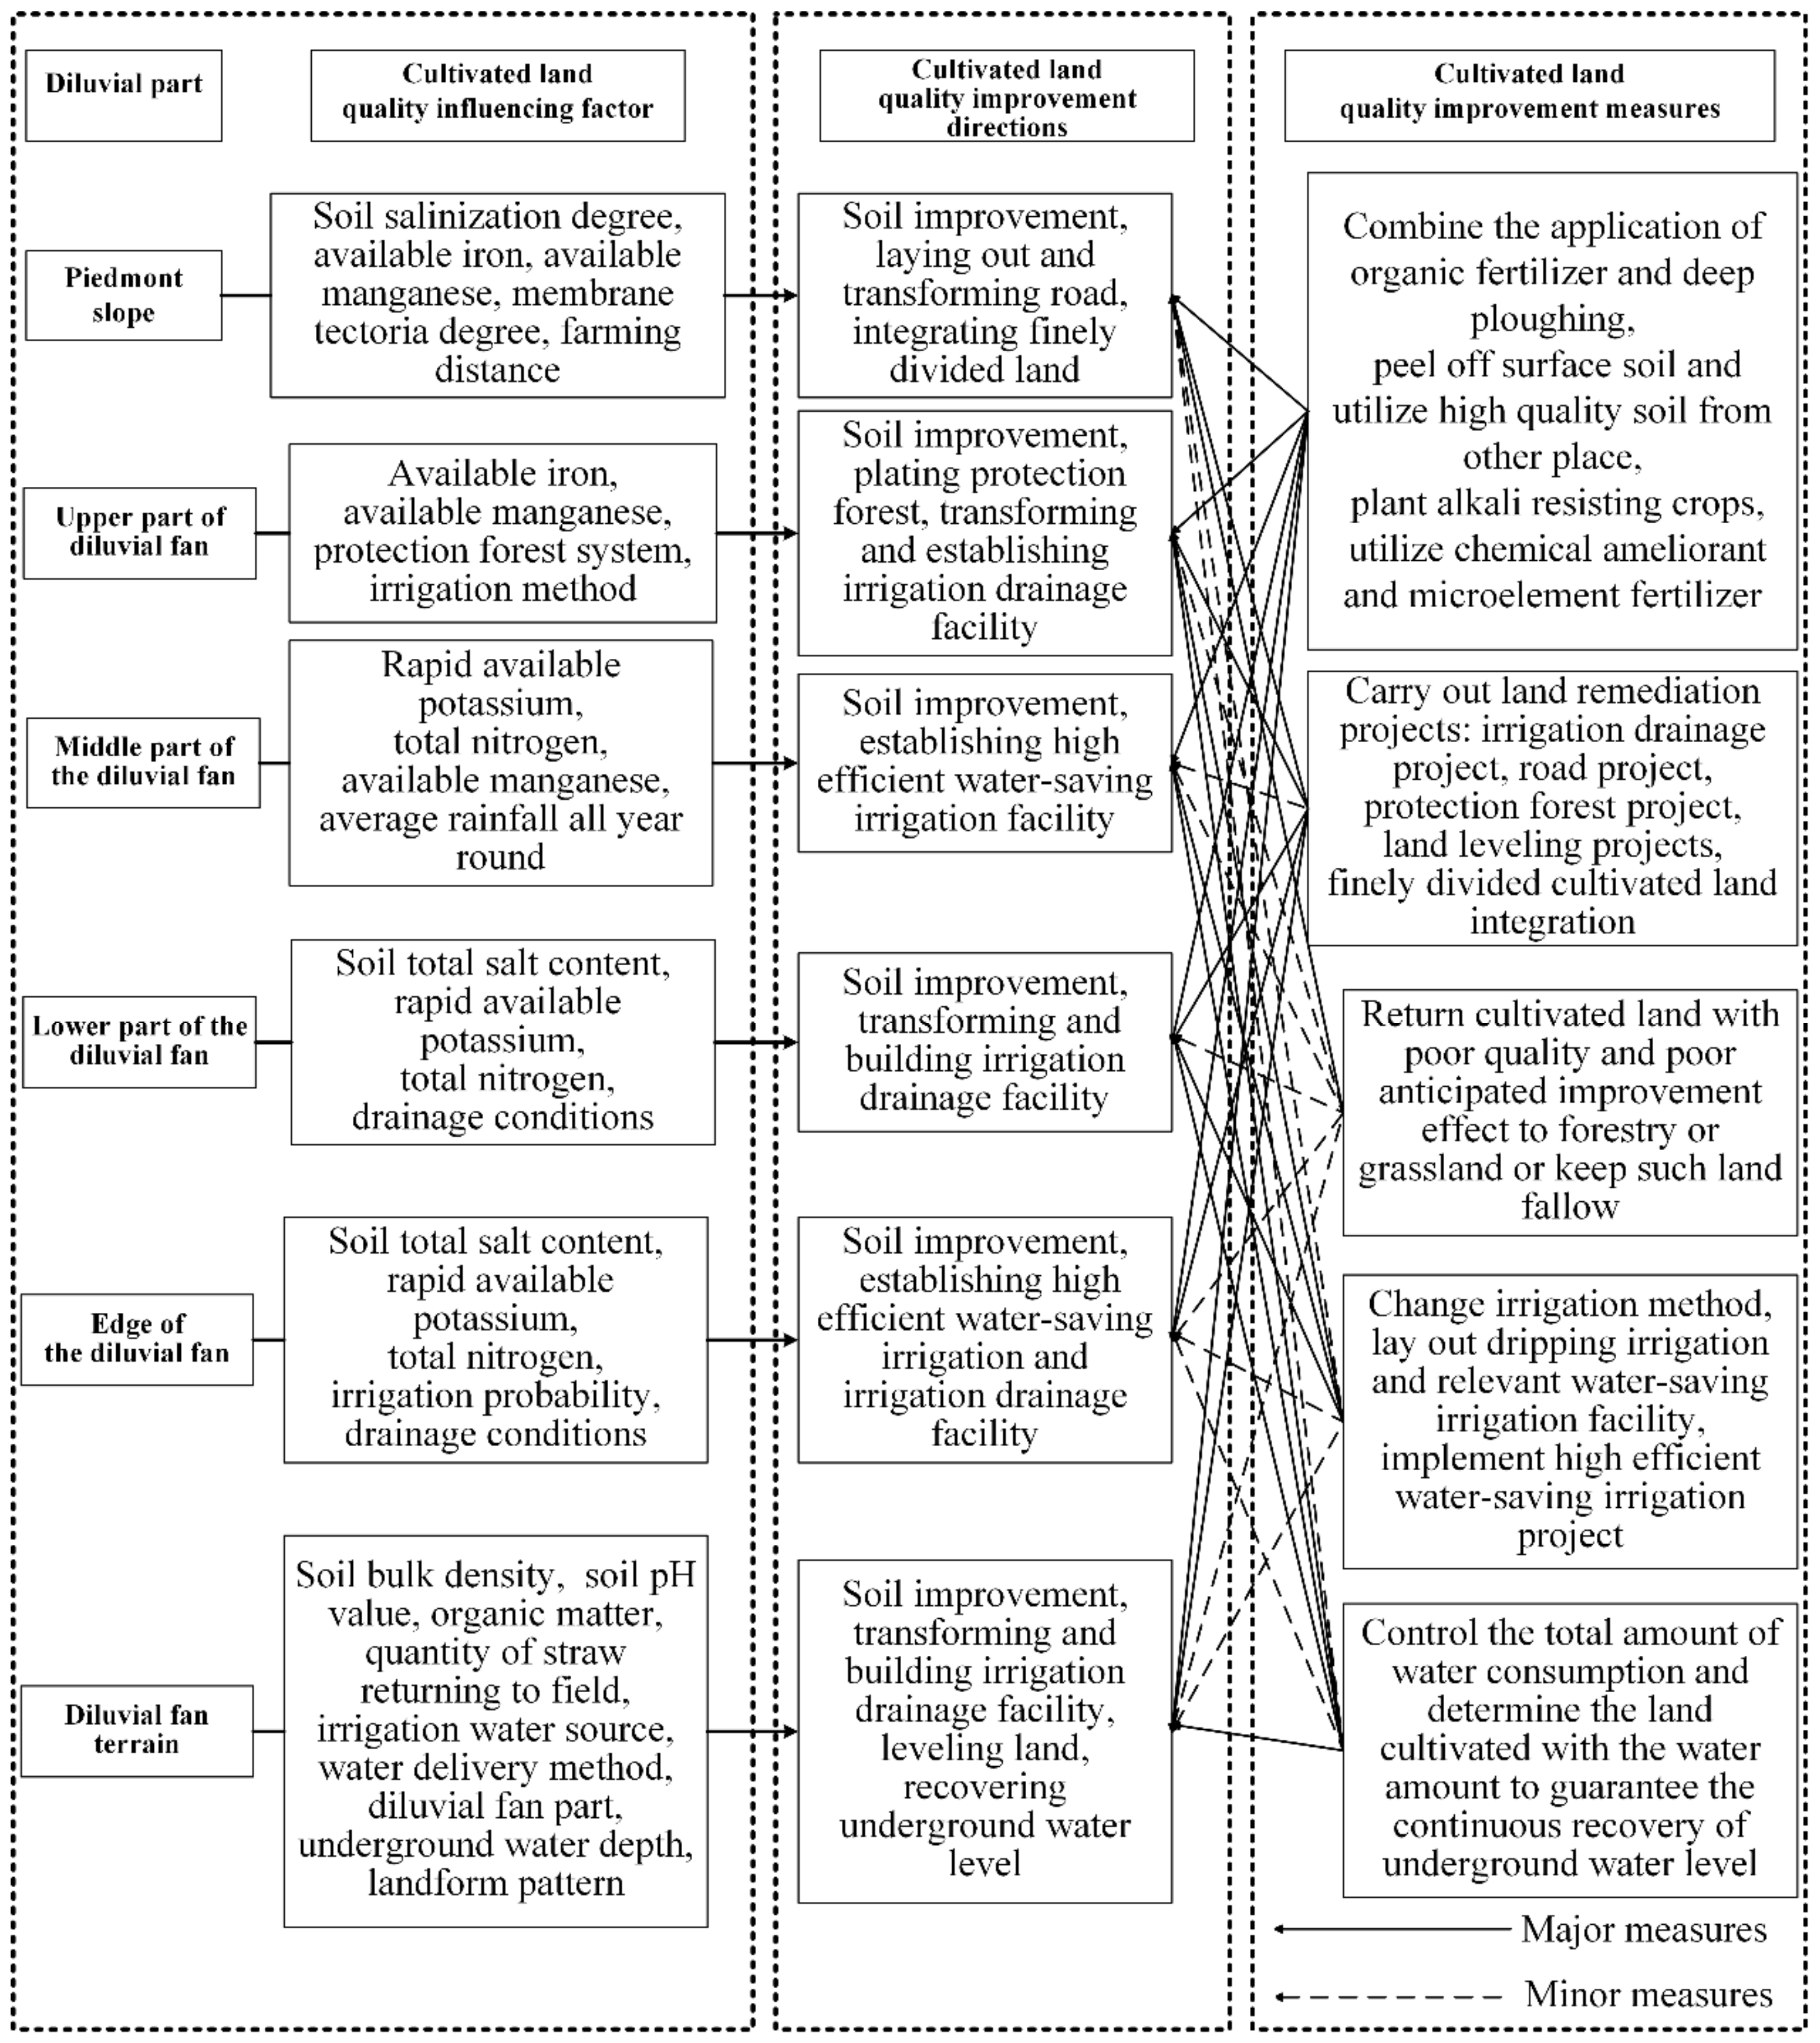
The piedmont diluvial fan is an important geographical unit undertaking the development of the oasis farming of arid regions. The water resources at different parts of the diluvial fan have a certain kind of spatial distribution rule [74,75]. The underground water level of the diluvial fan deepens gradually from the edge to the piedmont slope, and the water volume drops from a relatively abundant level, as well. The surface water resource converges and remains plentiful at the lower and middle parts of the diluvial fan. The fine soil at the edge of the diluvial fan is transited into sand gravel at the piedmont slope, with poorer soil quality. This means that the land and water resource conditions in the diluvial fan terrain deteriorate as the altitude rises. At the same time, the land forms at the middle and lower parts and the edge of the diluvial fan are relatively flat, which is convenient for farming (Figure 1). This is the root cause for the vertical zonality differentiation rule of the cultivated land quality and natural environment conditions index grades in the diluvial fan terrain of Jimsar County. Considering that the proportions of middle and upper parts in the cultivated land area are relatively high, the farm irrigation, road, and protection forest systems are mainly established in such areas in comparison with the other parts, leading to higher farming conditions index grades at the middle and upper parts of the diluvial fan and lower at other parts, indicating a decreasing status from the middle part of the diluvial fan to the edge and piedmont slope.
The cultivated land quality index is a comprehensive index based on the computation and aggregation of many factors. Most of other research utilized different methods to compute the cultivated land quality index and focused on the differences of the index values, paying less attention to the factors influencing the cultivated land quality [76,77,78]. However, among the cultivated land quality evaluation indexes, a lower grade index will have larger influence on the cultivated land quality index and can be regarded as an influencing factor. Therefore, it is necessary to attach more importance to the extraction of the influential factors in the cultivated land quality evaluation process and put forward scientific quality improvement measures. These are the major targets of the cultivated land quality evaluation.
Most of the existing cultivated land quality evaluations focused on index computation and paid less attention to identifying the influencing factor of the cultivated land quality and providing guidance for cultivated land quality improvement. Some research extracted factors influencing the cultivated land quality within a large scope of area in provinces or cities [79,80]. However, owing to the environment differences within a large scope of the area, there are cultivated land quality influencing factors not only within the large scope of the area but also within the small scope of the area, failing to provide effective instructions on improving the cultivated land quality. This research selected the optimal cultivated land evaluation unit and spatial interpolation methods, utilized a multifactor, comprehensive evaluation method, and identified the cultivated land quality index based on the evaluation index system composed of three dimensions, namely the soil properties, farming conditions, and natural environment conditions. Meanwhile, this research graded the index and created maps and extract factors influencing the cultivated land quality at the diluvial fan terrain and its different parts. Therefore, the research results played a more practical role in helping the government establish scientific cultivated land resource management policies and improve the cultivated land quality.
According to the research results, the primary factors influencing the cultivated land quality in the diluvial fan terrain include the soil bulk density, soil pH, soil organic matter, quantity of straw returning to the field, irrigation water source, water delivery method, diluvial fan part, underground water depth, and landform pattern. The influential factors within a small scope of the area also exist at different parts of the diluvial fan. Thus, the following suggestions on cultivated land quality improvement are put forward:
(1)
Through the long-term application of organic fertilizer and straw returning to the field, the increase of soil organic matter and the improvement of soil fertility can be realized. Peel off the barren soil on the surface of the cultivated land at the piedmont slope and upper part of the diluvial fan and backfill with high-quality soil removed from other places; combine the long-term increasing application of organic fertilizer and deep ploughing, cultivate alkali-resisting crops, cooperatively use chemical ameliorants to improve the salt and alkali soil and pH effectively, and increase the microelements in the soil (Figure 14).
(2)
Carrying out a land consolidation project. Transform and pave roads to improve accessibility; plant windbreaks to protect crops growing and reduce evaporation caused by wind, level the cultivated land at the piedmont slope and upper part of the diluvial fan to improve the farming suitability, integrate the finely divided cultivated land and carry out and carry out the scale operation (Figure 14).
(3)
Cultivated land at the piedmont slope and upper part of the diluvial fan with poor quality and a poor anticipated improvement effect shall be returned to forestry or grassland or be fallow; lay out dripping irrigation and relevant water-saving irrigation equipment to promote the establishment of highly efficient water-saving irrigation projects; and control the total amount of water consumption and determine the land cultivated with the water amount to guarantee the continuous recovery of the underground water level (Figure 14).

6. Conclusions

Based on the perspective of environmental constraints, this research utilized a geographical information system spatial analysis and a multifactor, comprehensive evaluation method to assess the cultivated land quality in the diluvial fan terrain of arid regions and analyzed the spatial distribution characteristics of the cultivated land quality. Firstly, we constructed the cultivated land quality evaluation index system based on three dimensions, which are the soil properties, farming conditions, and natural environment conditions. Secondly, we established six first-grade indexes, namely the soil physical and chemical properties, soil nutrient status, management conditions, irrigation water conditions, geographical conditions, and climate conditions, and 34 s-grade indexes, including the available soil thickness, soil salinization degree, soil organic matter, rapidly available phosphorus, underground water depth, and average rainfall all year round, among others. Finally, to reduce the MAUP effect and enhance the accuracy of the cultivated land quality evaluation, the research compared the validation error of different scales of cultivated land evaluation units and spatial interpolation methods. In terms of the results evaluation, we selected a large-scale cultivated land evaluation unit and Ordinary Kriging Spatial Interpolation method.
According to the applied research in the diluvial fan terrain of Jimsar County, Xinjiang of the arid region in Northwest China, the results indicated that the overall cultivated land quality in the diluvial fan terrain of the arid region is at the middle and lower levels; the soil properties and farming conditions at different parts of the diluvial fan are moderate, and the natural environment conditions are relatively favorable; from the perspective of the spatial distribution characteristics, the cultivated land quality and natural environment conditions of the diluvial fan terrain decrease with the rise of altitude of the diluvial fan part, indicating a vertical zonality differentiation rule. The farming conditions decrease from the middle part of the diluvial fan to the edge and piedmont slope; the factors influencing the cultivated land quality mainly include the soil bulk density, soil pH, soil organic matter, quantity of straw returning to the field, irrigation water source, water delivery method, diluvial fan part, underground water depth, and landform pattern.
This research evaluated the cultivated land quality in terms of the construction of a systematic evaluation index system and provided active guidance for cultivated land quality protection and cultivated land resource sustainable development and utilization. It supported and promoted the construction of the quality, quantity, and ecology “three-in-one” protection pattern. The evaluation method proposed by this research cannot only measure the cultivated land quality but also identified the quality of the different dimensions, which helped to put forward solutions for the improvement of the regional cultivated land quality and to provide direction for effectively improving the cultivated land resource management level.
In the future, with the gradual deepening of the research on the cultivated land quality evaluation, it is necessary to establish a more multisource and comprehensive evaluation index system, and the inclusion of soil biological and geochemical properties into the evaluation index system of the cultivated land quality should be an important consideration. In addition, the temporal and spatial variation characteristics of the cultivated land quality are also the new research direction in the future.

Supplementary Materials

The following are available online at https://www.mdpi.com/article/10.3390/land10090896/s1: Figure S1: Distribution of the sampling points of the spatial interpolation group and validation group. Table S1: Soil properties scores and grades, Table S2: Farming conditions scores and grades, Table S3: Natural environment conditions scoring and grading, Table S4: Cultivated land quality and soil properties, farming conditions, and natural environment conditions grading table.

Author Contributions

Conceptualization, Y.S. and W.L.; methodology, Y.S. and H.X.; software, Y.S. and X.G.; validation, Y.S. and W.L.; formal analysis, Y.S., W.L. and H.X.; resources, W.L., Y.S. and X.G.; data curation, Y.S. and W.L.; writing—original draft preparation, Y.S. and H.X.; writing—review and editing, Y.S., W.L. and H.X.; visualization, Y.S. and X.G.; supervision, W.L.; project administration, Y.S. and W.L.; and funding acquisition, W.L. All authors have read and agreed to the published version of the manuscript.

Funding

This research was funded by the National Natural Science Foundation of China-Key projects of Xinjiang United Fund (No. U1603235).

Institutional Review Board Statement

Not applicable.

Informed Consent Statement

Not applicable.

Data Availability Statement

Not applicable.

Conflicts of Interest

The authors declare no conflict of interest.

Appendix A

Definition of “ecological security” and the role of cultivated land in coordinating ecological security. Ecological security means the overall level of the integrity and health of an ecological system, especially a state that the ecological system has the lowest risks for survival and development and is not being threatened [81]. Cultivated land ecological security means that the cultivated land ecological system is in a state of maintaining its normal functional structure and meeting the demand of social and economic sustainable development within a certain spatial and temporal dimension. In this state, the cultivated land ecological system has stable, balanced, and abundant natural resources available, and the ecological environment is in a healthy state and plays the role of coordinating the ecological security. It is embodied in two aspects: First, the cultivated land ecological system has a rational structure, performs its function normally, and coordinates the human–land relations in the process of humans utilizing the cultivated land resources. Second, humans can steadily obtain cultivated land resources to meet its need for healthy survival so that the human activities of destroying other ecological systems for satisfying its demand are reduced.

Appendix B

Determination of the soil sampling sites and the principle and method for arranging point locations. Taking typicality and representativeness as a principle, the soil sampling sites are arranged according to the percentages of the cultivated land areas in different parts of the diluvial fan to the total area to guarantee the relative equilibrium of the soil sampling sites in different parts of the diluvial fan. The detailed method is to superpose the present land use map with the soil map to form an assessment unit map as a base map for arranging sampling sites. The soil sampling sites are determined according to the number and areas of polygons, crops, soil types, and topographies to guarantee that each cultivated land assessment unit contains sampling sites. If an assessment unit is relatively large, more sampling sites will be arranged. A total of 150 representative point locations were arranged.

References

  1. Yuan, X.; Shao, Y.; Li, Y.; Liu, Y.; Wang, Y.; Wei, X.; Wang, X.; Zhao, Y. Cultivated land quality improvement to promote revitalization of sandy rural areas along the Great Wall in northern Shaanxi Province, China. J. Rural Stud. 2019, in press. [Google Scholar] [CrossRef]
  2. Liu, Y.; Qiao, L. Innovating system and policy of arable land conservation under the new-type urbanization in China. Econ. Geogr. 2014, 34, 1–6. (In Chinese) [Google Scholar]
  3. Kong, X. China must protect high-quality arable land. Nature 2014, 506, 7. [Google Scholar] [CrossRef] [PubMed]
  4. Zhou, Y.; Li, X.; Liu, Y. Cultivated land protection and rational use in China. Land Use Policy 2021, 106, 105454. [Google Scholar] [CrossRef]
  5. Liu, Y.; Zhang, Y.; Guo, L. Towards realistic assessment of cultivated land quality in an ecologically fragile environment: A satellite imagery-based approach. Appl. Geogr. 2010, 30, 271–281. [Google Scholar] [CrossRef]
  6. Sheng, R.; Chen, M.; Kong, X.; Li, Y.; Tong, Y.; Wang, J.; Li, T.; Lu, M. Conception and evaluation of quality of arable land and strategies for its management. Acta Pedol. Sin. 2012, 49, 1210–1217. (In Chinese) [Google Scholar]
  7. Chen, Y.; Li, B.; Fan, Y.; Sun, C.; Fang, G. Hydrological and water cycle processes of inland river basins in the arid region of Northwest China. J. Arid Land 2019, 11, 161–179. [Google Scholar] [CrossRef] [Green Version]
  8. Thenkabail, P.S.; Hanjra, M.A.; Dheeravath, V.; Gumma, M. A holistic view of global croplands and their water use for ensuring global food security in the 21st century through advanced remote sensing and non-remote sensing approaches. Remote Sens. 2010, 2, 211–261. [Google Scholar] [CrossRef] [Green Version]
  9. Ministry of Land and Resources of China. Main Data Results of National Cultivated Land Quality Grade Updated Evaluation in 2015; Ministry of Land and Resources of China: Beijing, China, 2017. (In Chinese)
  10. Li, W.; Wang, D.; Li, H.; Liu, S. Urbanization-induced site condition changes of peri-urban cultivated land in the black soil region of northeast China. Ecol. Indic. 2017, 80, 215–223. [Google Scholar] [CrossRef]
  11. Liu, X.; Zhao, C.; Song, W. Review of the evolution of cultivated land protection policies in the period following China’s reform and liberalization. Land Use Policy 2017, 67, 660–669. [Google Scholar] [CrossRef]
  12. Zhang, R.; Zheng, H.; Liu, Y. Evaluation on cultivated land ecological security based on the PSR model and matter element analysis. Acta Ecol. Sin. 2013, 33, 5090–5100. (In Chinese) [Google Scholar] [CrossRef]
  13. Guo, R.; Yang, M.; Shen, J. Evaluation for ecological security of cultivated land in Chang-Zhu-Tan region. Trans. Chin. Soc. Agric. Mach. 2016, 47, 193–201. (In Chinese) [Google Scholar]
  14. Burghardt, W.; Heintz, D.; Hocke, N. Soil fertility characteristics and organic carbon stock in soils of vegetable gardens compared with surrounding arable land at the center of the urban and industrial area of Ruhr, Germany. Eurasian Soil Sci. 2018, 51, 1067–1079. [Google Scholar] [CrossRef]
  15. Zhang, H.; Yuan, X.; Xiong, T.; Wang, H.; Jiang, L. Bioremediation of co-contaminated soil with heavy metals and pesticides: Influence factors, mechanisms and evaluation methods. Chem. Eng. J. 2020, 398, 125657. [Google Scholar] [CrossRef]
  16. Liu, S.; Qin, T.; Dong, B.; Shi, X.; Lv, Z.; Zhang, G. The influence of climate, soil properties and vegetation on soil nitrogen in sloping farmland. Sustainability 2021, 13, 1480. [Google Scholar]
  17. Wen, L.; Kong, X.; Zhang, B.; Sun, X.; Xin, Y.; Zhang, P. Construction and application of arable land quality evaluation system based on sustainable development demand. CSAE 2019, 35, 234–242. (In Chinese) [Google Scholar]
  18. Hu, K.; Shi, P. Evaluation and study on quality of cultivated land in gansu province. China Land Sci. 2008, 22, 38–43. [Google Scholar]
  19. Sun, X.; Kong, X.; Wen, L. Evaluation index system of cultivated Land quality and its development trend based on cultivated land Elements. Chin. J. Soil Sci. 2019, 50, 739–747. (In Chinese) [Google Scholar]
  20. Xin, Y.; Fan, S.; Kong, X.; Zhang, B.; Wen, L.; Zhang, Q. Evaluation of cultivated land quality based on four quality dimensions. Resour. Sci. 2018, 40, 737–747. (In Chinese) [Google Scholar]
  21. Liu, L. The Discipline of Land Resources, 5th ed.; China Agricultural University Press: Beijing, China, 2010; pp. 1–4. (In Chinese) [Google Scholar]
  22. Ma, Q.; Dong, B.; Xu, W.; Cai, L.; Wu, J. Evaluation of cultivated land quality and analysis of soil nutrients and salinization in arid areas: Taking Minqin Oasis as an example. Arid Land Geogr. 2021, 44, 214–524. (In Chinese) [Google Scholar]
  23. Kong, X.; Zhang, B.; Wen, L.; Hu, Y.; Lei, M.; Yao, J.; Xin, Y. Theoretical framework and research trends of cultivated land quality based on elements-process-function. China Land Sci. 2018, 32, 14–20. (In Chinese) [Google Scholar]
  24. Wei, X.; Wang, S.; Yuan, X.; Wang, X.; Zhang, B. Spatial and temporal changes and its variation of cultivated land quality in Shanxi province. CSAE 2018, 34, 240–248. (In Chinese) [Google Scholar]
  25. Zhao, C.; Zhou, Y.; Jiang, J.; Xiao, P.; Wu, H. Spatial characteristics of cultivated land quality accounting for ecological environmental condition: A case study in hilly area of northern Hubei province, China. Sci. Total Environ. 2021, 774, 145765. [Google Scholar] [CrossRef]
  26. Tan, Y.; Chen, H.; Lian, K.; Yu, Z. Comprehensive evaluation of cultivated land quality at county scale: A case study of Shengzhou, Zhejiang province, China. Int. J. Environ. Res. Public Health 2020, 17, 1169. [Google Scholar] [CrossRef] [Green Version]
  27. Tuson, M.; Yap, M.; Kok, M.R.; Murray, K.; Turlach, B.; Whyatt, D. Incorporating geography into a new generalized theoretical and statistical framework addressing the modifiable areal unit problem. Int. J. Health Geogr. 2019, 18, 6. [Google Scholar] [CrossRef] [PubMed] [Green Version]
  28. Lee, S.-I.; Lee, M.; Chun, Y.; Griffith, D.A. Uncertainty in the effects of the modifiable areal unit problem under different levels of spatial autocorrelation: A simulation study. Int. J. Geogr. Inf. Sci. 2019, 33, 1135–1154. [Google Scholar] [CrossRef]
  29. Moat, J.; Bachman, S.P.; Field, R.; Boyd, D.S. Refining area of occupancy to address the modifiable areal unit problem in ecology and conservation. Conserv. Biol. 2018, 32, 1278–1289. [Google Scholar] [CrossRef]
  30. Hennerdal, P.; Nielsen, M.M. A multiscalar approach for identifying clusters and segregation patterns that avoids the modifiable areal unit problem. Ann. Am. Assoc. Geogr. 2017, 107, 555–574. [Google Scholar] [CrossRef]
  31. Taylor, C.; Gorard, S.; Fitz, J. The modifiable areal unit problem: Segregation between schools and levels of analysis. Int. J. Soc. Res. Methodol. 2003, 6, 41–60. [Google Scholar] [CrossRef]
  32. Nelson, J.K.; Brewer, C.A. Evaluating data stability in aggregation structures across spatial scales: Revisiting the modifiable areal unit problem. Cartogr. Geogr. Inf. Sci. 2017, 44, 35–50. [Google Scholar] [CrossRef]
  33. Lechner, A.M.; Langford, W.T.; Jones, S.D.; Bekessy, S.A.; Gordon, A. Investigating species—Environment relationships at multiple scales: Differentiating between intrinsic scale and the modifiable areal unit problem. Ecol. Complex. 2012, 11, 91–102. [Google Scholar] [CrossRef]
  34. Chen, Y.; Li, Z.; Fan, Y.; Wang, H.; Fang, G. Research progress on the impact of climate change on water resources in the arid region of Northwest China. Acta Geogr. Sin. 2014, 69, 1295–1304. (In Chinese) [Google Scholar]
  35. Chen, Y.; Yang, Q.; Luo, Y.; Shen, Y.; Pan, X.; Li, L.; Li, Z. Ponder on the issues of water resources in the arid region of northwest China. Arid Land Geogr. 2012, 35, 1–9. (In Chinese) [Google Scholar]
  36. Wang, H.; Chen, Y.; Xun, S.; Lai, D.; Fan, Y.; Li, Z. Changes in daily climate extremes in the arid area of northwestern China. Theor. Appl. Climatol. 2013, 112, 15–28. [Google Scholar] [CrossRef]
  37. Wu, M.; Wang, H.; Sun, G.; Xu, C. Formation and risk analysis of meteorological disasters in Xinjiang. Arid Land Geogr. 2016, 39, 1212–1220. (In Chinese) [Google Scholar]
  38. Natural Resources Department of Xinjiang. Report on Monitoring Cultivated Land Quality Grade of Xinjiang; Natural Resources Department of Xinjiang: Urumchi, China, 2018. (In Chinese)
  39. Gao, G. Low hilly land extraction method based on ArcGIS. Geomat. Spat. Inf. Technol. 2014, 37, 113–114. (In Chinese) [Google Scholar]
  40. Liu, R.; Wang, H.; Quan, F. The contributing ratio of natural and social-economic factors to the quality of cultivated land. Chin. J. Soil Sci. 2005, 36, 289–294. (In Chinese) [Google Scholar]
  41. Gu, Z.; Shao, X.; Qian, W.; Huang, C.; Lu, J.; Li, Y.; Huang, B.; Zhang, H. Quantitative evaluation of soil productivity of farmland in Zhangjiagang city Jiangsu province and its significance. Acta Pedol. Sin. 2007, 44, 354–359. (In Chinese) [Google Scholar]
  42. Störrle, M.; Hagedorn, L.; Yurtaev, A.; Brauckmann, H.-J.; Broll, G. Soil structure of arable and non-arable land in the Western Siberian Grain Belt in Russia—Application of the soil fingerprint code for topsoil characterization. J. Plant. Nutr. Soil Sci. 2016, 179, 510–519. [Google Scholar] [CrossRef]
  43. Liu, L.; Zhou, D.; Chang, X.; Lin, Z. A new grading system for evaluating China’s cultivated land quality. Land Degrad. Dev. 2020, 31, 1482–1501. [Google Scholar] [CrossRef]
  44. Shi, S.; Chen, Y.; Yao, Y.; Li, Z.; He, Y. Impact assessment of cultivated land change upon crain productive capacity in Northeast China. Acta Geogr. Sin. 2008, 6, 574–586. (In Chinese) [Google Scholar]
  45. Shi, S.; Chen, Y.; Yao, Y.; Li, Z.; He, Y. Assessing natural quality and use quality of cultivated land in Northeast China. Resour. Sci. 2008, 30, 378–384. (In Chinese) [Google Scholar]
  46. General Administration of Quality Supervision, Inspection and Quarantine of the People’s Republic of China; Standardisation Administration of the People’s Republic of China. Regulation for Gradation on Agriculture Land Quality; China Standard Press: Beijing, China, 2012. (In Chinese) [Google Scholar]
  47. General Administration of Quality Supervision, Inspection and Quarantine of the People’s Republic of China; Standardisation Administration of the People’s Republic of China. Rules for Grading of Agricultural Land; China Standard Press: Beijing, China, 2012. (In Chinese) [Google Scholar]
  48. General Administration of Quality Supervision, Inspection and Quarantine of the People’s Republic of China; Standardisation Administration of the People’s Republic of China. Cultivated Land Quality Grade; China Standard Press: Beijing, China, 2012. (In Chinese) [Google Scholar]
  49. Yang, P.; Xia, J.; Zhang, Y.; Zhan, C.; Cai, W.; Zhang, S.; Wang, W. Quantitative study on characteristics of hydrological drought in arid area of Northwest China under changing environment. J. Hydrol. 2021, 597, 126343. [Google Scholar] [CrossRef]
  50. Bie, Q.; Xie, Y. The constraints and driving forces of oasis development in arid region: A case study of the Hexi Corridor in northwest China. Sci. Rep. 2020, 10, 17708. [Google Scholar] [CrossRef] [PubMed]
  51. Zhang, W.-Q.; Xi, Z.-L. Application of Delphi method in screening of indexes for measuring soil pollution value evaluation. Environ. Sci. Pollut. Res. 2021, 28, 6561–6571. [Google Scholar] [CrossRef]
  52. Liang, R.; Song, S.; Shi, Y.; Shi, Y.; Lu, Y.; Zheng, X.; Xu, X.; Wang, Y.; Han, X. Comprehensive assessment of regional selenium resources in soils based on the analytic hierarchy process: Assessment system construction and case demonstration. Sci. Total Environ. 2017, 605–606, 618–625. [Google Scholar] [CrossRef] [PubMed]
  53. Li, S.; Cai, Y. Some scaling issues of geography. Geogr. Res. 2005, 24, 11–18. (In Chinese) [Google Scholar]
  54. Meng, B.; Wang, J. A review on the methodology of scaling with geo-data. Acta Geogr. Sin. 2005, 60, 277–288. (In Chinese) [Google Scholar]
  55. Crang, M.; Cook, I. Concepts and Techniques in Modern Geography; Environmental Publications, University of East Anglia: Norwich, UK, 1995. [Google Scholar]
  56. Qi, C.; Diao, J.; Qiu, L. On estimating model in feature selection with cross-validation. IEEE Access 2019, 7, 33454–33463. [Google Scholar] [CrossRef]
  57. Bergmeir, C.; Hyndman, R.J.; Koo, B. A note on the validity of cross-validation for evaluating autoregressive time series prediction. Comput. Stats Data Anal. 2018, 120, 70–83. [Google Scholar] [CrossRef]
  58. Shi, Y.; Duan, W.; Fleskens, L.; Li, M.; Hao, J. Study on evaluation of regional cultivated land quality based on resource-asset-capital attributes and its spatial mechanism. Appl. Geogr. 2020, 125, 102284. [Google Scholar] [CrossRef]
  59. Cheng, Q.; Guo, Y.; Wang, W.; Hao, S. Spatial variation of soil quality and pollution assessment of heavy metals in cultivated soils of Henan Province, China. Chem. Speciat. Bioavailab. 2014, 26, 184–190. [Google Scholar] [CrossRef] [Green Version]
  60. Kuang, L.; Ye, Y.; Zhao, X.; Guo, X.; Xie, W. Evaluation on influence of land consolidation project on cultivated land quality based on agricultural land classification correction method. CSAE 2016, 32, 198–205. (In Chinese) [Google Scholar]
  61. Qian, F.; Wang, Q.; Bian, Z.; Dong, X.; Zheng, L. Farmland quality evaluation and site assessment in Lingyuan city. CSAE 2011, 27, 325–329. (In Chinese) [Google Scholar]
  62. Sun, C.; Bi, C.; Chen, Z.; Wang, D.; Zhang, C.; Sun, Y.; Yu, Z.; Zhou, D. Assessment on environmental quality of heavy metals in agricultural soils of Chongming Island, Shanghai City. J. Geogr. Sci. 2010, 20, 137–149. [Google Scholar] [CrossRef]
  63. Wang, W.; Wang, Y.; Zhao, B. Quality, environment and system construction of ultivated land in Liooning province. Chin. J. Soil Sci. 2003, 4, 362–365. (In Chinese) [Google Scholar]
  64. Wang, M.; Tian, F.; He, X.; Bao, Y. Cultivated land quality evaluation in the Three Gorges reservoir area. Mt. Res. 2017, 35, 556–565. (In Chinese) [Google Scholar]
  65. Huang, X.; Li, Y.; Feng, J.; Wang, J.; Wang, Z.; Wang, S.; Zhang, Y. Climate characteristics of precipitation and extreme drought events in Northwest China. Acta Ecol. Sin. 2015, 35, 1359–1370. (In Chinese) [Google Scholar]
  66. Jia, B.; Ci, L.; Han, D.; Yang, J. Research progress and prospect on the monitoring and early warning and mitigation technology of meteorological drought disaster in northwest China. Adv. Earth Sci. 2000, 30, 381–388. (In Chinese) [Google Scholar]
  67. Qi, Y.; Darilek, J.L.; Huang, B.; Zhao, Y.; Sun, W.; Gu, Z. Evaluating soil quality indices in an agricultural region of Jiangsu Province, China. Geoderma 2009, 149, 325–334. [Google Scholar] [CrossRef]
  68. Song, X.; Zhu, O.; Li, Y.; Li, F. Cultivated land use change in China, 1999–2007: Policy development perspectives. J. Geogr. Sci. 2012, 22, 1061–1078. [Google Scholar] [CrossRef]
  69. Qin, Y.; Zhao, G.; Dong, C.; Tang, X.; Xu, G.; Han, J. Comprehensive evaluation and spatio-temporal variation analysis of cultivated land quality at town scale. J. Nat. Resour. 2010, 25, 454–464. (In Chinese) [Google Scholar]
  70. Kolaczyk, E.D.; Huang, H. Multiscale statistical models for hierarchical spatial aggregation. Geogr. Anal. 2001, 33, 95–118. [Google Scholar] [CrossRef]
  71. Qi, L.; Bai, Y. MAUP effects on the detection of spatial hot spots in socio-economic statistical data. Acta Geogr. Sin. 2012, 67, 1317–1326. (In Chinese) [Google Scholar]
  72. Chen, J.; Zhang, Y.; Yu, J. Effect of MAUP in spatial autocorrelation. Acta Geogr. Sin. 2011, 66, 1597–1606. (In Chinese) [Google Scholar]
  73. Ma, H.; Yu, T.; Yang, Z.; Hou, Q.; Zeng, Q.; Wang, R. Spatial interpolation methods and pollution assessment of heavy metals of soil in typical areas. Environ. Sci. 2018, 39, 4684–4693. (In Chinese) [Google Scholar]
  74. Xiao, L.; Luo, G.; Chen, X.; Xu, W. Study on the temporal and spatial change of shallow groundwater beneath the alluvial-diluvial plain oasis in arid regions. Arid Land Geogr. 2005, 2, 225–228. (In Chinese) [Google Scholar]
  75. Gu, F.; Zhang, Y.; Pan, X.; Chu, Y.; Shi, Q. Interaction of land use change and spatial and temporal dynamics of soil moisture and salinity in arid land. Acta Geogr. Sin. 2003, 58, 845–853. (In Chinese) [Google Scholar]
  76. Chen, W.; Kong, X.; Liao, Y.; Wang, X.; Song, F.; Weng, L.; Zhang, B. Evaluation of cultivated land quality in the loess plateau: A case study of Yanchuan county, Shaanxi province. Res. Soil Water Conserv. 2021, 28, 375–381. (In Chinese) [Google Scholar]
  77. Xue, R.; Wang, C.; Liu, M.; Zhang, D.; Li, K.; Li, N. A new method for soil health assessment based on analytic hierarchy process and meta-analysis. Sci. Total Environ. 2018, 650, 2771–2777. [Google Scholar] [CrossRef] [PubMed]
  78. Shao, W.; Guan, Q.; Tan, Z.; Luo, H.; Ma, Y. Application of BP-ANN model in evaluation of soil quality in the arid area, northwest China. Soil Tillage Res. 2021, 208, 104907. [Google Scholar] [CrossRef]
  79. Zhao, J.; Zhang, H.; Wang, Y.; Qiao, Z.; Hou, G. Research on the quality evaluation of cultivated land in provincial area based on AHP and GIS: A case study in Jilin province. Chin. J. Soil Sci. 2012, 43, 70–75. (In Chinese) [Google Scholar]
  80. Chen, C.; Lin, C. Cultivated land quality assessment and protection zoning in Southern Jiangsu. Resour. Environ. Yangtze Basin 2016, 25, 1860–1869. (In Chinese) [Google Scholar]
  81. Xiao, D.; Chen, W.; Guo, F. On the basic concepts and contents of ecological security. Chin. J. Appl. Ecol. 2002, 13, 354–358. (In Chinese) [Google Scholar]
Figure 1. Location of the diluvial fan terrain and distribution of the sampling points in the research region.
Land 10 00896 g001
Figure 2. Schematic diagram for cultivated land before and after aggregation. (a) Small-scale cultivated land before aggregation. (b) Large-scale cultivated land after aggregation.
Land 10 00896 g002
Figure 3. Cultivated land quality evaluation results of different scale cultivated land evaluation unit and spatial interpolation methods. (a) Cultivated land quality evaluation results based on small-scale cultivated land and the Inverse Distance Weight matrix method. (b) Cultivated land quality evaluation results based on large-scale cultivated land and the Inverse Distance Weight matrix method. (c) Cultivated land quality evaluation results based on small-scale cultivated land and the Ordinary Kriging method. (d) Cultivated land quality evaluation result based on large-scale cultivated land and the Ordinary Kriging method. (e) Cultivated land quality evaluation results based on small-scale cultivated land and the Spline Functions method. (f) Cultivated land quality evaluation results based on large-scale cultivated land and the Spline Functions method.
Land 10 00896 g003
Figure 4. Spatial distribution of the cultivated land quality and three dimensions index grades. (a) Cultivated land quality evaluation results. (b) Soil property dimension evaluation results. (c) Farming condition dimension evaluation results. (d) Natural environment condition dimension evaluation results.
Land 10 00896 g004
Figure 5. Spatial distribution of the cultivated land quality influential factors. (a) Soil bulk density, (b) Soil pH value, (c) Organic matter, (d) Quantity of straw returning to the field, (e) Irrigation water source, (f) Water delivery method, (g) Diluvial fan part, (h) Underground water depth, and (i) Landform pattern.
Land 10 00896 g005
Figure 6. Spatial distribution of the influential factors at the piedmont slope. (a) Soil salinization degree, (b) Available iron, (c) Available manganese, (d) Membrane tectoria degree, and (e) Farming distance.
Land 10 00896 g006
Figure 7. Spatial distribution of the influential factors at the upper part of the diluvial fan. (a) Available iron, (b) Available manganese, (c) Protection forest system, and (d) Irrigation method.
Land 10 00896 g007
Figure 8. Spatial distribution of the influential factors at the middle part of the diluvial fan. (a) Rapidly available potassium, (b) Total nitrogen, (c) Available manganese, and (d) Average rainfall all year round.
Land 10 00896 g008
Figure 9. Spatial distribution of the influential factors at the lower part of the diluvial fan. (a) Soil total salt content, (b) Rapidly available potassium, (c) Total nitrogen, and (d) Drainage conditions.
Land 10 00896 g009
Figure 10. Spatial distribution of the influential factors at the edge of the diluvial fan. (a) Soil total salt content, (b) Rapidly available potassium, (c) Total nitrogen, (d) Irrigation guarantee rate, (e) Drainage conditions, and (f) Altitude.
Land 10 00896 g010
Figure 11. Cultivated land quality of each part of the diluvial fan and the average rank of three dimensions.
Land 10 00896 g011
Figure 12. Area proportion of the cultivated land quality at different parts of the diluvial fan.
Land 10 00896 g012
Figure 13. Cultivated land quality and three dimensions index grade changes at different parts of the diluvial fan.
Land 10 00896 g013
Figure 14. Cultivated land quality improvement directions and measures.
Land 10 00896 g014
Table 1. Cultivated land quality evaluation index system and weight identification.
DimensionFirst Grade IndexSecond Grade IndexIndex WeightIndex Property
Soil properties (S)Soil physical and chemical propertiesEffective soil layer thickness0.0312+
Soil salinization degree0.1060
Soil barrier layer depth0.0815±
Soil capacity0.0528±
Surface soil texture0.0395±
Soil pH value0.1029
Total soil salt0.0862
Soil nutrient statusOrganic matter0.0913+
Rapidly available phosphorus0.0251+
Rapidly available potassium0.0194+
Total nitrogen0.0677+
Available copper0.0158+
Available iron0.0892+
Available zinc0.0368+
Available manganese0.0956+
Available boron0.0473+
Available molybdenum0.0119+
Farming conditions (C)Management conditionsAgricultural infrastructure matching degree a0.1265+
Protection forest system b0.0837+
Quantity of straw returning to field c0.0633+
Membrana tectoria degree d0.1171±
Farming distance e0.1094±
Irrigation water conditionsIrrigation guarantee rate f0.1391+
Drainage conditions g0.0656+
Irrigation method h0.0958±
Irrigation water source i0.1267±
Water delivery method j0.0729±
Natural environment conditions (N)Geographical conditionsPart of diluvial fan0.1874±
Altitude0.0816±
Slope gradient0.1420
Underground water depth0.2153±
Landform pattern0.1237±
Climate conditionsAverage rainfall capacity all year round0.1667+
≥10 °C accumulated temperature0.0833+
Note: a: Agricultural infrastructure supporting degree mainly refers to the completeness of the infrastructure, such as the agricultural machinery service, excluding farmland irrigation and water conservancy and protection forestry establishment, the sales of agricultural materials, meteorological service, roads, power grid, and communication. b: The shelter forest system means shelter forests created for improving the farmland microclimate and guaranteeing high and stable yields of crops. c: The straw turnover quantity means the weight of straws not suitable for direct use as fodder directly applied to the soil or applied to the soil after being thoroughly decomposed through piling. d: Filming degree means the universality of using agricultural plastic films in the farming process and the degree of covering the Earth’s surface. e: Farming distance means the average distance for a farmer to reach his field. The closer the distance is, the higher the farming convenience, accessibility, and efficiency. f: The occurring probability of the years in which the irrigation water capacity expectancy can be fully satisfied among the years of irrigation. g: Drainage condition means the soundness degree of a farmland drainage system and the level of its drainage capacity. The sounder a drainage system and the higher the drainage capacity are, the better the drainage condition is and vice versa. h: Irrigation method means different farmland irrigation methods, such as trickle irrigation, spray irrigation, furrow irrigation, border irrigation, and flood irrigation. i: Irrigation water source means underground water, rivers, reservoirs, or other water sources used for irrigating farmlands. Different water sources have different influences on the environment. j: Water delivery method means the way to deliver farmland irrigation water, for example, by a fixed pipeline, U-shaped canal, impermeable channel, or mud channel. Different water delivery methods will lead to different degrees of saving water resources and different delivery efficiencies. “+” means that the index has a positive influence on the cultivated land quality, “−” means that the index has a negative influence on the cultivated land quality, and “±” means that the index has both a positive and negative influence on the cultivated land quality.
Table 2. Cross validation table of computed values of different interpolation methods with different cultivated land scales.
IndexError Validation IndexBefore Aggregation (Small-Scale)After Aggregation (Large-Scale)
IDWOKSplineIDWOKSpline
Rapidly available phosphorusME−19.036121.526137.464518.449713.8796−48.7484
RMSE60.197668.0717118.473358.343343.8914154.1560
IP57.108464.5785112.393655.349341.6390146.2452
Rapidly available potassiumME−17.1459−26.754146.0296−9.8258−1.8014−74.6736
RMSE29.394735.439961.786418.92276.529495.9181
IP23.876023.242341.216916.17176.276060.2010
Total nitrogenME−13.9697−0.7170−2.49491.6863−0.6422−21.4630
RMSE44.17622.27677.88985.33252.030867.8721
IP41.90922.15982.80885.05891.926664.3891
Available copperME−1.0717−0.27620.39090.12111.1914−6.5553
RMSE3.38900.87361.23640.38303.767720.7298
IP3.21510.82871.17290.36333.574319.6660
Available ironME1.83150.1600−1.85990.74410.81864.4083
RMSE5.79180.50605.88152.35332.588713.9404
IP5.49460.48005.57972.23252.585113.2250
Available zincME2.13662.43681.91412.63581.8035−1.5272
RMSE6.75677.70606.05298.33545.70324.8295
IP6.40997.31065.74237.90765.41054.5817
Available manganeseME2.8807−1.2856−1.9702−0.3244−0.17992.8512
RMSE9.10974.06576.23041.02590.56919.0165
IP8.64223.85705.91070.97320.53998.5538
Available boronME0.23980.14630.07540.36530.43521.0869
RMSE0.75850.46260.23861.15541.37633.4373
IP0.71960.43890.22631.09611.30573.2609
Available molybdenumME−16.5941−10.4829−29.9245−7.3374−5.1914−63.4256
RMSE52.475233.150094.629723.202916.4166200.5694
IP49.782431.448889.773722.012215.5742190.2769
Soil bulk densityME0.92501.0312−1.39021.29840.5555−2.6013
RMSE2.92523.26114.39634.10591.75678.2261
IP2.77513.09384.17073.89521.66667.8039
Note: Mean Error (ME); Root Mean Square Error (RMSE); Index of imprecision (IP).
Table 3. Cross-validation table of different spatial interpolation methods of three dimensions with large-scale cultivated land.
DimensionError Validation IndexIDWOKSpline
Soil properties indexME−0.0451−0.00560.0182
RMSE0.14270.01780.0576
IP0.13540.01680.0546
Farming conditions indexME−0.01670.0215−0.0134
RMSE0.05300.06820.0424
IP0.05030.06470.0402
Natural environment conditions indexME0.05210.02150.0274
RMSE0.16480.06820.0866
IP0.15630.06470.0822
Cultivated land quality indexME−0.00440.00680.0096
RMSE0.01410.02160.0305
IP0.01330.02050.0290
Note: Mean Error (ME); Root Mean Square Error (RMSE); Index of imprecision (IP).
Publisher’s Note: MDPI stays neutral with regard to jurisdictional claims in published maps and institutional affiliations.

