Article

Exploring the Ecological Climate Effects of Different Land Use Changes in the Yangtze River Basin from 2000 to 2020

1
Key Laboratory of Geospatial Technology for the Middle and Lower Yellow River Regions, Ministry of Education, College of Geography and Environmental Science, Henan University, Kaifeng 475004, China
2
Key Laboratory of Integrative Prevention of Air Pollution and Ecological Security of Henan Province, Kaifeng 475004, China
*
Author to whom correspondence should be addressed.
Land 2022, 11(10), 1636; https://doi.org/10.3390/land11101636
Submission received: 1 August 2022 / Revised: 18 September 2022 / Accepted: 20 September 2022 / Published: 23 September 2022

Abstract

:
Land use/cover change (LUCC) can change the energy balance of the earth’s surface by altering its biophysical properties (surface albedo), and it also has an important impact on the ecological climate. In this paper, using surface energy balance algorithms, the differences in energy balance and the resulting ecoclimatic effects under different land use changes in the Yangtze River basin from 2000 to 2020 were analyzed. The results showed that: (1) from 2000 to 2020, the energy uptake of surface net radiation ( R s ) in the Yangtze River basin showed a downward trend with increasing intensity of impact from human activities. This indicated that human activities could weaken the positive trend of R s uptake and increase the warming effect; (2) R s and latent heat flux (LHF) showed an upward trend, which was more obvious in natural and semi-natural regions and mixed pixel regions; (3) LHF R s energy uptake showed a decreasing trend, indicating that the effect of R s on surface absorbed energy was greater than that of LHF, which was more significant in old urban areas and urban expansion areas. This research highlights the variation in the surface energy budgets of the five land use types with different levels of human activities. This will provide a theoretical reference for future land planning and management. It will also provide a theoretical basis for judging climate change trends and urban heat island effects in the Yangtze River basin from the perspective of bio-geophysics.

1. Introduction

As an important branch of the land surface process, the surface radiation budget and energy balance process are the source of ground energy and the basis of material and energy exchange, which reflects the role of energy bonds during the coupling of the earth and the atmosphere [1]. The surface energy process is primarily characterized by the balance of surface radiation and thermal radiation in the exchange of energy on the land surface, and it plays a key role in ecological climate and urban planning [2,3]. Furthermore, the process of energy conversion between the land and air is affected by natural and human activities, which is reflected in the energy cycle in the land, plants, and the atmosphere [4]. This means that the changes in land cover could affect climate by altering the physical properties of the surface (surface albedo, roughness, and specific emissivity), causing changes in the energy balance at the surface [5,6].
Studying the driving mechanisms and internal influences of land cover change on surface albedo and surface temperature can help to explore the relationship between land use change and biophysical factors, especially at the regional scale. However, the surface energy balance mechanism is complex. For example, the air temperature can be controlled by many energy-balance processes, such as the albedo, emissivity, solar radiation, the distribution of latent heat, and sensible heat flux [7,8]. In theory, changing the energy balance process can bring the same or more significant climate effects, such as land use change which can bring biophysical changes (albedo) directly, as well as effective net radiation, which includes sensible heat flux, latent heat flux (LHF) and surface heat flux. This can affect the surface radiation budget [9,10].
Apart from the regional background climate, studies have shown that at the global average level of evapotranspiration is equivalent to the total precipitation on the surface [11,12]. This indicates that when vegetation increases the absorption of solar radiation, with the additional energy distributed to evaporation, a cooling effect may occur [13]. Moreover, due to high spatial heterogeneity, the parameters related to biophysical factors (albedo) could be more complicated, which might lead to warming or cooling [14,15]. In order to measure the level of warming or cooling, land surface temperature (LST) is always selected in the study of global and regional land surface processes and climate models [16]. It can be used to reflect the changes of material and energy balance between the ground and the atmosphere, which causes a chain reaction between the spatial and temporal patterns of temperature, precipitation, and vegetation [17].
Furthermore, the interaction between land and air is achieved by regulating the energy exchange at the interface, which is a key driver of the earth’s climate system [18]. Eco-climatic effects could be considered as a manifestation of various climate-influencing ecological processes [19] presented through the interaction of various ecological factors (e.g., temperature and rainfall). At the same time, ecosystems also can affect climate change in a variety of ways, such as land use change [20]. Moreover, the land use/cover change also changes accordingly with the impact of human activities, such as urban expansion and afforestation, with subsequent effects on the ecological and climatic environment of the region to varying degrees.
Under the condition that the level of remote sensing technology has gradually improved, it is convenient to obtain information regarding the earth’s radiation budget and to determine the relationship between vegetation structure observation and surface radiation [21]. On this basis, it is conducive to explore the internal relationship between LUCC and the energy budget. Furthermore, it is important to understand the biophysical mechanisms of surface energy balance, urban heat island, and climate system [22]. Based on the surface energy balance algorithm, this paper took the Yangtze River basin as the study area, and various radiation factors (long-wave radiation, short-wave radiation, and net radiation), LHF and other relevant variables affecting the surface energy balance were calculated to explore the ecological climate effects of different land use changes.
The Yangtze River is the longest river in China, with a total length of 6357 km. It spans three economic regions in southwest, central, and eastern China. These economic zones are also areas of rapid social and economic growth in China [23]. Currently, eco-climate transformation is the most active natural factor in the study area, as well as hydrology and climate, which are inextricably linked. Therefore, it is imperative to fully and promptly grasp the evolution law and process of eco-climate change in the Yangtze River basin at different time and space scales [24]. In recent years, it has taken a series of actions to carry out “ecological priority and green development” in the Yangtze River basin [25]. Thus, proper land use planning can play an essential function in the human social development in this area and can play a positive role in ecological climate protection [26,27,28,29]. The results of this study can provide guidance for ecoclimatic assessment and land management aspects of the Yangtze River basin [30].

2. Materials and Methods

2.1. Study Area

The Yangtze River Basin is an important ecological screen and agricultural production base in China. It originates from the highest peak (in a mountain range) of the Tanggula Mountain in the Qinghai-Tibet Plateau and covers an area of over 1.8 × 10⁶ km². From Figure 1, the main river in the research area flows through Qinghai, Tibet, Sichuan, Yunnan, Chongqing, Hubei, Hunan, Jiangxi, Anhui, and Jiangsu. The topography of the basin is complex and diverse, showing a 3-level ladder-like distribution trend of high northwest and low southeast. Furthermore, this basin spans the Qinghai–Tibet alpine region, southwest tropical monsoon climate zone, and sub-tropical monsoon climate zone in central China, from west to east, and the annual average temperature basically decreases from east to west. The Yangtze River Basin is located in different climatic zones with different altitudes, and the geographical differentiation is so significant. However, it is distributed in the same latitude zone, which has similar levels of illumination and radiation on the whole. Therefore, it is very appropriate to compare the influence of land use change with the surface energy balance.

2.2. Data Resource

Land use products were obtained from the satellite observation data of ESA Climate Change Initiative-Land Cover (http://maps.elie.ucl.ac.be/CCI/viewer/download.php, visited on 26 March 2022). Air temperature data were from the National Meteorological Information Center (http://data.cma.cn/data/detail/dataCode/A.0013.0001.html, visited on 26 March 2022), and we spatially interpolated and visualized the temperature based on the inverse distance weighted (IDW) method, and transformed this into raster data format uniformly for processing. Solar radiation data was obtained from the Laboratory of Environmental Ecology, Seoul National University (https://www.environment.snu.ac.kr/bess-rad, visited on 26 March 2022), and solar radiation data in 2020 were from ERA5 hourly data on single levels of ECMWF (https://www.ecmwf.int/, visited on 28 March 2022). The water vapor pressure data was obtained from ECMWF (https://www.ecmwf.int/en/forecasts/datasets, visited on 26 March 2022), and the data format was the network common data format, which was uniformly converted to raster data format. The MODIS data products (albedo, temperature, latent heat flux, and emissivity) were from National Aeronautics and Space Administration (NASA) (https://lpdaac.usgs.gov/data/, visited on 26 March 2022). As shown in Table 1, detailed information of MODIS variables was illustrated. During the process of data calculation, all the data had a uniform resolution and were converted into 1 km.

2.3. Research Methodology

2.3.1. Land Use Reclassification

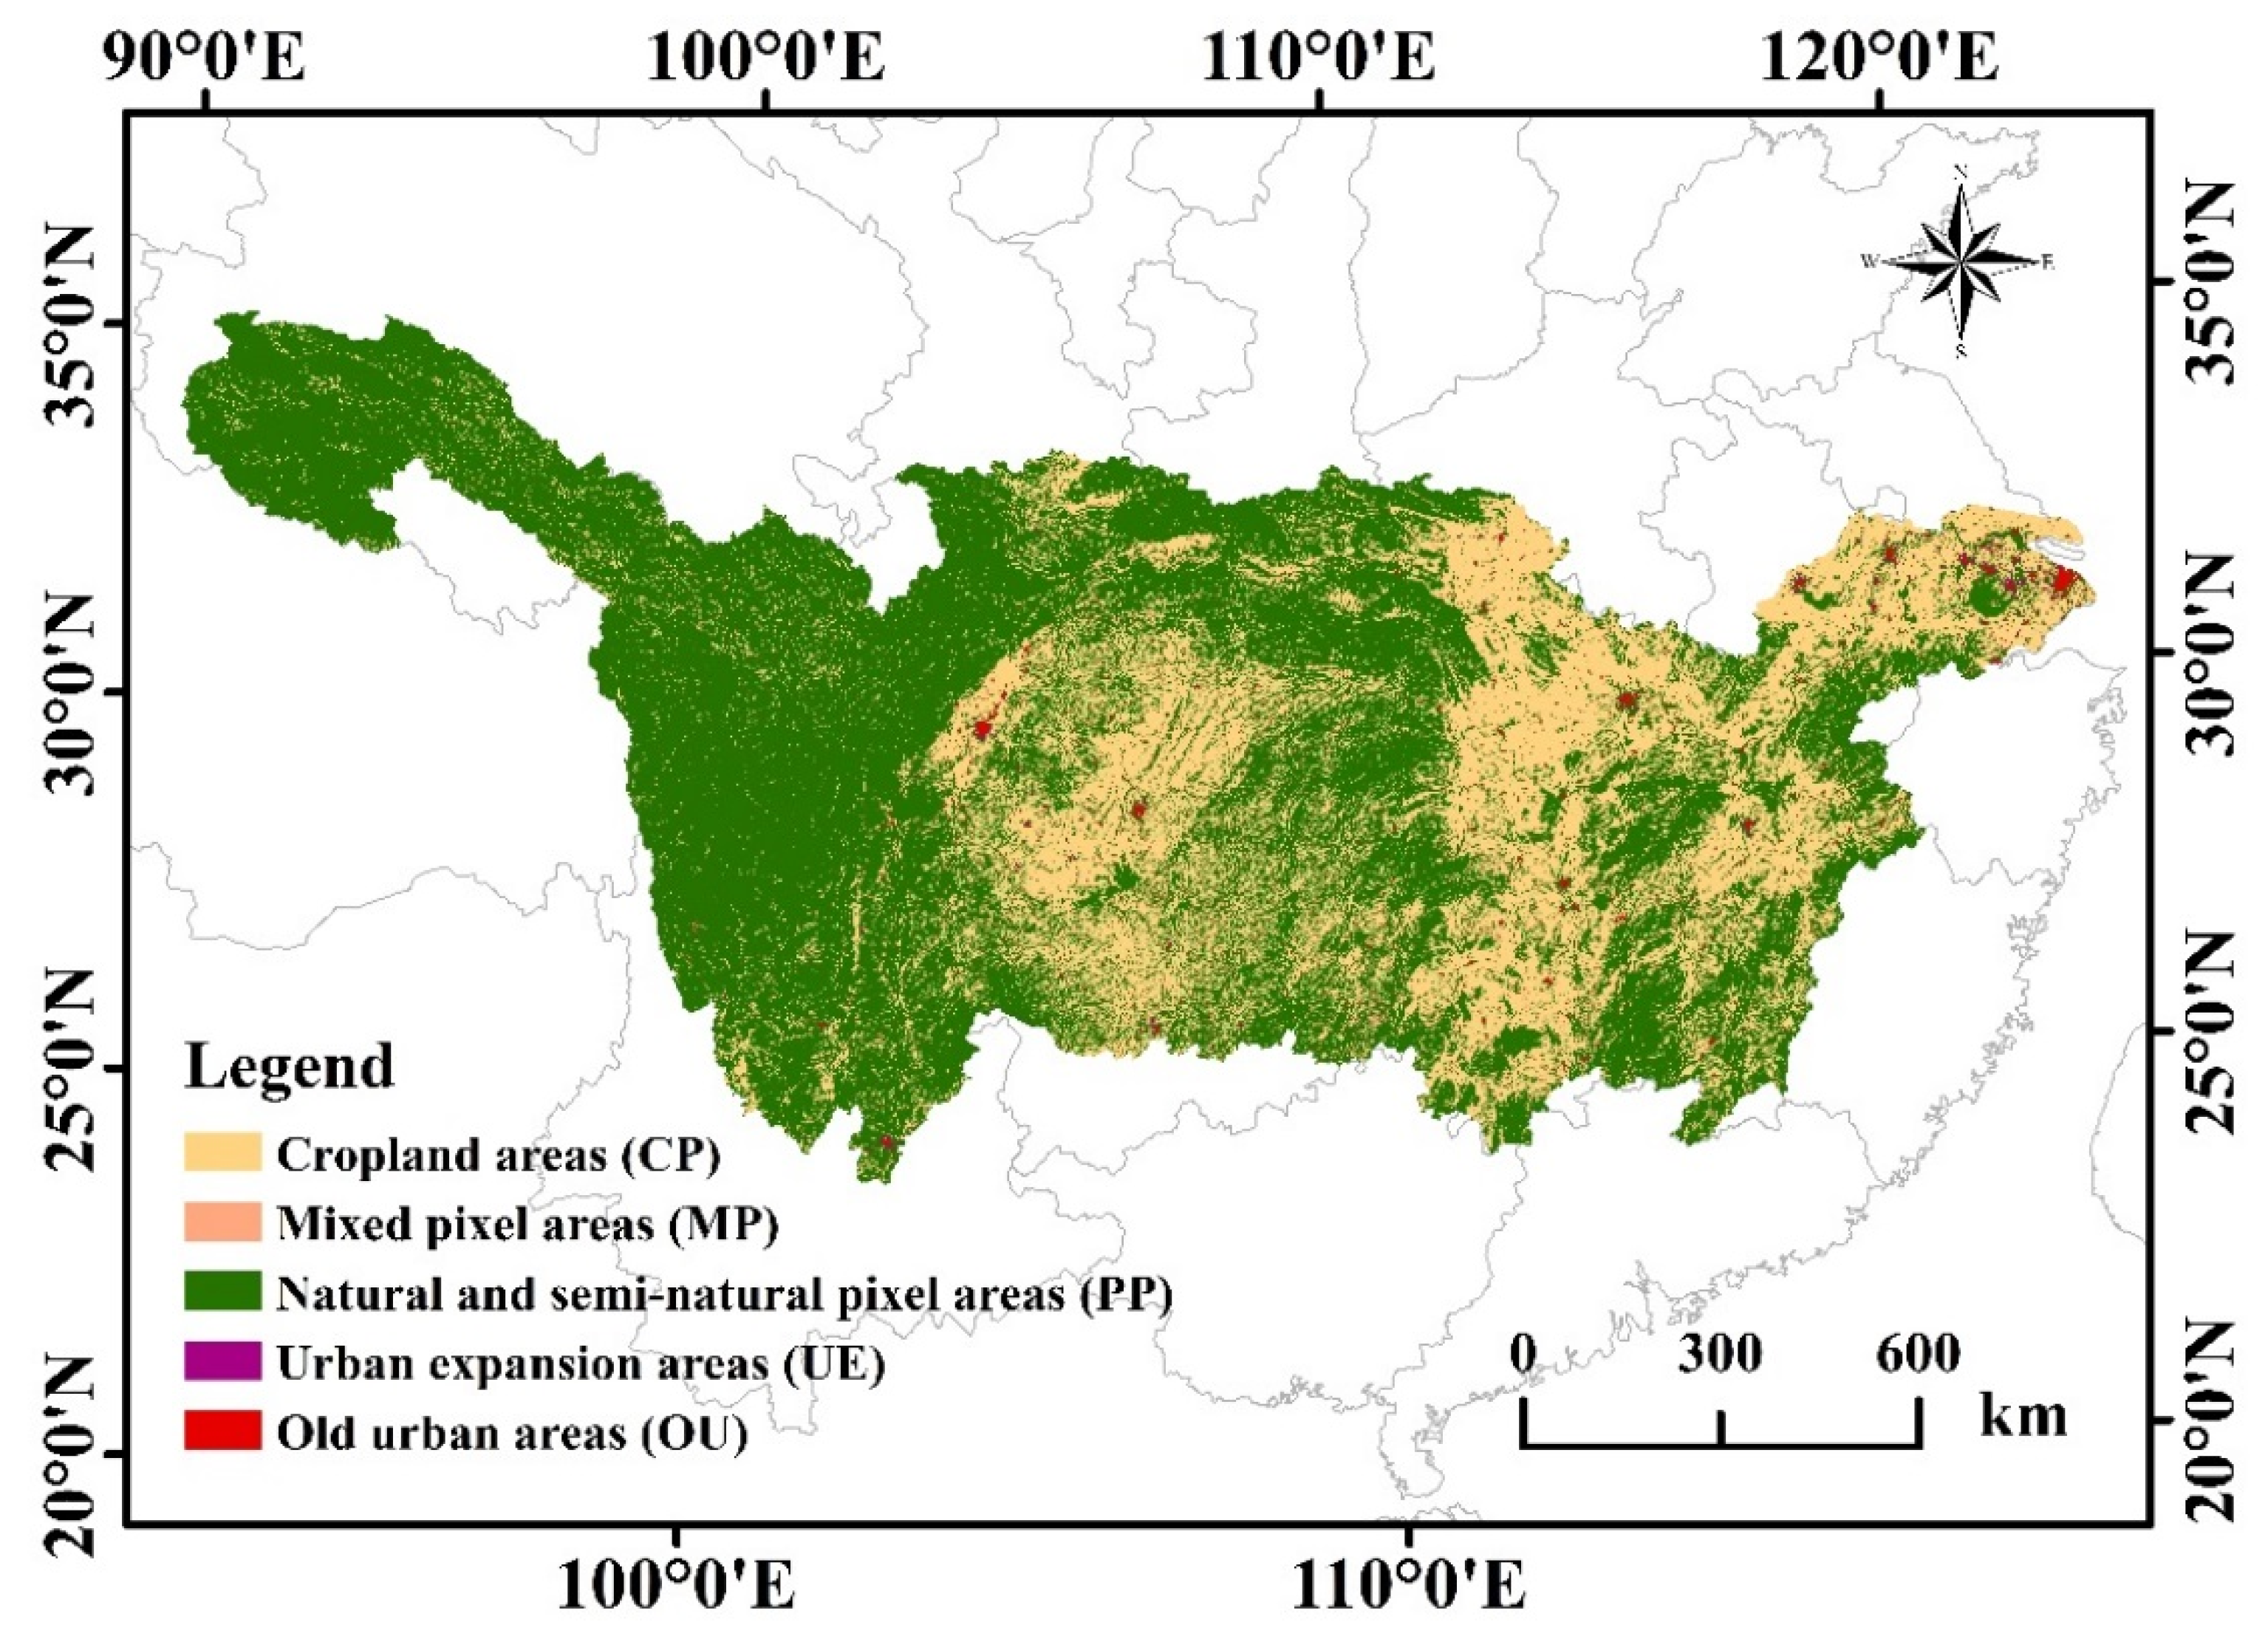
In order to study the spatial change of regional land use, the land in the study area was divided into urban areas, cropland, and natural and semi-natural areas. After overlaying the data of the 2 periods, the reclassification results were OU, UE, PP, MP, and CP. Among the 5 types of land use, UE represented the area of urban outward expansion. The area converted from cropland and natural/semi-natural areas to each other was called the mixed pixel area (MP). The urban areas from 2000 to 2020 were classified as old urban areas (OU). PP represented natural or semi-natural areas that had not changed during the period of 2000–2020. CP represented cropland areas (Figure 2). According to the summary of land transfer situation from 2000 to 2020, the following change permutations were obtained (Table 2). In the study area, the land converted into urban land was remarkable for years 2000–2020. Among them, the urban expansion accounted for a large proportion (1.24%). Unchanged urban, cropland, and natural and semi-natural areas accounted for 0.46%, 33.58%, and 63.25% of the total area, respectively.
The land use types after reclassification are shown in Figure 2. To sum up, the area of land cover had significant change; its area was 4.8 × 10⁴ km2, accounting for 2.71% (Table 2). The proportion of the 5 land use types from high to low was PP > CP > MP > OU > UE. It can be observed that PP and CP accounted for the largest proportion of the 5 land use types, which were 1.1 × 10⁶ km2 and 5.9 × 10⁵ km2. The area covered by UE was the smallest, which was 4951.86 km2.

2.3.2. Calculation of Surface Energy Balance and Research Framework

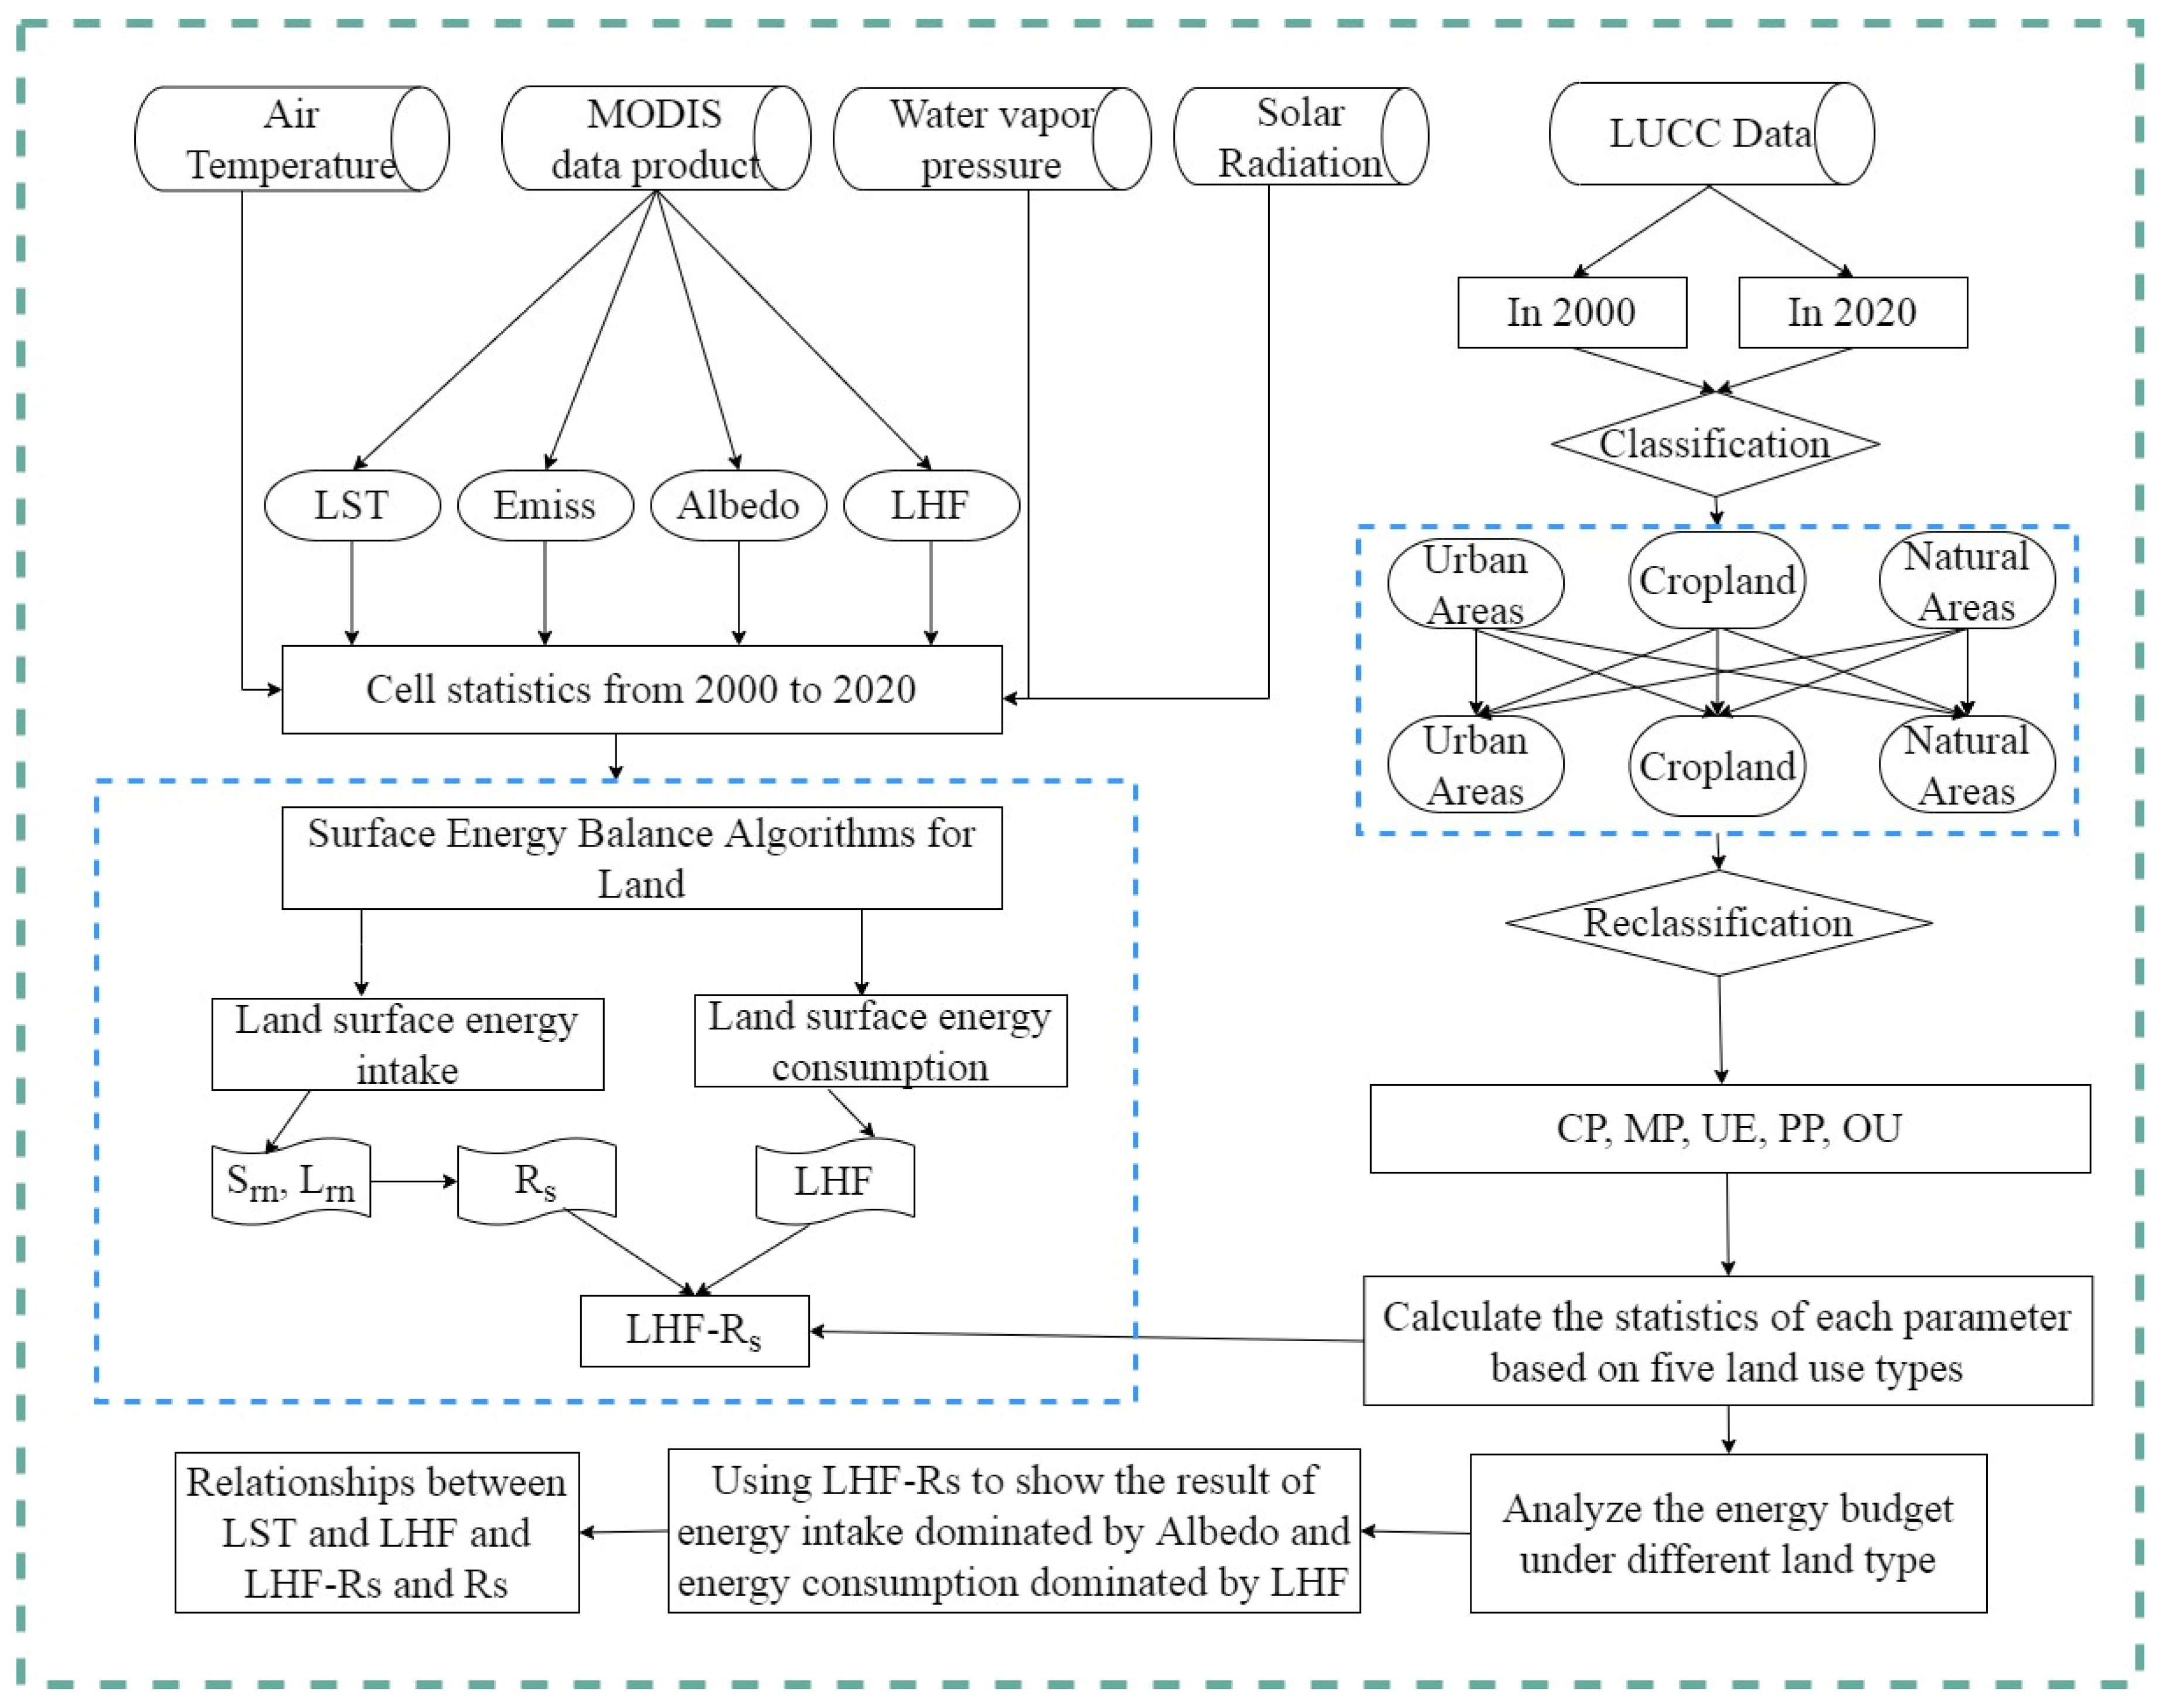
Using the radiation balance algorithm, differences of various factors of energy balance under different underlying surfaces in the study area were calculated. As shown in Figure 3, land use types in the study area were reclassified as CP, MP, UE, PP, and OU, which were used to analyze the relationship between the change of energy budget and various parameters. Each energy balance formula was calculated as follows:
R s = S rn + L rn
where R s represents surface net solar radiation; S rn represents net short-wave radiation; and   L rn represents net long-wave radiation. Calculation formulas of S rn and L rn were as follows:
S rn = S rn ( d ) S rn ( u ) = ( 1 A ) S rn ( d )
L rn = L rn ( d ) L rn ( u ) = E m L rn ( d ) ( T a , E i ) L rn ( u ) ( T s , E m ) = E m δ E i T a 4 δ E m T s 4
where L rn ( d ) indicates long-wave radiation downwards; L rn ( u ) indicates long-wave radiation upwards; S rn ( d ) indicates short-wave radiation downwards; and S rn ( u ) indicates short-wave radiation upwards, and its unit is W/m2. E m is the emissivity;   δ represents 5.67 × 10⁻⁸ W/m2/K4; and A is surface albedo.   T a is the air temperature; P w is the water vapor pressure, and abbreviation of this unit is hPa. E i is the emissivity of air, its formula is:
E i = 1.24 ( P w / T s ) 1 7
where T s is the land surface temperature, its unit is K.
According to the equilibrium Equation (2), it can be found that R s will be decreased with increasing albedo, while R s refers to the energy absorption caused by biophysical factors (albedo, solar radiation). Meanwhile, the latent heat flux (LHF) represents the energy consumption of R s , and LHF R s represents the final change in energy balance caused by LUCC [19]. In practice, the LHF R s is typically sensitive to latent heat fluxes and soil fluxes in the radiation balance. The larger the LHF R s , the less energy would be available to the land and atmosphere, also leading to weaker correspondence with global warming feedback [27]. Based on the radiation balance algorithm, the effects of LUCC and biophysical factors can be combined [31]. Hence, on the basis of surface energy uptake and consumption under different land use changes, ecological climate changes can be explained from this point of view.
In this study, using the surface energy balance algorithm, we calculated various energy factors (e.g., shortwave radiation and net radiation) which related to the energy balance. We then used zonal statistics to calculate the average of all pixels within the different land use types. In the results section, the trend changes of different energy factors were analyzed for the 5 land use types from 2000 to 2020 using linear regression, Pearson correlation analysis, and trend analysis methods.

3. Results

3.1. Changes of Surface Energy Intake

3.1.1. Net Short-Wave and Long-Wave Radiation

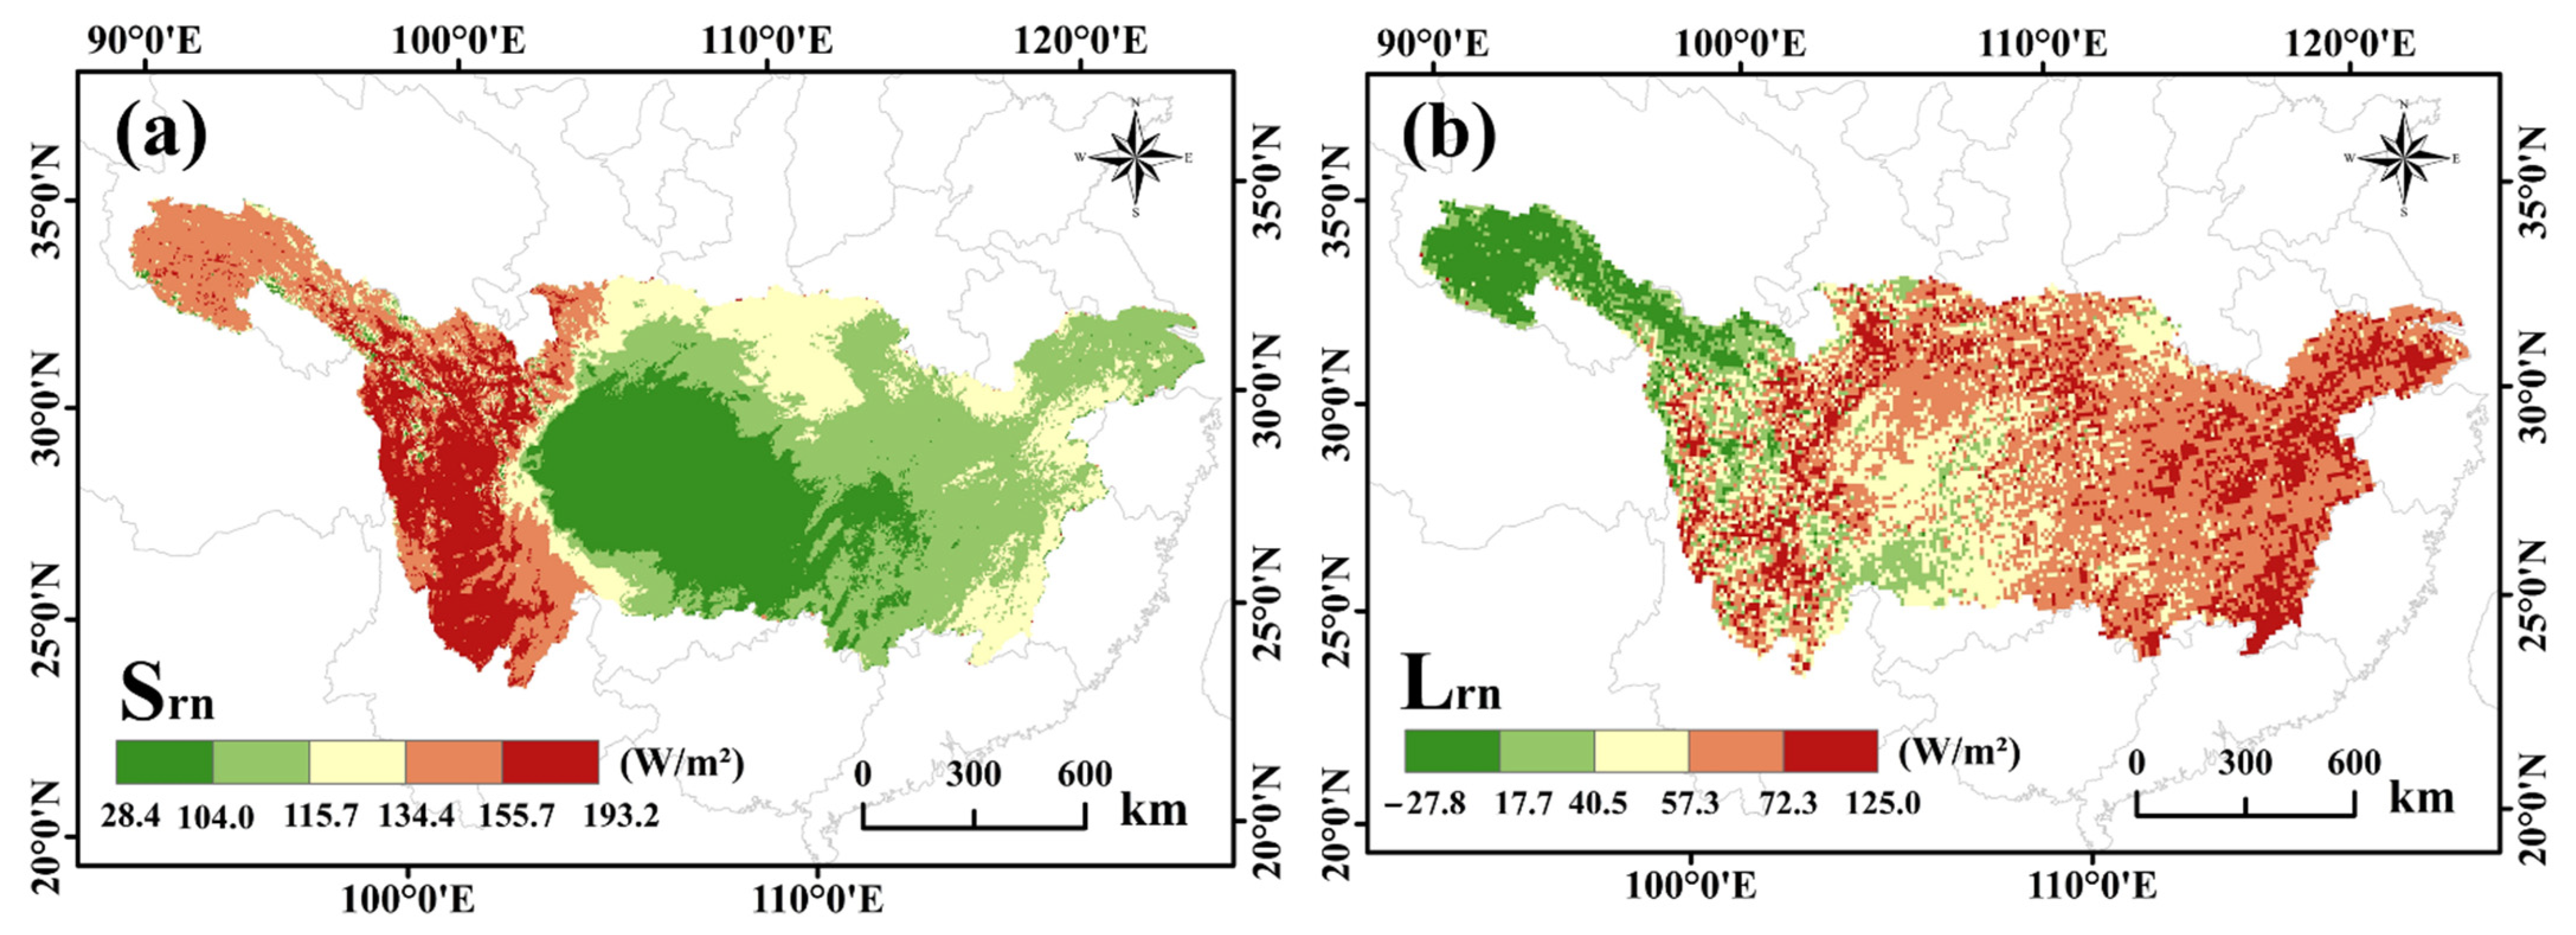
According to the different changes of various energy factors in 2000 and 2020, spatial variations of net short-wave ( S rn ) and net long-wave radiation ( L rn ) were calculated for the study period. Shown in Figure 4, S rn and L rn had a positive trend in most areas, for which the multi-year average values were 122.37 W / m 2 and 55.39 W / m 2 , respectively. The increment of S rn was larger in the west and smaller in the east, where the value of S rn was relatively smaller in the OU region. L rn increased significantly in Hubei, Jiangsu, Jiangxi, and Henan provinces, mainly in the CP region, while the negative values of L rn were concentrated in the PP region, mainly in northwestern China (Qinghai, Tibet, and Sichuan).
As shown in Figure 5, the highest value of S rn was in the PP region, where its multi-year average maximum value was 130.2 W / m 2 , while the lowest value was located in the OU area, where the multi-year average minimum value was 110.3 W / m 2 . The results of L rn showed the maximum value of the multi-year average was located in the OU region, where its value was 68.1 W / m 2 , followed by the MP, CP, UE, and PP regions, and their values were 63.1 W / m 2 , 59.4 W / m 2 , 58.8 W / m 2 , and 52.3 W / m 2 , respectively.

3.1.2. Changes of Surface Net Solar Radiation

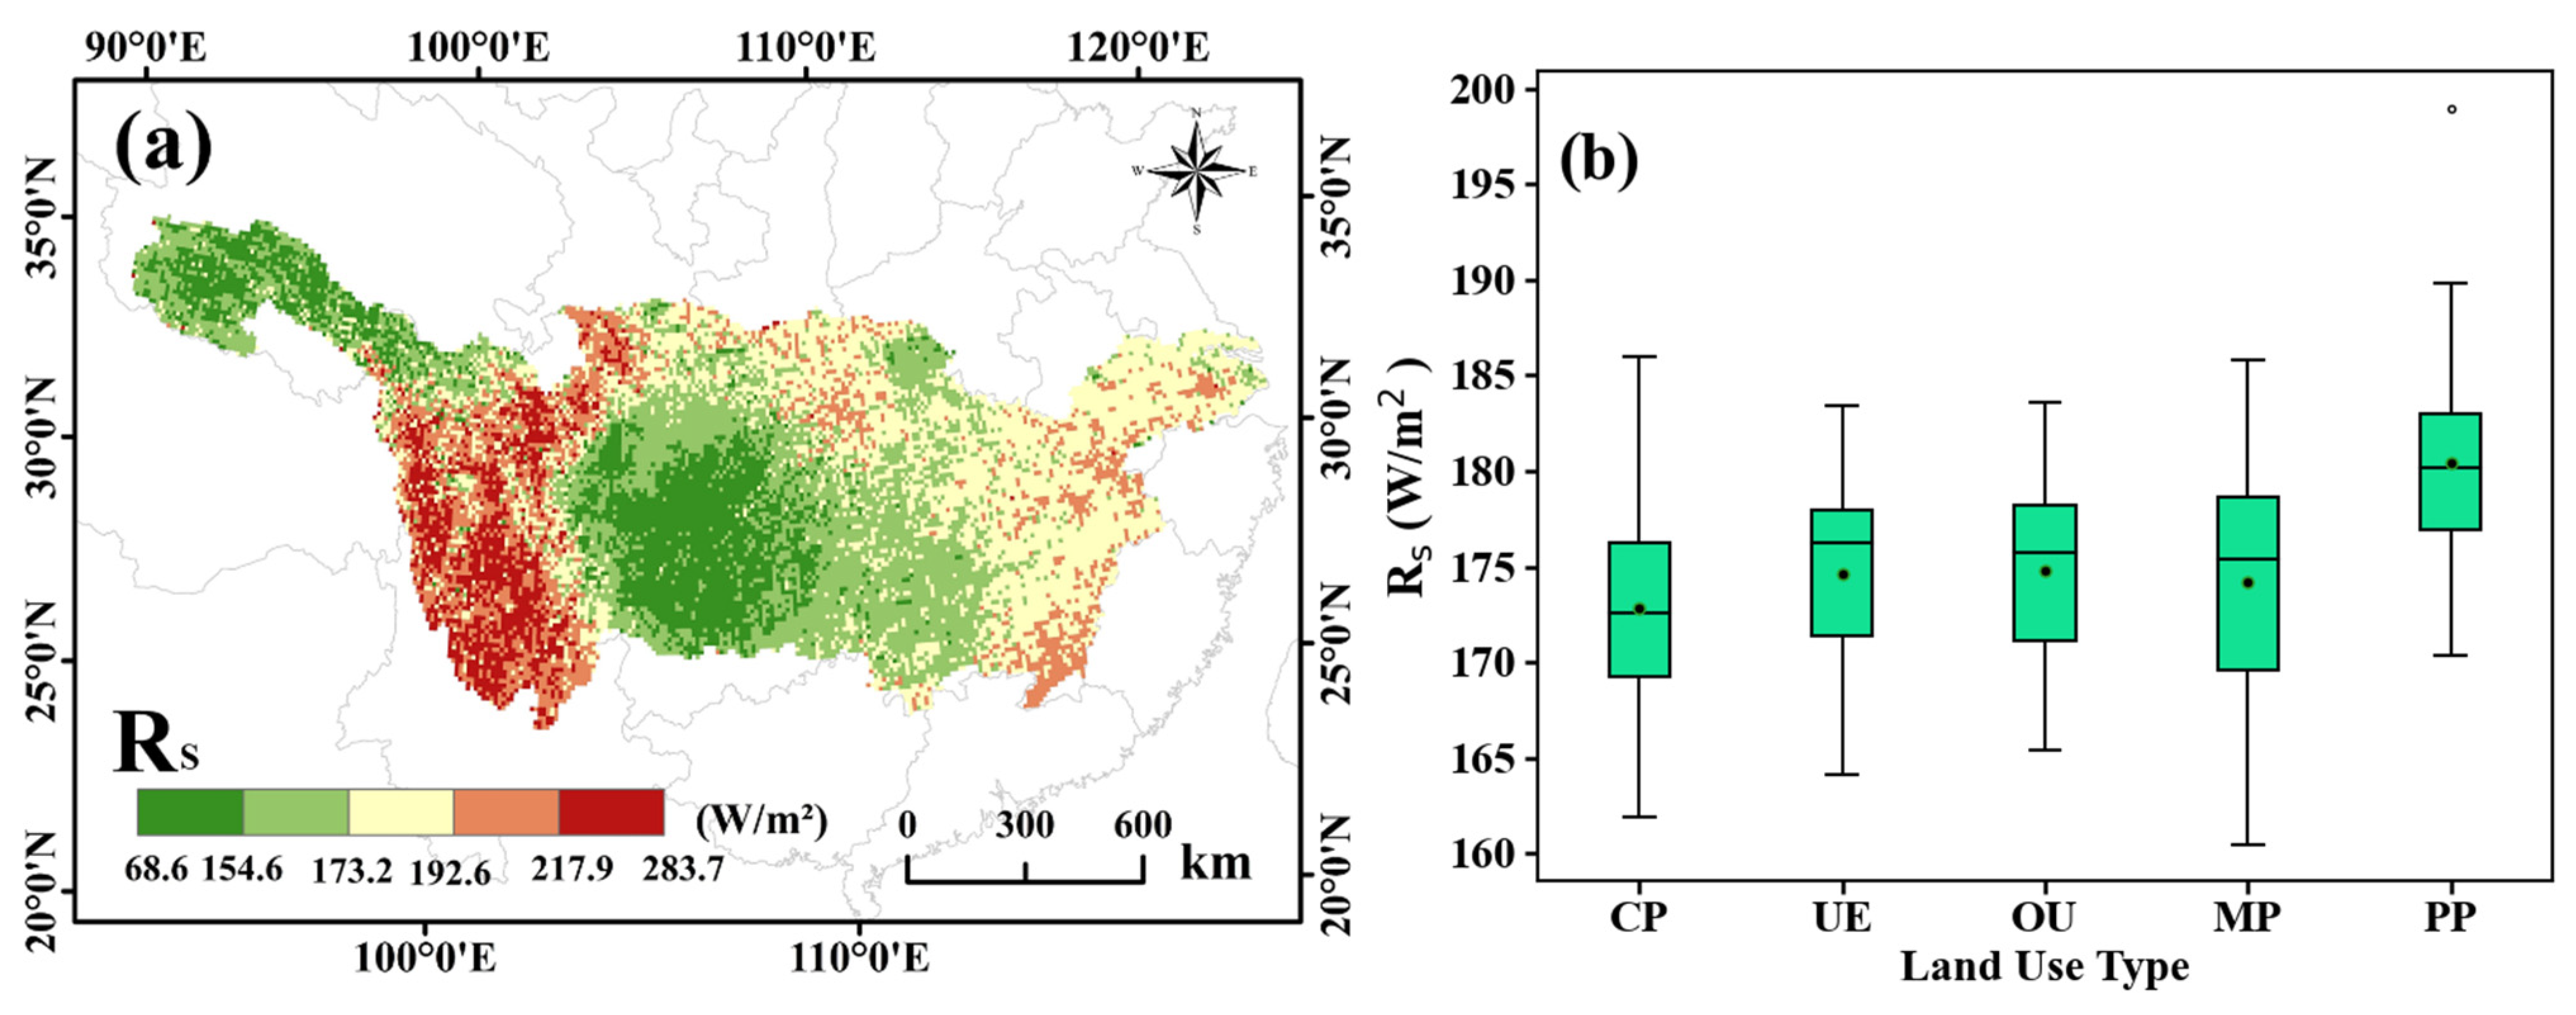
The surface net radiation is the sum of S rn and L rn , which is the key parameter of land–atmosphere interactions and an important index for estimating the surface energy budget [32]. From the results of L rn and S rn data, the variation of net radiation ( R s ) could be inferred. As shown in Figure 6, the multi-year average value of R s was 176.15 W / m 2 in the Yangtze River basin from 2000 to 2020. Moreover, R s had an increasing trend in the southwest, while it decreased in the south. On the whole, R s showed an upward trend, but its increase was not significant.
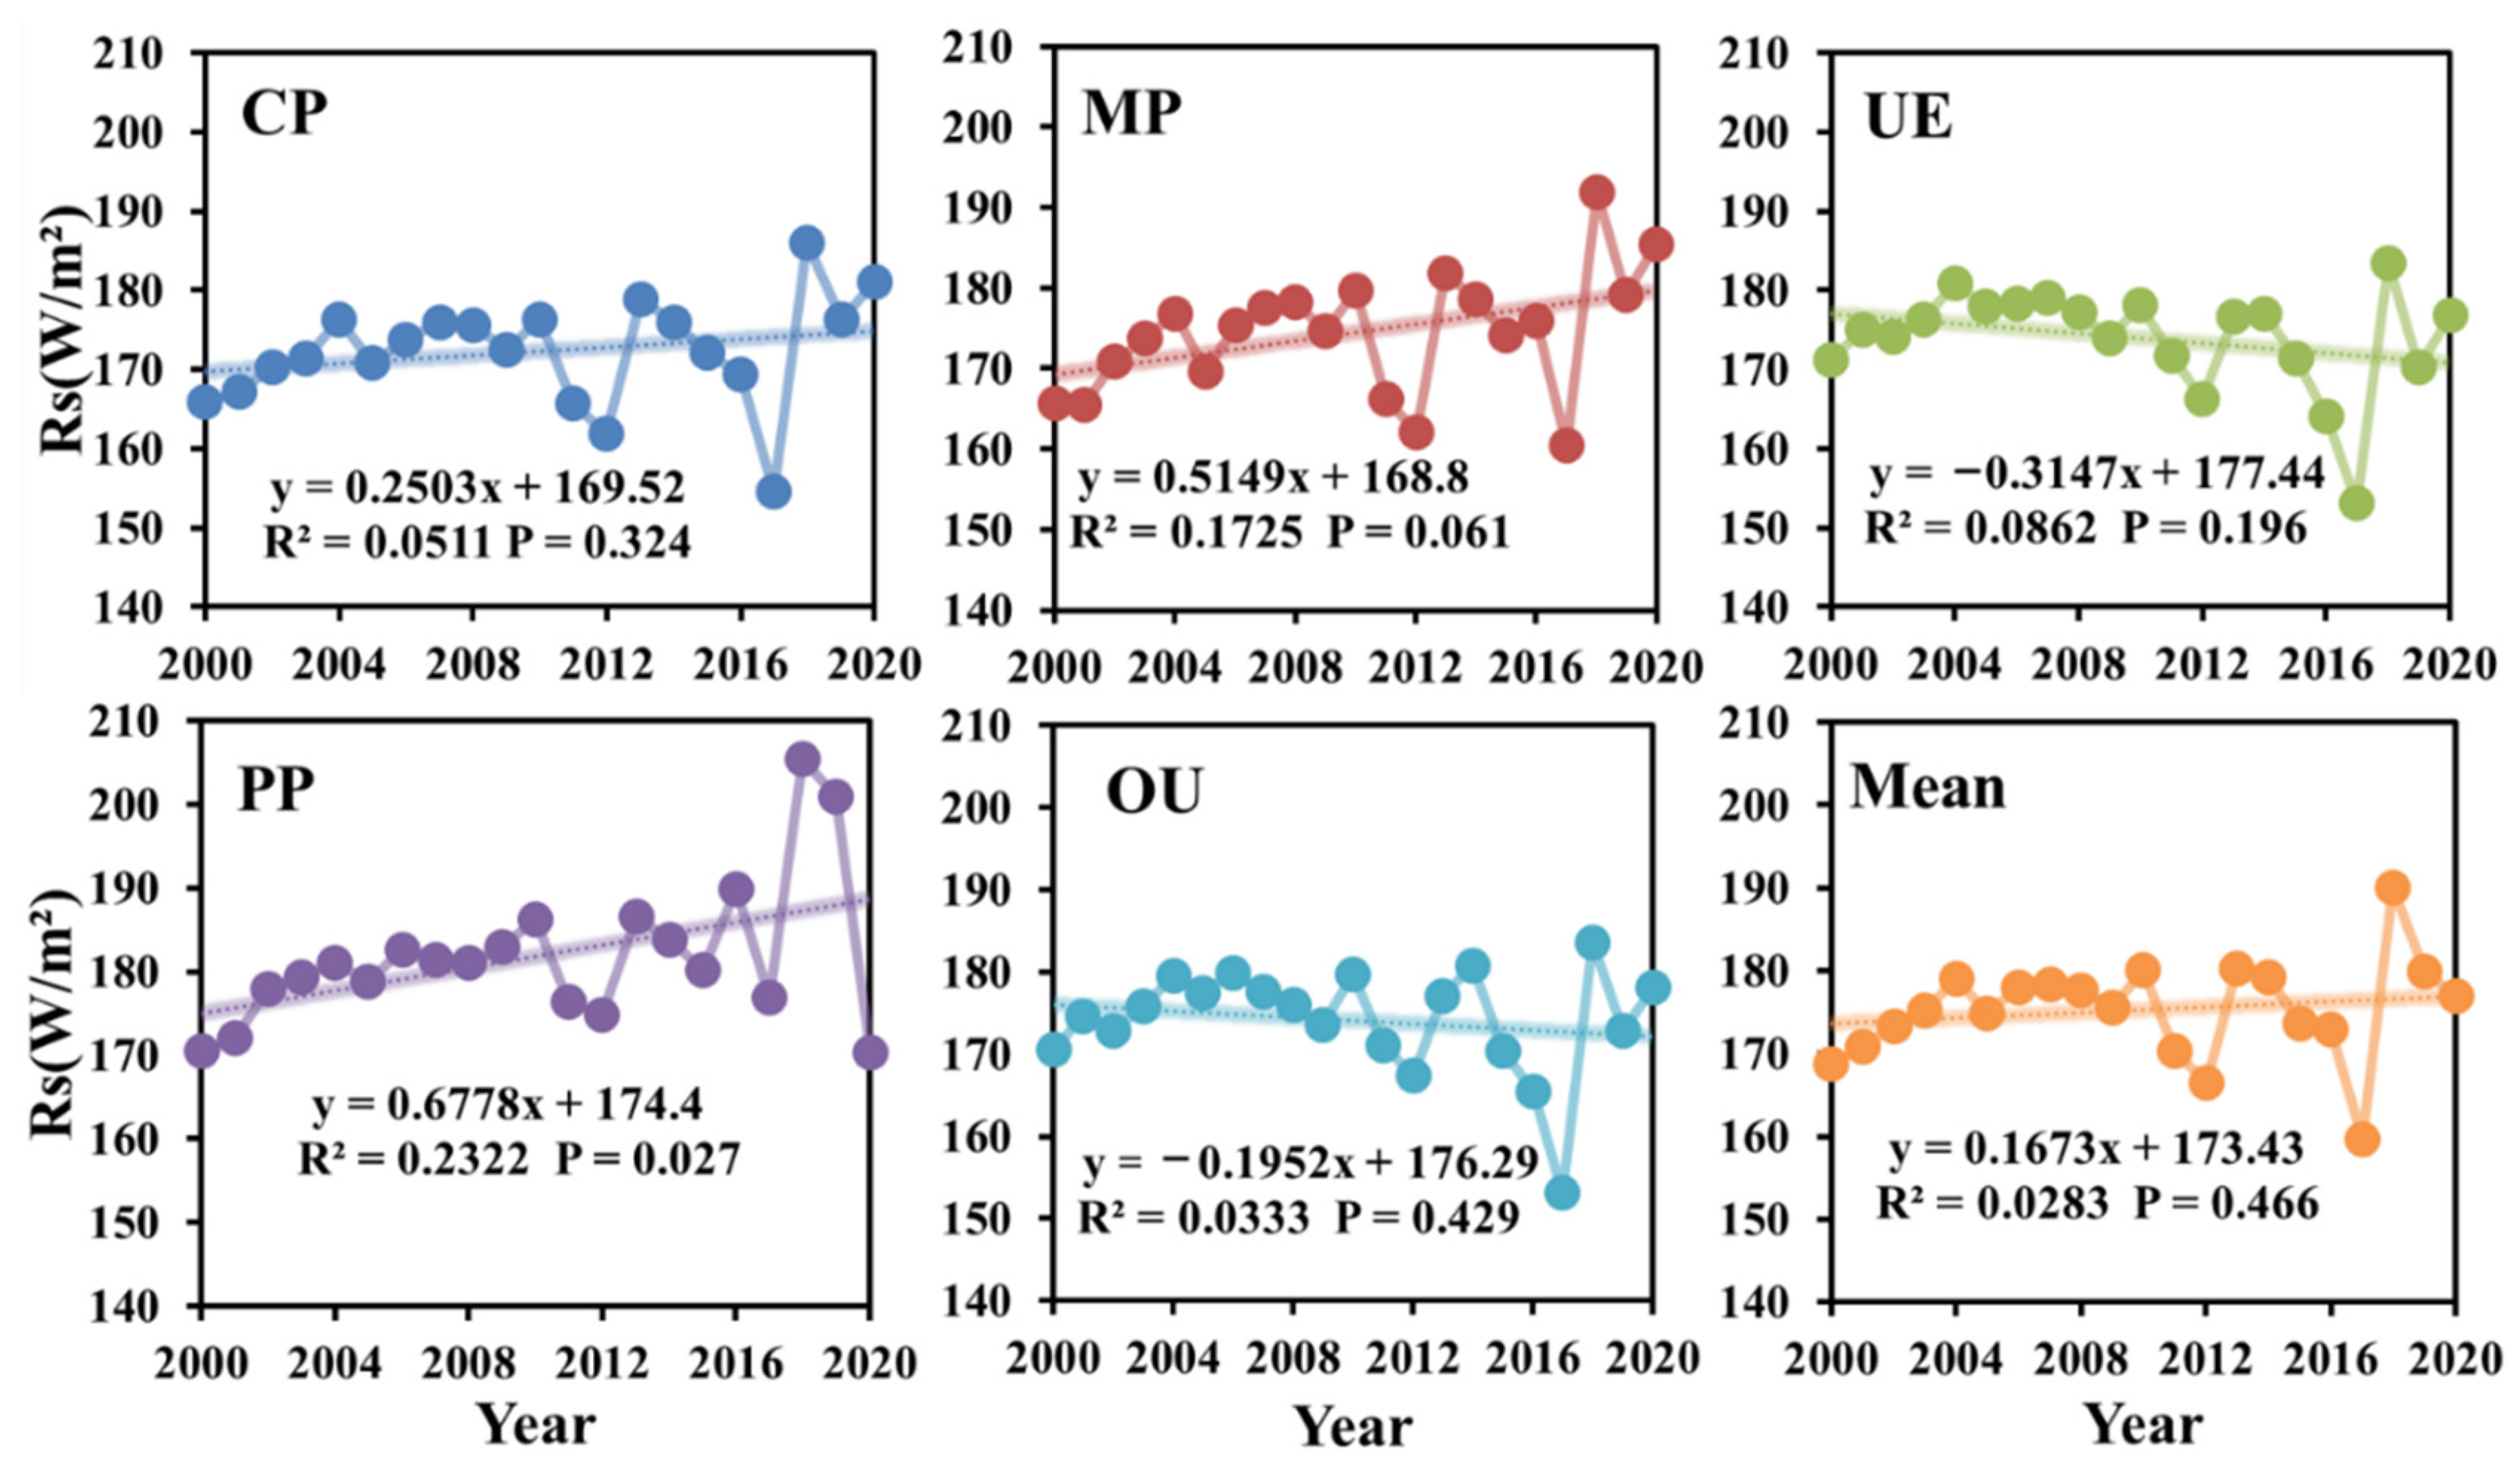
The trend of R s changes for different land use types showed significant differences (Figure 7). Considering the increasing impact of human activities, the net radiation showed a downward trend. The R s value of the PP region was much larger than that of the other four land use types, with a multi-year average value of 181.86 W / m 2 , followed by MP and OU regions. Moreover, the R s values of OU and UE areas, which were more influenced by human intervention, were relatively small and both showed negative trends during the study period. From 2000 to 2020, although the Yangtze River Basin suffered some human intervention, the R s value of different land use types showed an upward trend on the whole. However, these changes did not pass significance (p > 0.1).

3.2. Analysis of Surface Energy Balance

3.2.1. Changes in Surface Energy Consumption

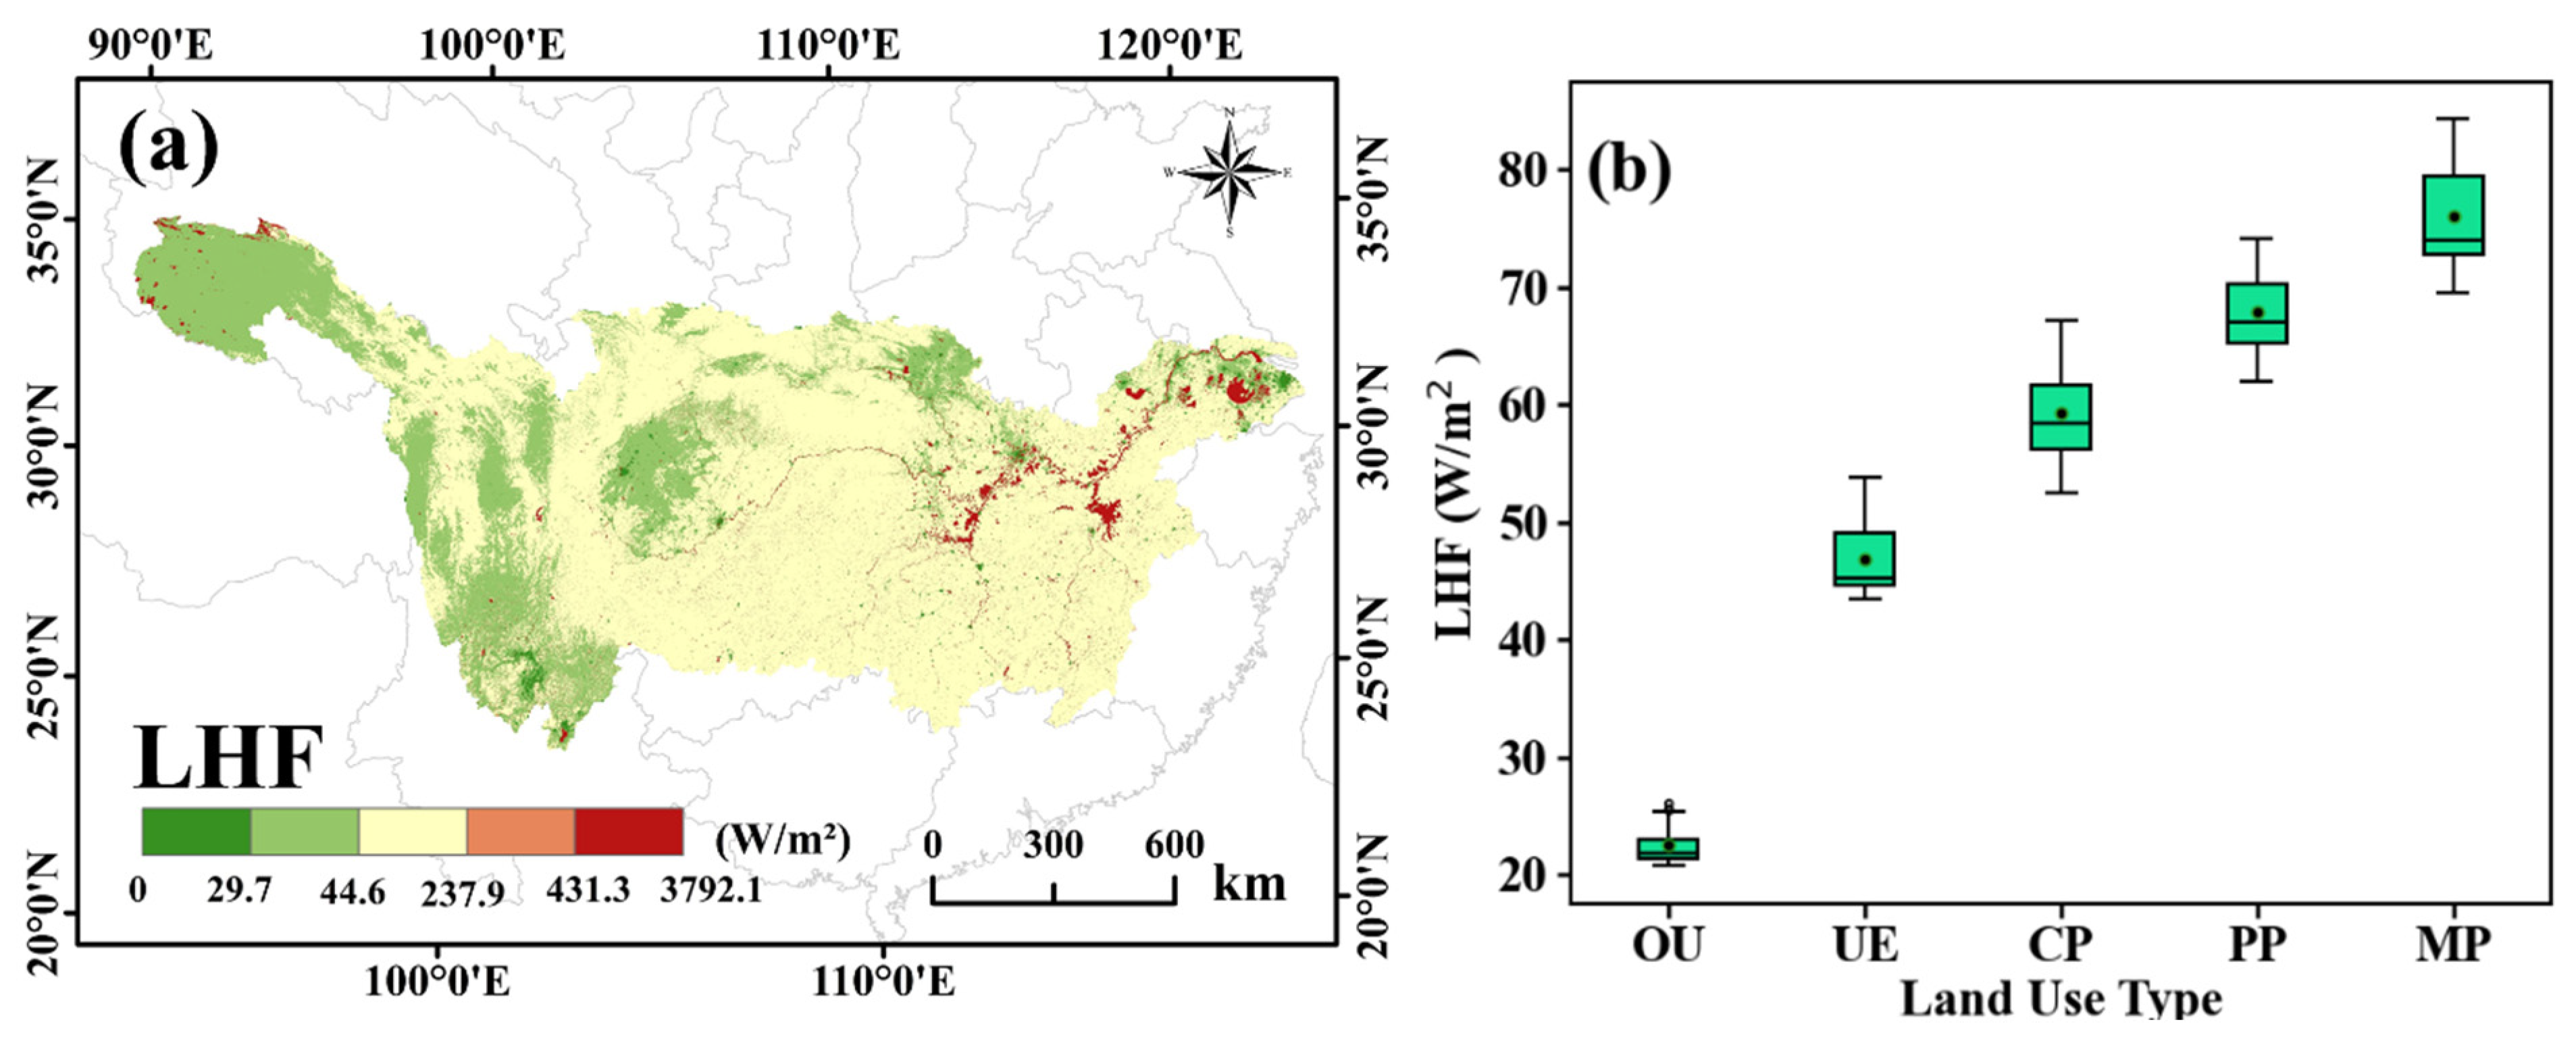
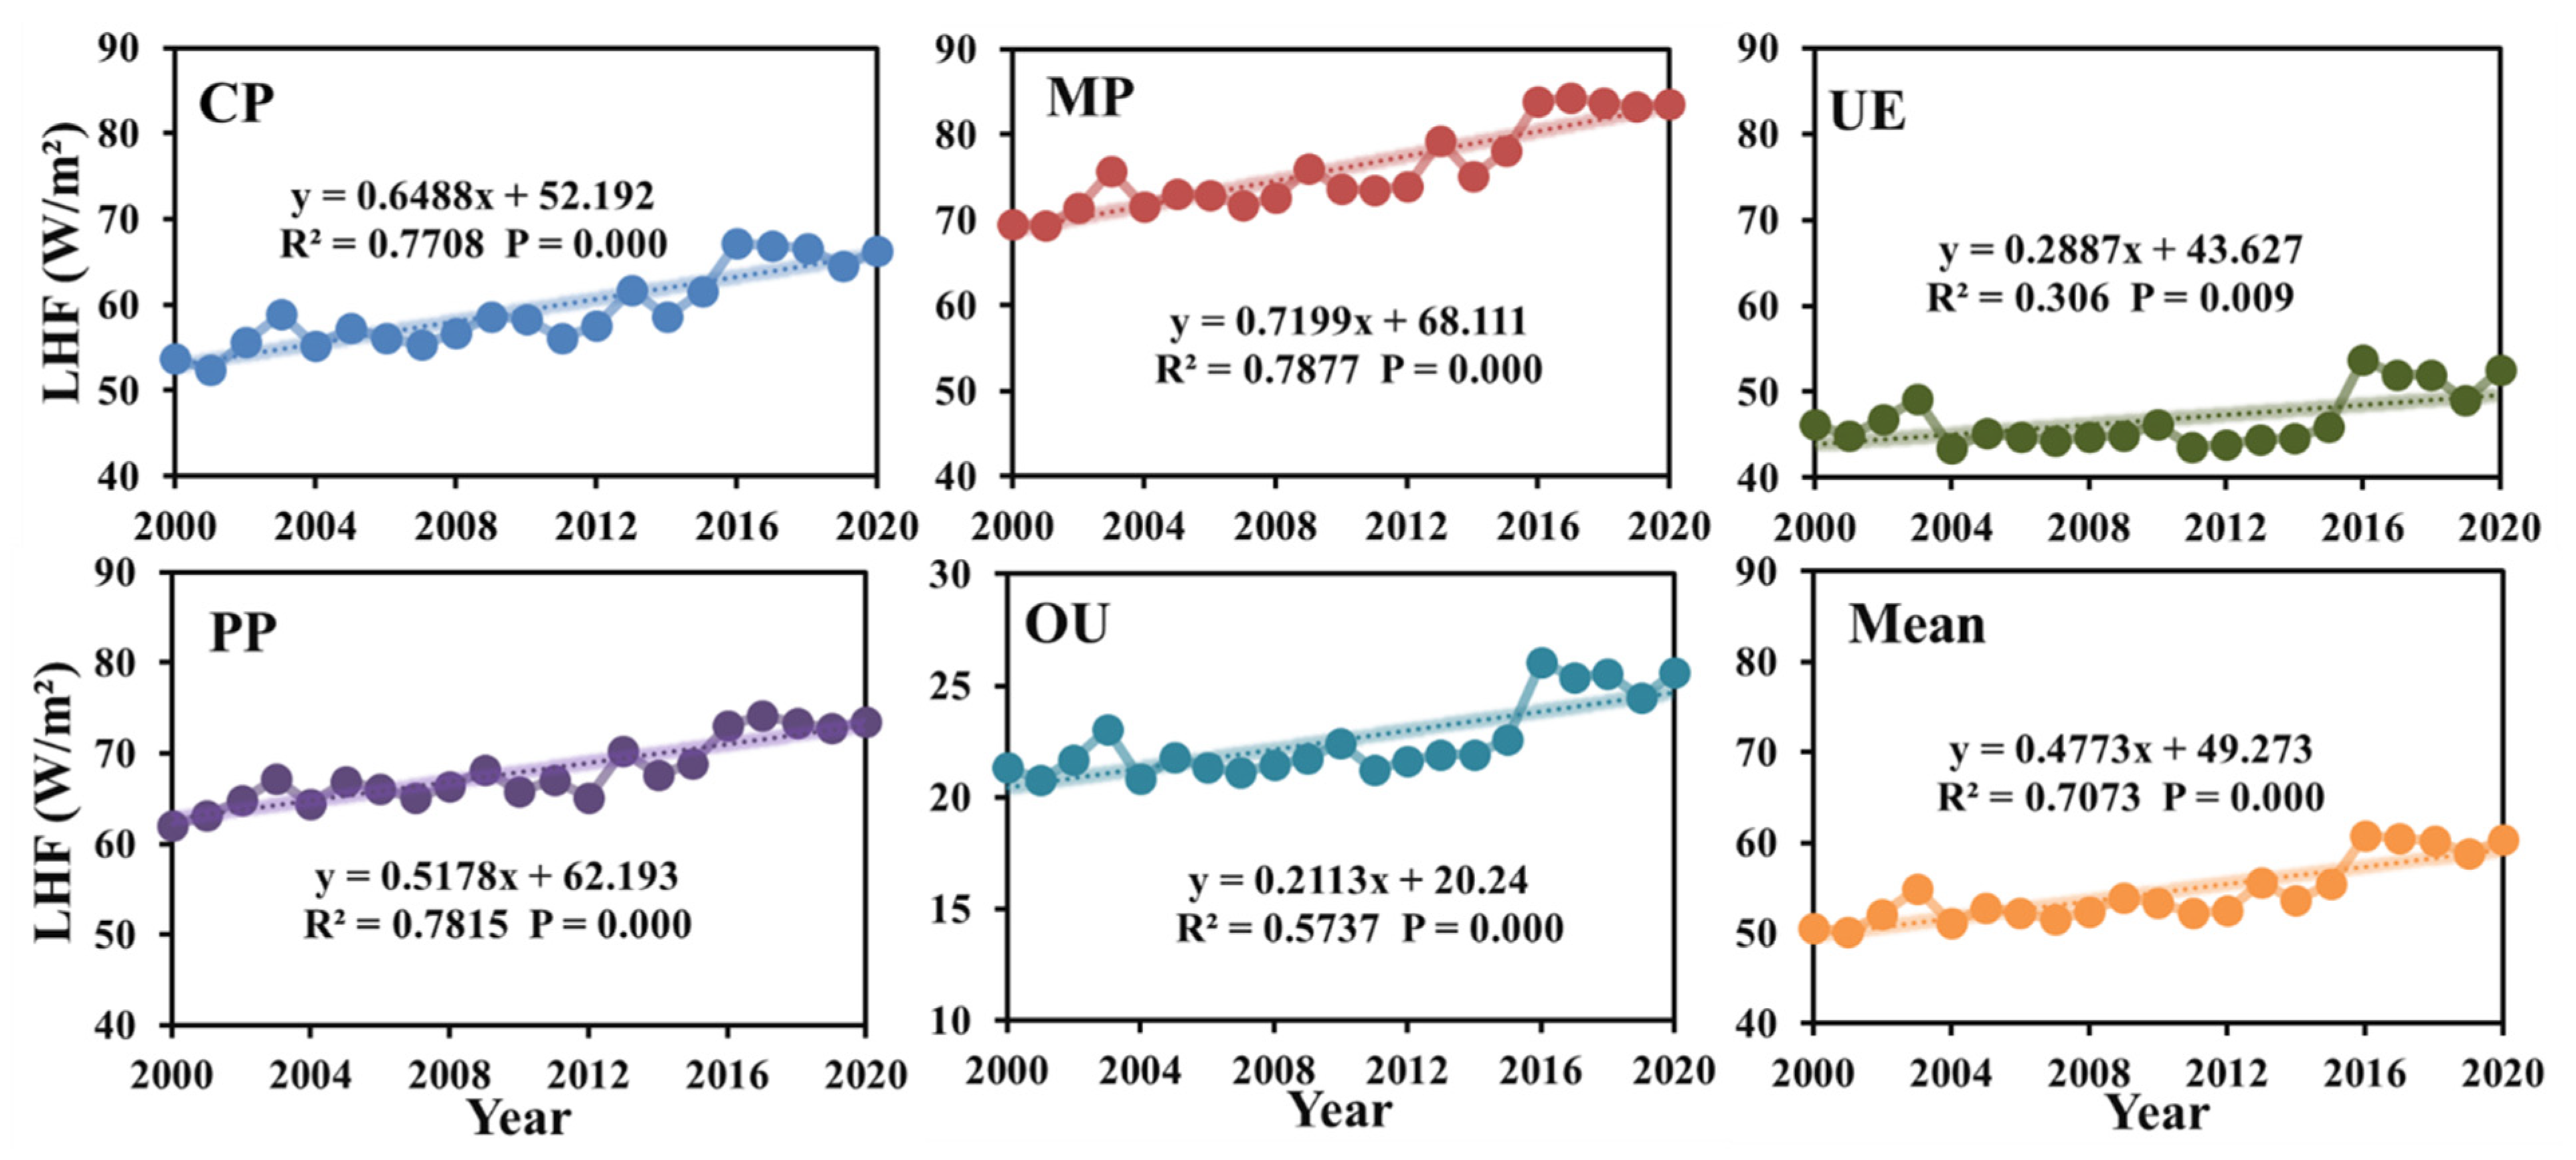
From the perspective of spatial distribution, the LHF value was higher in some eastern areas, and it ranged from 29.7 W / m 2 to 237.9 W / m 2 (Figure 8). The results found that the spatial variation of LHF was positive in the study area from 2000 to 2020, where the multi-year average value of LHF was 64.88 W / m 2 . Under the influence of human activities, there were obvious differences in the range of LHF values corresponding to different land use types. The highest multi-year average value of LHF was located in the MP area, which was 76.03 W / m 2 , followed by the PP, CP, UE, and OU regions. Figure 9 showed the changing trend of LHF under different land use types in the Yangtze River basin from 2000 to 2020, where the multi-year average trend value of LHF was 0.4773 W / ( m 2 · year ) . Among the five land use types, the order of multi-year trend values of LHF from high to low were MP > CP > PP > UE > OU. It is worth mentioning that the LHF growth trend in OU and UE regions was much slower than in MP, CP, and PP regions, which indicated that the influence of human activities had a certain weakening effect on the increase in LHF. For the trend analysis of LHF, all statistical results have passed the significance test (p < 0.1).

3.2.2. Comparison of Net Radiation and Latent Heat Fluxes

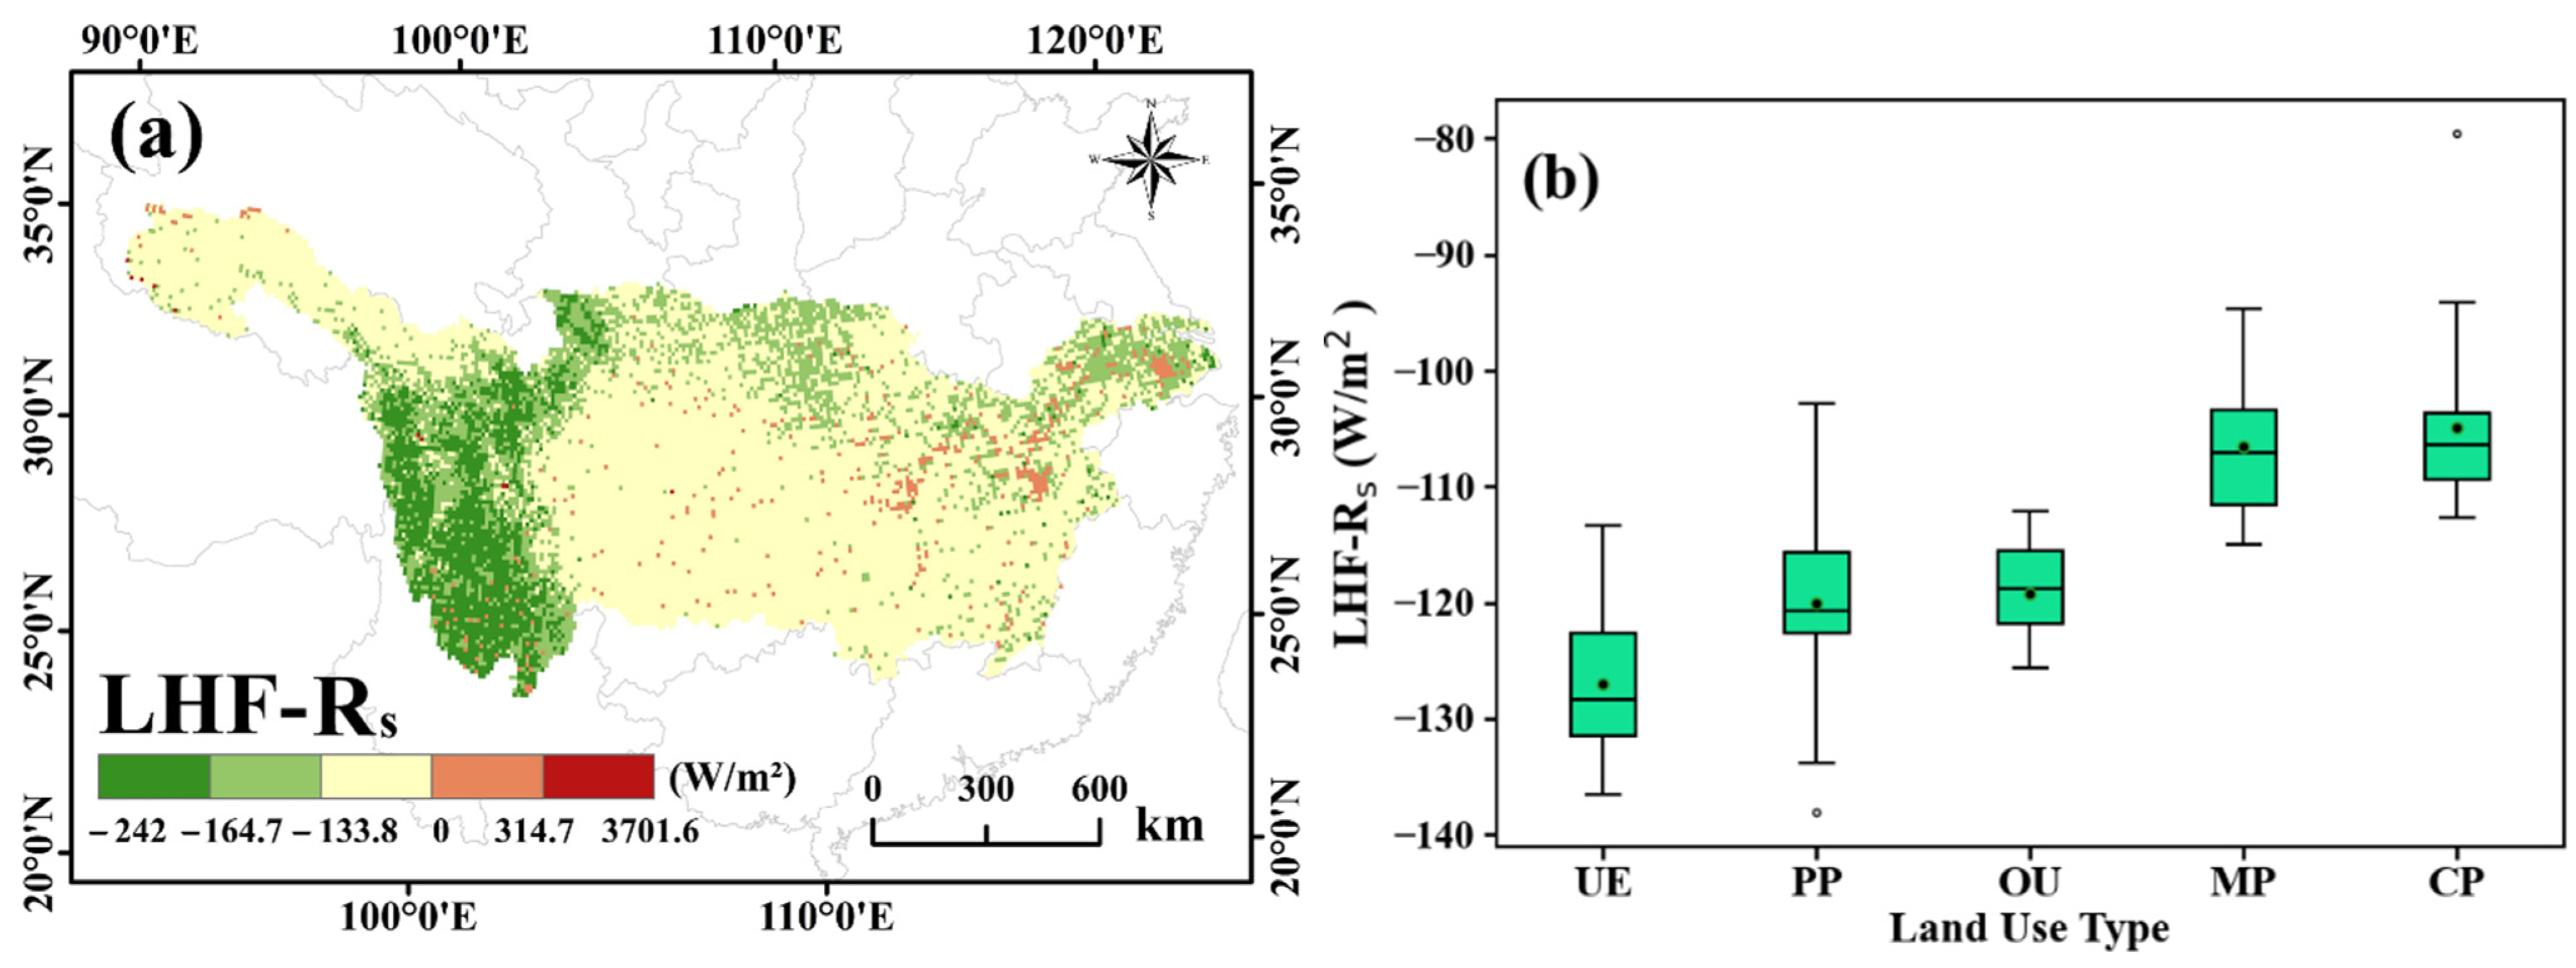
The spatial distribution of LHF R s was found to be significantly different from that of LHF. The LHF R s values were negative in most areas of the Yangtze River basin. In the eastern part of the study area, the increment of LHF R s was relatively large, with a multi-year average of −114.3   W / m 2 . Moreover, the multi-year average values of LHF R s from high to low were CP > MP > OU > PP > UE (Figure 10b). As can be seen from Figure 11, the multi-year mean trend value of LHF R s was 0.3994 W / ( m 2 · year ) , and LHF R s generally showed an increasing trend from 2000 to 2020, especially in OU and UE areas (p < 0.1). The results indicated that the feedback effect of regional warming from land use change also enhanced as the intensity of human activity impacts increased.
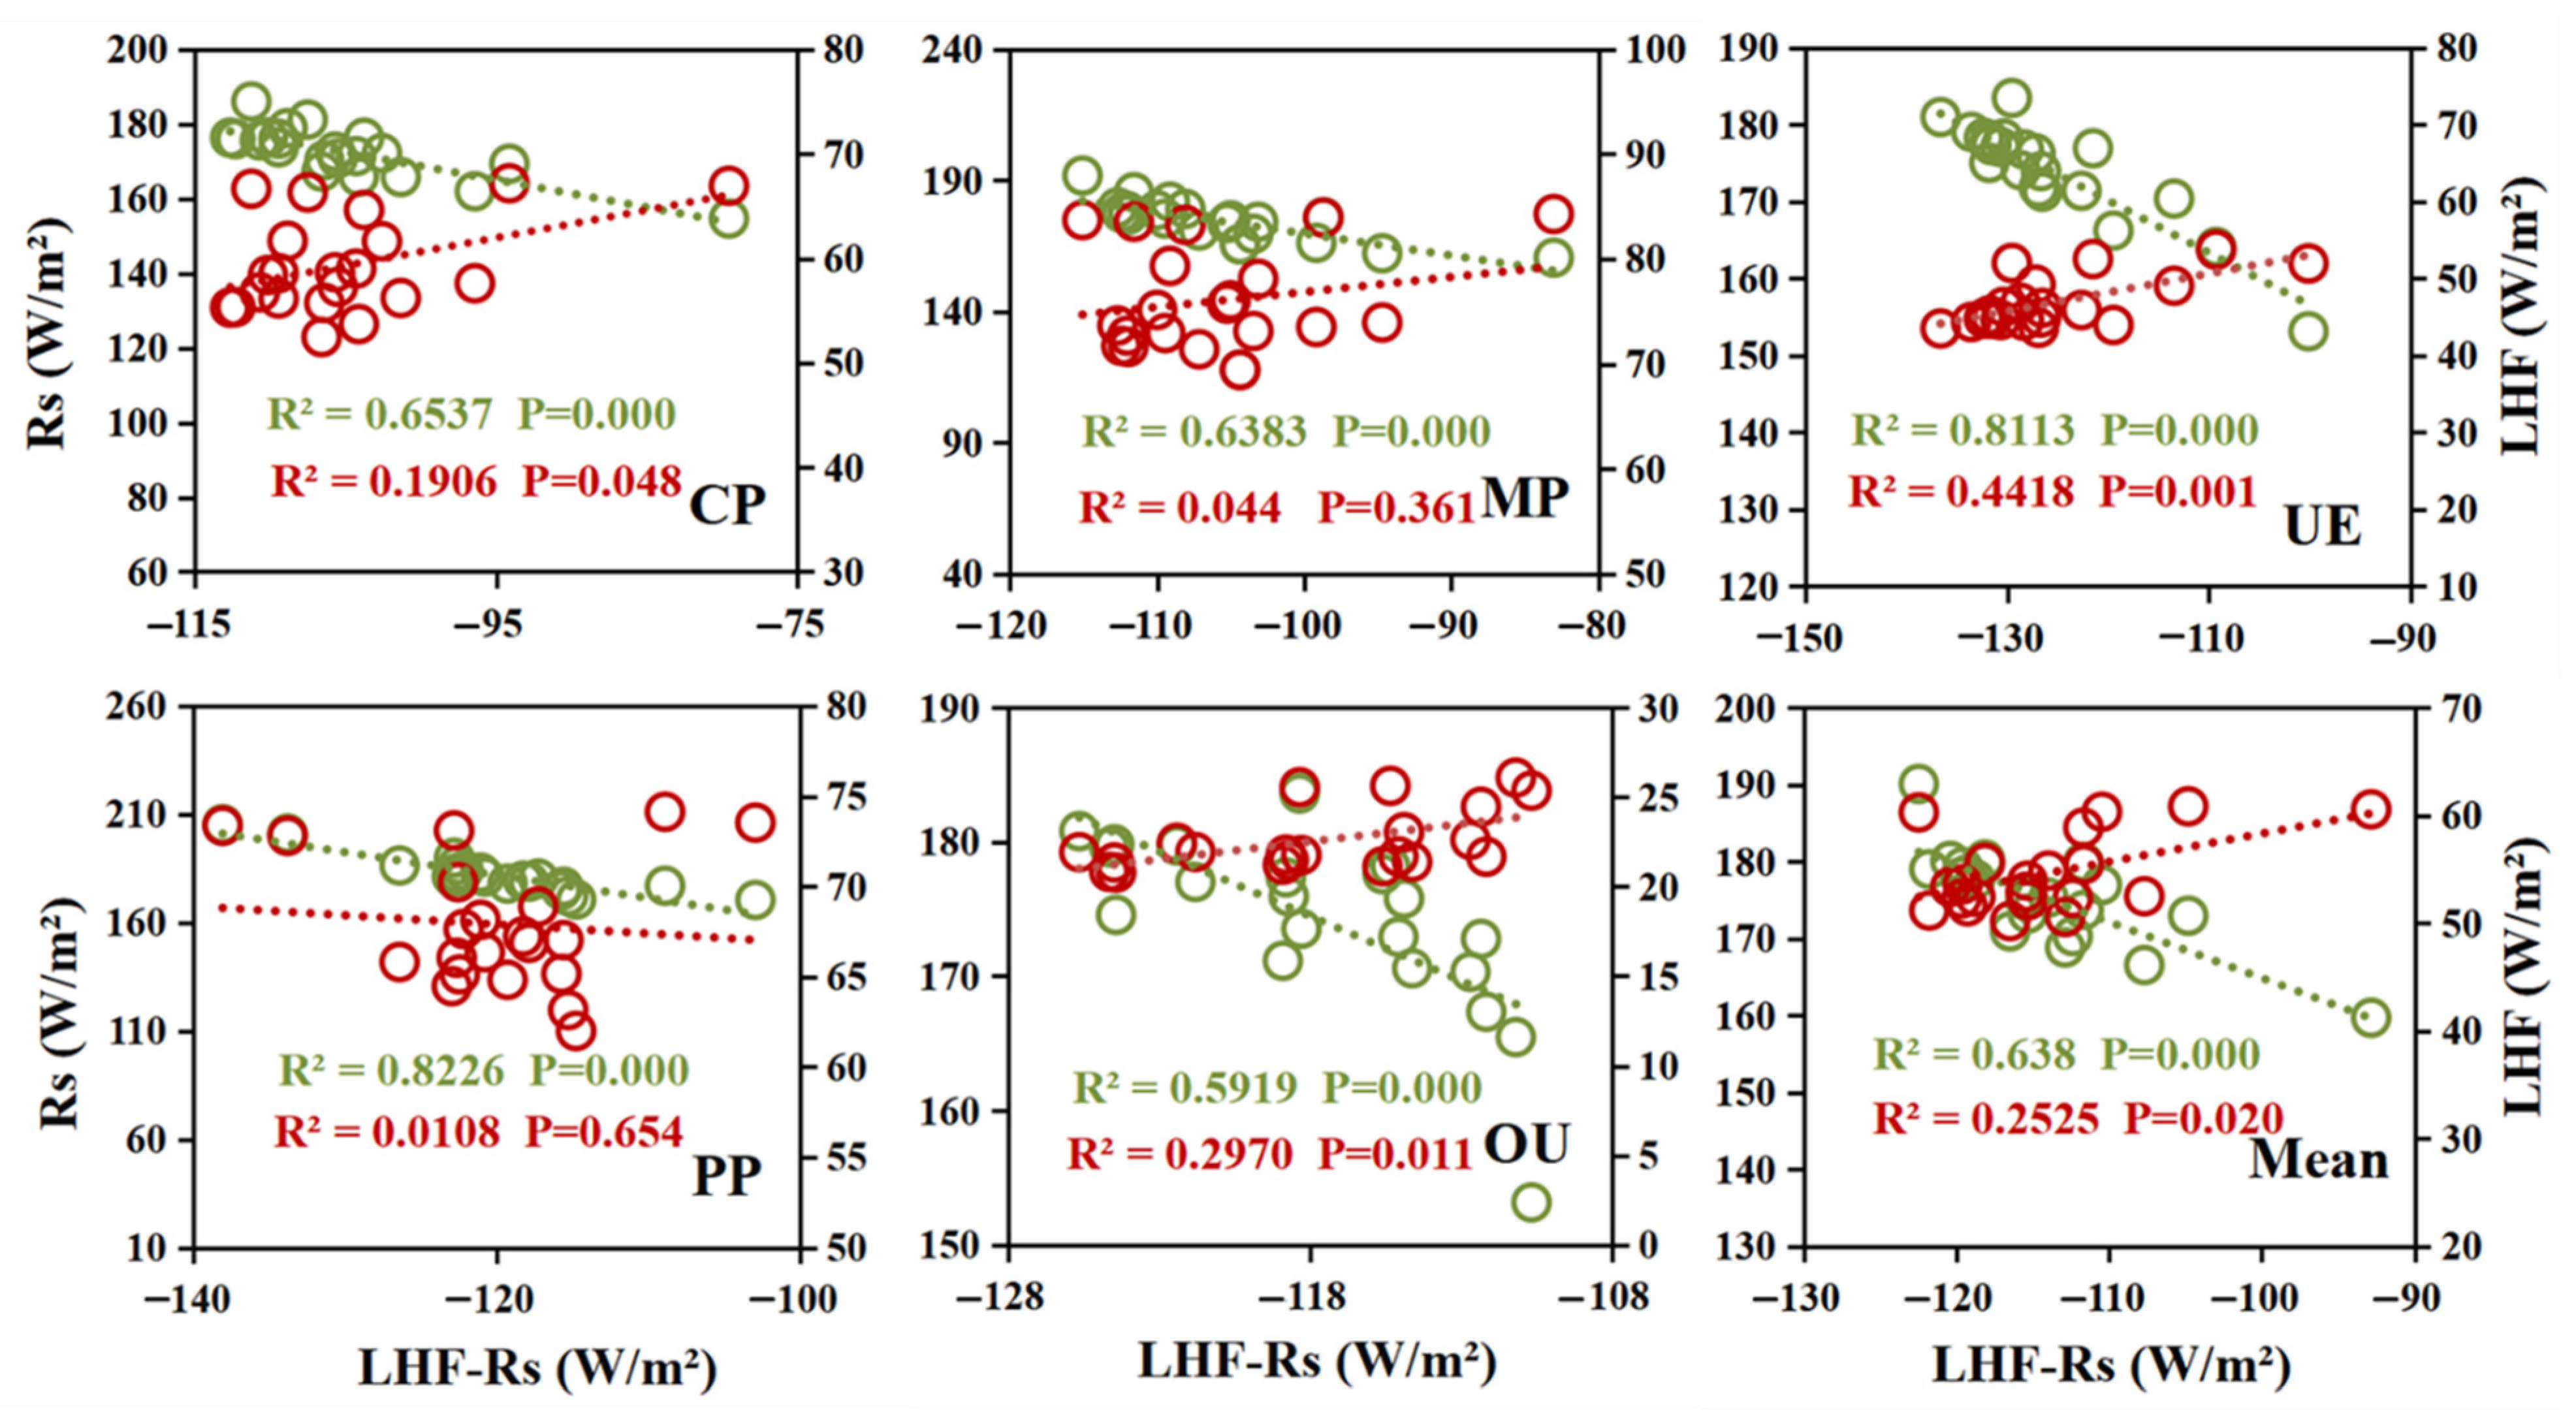
To further specify the effects of LHF, R s , and LHF R s , we analyzed the relationship of these three energy factors. The differences between the LHF among different land use types were more obvious compared to R s . As shown in Figure 12, the correlation between LHF R s and R s was more significant, which showed a closer relationship than with LHF, indicating that the change in energy balance was closely related to the change in R s . Moreover, the correlation coefficients between LHF R s and R s were greater in the UE and PP regions than in the CP, MP, and OU regions. Among the five land use types, the correlation coefficient between LHF R s and LHF in descending order was OU > UE > CP > MP > PP. Compared with LHF R s and R s , the areas with higher correlation coefficients between LHF R s and LHF were distributed in the OU and UE regions.
In terms of radiation balance, the results indicated that under the influence of human activities, the changes in biophysical processes (LHF, LST, and R s ) caused by LUCC could have a great impact on climate change [33]. Furthermore, the sensitivity reflected by the correlation between LHF R s and R s was different among the five land use types, which referenced the ways of energy intake to the warming or cooling effect [27]. Therefore, when considering the effect of land use change on energy balance, it may be more meaningful to adjust the net radiation coefficient related to biophysical factors for regulating the energy balance in the Yangtze River basin.

4. Discussion

Owing to the continuous development of China’s economy and the rapid increase in population, the land use types of the Yangtze River Basin had changed enormously from 2000 to 2020. Meanwhile, the changes in land cover have altered the energy exchange between land and atmosphere, thereby affecting the local eco-climate [34]. The results of this study showed that the change pattern of S rn was not significant for different land use types, but with the increase in human activity intensity, the change pattern of R s was obvious for each land use type after it was superimposed with L rn , and R s , showing a downward trend during the period of 2000–2020 in the OU and UE areas.
In this paper, the values of LHF corresponding to net radiation were the lowest in the OU and UE areas of five land use types, indicating that the increase in human activities weakened the positive trend of LHF increase. Zhao et al. [35] found that the bio-geophysical warming caused by urbanization was mainly caused by the decrease in LHF caused by evapotranspiration, and the results were very similar to the results of this study.
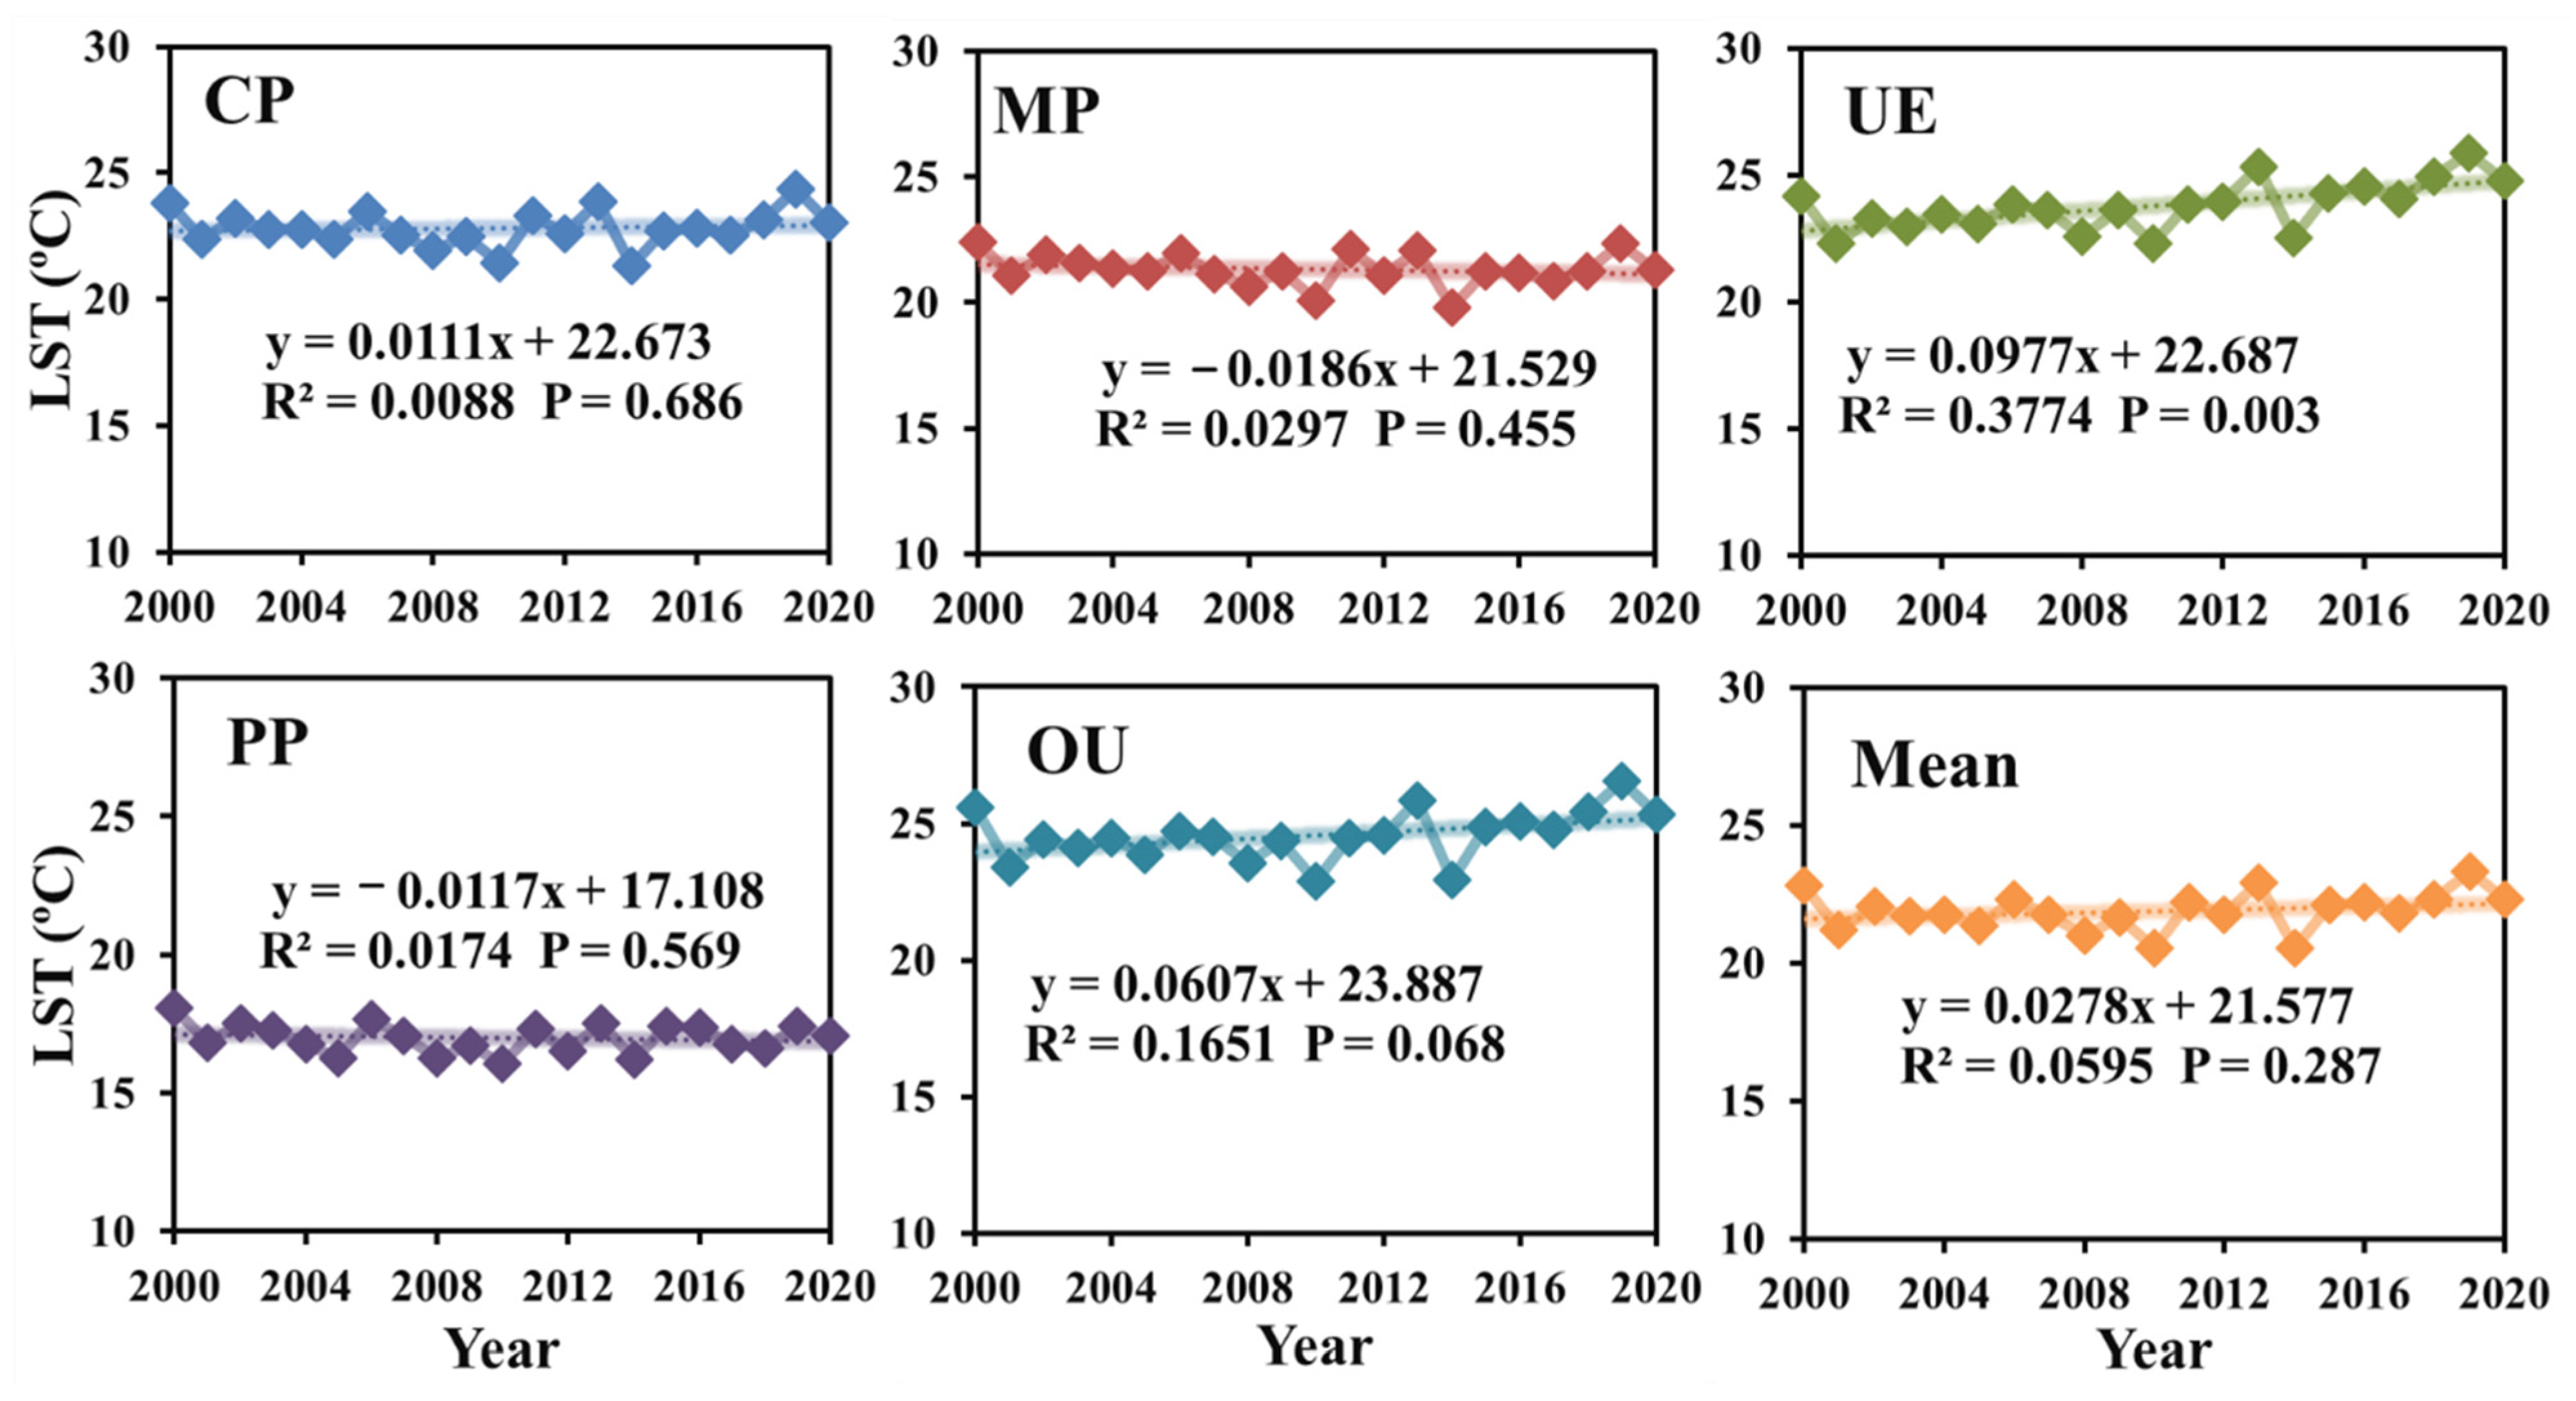
The variation of surface temperature (LST) in the Yangtze River basin from 2000 to 2020 showed the multi-year average values for different land use types from high to low were OU > UE > CP > PP > MP (Figure 13). It is worth noting that LST showed an upward trend during 2000–2020, which was consistent with the climate background of global warming. Usually, as the influence of human activity increases, the regional surface temperature will increase correspondingly, especially in urban centers, densely populated areas, impervious surfaces, and areas with low vegetation cover [36]. Therefore, rapid urbanization is an important factor that leads to the rise of land surface temperature [37] and affects vegetation within the administrative boundaries of cities [38]. As the feedback impact of land use change on regional warming enhanced, low temperature areas (such as the PP region (Figure 13)) also appeared within the Yangtze River basin, which means appropriate measures can be taken to control local temperature rises.
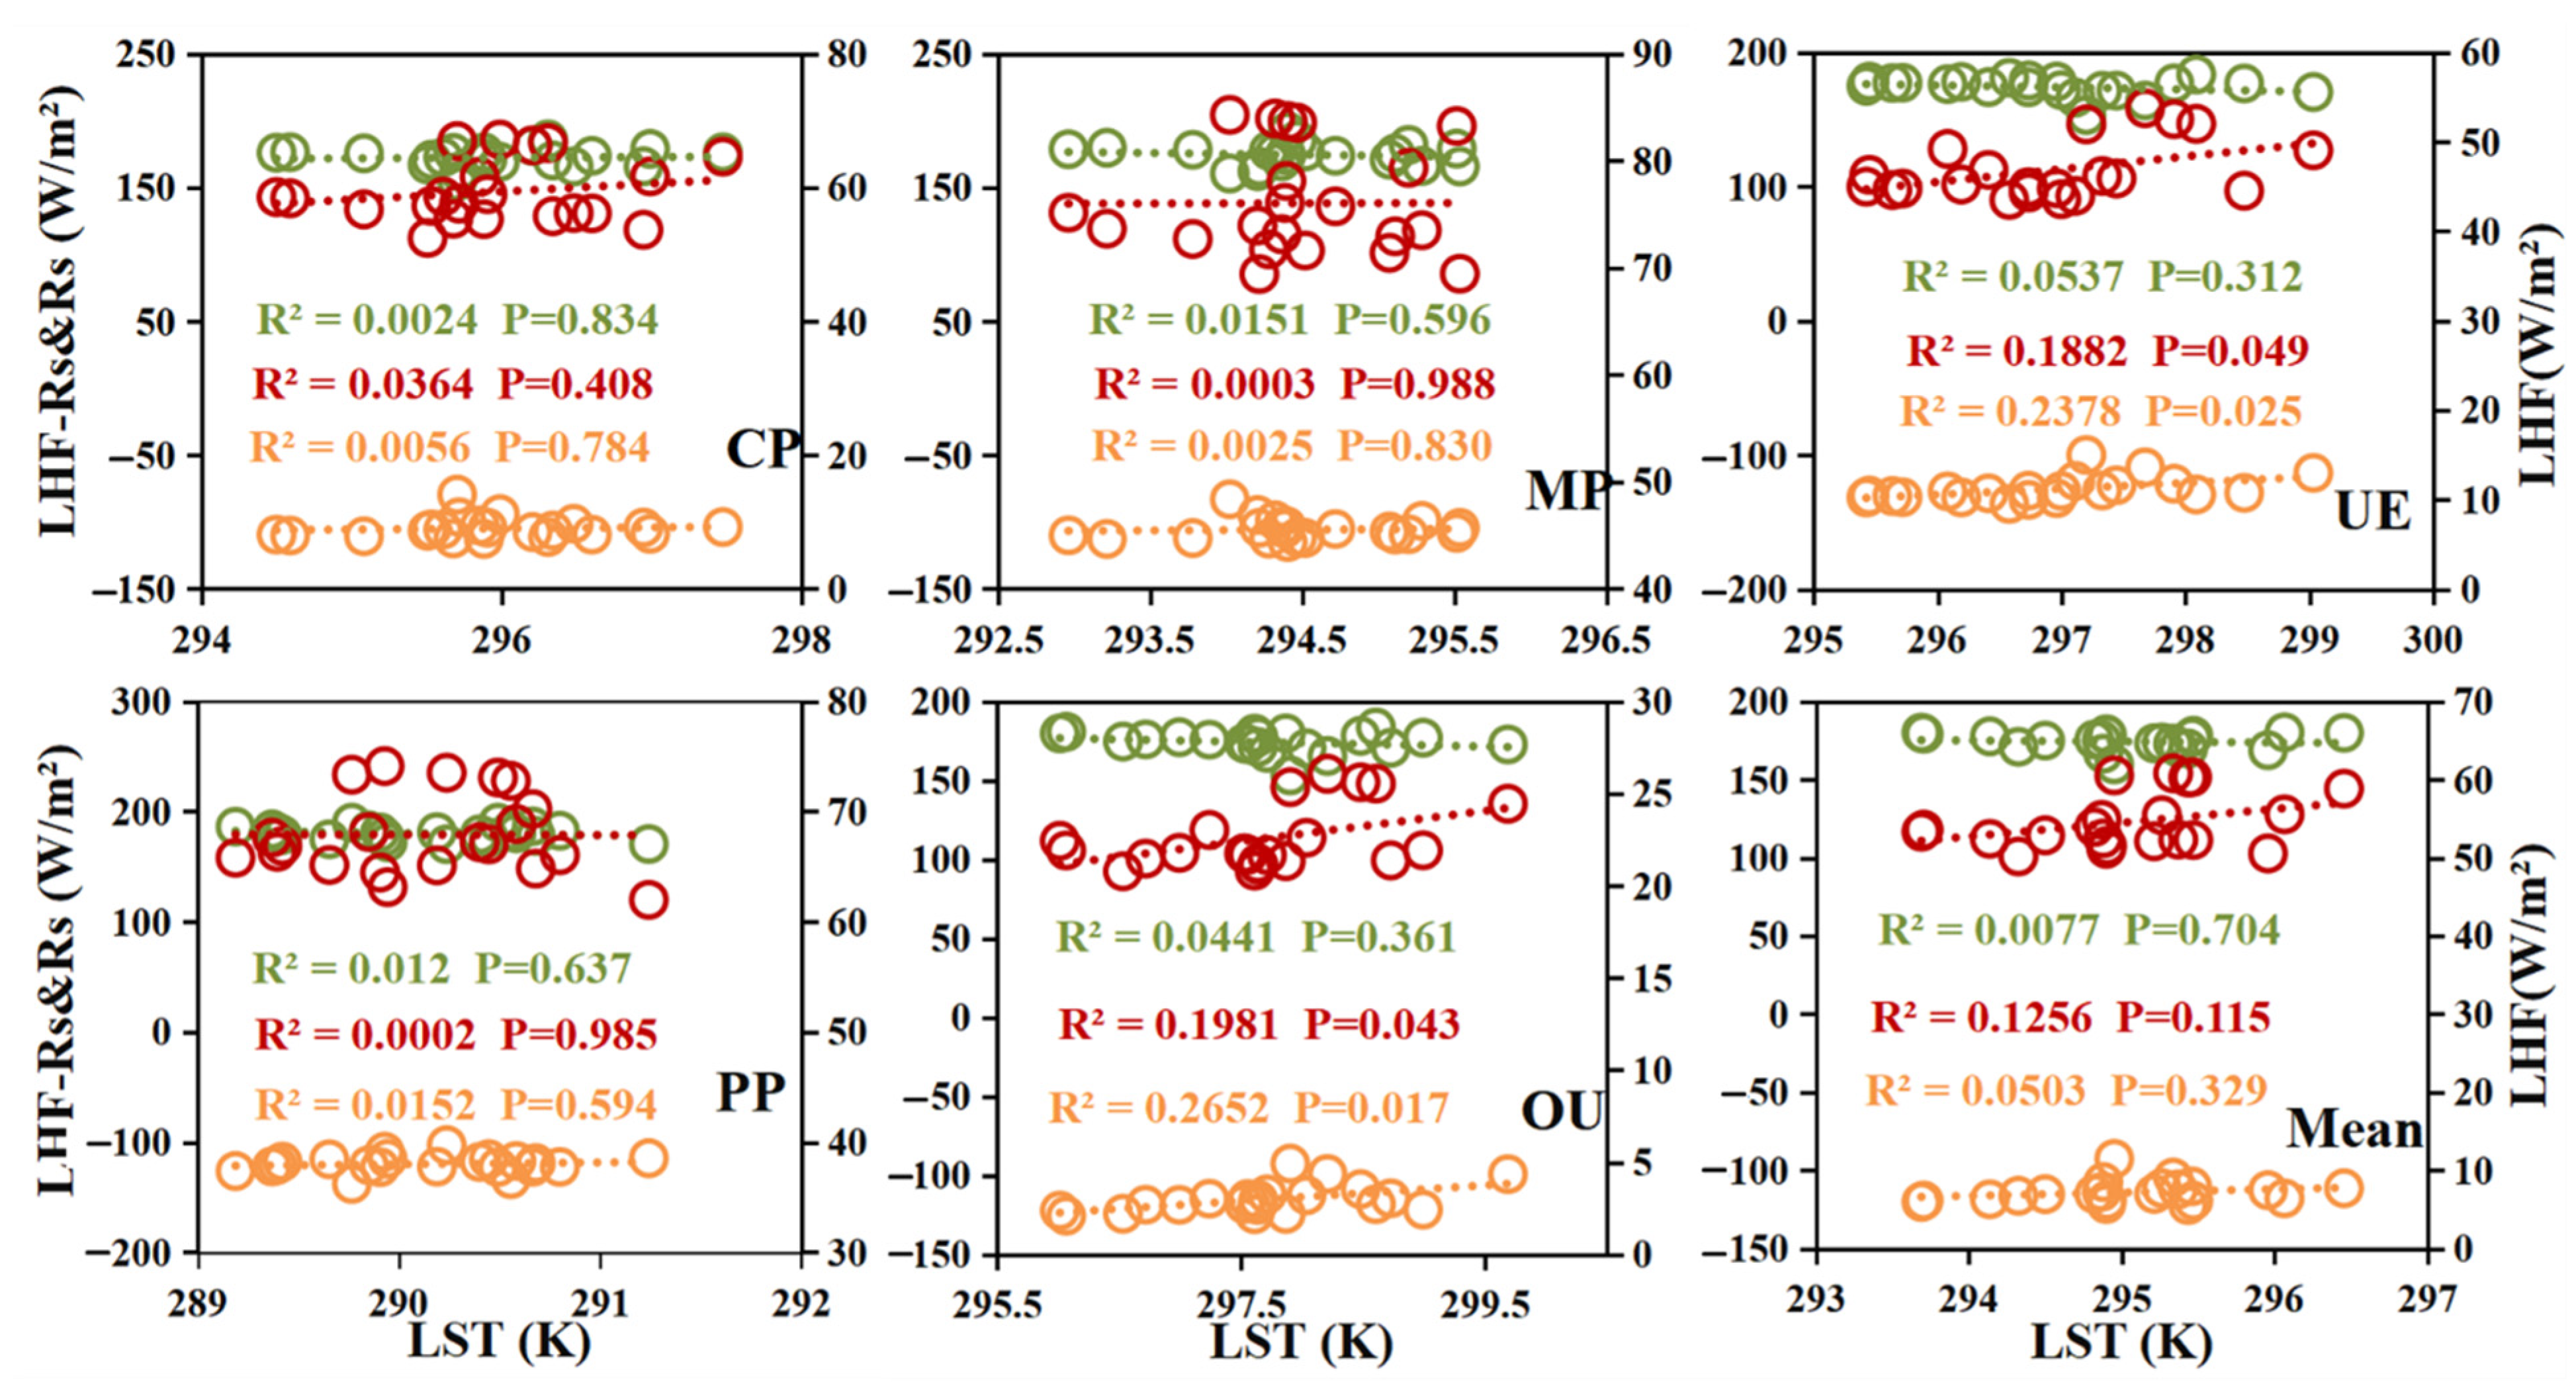
Moreover, the results of this study showed that LHF R s was more sensitive to R s than LHF within the Yangtze River basin from 2000 to 2020, and the results indicated that the regulation of net radiation was greater than the latent heat flux. As the energy balance was directly affected by land surface temperature, and the energy consumption process also responded to LST [27], the relationship between surface energy and temperature (Figure 14) was explored. It can be found that the relationship between LST and LHF R s was stronger than that between R s and LHF, but the correlations did not pass the significance test (p = 0.1). In addition, relationship between LST and R s was more significant in OU and UE areas, indicating that the regulation of R s on LST was more obvious, especially in the case of high population density. This was consistent with the results of previous studies [19].
It is generally agreed that local warming is not generated by a single factor [39] and it is closely related to the local ecological-climatic environment. The difference of land use type and spatial structure will make the energy budget and temperature different [40,41], and when analyzing the urban heat island effect the influence of different land use types and regional patterns on climate cannot be ignored. Furthermore, according to the comparisons of climate change, many studies have confirmed that vegetation-dominated ecosystems could play an important role in regulating the urban heat island effect, and it can affect the urban temperature through transpiration of vegetation and soil, thus assuming important ecological functions [42].

5. Conclusions

Based on human activity influences, the land use types within the Yangtze River basin were divided into five categories: OU, CP, MP, UE, and PP. In this study, the differences and changes of R s and LHF of five land use types from 2000 to 2020 were analyzed, and the relationship between energy budget and temperature was discussed. The main conclusions are as follows:
(1)
During the past 21 years, R s and LHF showed an increasing trend, which was more obvious in natural and semi-natural regions (PP) and mixed-pixel regions (MP). This study found that the R s and LHF of OU and UE areas with severe human intervention were much lower than those of other land use types, which indicated that human intervention and urbanization weakened the impact of surface net radiation and latent heat flux.
(2)
From 2000 to 2020, the energy absorption of LHF R s showed a downward trend, indicating that the influence of R s on surface energy absorption was greater than LHF, which was more obvious in OU and UE areas. With the continuous improvement of living standards, the impact on the surrounding nature was also expanding. Therefore, when analyzing the relationship between LUCC and radiative forcing, it is necessary to consider the influence of LHF and R s on LUCC.
(3)
The trend values of LST in the Yangtze River basin during 2000–2020 from high to low were OU > UE > CP > PP > MP. Among them, the values of LST were higher in OU and UE areas, and lower in the PP area, indicating that the trend of LST increased significantly with the increase in human activities.
Based on the land use changes in the Yangtze River basin from 2000 to 2020, this study analyzed surface energy change trends and ecological climate effects under different land use types in the past 21 years using the surface energy balance algorithm. The variation of surface temperature under different LUCC changes was elaborated from the perspective of energy balance. The results showed that there were significant differences in energy balance due to different degrees of human intervention. It is of reference value for exploring climate change trends and urban heat island effects from a biogeographic perspective. Currently, the data and methods based on this research were gained at a large regional scale, so there is a need for quantitative studies at a finer regional scale, which will help future land management practices.

Author Contributions

Conceptualization, X.Z. and S.Z.; data curation, X.Z. and M.Z.; formal analysis, M.Z. and S.Z.; investigation, M.Z. and S.Z.; methodology, X.Z., M.Z. and S.Z.; resources, S.Z. and Y.C.; software, X.Z., M.Z. and S.W.; validation, X.Z., D.L., S.X., S.Y. and S.W.; writing—original draft preparation, X.Z. and S.Z.; writing—review and editing, S.Z. and Y.C.; visualization, M.Z., D.L., S.W., S.X. and S.Y.; supervision, S.Z.; project administration, S.Z.; funding acquisition, S.Z. and Y.C. The first two authors have contributed equally to this work and should be considered co-first authors. All authors have read and agreed to the published version of the manuscript.

Funding

This research was funded by the National Natural Science Foundation of China, grant number 42005102, 42071415; The Second Tibetan Plateau Comprehensive Scientific Expedition, grant number 2019QZKK0104; The Qinghai Science and Technology Department Project, grant number 2020-ZJ-711; Outstanding Youth Foundation of Henan Natural Science Foundation, grant number 202300410049; and the National Key Research and Development Program of China, grant number 2021YFE0106700.

Data Availability Statement

Land cover data were from the satellite observation data of European Space Agency (ESA) (http://maps.elie.ucl.ac.be/CCI/viewer/download.php, visited on 26 March 2022), with a spatial resolution of 300 m. Air temperature data were from the Scientific Data Sharing Centre of the China Meteorological Administration (http://data.cma.cn/, visited on 26 March 2022). Solar radiation data were downloaded from the Laboratory of Environmental Ecology, Seoul National University (Seoul, Korea; http://environment.snu.ac.kr, visited on 26 March 2022), and solar radiation data in 2020 were from ERA5 hourly data on single levels of the European Centre for Medium-Range Weather Forecasts (https://cds.climate.copernicus.eu/cdsapp#!/dataset/reanalysis-era5-single-levels?tab=overview , accessed on 28 March 2022 ) . The water vapor pressure data were selected from the European Centre for Medium-Range Weather Forecasts (ECMWF) (https://cds.climate.copernicus.eu/cdsapp#!/search, visited on 26 March 2022), its horizontal resolution is 0.1° × 0.1°. The MODIS data (Albedo, LST, LHF and Emissivity) were obtained from National Aeronautics and Space Administration (NASA) for the years 2000 to 2020 (https://appeears.earthdatacloud.nasa.gov/, visited on 26 March 2022).

Acknowledgments

We thank the reviewers who provided valuable comments to improve the paper.

Conflicts of Interest

The authors declare no conflict of interest.

References

  1. Wild, M.A. Towards Global Estimates of the Surface Energy Budget. Curr. Clim. Chang. Rep. 2017, 3, 87–97. [Google Scholar] [CrossRef]
  2. Dabberdt, W.F.; Lenschow, D.H.; Horst, T.W.; Zimmerman, P.R.; Oncley, S.P.; Delany, A.C. Atmosphere-surface exchange measurements. Science 1993, 260, 1472–1481. [Google Scholar] [CrossRef] [PubMed]
  3. Silva, A.M.; Da Silva, R.M.; Santos, C.A.G. Automated surface energy balance algorithm for land (ASEBAL) based on automating endmember pixel selection for evapotranspiration calculation in MODIS orbital images. Int. J. Appl. Earth Obs. 2019, 79, 1–11. [Google Scholar] [CrossRef]
  4. Zhu, D.; Chen, W.; Liu, H.; Huang, R. Comparison of Characteristics of Surface Radiation Energy Budget between Typical Arid Area and Plateau in Northwest my country. Clim. Environ. Res. 2006, 6, 683–690. [Google Scholar]
  5. Yi, Y.; Wu, S.; Dai, E. Analysis of temporal and spatial evolution of potential evapotranspiration in China from 1971 to 2008. Sci. Bull. 2010, 55, 2226–2234. [Google Scholar]
  6. Choudhury, I.; Ghosh, R. Spatio-temporal coupling of land-surface and energy balance parameters with monsoon rainfall using remote-sensing technology. Int. J. Remote Sens. 2014, 35, 532–553. [Google Scholar] [CrossRef]
  7. Rotenberg, E.; Yakir, D. Contribution of Semi-Arid Forests to the Climate System. Science 2010, 327, 451–454. [Google Scholar] [CrossRef]
  8. Peng, S.S.; Piao, S.; Zeng, Z.; Ciais, P.; Zhou, L.; Li, L.Z.X.; Myneni, R.B.; Yin, Y.; Zeng, H. Afforestation in China cools local land surface temperature. Proc. Natl. Acad. Sci. USA 2014, 111, 2915–2919. [Google Scholar] [CrossRef]
  9. McGuire, A.D.; Hinzman, L.D.; Walsh, J.; Hobbie, J.; Sturm, M. Trajectory of the Arctic as an integrated system1. Ecol. Appl. 2013, 23, 1743–1744. [Google Scholar] [CrossRef]
  10. Cui, Y.; Liu, J.; Hu, Y.; Wang, J.; Kuang, W. Modeling the radiation balance of different urban underlying surfaces. Sci. Bull. 2012, 57, 465–473. [Google Scholar] [CrossRef]
  11. Luyssaert, S. Land management and land-cover change have impacts of similar magnitude on surface temperature. Nat. Clim. Chang. 2014, 4, 389–393. [Google Scholar] [CrossRef]
  12. Wang, K.; Dickinson, R.E. Global atmospheric downward longwave radiation at the surface from ground-based observations, satellite retrievals, and reanalyses. Rev. Geophys. 2013, 51, 150–185. [Google Scholar] [CrossRef]
  13. Zheng, Y.; Huang, L.; Zhai, J. Comparison of the influence of land surface cover changes on the surface albedo in four countries. J. Remote Sens. 2020, 24, 917–932. [Google Scholar]
  14. Li, Y.; Zhao, M.; Motesharrei, S.; Mu, Q.; Kalnay, E.; Li, S. Local cooling and warming effects of forests based on satellite observations. Nat. Commun. 2015, 6, 6603. [Google Scholar] [CrossRef] [PubMed]
  15. Chen, W.; Meng, H.; Song, H.; Zheng, H. Progress in Dust Modelling, Global Dust Budgets, and Soil Organic Carbon Dynamics. Land 2022, 11, 176. [Google Scholar] [CrossRef]
  16. Kang, Z.; Zhang, Z.; Liu, L.; Wang, T.; Tian, H.; Chen, H.; Zhang, X. Analysis of temporal and spatial variation characteristics of surface temperature in Xinjiang based on MODIS. Geogr. Res. 2022, 41, 997–1017. [Google Scholar]
  17. Guan, Y.; Wang, R.; Li, C.; Yao, J. Variation characteristics of ground surface temperature in northern piedmont of Tianshan Mountains during 1963–2010. J. Arid Meteorol. 2015, 33, 587–594. [Google Scholar]
  18. Pei, L.; Moore, N.; Zhong, S.; Kendall, A.D.; Gao, Z.; Hyndman, D.W. Effects of irrigation on summer precipitation over the United States. J. Clim. 2016, 29, 3541–3558. [Google Scholar] [CrossRef]
  19. Zhu, M.; Liu, D.; Tang, W.; Chi, Q.; Zhao, X.; Xu, S.; Ye, S.; Wang, Y.; Cui, Y.; Zhou, S. Exploring the Ecological Climate Effects Based on Five Land Use Types: A Case Study of the Huang-Huai-Hai River Basin in China. Land 2022, 11, 265. [Google Scholar] [CrossRef]
  20. Stenseth, N.C.; Mysterud, A.; Ottersen, G.; Hurrell, J.W.; Chan, K.; Lima, M. Ecological Effects of Climate Fluctuations. Science 2002, 297, 1292–1296. [Google Scholar] [CrossRef]
  21. Forzieri, G.; Alkama, R.; Miralles, D.G.; Cescatti, A. Satellites reveal contrasting responses of regional climate to the widespread greening of Earth. Science 2017, 356, 1180–1184. [Google Scholar] [CrossRef] [PubMed]
  22. Chi, Q.; Zhou, S.; Wang, L.; Zhu, M.; Liu, D.; Tang, W.; Cui, Y.; Lee, J. Exploring on the Eco-Climatic Effects of Land Use Changes in the Influence Area of the Yellow River Basin from 2000 to 2015. Land 2021, 10, 601. [Google Scholar] [CrossRef]
  23. Wang, Q.; Zhang, M.; Wang, S.; Luo, S.; Wang, B.; Zhu, X. Analysis of Extreme Temperature Events in the Yangtze River Basin from 1962 to 2011. Acta Geogr. Sin. 2013, 68, 611–625. [Google Scholar]
  24. Wang, L.; Qiu, X.; Wang, P.; Liu, A. Distributed Simulation of Total Solar Radiation in Yangtze River Basin under Complex Terrain. Acta Geogr. Sin. 2010, 65, 543–552. [Google Scholar]
  25. Wang, D.W.; He, P.; Xu, J.; Wang, J. Changes of land use and ecosystem service in the Yangtze River Basin after five years’ general protection. J. Environ. Eng. 2022, 12, 408–416. [Google Scholar]
  26. Zhao, H.; He, H.; Bai, C.; Zhang, C. Spatial-Temporal Characteristics of Land Use Change in the Loess Plateau and Its Environmental Effects. China Land Sci. 2018, 32, 49–57. [Google Scholar]
  27. Zhou, S.; Wang, K.; Yang, S.; Li, W.; Zhang, Y.; Zhang, B.; Fu, Y.; Liu, X.; Run, Y.; Chubwa, O.G.; et al. Warming Effort and Energy Budget Difference of Various Human Land Use Intensity: Case Study of Beijing, China. Land 2020, 9, 280. [Google Scholar] [CrossRef]
  28. Benali, A.; Carvalho, A.C.; Nunes, J.P.; Carvalhais, N.; Santos, A. Estimating air surface temperature in Portugal using MODIS LST data. Remote Sens. Environ. 2012, 124, 108–121. [Google Scholar] [CrossRef]
  29. Zheng, H.; Ren, Q.; Zheng, K.; Qin, Z.; Wang, Y.; Wang, Y. Spatial distribution and risk assessment of metal(loid)s in marine sediments in the Arctic Ocean and Bering Sea. Mar. Pollut. Bull. 2022, 179, 113729. [Google Scholar] [CrossRef]
  30. Ma, T.; Li, X.; Bai, J.; Cui, B. Tracking three decades of land use and land cover transformation trajectories in Chinese large river deltas. Land Degrad. Dev. 2019, 30, 799–810. [Google Scholar] [CrossRef]
  31. Duveiller, G.; Caporaso, L.; Abad-Viñas, R.; Perugini, L.; Grassi, G.; Arneth, A.; Cescatti, A. Local biophysical effects of land use and land cover change: Towards an assessment tool for policy makers. Land Use Policy 2020, 91, 104382. [Google Scholar] [CrossRef]
  32. Yu, X.; Jia, S.; Zhu, W. Estimation of Land Surface Net Radiation Flux based on Remote Sensing and Analysis of its Spatial-temporal Characteristics in Qinghai Province. Plateau Meteorol. 2021, 13, 407–422. [Google Scholar]
  33. Li, Y.; Piao, S.; Chen, A.; Ciais, P.; Li, L.Z.X. Local and teleconnected temperature effects of afforestation and vegetation greening in China. Natl. Sci. Rev. 2020, 7, 897–912. [Google Scholar] [CrossRef] [PubMed]
  34. Du, J.; Wang, K.; Wang, J.; Ma, Q. Contributions of surface solar radiation and precipitation to the spatiotemporal patterns of surface and air warming in China from 1960 to 2003. Atmos. Chem. Phys. 2017, 17, 4931–4944. [Google Scholar] [CrossRef]
  35. Zhao, G.; Dong, J.; Cui, Y.; Liu, J.; Zhai, J.; He, T.; Zhou, Y.; Xiao, X. Evapotranspiration-dominated biogeophysical warming effect of urbanization in the Beijing-Tianjin-Hebei region, China. Clim. Dynam. 2019, 52, 1231–1245. [Google Scholar] [CrossRef]
  36. Portela, C.I.; Massi, K.G.; Rodrigues, T.; Alcântara, E. Impact of urban and industrial features on land surface temperature: Evidences from satellite thermal indices. Sustain. Cities Soc. 2020, 56, 102100. [Google Scholar] [CrossRef]
  37. Zhou, S.; Liu, D.; Zhu, M.; Tang, W.; Chi, Q.; Ye, S.; Xu, S.; Cui, Y. Temporal and Spatial Variation of Land Surface Temperature and Its Driving Factors in Zhengzhou City in China from 2005 to 2020. Remote Sens. 2022, 14, 4281. [Google Scholar] [CrossRef]
  38. Cui, Y.; Xiao, X.; Dong, J.; Zhang, Y.; Qin, Y.; Doughty, R.B.; Wu, X.; Liu, X.; Joiner, J.; Moore, B. Continued Increases of Gross Primary Production in Urban Areas during 2000–2016. J. Remote Sens. 2022, 14, 2022. [Google Scholar] [CrossRef]
  39. Liu, X.; Ming, Y.; Liu, Y.; Yue, W.; Han, G. Influences of landform and urban form factors on urban heat island: Comparative case study between Chengdu and Chongqing. Sci. Total Environ. 2022, 820, 153395. [Google Scholar] [CrossRef]
  40. Shan, B.; Zhang, Q.; Ren, Q. Spatial differentiation of urban thermal environment and its influencing factors based on local climate zones in Jinan. J. Geo-Inf. Sci. 2022, 24, 711–722. [Google Scholar]
  41. Yang, J.; Zhan, Y.; Xiao, X.; Xia, J.C.; Sun, W.; Li, X. Investigating the diversity of land surface temperature characteristics in different scale cities based on local climate zones. Urban Clim. 2020, 34, 100700. [Google Scholar] [CrossRef]
  42. Vahmani, P.; Jones, A.D. Water conservation benefits of urban heat mitigation. Nat. Commun. 2017, 8, 1072. [Google Scholar] [CrossRef] [PubMed] [Green Version]
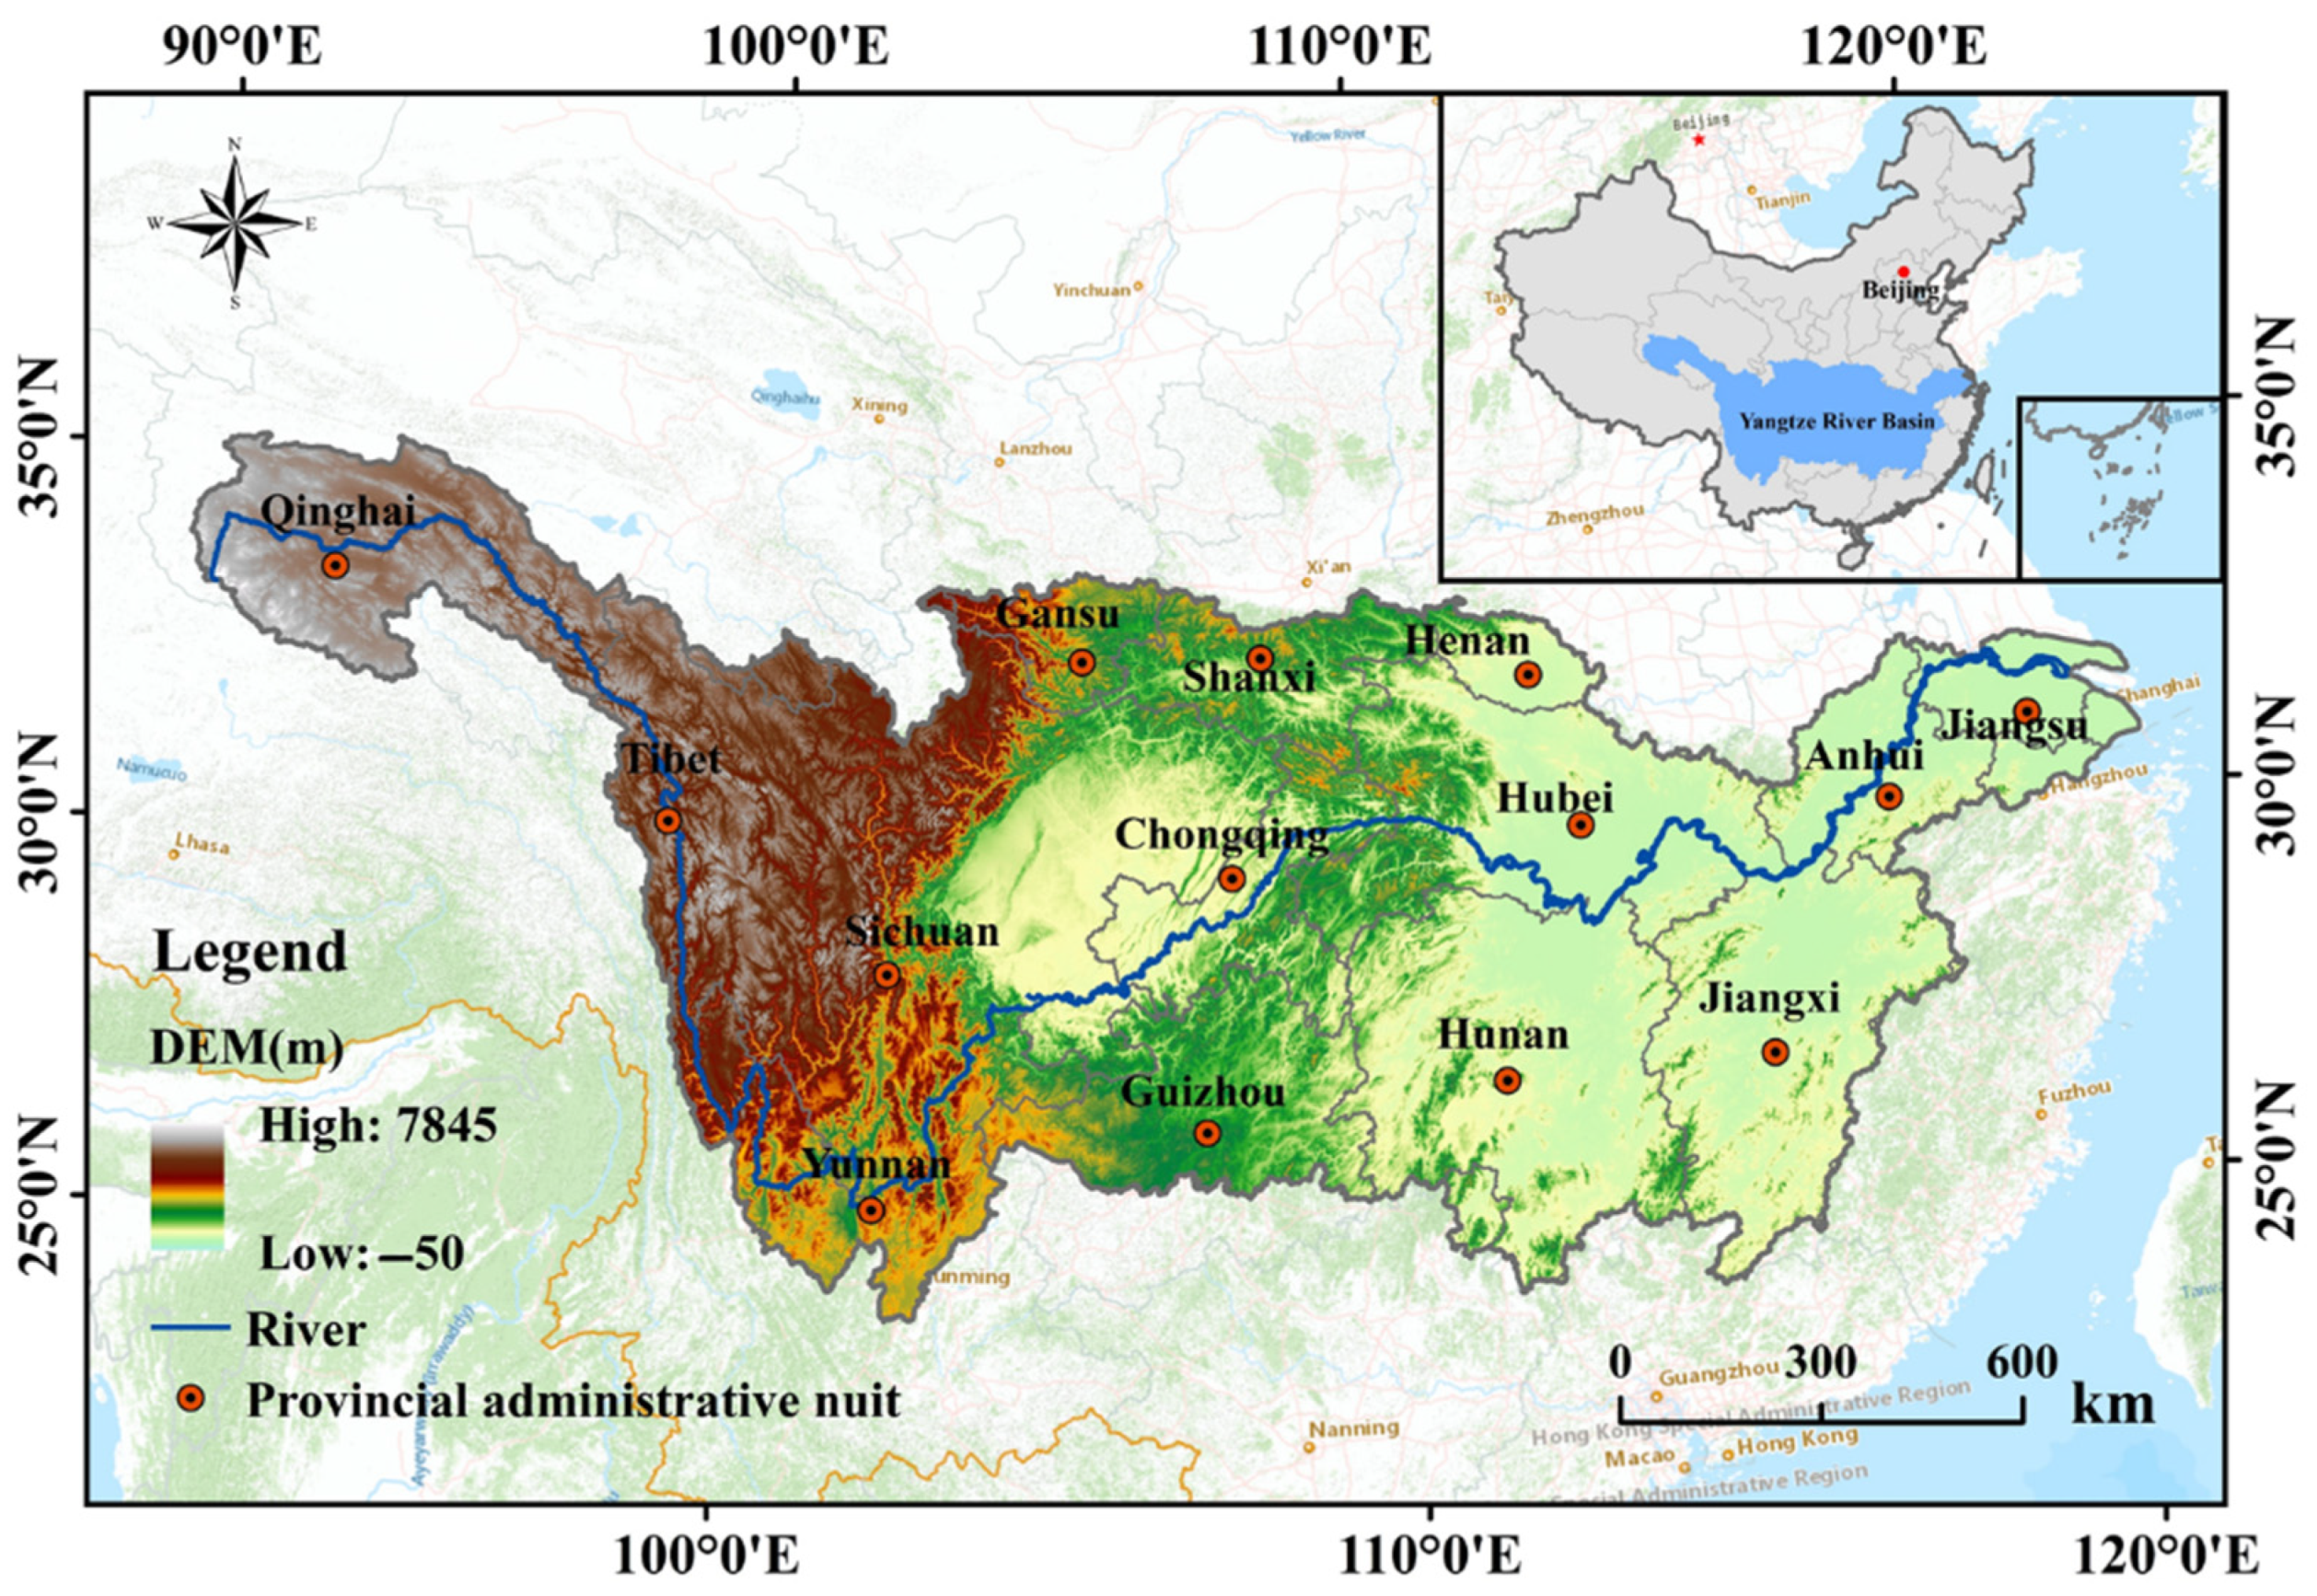
Figure 1. Location map of the Yangtze River basin.
Land 11 01636 g001
Figure 2. Spatial distribution of land use types in the Yangtze River basin in 2020.
Land 11 01636 g002
Figure 3. Research framework of energy budget feedback of land use change.
Land 11 01636 g003
Figure 4. Spatial differences of (a) net short-wave radiation ( S rn ) and (b) net long-wave radiation ( L rn ) in the Yangtze River basin from 2000 to 2020.
Land 11 01636 g004
Figure 5. Statistical values of (a) net short-wave radiation ( S rn ) and (b) net long-wave radiation ( L rn ) based on five land types in the Yangtze River basin from 2000 to 2020.
Land 11 01636 g005
Figure 6. (a) Spatial variation in net radiation ( R s ) in the Yangtze River basin from 2000–2020 and (b) statistical values for the five use types.
Land 11 01636 g006
Figure 7. Net radiation ( R s ) trend of different land use types in the Yangtze River basin from 2000 to 2020.
Land 11 01636 g007
Figure 8. (a) spatial variation of latent heat flux (LHF) and (b) statistical values for the five land use types in the Yangtze River basin from 2000 to 2020.
Land 11 01636 g008
Figure 9. Latent heat flux (LHF) trend of different land use types in the Yangtze River basin from 2000 to 2020.
Land 11 01636 g009
Figure 10. (a) Spatial variation ( LHF R s ) and (b) statistical values for the five land use types in the Yangtze River basin from 2000 to 2020.
Land 11 01636 g010
Figure 11. Variation trends of net radiation ( LHF R s ) under different land use types in the Yangtze River basin from 2000 to 2020.
Land 11 01636 g011
Figure 12. Correlation between and LHF, R s , and LHF R s under the five land types in the Yangtze River basin from 2000 to 2020(green dots and green lines represent LHF R s and R s   scatter plots, red dots and red lines represent LHF R s and LHF scatter plots).
Land 11 01636 g012
Figure 13. The variation trend of land surface temperature (LST) of different land use types in the Yangtze River basin from 2000 to 2020.
Land 11 01636 g013
Figure 14. Correlation between LST, R s , and LHF R s in the Yangtze River basin from 2000 to 2020 (green dots and green lines represent LST and R s   scatter plots, red dots and red lines represent LST and LHF scatter plots, and orange dots and orange lines represent LST and LHF R s scatter plots).
Land 11 01636 g014
Table 1. MODIS data products items and descriptions.
Data ItemsTime ResolutionSpatial ResolutionData Resource
Albedodaily500 mMCD43A3
Temperature (LST)daily1 kmMOD11A1
Latent heat flux (LHF)8 daily500 mMOD16A2
Emissivitydaily1 kmMOD11A1
Table 2. Statistics on the proportion of land type change.
Land Use Change from 2000 to 2020 Unchanged Land Types from 2000 to 2020
CategoriesPercentageCategoriesPercentage
cropland to urban areas0.95%urban areas0.46%
natural and semi-natural areas to urban areas0.29%cropland33.58%
natural and semi-natural areas to cropland0.74%natural and semi-natural areas63.25%
cropland to natural and semi-natural areas0.73%
Publisher’s Note: MDPI stays neutral with regard to jurisdictional claims in published maps and institutional affiliations.