Article

The Spatial and Temporal Evolution Pattern and Transformation of Urban–Rural Construction Land in Karst Mountainous Areas: Qixingguan District of Guizhou, Southwest China

1
School of Karst Science, Guizhou Normal University, Guiyang 550001, China
2
School of Geography & Environmental Science, Guizhou Normal University, Guiyang 550001, China
3
The Third Surveying and Mapping Institute of Guizhou Province, Guiyang 550004, China
4
State Engineering Technology Institute for Karst Desertification Control, Guiyang 550001, China
5
Guizhou Vocational and Technical Collage of Water Resources and Hydropower, Guiyang 551416, China
*
Author to whom correspondence should be addressed.
Land 2022, 11(10), 1734; https://doi.org/10.3390/land11101734
Submission received: 28 August 2022 / Revised: 30 September 2022 / Accepted: 1 October 2022 / Published: 7 October 2022
(This article belongs to the Special Issue Karst Land System and Sustainable Development)

Abstract

:
Studying the temporal and spatial evolution pattern and transformation rule of urban–rural construction land in karst mountainous areas has important guiding significance for urban development boundary planning, red lines for ecological protection, and cultivated land protection. The present study took 46 townships (streets) in Qixingguan District of Guizhou Province, southwest China, as the research area; collected the current status of four-phase land use data in 2009, 2013, 2017, and 2020; and used GIS spatial analysis models and geographical detectors to analyze the temporal and spatial evolution pattern characteristics and influencing factors of urban–rural construction. The results showed the following: (1) Since 2009, the total area of urban–rural construction land has continued to increase; the largest area is rural residential land, followed by urban land and transportation land, with relatively little urban industrial and mining land, scenic spots, and special land. The growth rate of land used for transport increased rapidly, and urban land grew faster than rural residential land. (2) More than 57.72% of the newly increased urban–rural construction land came from cultivated land, but the transformation of cultivated land for construction gradually slowed down; 57.48% of urban–rural construction land was transferred for reclamation as cultivated land. During the study period, the transformation of cultivated land to construction land was more intense (the transfer out of cultivated land was greater than the transfer in by 9541.94 hm2). (3) There are strong spatial differences in the density of urban–rural construction land, showing scattered agglomeration distribution, and the degree of aggregation in medium-high- and high- density areas is further strengthened, expanding to the east and southwest. (4) The growth of urban–rural construction land has been controlled by a variety of complex factors, the most influential of which are the completion of fixed asset investment in society as a whole and the total fiscal revenue, with explanatory power (PD) values of 0.819 and 0.607, respectively. Interactions between detection factors have a greater impact on the spatial differentiation of urban–rural construction land than single factors. The results of this study can provide basic research data and support the control and high-quality development of urban–rural construction land in Qixingguan District and karst mountain areas.

1. Introduction

Land use transformation was first proposed by the British geographer Alan Grainger, inspired by the concept of forest transformation proposed by the Finnish scholar A.S. Mather [1]. The transforming land types mainly include cultivated land [2,3,4], forest land, urban land [5,6], rural land, and other land use types, and they also include the overall regional land use type [7,8]. With the acceleration of urbanization and increasing human activities, the transformation of urban–rural construction land in land use transformation has become an important socioeconomic phenomenon worldwide [9,10]. Urban–rural construction land is the core component of the land use system. It is not only an important indicator to control urban expansion and urban–rural construction, but also the main component of urban spatial planning and the spatial carrier of human non-agricultural economic production activities [11,12,13]. At present, under circumstances in which global warming is causing glaciers to melt and inundate some coastal areas, forests are sharply reduced, the environmental carrying capacity is fragile, and human activities affect vegetation restoration [14,15,16], how to realize scientific and sustainable utilization of limited land resources has become a key issue for the future development of the world. Whether urban–rural construction land can be reasonably controlled and allocated will directly affect the protection of cultivated land and the development of urbanization.
In recent years, many scholars have studied the evolution and driving factors of urban–rural construction land by applying current land use data and using different methods [17,18,19,20]. Weber and Puissant extracted land cover from 1986 to 1996 with time series satellite images (SPOT XS), used a prediction model to carry out an empirical analysis of the expansion characteristics of local construction land in Tunisia, and explained the development trend of the city in the future [21]. Based on Landsat satellite observation data, Masek et al. used the band reflection of NDVI to distinguish urban and agricultural land, and dynamically monitored the expansion and evolution process of urban construction land in Washington, DC, from 1973 to 1996. In conjunction with census data, they found that urban expansion was strongly correlated with the regional economic development level [22]. Saizen et al. quantitatively analyzed land use changes in the Osaka metropolitan area of Japan from 1979 to 1996 through GIS raster data, and the results showed that the main reason for the continuous increase in idle land in the suburbs was urban sprawl [23]. Ustaoglu and Aydmoglu used an integrated geographic information system (GIS) and multicriteria decision analysis (MCA) approach to assess the suitability of land use in the Pendikc area of eastern Istanbul, Turkey, for residential, industrial, commercial, and recreational development in the city [24].
Mann used a regression analysis model to study the main driving factors of changes in per capita construction land in rural areas and suggested that the implementation of incentive measures for construction land management by local governments could limit the expansion of construction land to a certain extent [25]. Colsaet et al. analyzed the scientific literature on the occupation of agricultural land by urban construction land and the determinants of urban expansion from 1990 to 2017, and suggested that population and income growth, transportation infrastructure, and car use were the main driving factors [26]. Bittner et al. studied the spatial evolution of land use in peri-urban areas of Israel based on time-series land use data supplemented by summary statistical analysis, and indicated that rural reorganization would have an important impact on the economic society and ecological environment [27]. Diogo and Koomen studied the process of land use change in Portugal between 1990 and 2006 and analyzed the impact of different driving forces on the formation of land use patterns during this period. They concluded that land expansion was positively correlated with economic development, and the driving influence of economic factors on land use change remained stable in a certain period.
The deployment of new infrastructure and the gradual implementation of territorial space planning policies will also affect land expansion [28]. However, the results of previous works illustrate that the main driving factors for the evolution of urban–rural construction land are the economic and social development level, social living conditions, and the policy and institutional environment, etc. [29,30]. Overall, most studies on the influencing factors of spatiotemporal changes of urban–rural construction land are based on linear analysis, trend analysis, and correlation analysis; however, it is still difficult to quantitatively de-compose the influencing factors of such land changes.
The above studies are of great significance for understanding the driving factors of urban–rural construction land changes, but the disadvantage of the methods used is that they assume there is a constant and significant linear relationship between the driving forces and land changes across the entire time series. An idealized linear model or qualitative description can reveal the complex driving forces; in fact, there is no strict linear relationship between the transformation of urban–rural construction land and socioeconomic development, population density [31], or urban residential development [32]. Although studies have applied algorithms such as K-means [33] for classification and partitioning, statistical methods for spatial differentiation need to be further developed.
Geographical detector comprises a group of statistical methods that detect spatial differentiation and reveal driving forces [34]. Therefore, this study applied the geographic detector model to analyze the characteristics and driving mechanisms of the transformation of urban–rural construction land in typical karst mountain areas to explain the interactions between social and economic activities and changes in such land. The results of the present study are intended to help local governments explore whether any unreasonable, unsustainable land use resulted from unsustainable human activities and development practices, and thus adapt to current village planning and urbanization strategies and optimize the efficiency of land resource allocation. Moreover, this study can also provide reference for the urban–rural development of other karst areas and promote the integration of urban and rural transformation and land use transformation.

2. Materials and Methods

2.1. Study Area

The present study area is located within Qixingguan District (27°03′–27°46′ N, 104°51′–105°55′ E), Guizhou Province, southwest China, on the slopes of the Yunnan–Guizhou Plateau, sloping toward the eastern low mountains (Figure 1) and covering an area of 3411.14 km2. The study area is adjacent to Yunnan Province in the west and Sichuan Province in the north and is the transportation and logistics hub of southwest China [35]. The elevation ranges from 456 to 2210 m. The terrain is high in the west and low in the east. The landform type is mainly mid-size mountains and hills. The western area has a concentration of high mountains, mid-size mountains, and valleys, and the terrain is steep, with ravines and mountains intertwined in the northeast. Most of the central area consists of river valley flats and middle mountains [36]. The type of soil in this area is mainly yellow soil (43.27%), which develops from limestone, followed by lime soil, yellow brown soil, paddy soil, and coarse bone soil [37]. This area is located in the hinterlands of the Wumeng Mountains. It is a typical karst mountain area with completely developed karst landforms and severe rocky desertification, resulting in a low ecological environment capacity and a fragile ecologic system. In terms of economic development, in 2020, the gross regional product of Qixingguan District was RMB 50.006 billion, a year-over-year increase of 4.4%; the fixed asset investment of the region increased by 3.7% over the previous year; the total fiscal revenue of the region was RMB 11.749 billion, an increase of −2.4% over the previous year; and the general public budget revenue was RMB 2.572 billion, an increase of −9.1% over the previous year.

2.2. Data Resources

The data of the present study mainly come from the National Remote Sensing Center, Guizhou Branch (Guizhou Provincial Remote Sensing Center) and the State Engineering Technology Institute for Karst Desertification Control, Guiyang, China, including land use data of 2009, 2013, 2017, and 2020. Administrative division data from Qixingguan District, road vector data, statistical yearbook data for Qixingguan District from 2009 to 2020, and Seventh National Census Data were also used. This part of the data takes the 46 townships or streets as the basic unit for attribute assignment. Digital elevation model (DEM) data with 30 m resolution were acquired from the Geospatial Data Cloud (http://www.gscloud.cn/). In this study, the first land use included cultivated land, garden land, forest land, grassland, water area, construction land, and other land types. According to the Land Use Status Classification System (GB/T21010-2017) [38] and previous research [39], the second class of construction land included urban land, urban industrial and mining land, rural residential land, transportation land, scenic spots, and special land.

2.3. Analysis

2.3.1. GIS Spatial Analysis Method

We used ArcGIS software for basic data processing, topological analysis, summary statistics, spatial display, thematic map production, etc. [40], and the GIS spatial overlay tool to carry out overlay analysis on land types in two different periods. The final land use transition matrix was formed through statistical analysis. The land use transfer matrix can quantitatively describe the quantity and direction of mutual conversion between land types in a specific area in a certain period of time. By analyzing the transfer matrix of urban–rural construction land area, the total change between land types in two phases can be obtained. In this study, the land use transfer matrix [41] was used to describe the structural transformation trend between urban–rural construction land and other land types, and its mathematical expression is as follows:
S i j = S 11 S 12 S 1 m S 21 S 22 S 2 m S m 1 S m 2 S m m
where S is the area of land use, m is the type of land use, and i and j are the land use types used in the initial and final stages, respectively. The land use transfer matrix is mainly used to study the transfer of land use types between two adjacent periods to clarify variations in each type at the beginning of the study and the source and composition of each type at the end of the study [42].

2.3.2. Selection of Influencing Factors

Combined with the actual social economy and natural environment conditions in Qixingguan District, and based on the principle of data accessibility, the following 3 cate-gories and 12 detection factors were selected as explanatory variables to explore the driving factors of urban–rural construction land transformation (Table 1). The influencing factors mainly include the economic development level [43,44], social living conditions, and basic natural conditions. The geomorphology of the present study area is of the mid-size mountain type, and it is located in the sloping zone of the transition from the eastern Yunnan Plateau to the original hills of the central Guizhou Mountains. The altitudinal variation is 1754 m. Altitude, terrain slope, and road network density are the natural constraints of urban spatial layout. Urban–rural construction land is the main spatial carrier in the process of regional economic and social development. The improvement of the overall economic development level (total social investment in fixed assets, total fiscal revenue, per capita GDP, per land GDP, and total industrial output value) continuously promotes the speed of urban–rural construction land expansion. In addition, the urbanization rate, population density, year-end resident population, and year-end salary of employees were used to represent the effects of regional social living conditions on the expansion of urban–rural construction land.
On the basis of index construction, SPSS 19.0 software was used to conduct the Kai-ser-Meyer-Olkin (KMO) test to check correlations and partial correlations between variables. The resulting values are between 0 and 1; the closer the KMO statistic is to 1, the stronger the correlation between variables, and the weaker the partial correlation, the better the effect of factor analysis. Bartlett’s sphericity test judges whether the correlation matrix is a unit matrix, and if the independent factor analysis method of each variable is invalid. When the test results of the 12 indicators in 4 monitoring periods by SPSS showed a p-value < 0.05, this meant that the standard was met, the data were spherically distributed, and the variables had a spherical distribution independent of each other to a certain extent. The calculated KMO values were 0.665, 0.713, 0.785, and 0.692, which were all greater than the threshold of 0.5. Bartlett’s test results were all significant at the 0.01 level, indicating a correlation between the variables of each index, and factor analysis could be carried out.

2.3.3. Geographical Detector

The spatial distribution patterns of the geography or phenomena in a region are driven by both natural and human factors. By analyzing the relationship between the de-pendent and independent variables, the geographic detector can better describe the spatial heterogeneity of the dependent variable, and it is an effective spatial analysis method for revealing mechanisms [45]. It has been widely used [46,47,48]. If the independent variable has a significant effect on the dependent variable, then the spatial distributions of the two variables are similar. The formula is as follows:
PD   =   1     1 n σ 2 h   =   1 L n h σ h 2   =   1     SSW SST
SSW = h   =   1 L N h σ h 2 ,   SST   =   N σ 2
In this formula, PD is the explanatory power, with a value ranging from 0 to 1; n and nh are the numbers of samples in the entire area and in layer h, respectively; σ2 and σh2 are the dispersion variance of the entire area and layer h, respectively; L is the number of subareas; and SST and SSW are the total variance of the study area and the sum of the variance of the subregions, respectively. The larger the PD value, the stronger the driving effect of the detection factor on the evolution of urban–rural construction land.
The steps of the geographical detection operation are as follows:
(1) Extract information. In ArcGIS 10.5, villages and towns or streets are taken as the basic research units, and then the data of urban–rural construction land and influencing factors of each town or street are correlated according to the spatial location to generate an attribute table and obtain the quantitative relationship between the corresponding urban–rural construction land and each selected indicator.
(2) Classify impact factors. Using the Reclassify tool in ArcGIS, each impact factor is classified according to the natural breakpoint method [49], and the classification value of each variable is extracted. Then, the per capita GDP, land average GDP, urbanization rate, total industrial output value, completion of fixed asset investment in the whole society, and total salary of employees at the end of the year are divided into 5 grades, and the average slope, average elevation, year-end total population, and population density are divided into 6 grades. In addition, total fiscal revenue and road network density are divided into 7 and 9 categories, respectively.
(3) Input the dependent variable Y (statistical value of urban–rural construction land area) and the independent variable X (gradual value of each influencing factor) into Excel Geodetector software (http://www.geodetector.cn) to detect the influence of factors and their interactions.

3. Results and Discussion

3.1. Spatiotemporal Pattern Analysis of Urban–Rural Construction Land

3.1.1. Structure and Spatial Pattern of Urban–Rural Construction Land

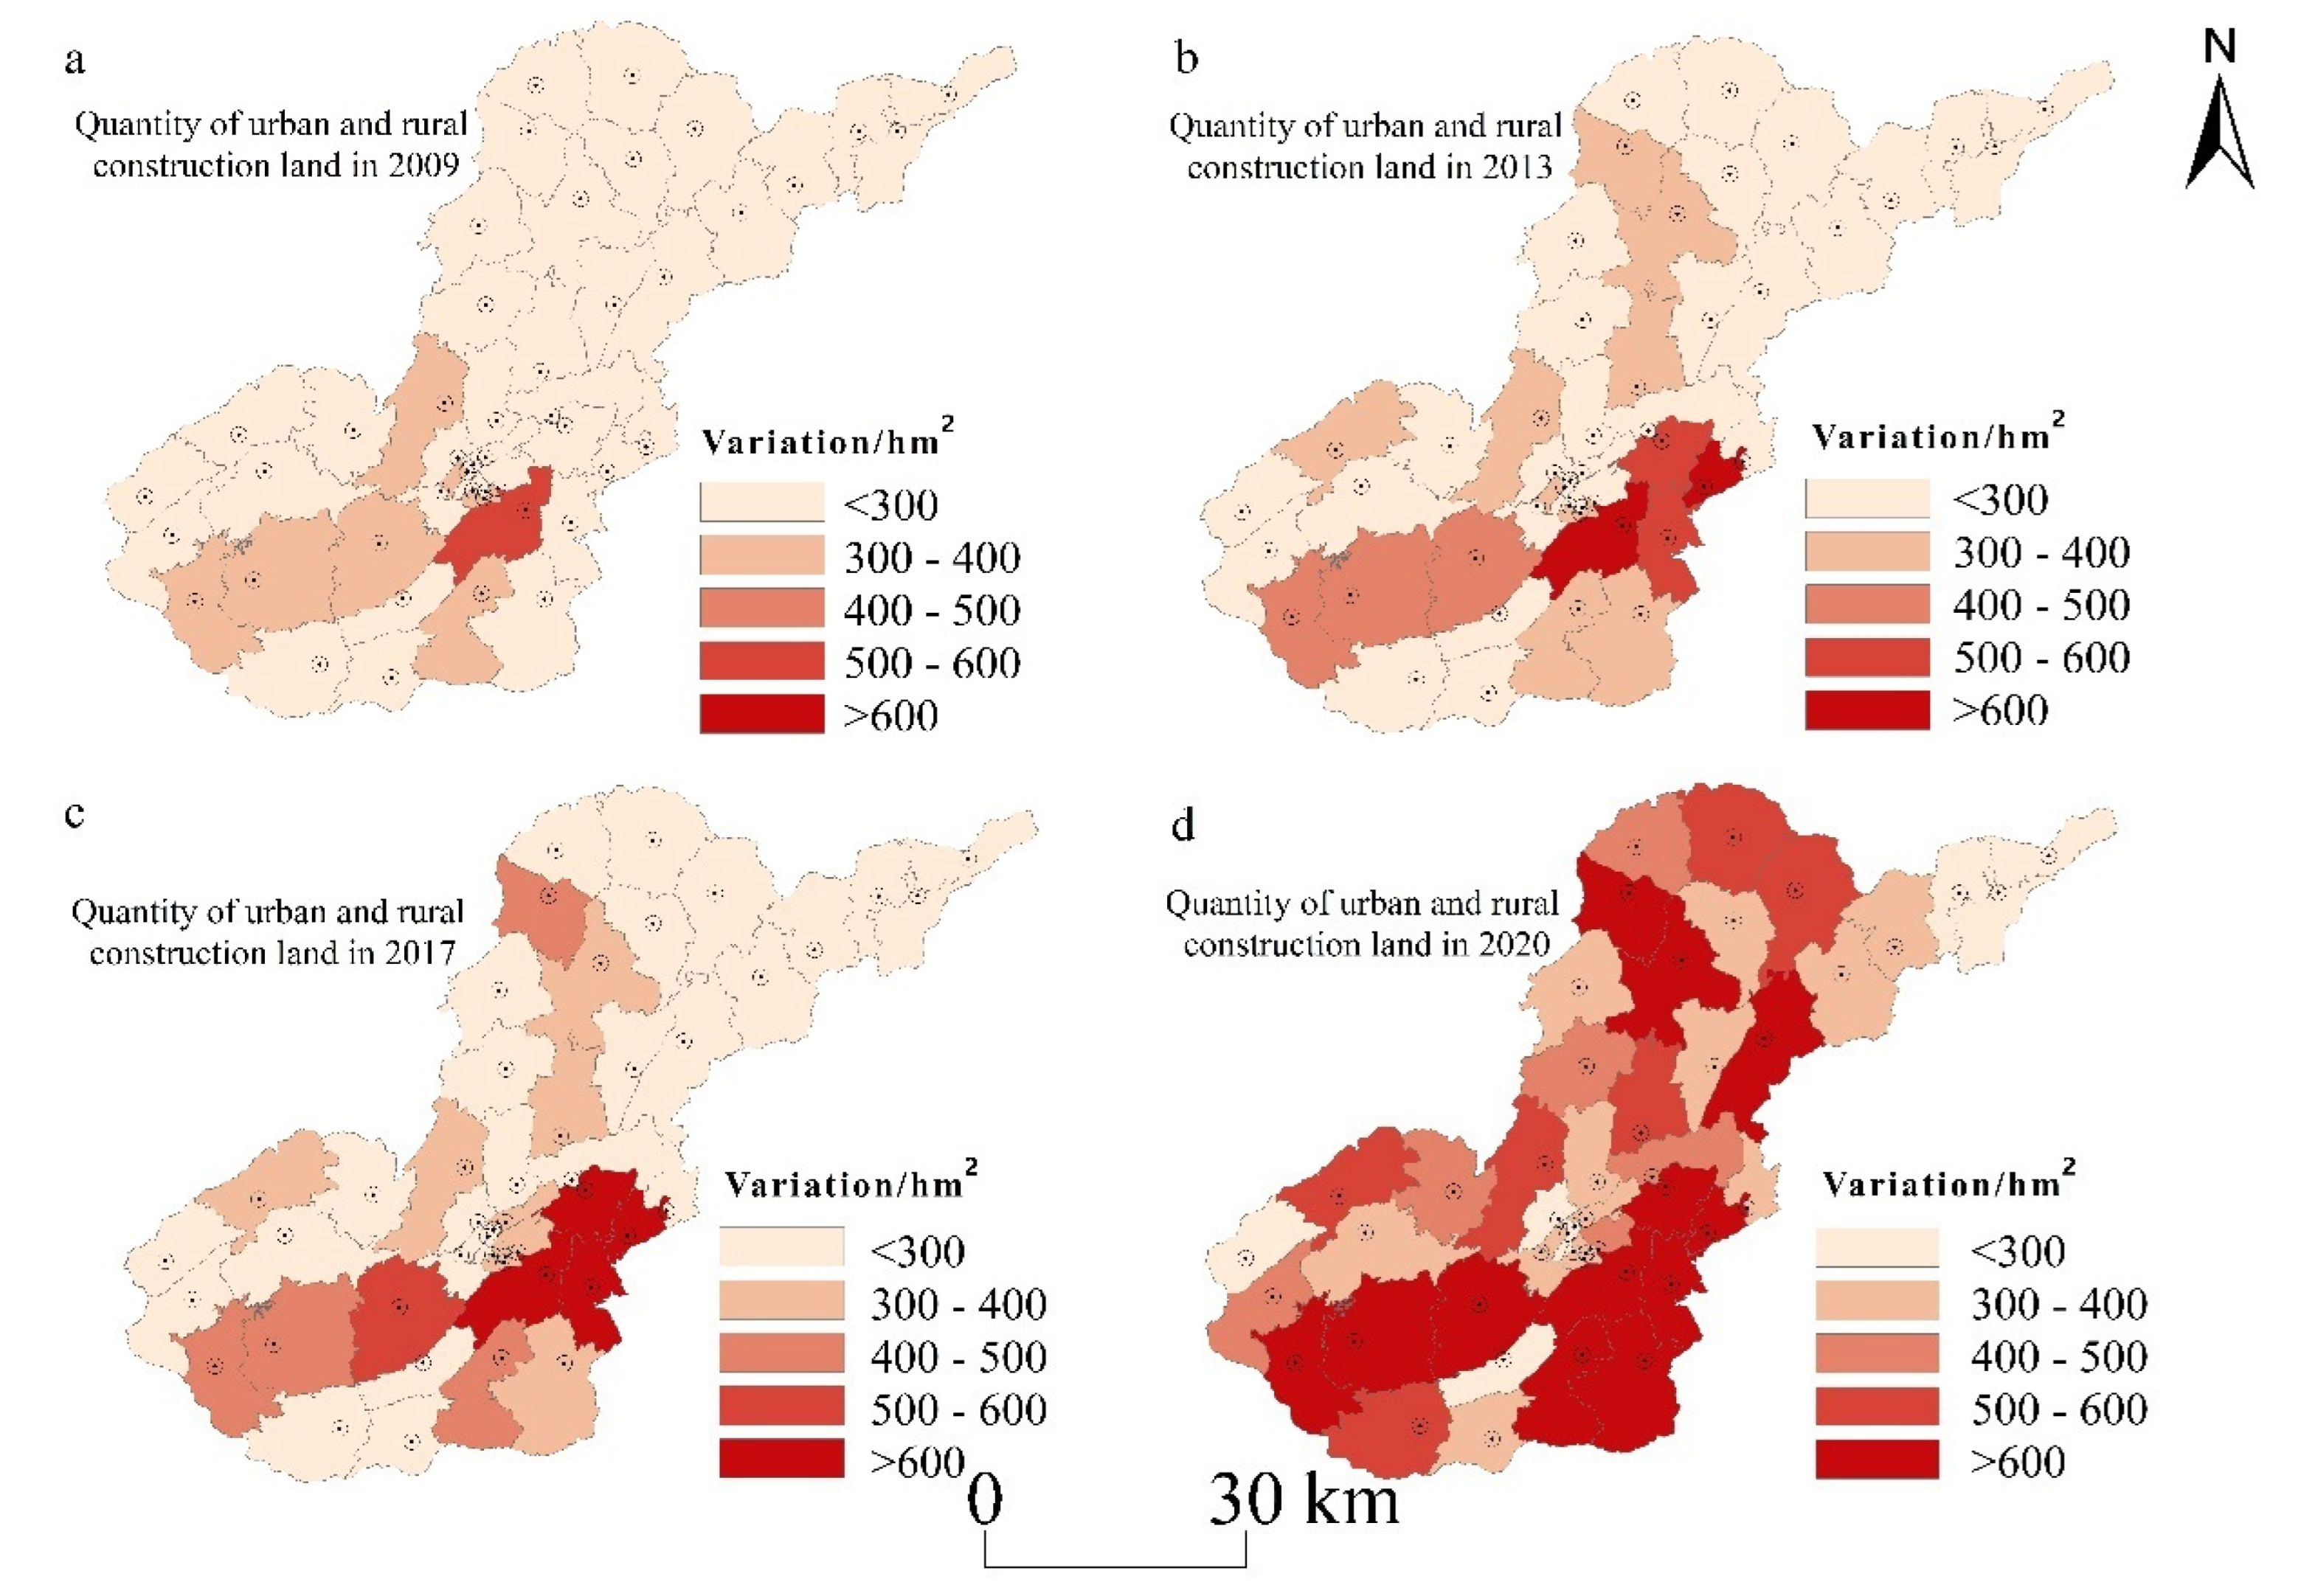
As seen from the change in the time-series law of scale structure, the area of urban–rural construction land in Qixingguan District increased from 10,034.97 hm2 in 2009 to 22,879.86 hm2 in 2020, thus more than doubling in those 10 years (Table 2). Using the natural breakpoint method, the quantity change of urban–rural construction land was divided into five zones: low, medium low, medium, medium high, and high density (Figure 2). The spatial distribution of urban–rural construction land changes in Qixingguan District during the four monitoring periods had similar uniformity, expanding outward from the central urban area and gradually increasing. Overall, the rural residential land in the study area is mainly characterized by the largest amount of land and broken map spots, which is consistent with the surface features of a broken karst mountainous area. In terms of map spots, in 2020, the number of map spots for urban use was 8155, while the number for rural residential land was up to 75,178. The medium-high-density and high-density areas of urban–rural construction land are mainly distributed in non-central urban areas and towns, indicating that rural residential land in the study area has the characteristics of large land occupation, scattered layout, and low land use efficiency. During the monitoring period, the area of urban land continued to increase, and its proportion reached a maximum of 28.86% in 2017.
As shown in Figure 2, the central urban area has always been in a low-density area, while the conclusions of previous works were mostly related to urban expansion and showed higher exponential growth than other regions [50]. A previous study suggested that high-density construction land areas, such as industry and transportation, should be mainly distributed in relatively good township areas, which disagrees with our study. There are two possible reasons for this: (1) The present study area is located in a karst mountain area, where the ecological environment is relatively fragile, the location is relatively remote, there is insufficient motivation for urban development motivation, economic and social development are seriously lagging behind, the planned urban expansion area is limited, and the administrative division of several streets in the central urban area is small. (2) The flow of farmers to more developed cities to work and the return of funds will increase the rural residential land area or improve the residential functions, resulting in a spreading of rural space, which will continue to increase the rural residential land use.
It is worth noting that, during the study period, the quantity and scale of transportation land changed the most significantly; its area increased by 5460.00 hm2, and the average annual growth rate in each monitoring period was higher than that of other land types, with an average annual increase of 546 hm2 (Table 2). During the study period, the average annual growth rate was 82.01%. The reason for this is that, during the research period, Guizhou Province achieved high-speed access between counties, highways to villages, and hardened roads between groups, establishing a main transportation network extending all over the study area. At the same time, with the development of urbanization, road facilities also continuously increased. The quantity and scale of urban industrial and mining land, scenic spots, and special land had little variation during the study period.

3.1.2. Sources and Trends of Urban–Rural Construction Land

1. Sources of urban–rural construction land transformation
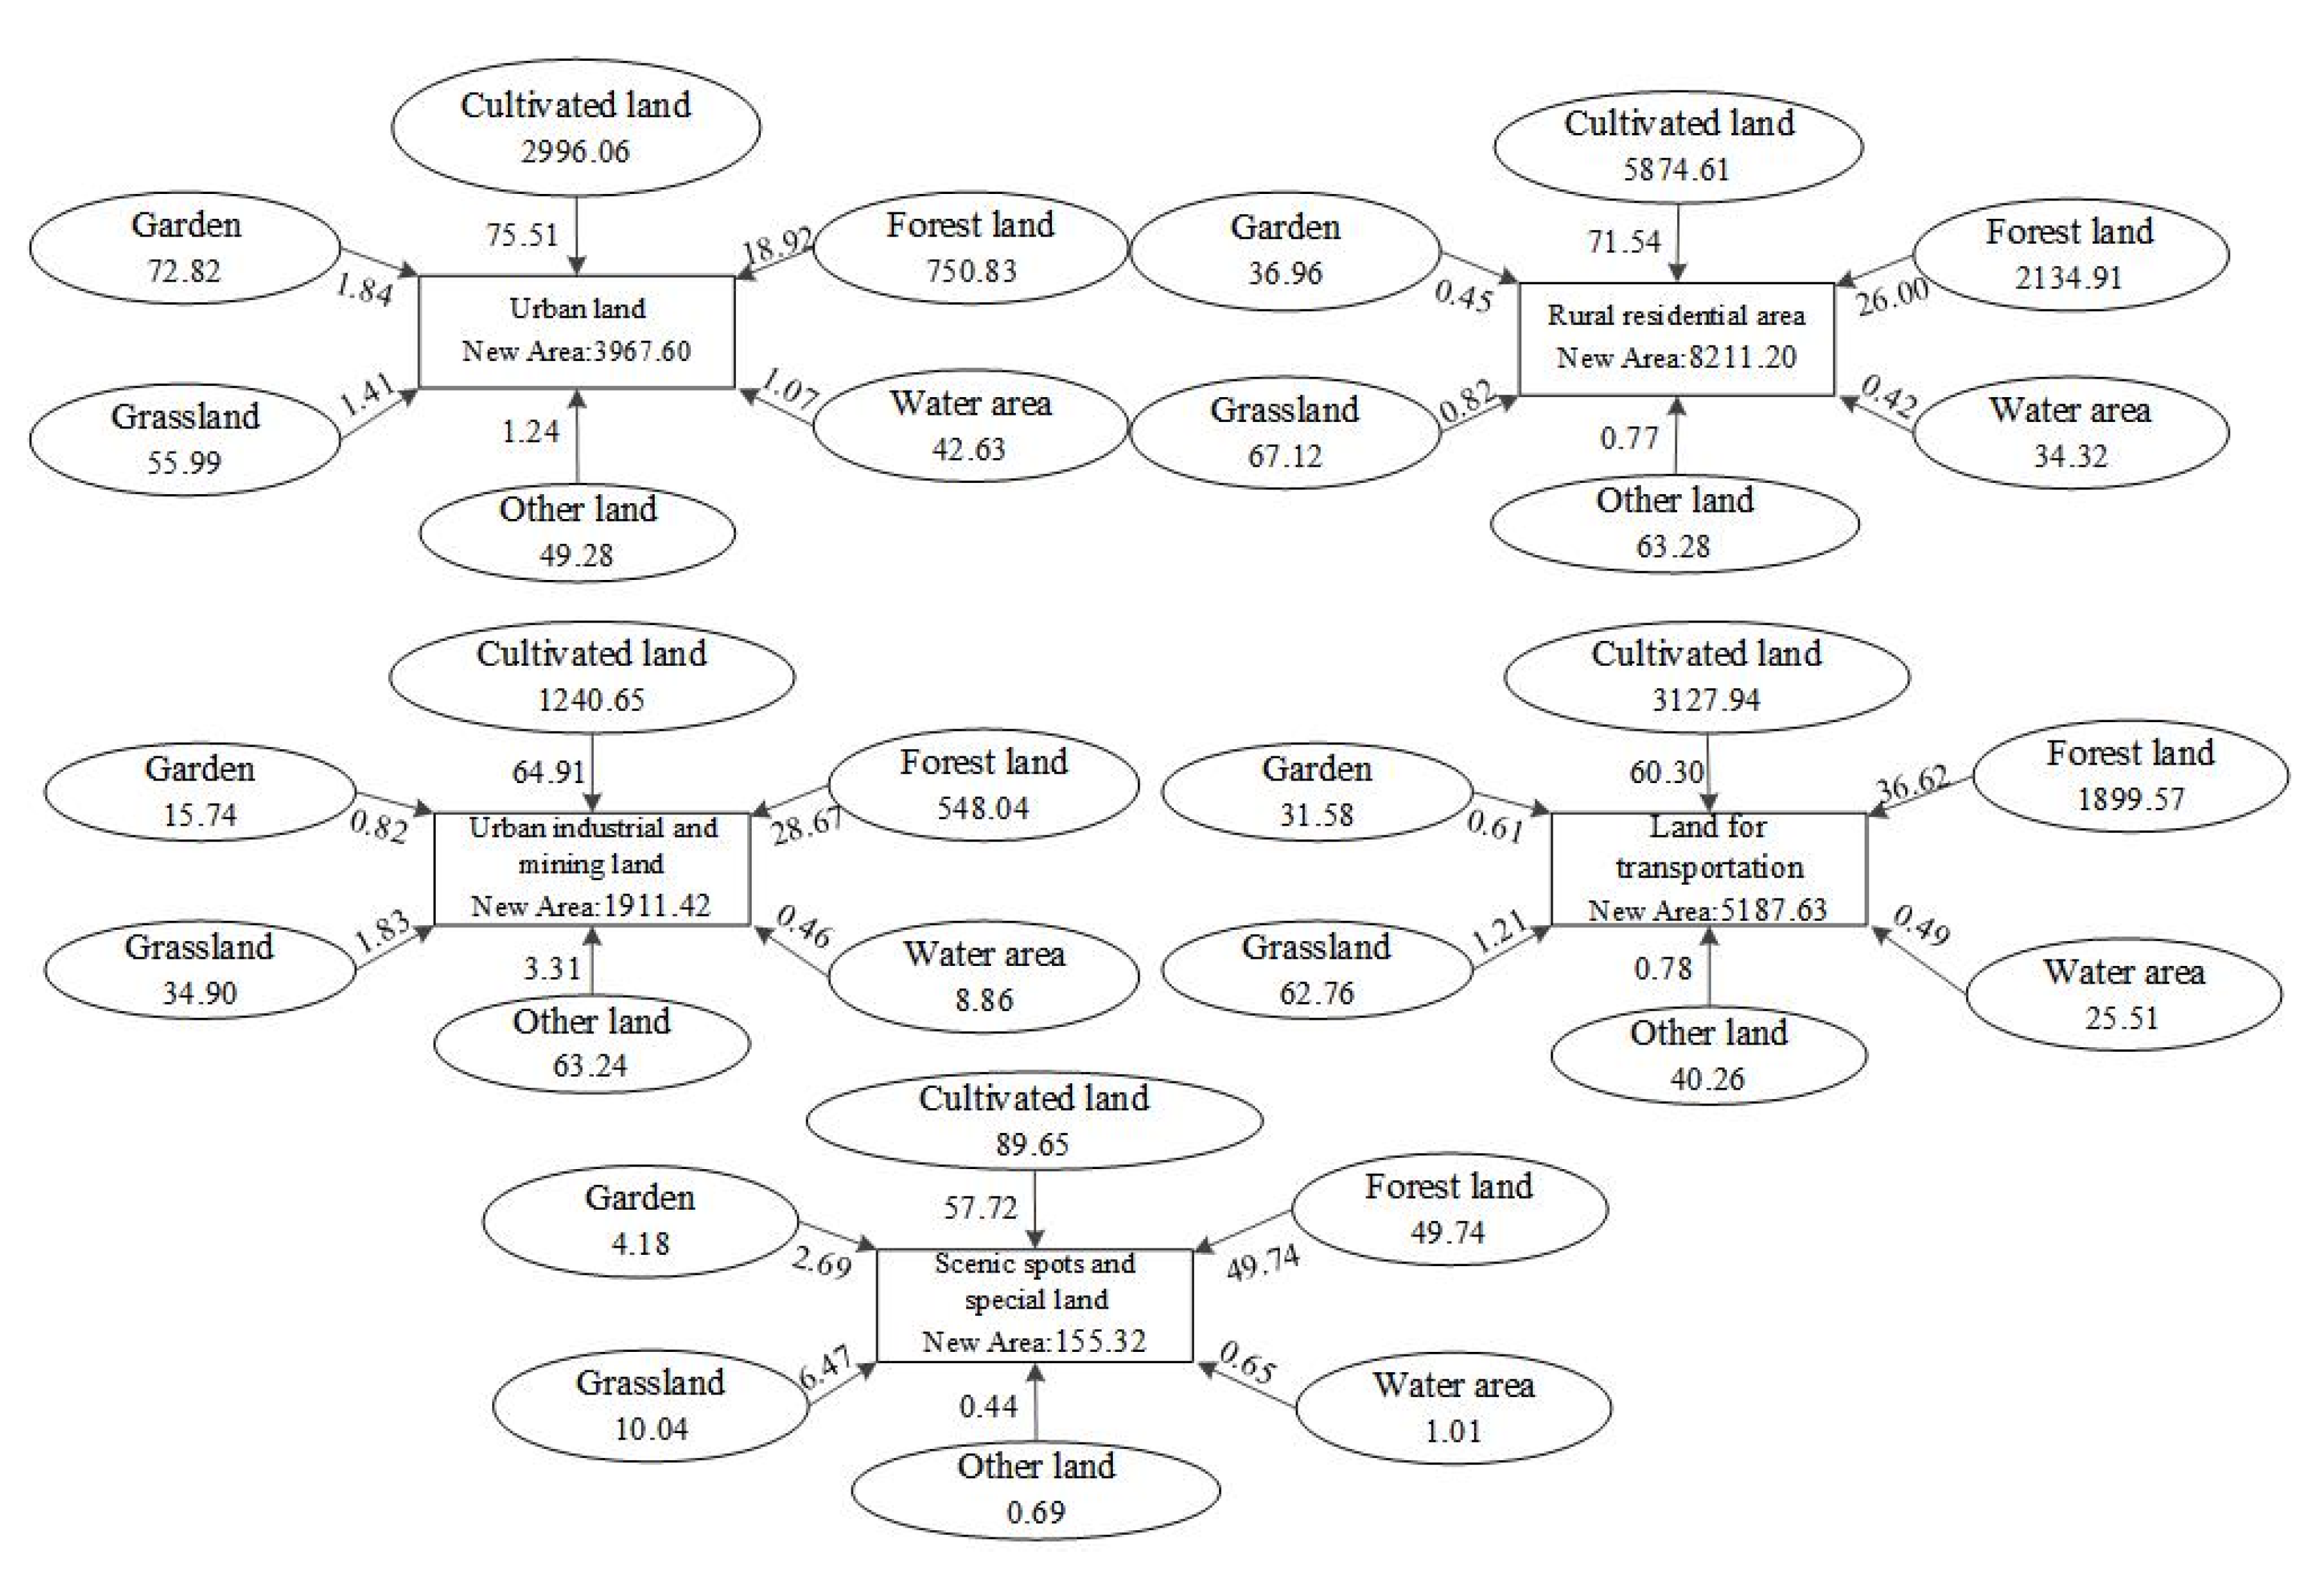
A land use transfer matrix can show the transformation law of urban–rural construction land. As shown in Figure 3, the sources of urban–rural construction land in Qixingguan District greatly increased from 2009 to 2020, with the newly increased area being the most significant when comparing rural residential land, urban land, and transportation land. During that period, 89.36% of the newly increased area of urban–rural construction land came from three areas: urban, industrial, and mining land. The size of the newly added area encompassing scenic spots and special land is small. It was found that most of the newly increased urban–rural construction land (more than 89%) consists of agricultural land types, including arable land and forest land, with proportions larger than 57.72% and not less than 18.92%, respectively. Among the newly increased area of urban–rural construction land, 42.25% is rural residential land, mostly cultivated land (71.54%), and forest land (26%). A total of 94.43% of newly increased urban land consists of agricultural land types, including cultivated land (75.51%) and forest land (18.92%). The areas of newly increased urban industrial and mining land, transportation land, scenic spots, and special land differ slightly, with areas of 1240.65, 3127.94, and 89.65 hm2, accounting for 64.91, 60.3, and 57.72%, respectively. During the study period, the proportions of grassland, gardens, water, and other areas occupied by various types of urban–rural construction land were small. Garden land had the largest area occupied by urban land (72.82 hm2). This was mainly due to the large proportion of agricultural land in Qixingguan District (agricultural land accounted for more than 88.22% of the total area and cultivated land was approximately 44.46% during the monitoring period) and its wide distribution. It is inevitable that it will be occupied to a large extent during the rapid development of urbanization and industrialization.
2. Trend of urban–rural construction land trans formation
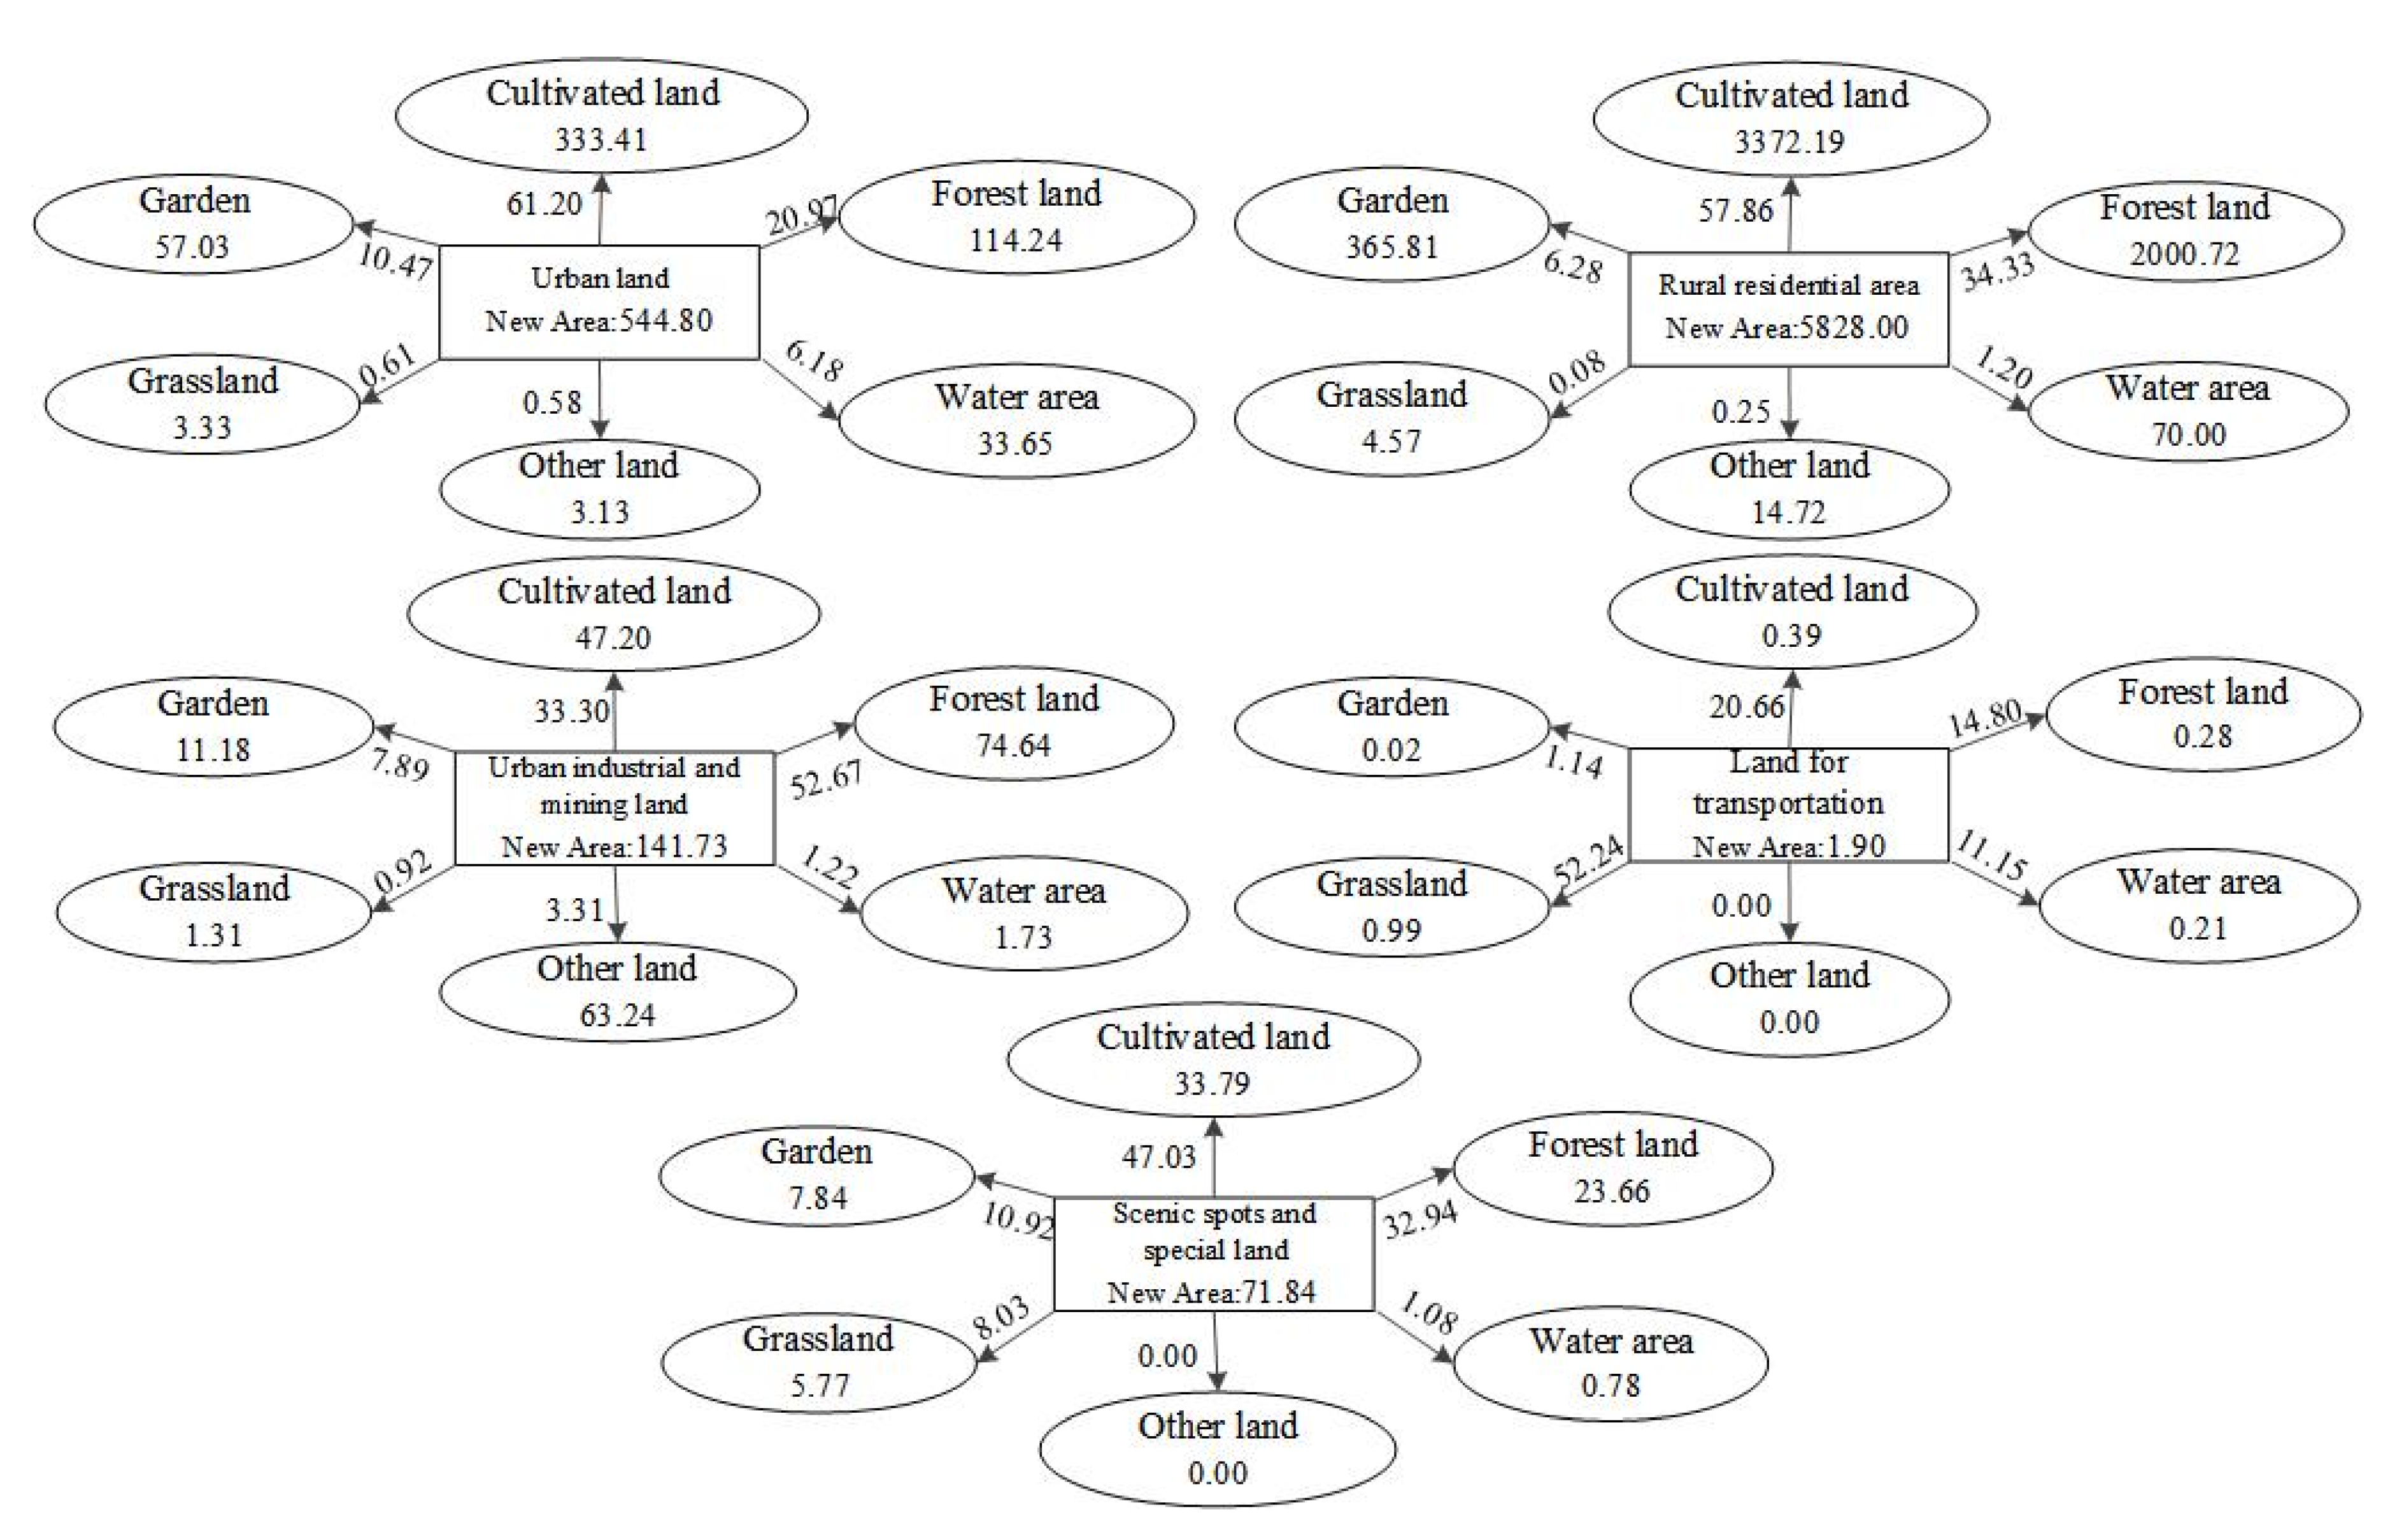
With regard to the direction of the reduction in urban–rural construction land in Qixingguan District during the monitoring period, as shown in Figure 4, in terms of absolute quantity, the main reason for the reduction in land from 2009 to 2020 was the reclamation of rural residential land. This represented an area of 5828.00 hm2, accounting for 88.46% of the reduced urban–rural construction land area. A total of 92.19% of the transferred rural residential land was reclaimed as farmland and woodland, which accounted for 57.86% of the total. The second largest proportion was urban land, which had a reduced area of 544.80 hm2, accounting for 8.27% of the reduced area of urban–rural construction land. This reduction was mainly due to conversion to arable land and forest land (together accounting for 82.17%). The reduction in area of urban industrial and mining land, scenic spots, and special land were relatively small: 141.73 and 71.84 hm2, respectively. A total of 3.3% of the transferred urban industrial and mining land was reclaimed as arable land, and more than 52.67% was reclaimed as forest land and other nonarable agricultural land types. However, the transformation of transportation land showed a trend of continuous increase and did not decrease during the monitoring period. During the study period, transportation land only decreased by 1.90 hm2, which again confirmed the remarkable results of road construction in Qixingguan District during the study period, changing it into an important land transportation hub from a regressive area in southwest China. In terms of absolute area, land converted from urban–rural construction land to grassland, garden, water, and other land types was far smaller than the land converted to cultivated land and woodland, which in recent years has been closely related to the many land consolidation works aimed at replenishing cultivated land.

3.2. Analysis of Driving Factors of Urban–Rural Construction Land Transformation

3.2.1. Analysis of Detection Factor Influence

By testing the driving factors of urban–rural construction land, the influence of testing factor on driving factors was revealed. The PD value of each driving factor was calculated by the geographic detector (Table 3), and the influence of each factor on urban–rural construction land was determined. Table 3 shows the order of impact of various driving factors on urban–rural construction land (from high to low): total fixed asset investment in society as a whole > total fiscal revenue > road network density > total population at the end of the year > urbanization rate > per capita GDP > total annual wages of employees per unit > average GDP > total industrial output > population density > average slope > average elevation. According to the detection results for the driving factors, the total fixed assets investment for the whole society had the greatest impact on the growth of urban–rural land with an explanatory power of 0.819, which is similar to the results of studies conducted in China and internationally [46,47]. It is believed that total fixed assets investment improves people’s living standards, stimulates the development of urban real estate, and promotes the expansion of urban construction land.
Figure 5 shows that the PD values of population density and total industrial output from 2009 to 2020 generally show increasing trends, and the PD values of other driving factors have increases and decreases during the monitoring period. From 2009 to 2013, except for increased PD values, average slope, average elevation, road network density, population density, and total industrial output value, the PD values of other driving factors showed decreasing trends to varying degrees. From 2013 to 2017, the PD values of total fixed asset investment of the whole society, average slope, average elevation, road network density, etc., showed a decreasing trend. From 2017 to 2020, the PD values of other driving factors showed an increasing trend, except for values for per capita GDP, total population at the end of the year, total fiscal revenue, and road network density. To summarize, the explanatory power of the driving factors during each monitoring period for Qixingguan District regarding the expansion of urban–rural construction land varies. Therefore, time series monitoring of driving factors would have important guiding significance for predicting the expansion of urban–rural construction land.

3.2.2. Interaction Analysis of Detection Factors

The interaction detection in the geographic detector mainly identifies the degree of influence of interactions between driving factors on changes in urban–rural construction land in Qixingguan District. On this basis, interaction detection evaluates whether the influence of factors is independent or if it increases or decreases the explanatory power of the evolution of urban–rural construction land due to the interaction. Table 4 shows the relationships between driving factors affecting the evolution of urban–rural construction land by using the interaction detector. The results indicate that there are no factors that independently affect urban–rural construction land, and the interaction effect between driving factors is mainly manifested in the relationship of nonlinear enhancement and mutual enhancement, and the explanatory power of the interaction between all factors increases significantly: X9∩X3 (0.915) > X5∩X3 (0.891) > X7∩X3 (0.882) > X12∩X3 (0.794) > X10∩X3 (0.707) > X6∩X3 (0.642) > X4∩X3 (0.591) > X11∩X3 (0.544). In particular, a significant interaction exists between other factors and the completion of fixed assets and total fiscal revenue in the whole society, and the interaction between total fiscal revenue and total industrial output has the strongest explanatory power. Overall, the influences of the driving factors on the evolution of urban–rural construction land are not independent, nor do they represent a simple superposition process. Rather, a mutual or nonlinear enhancement effect is shown, and the influence of the interactions between detecting factors on the spatial differentiation of urban–rural construction land is greater than that of a single factor.

3.3. Discussion

3.3.1. Unreasonable Structure of Urban and Rural Construction Land

Although the average annual growth rate of urban land in the study area (8.87%) is higher than that of rural residential land (2.18%), the total rural residential land area exceeds that of urban construction land. With regard to the proportion of urban–rural construction land in the study area, the proportion of rural residential land is the largest, and the map plot is broken. Although the proportion of the area has decreased since 2009, the proportion of rural residential land was still as high as 41.75% by 2020. Moreover, the number of map spots was almost twice that of urban construction land. For urban land, the area continued to increase in the four monitoring periods of the study; the area ratio increased from 21.85% in 2009 to 28.86% in 2017, it but decreased by 4.44% during the period 2017–2020. During the 13th Five-Year Plan period in China, the urbanization rate of the resident population in the study area increased to 54%, indicating that the proportion of land and population in rural areas is seriously imbalanced as a result of less population occupying more land. China’s special long-term dual urban–rural structure is mainly manifested in a continuous increase in the demand for construction land in cities, and the continuously supply still occasioned an increasing shortage of construction land. However, in the countryside, it is manifested in the continuous increase in the population moving to cities, and the construction land does not decrease but increases. A large amount of rural construction land is thus idle [51].
The present study area is located in an underdeveloped area of karst mountains in southwest China, and the problem of unbalanced and insufficient urban and rural development is particularly prominent. Compared with China’s economically developed regions (e.g., Yangtze River Delta) [52], the main features are that the structure of urban–rural construction land is unreasonable, the area of rural residential land is larger than the area of urban land, the population and residential areas are obviously scattered, and the driving forces of urban and rural development and urbanization are mainly external (e.g., state investment, project-driven development, administrative promotion), thus the development of urban–rural integration is limited by economic development, difficulty integrating urban and rural resources, etc. In other countries, such as the United States [53], Japan [54], the United Kingdom [55], and France [56], urban–rural integration has basically been achieved because it was developed earlier and their economies are more developed, resulting in fewer significant differences between urban and rural areas. However, China is still in the early stage of urban–rural integration; especially in the karst mountain area with fragile ecological environment, the promotion of urban–rural development is costly, difficult, and slow.
To address the problems in urban and rural land planning, Qixingguan District should formulate policies to control the expansion of urban construction land and the consolidation of rural land based on the experience of developed countries to deal with the relationship between urban and rural land to a certain extent. It is necessary to pay closer attention to the management of rural construction land, and to optimize the allocation of rural land and agricultural development through rural land consolidation, sorting out more land that can free up more land targets for the expansion of the central urban area. Moreover, urban land should be controlled within a certain range, in order to realize rational urban development and adjust the structure and layout of rural residential and urban land. This would satisfy the common development of urbanization and industrialization and improve rural development and urban–rural relations, which would improve the efficiency and effectiveness of land use, and at the same time avoid the continuous spread of the “hollowing out” phenomenon in rural areas.

3.3.2. Transformation of Cultivated Land into Construction Land

From 2009 to 2020, the main source of new urban–rural construction land in the study area was agricultural land (more than 89%, of which the minimum occupied cultivated land was 57.72%). Cultivated land converted to new urban–rural construction land amounted to 13,328.91 hm2, but construction occupying cultivated land slowed down to a certain extent. From 2009 to 2020, the urban–rural construction land mainly transformed into reclaimed construction land. The area of reclaimed land transformed into cultivated land was 3786.97 hm2; 61.20% of the transferred urban land was reclaimed as cultivated land, while 57.86% of the transferred rural residential land was reclaimed as cultivated land.
In terms of stages, the proportion of urban–rural construction land reclaimed as cultivated land shows a fluctuating trend, but the area of cultivated land transformed to urban–rural construction land continues to increase. In terms of area, the reduction of urban–rural construction land to grassland, garden, water, and other types of land is much smaller than the area of cultivated land and forest land, indicating that, in recent years, a large number of supplementary cultivated land projects were carried out in the study area, which will contribute to the protection of cultivated land to a certain extent. It is worth noting that under the condition that the land area remains stable, if the current growth trend is maintained and the cultivated land is recklessly constructed, it will lead to expanded urban development and the unreasonable and disorderly growth of rural residential land. The “red line” of cultivated land will be broken. At the same time, it will inevitably lead to wasted land resources and increased carrying capacity of land. Therefore, in the process of land development in the study area, more attention should be given to excavating the existing rural residential land, reforming and improving the countryside homestead management, and promoting the efficient and intensive use of urban–rural construction land by the use of clearing property rights, compensation systems for the use of resources, and standardized circulation. At the same time, it is also necessary to strengthen the supervision of the red line of cultivated land protection, resolutely implement the policy of linkage between urban land taking and rural land giving (LUTRG), and prohibit construction and development in non-construction areas, especially in karst areas with a fragile ecological environment.

3.3.3. Regular Evaluation of Planning and Dynamic Revision

From the detection results of driving factors (Section 3.3), the completion of fixed assets in the whole society has the greatest impact on the growth of urban and rural land use, and the PD value is 0.819, which agrees with previous works in other regions [57,58]. The completion of fixed asset investment in the whole society improved people’s living standards, stimulated the development of urban real estate, and promoted the expansion of urban construction land. At the same time, our results imply that the PD value of each driving factor and the interaction between factors of urban and rural construction land are not constant in different monitoring periods and show dynamic changes with fluctuation. For example, the PD value of road network density as a single factor of urban–rural construction land was lower than 23% in 2009 and 2020, but it was greater than 70% in 2013 and 2017. However, China’s current laws and regulations, such as those regarding land use planning or urban and rural planning, focus on vision planning, in an effort to develop an ideal planning scheme to achieve the “ultimate goal” throughout the planning period, while ignoring the suitability between the processes of “static” planning and “dynamic” implementation. In addition, there is limited ability to quickly and synchronously adjust the planning scheme when identifying changing factors, resulting in a greatly reduced implementation effect.
According to the changes in the influence of driving factors and the actual situation in the study area, the present study suggests that formulating land-related laws and regulations does not mean planning an ultimate blueprint, but a strategic and structural type of flexible and dynamic planning. Based on this, this study suggests that detecting the driving factors of urban–rural construction land in the study area should be included in the city-level urban physical examination category of “territorial space safety”. The formation of the annual urban physical examination index system should be optimized, the key driving factors of urban–rural construction land in each monitoring period in the study area should be identified, and the implementation of the plan should be regularly scheduled, evaluated, and adjusted during planning. This not only could improve the utilization of urban–rural construction land resources and the efficiency of land resource utilization, but also more accurately predict the reasonable demand and spatial expansion direction of urban–rural construction land in the future.

3.3.4. Research Prospects

The following aspects should receive more attention in future work: (1) Research on the transformation of urban–rural construction land only considers the transfer between construction land and non-construction land, and mainly focuses on its dominant characteristics (quantity structure, source destination, spatial differentiation, etc.). Thus, it is necessary to consider urban–rural construction land in the next step in terms of the transformation between types and the analysis of the interaction mechanism of strengthening the hidden characteristics (input–output, utilization efficiency, economic density, function, etc.), to gain an in-depth understanding of the transformation characteristics and driving mechanism of urban–rural construction land. (2) The acquisition of basic data and indicators was limited to only four periods of land use data (2009, 2013, 2017 and 2020), which was not able to fully reflect the long-term and continuous process of urban–rural construction land transformation, resulting in insufficient research depth. It is extremely important for research to obtain multitemporal land use data and make comparisons with the natural environmental conditions, economic and social levels, policy and institutional environment, and other data in the same period. (3) The spatial distribution law, evolution process, and driving mechanism of urban–rural construction land reflect the interactive human–land relationship. Based on the limited availability and accessibility of data in this study, the selection of driving indicators of urban–rural construction land transformation needs to be further improved, and in the selection of indicators, the categories can be further increased, such as forest cover [59], technological progress, food security [60], karst basin water re-sources [61], etc., to clarify the mechanism of the driving factors of urban–rural construction land transformation more clearly. (4) Research results on carbon peaking and carbon neutralization surge since the double carbon target was proposed [62,63], the carbon emissions of urban–rural construction have attracted more attention [64]. In order to optimize carbon neutrality in new urbanization construction, more studies should be conducted that combine the processes of carbon emission reduction and carbon trading, relying on this huge carbon sink [65] to achieve the goal of carbon neutrality [66].

4. Conclusions

Using spatial analysis and geographical detectors, this study conducted a detailed analysis of the spatial and temporal evolution characteristics of urban–rural construction land in the study area and explored the effects of their driving factors. The main research conclusions are as follows:
(1) With regard to time series, the urban–rural construction land increased in Qixingguan District from 2009 to 2020, and most of it came from agricultural land. The proportion of cultivated land among the various land use types is not less than 57.72%. The fastest growing land types are rural residential, urban, and transportation land. The expansion of rural residential land is greater than that of urban land, and it continues to grow. With regard to the spatial distribution pattern, the spatial distribution expands from the surrounding area of the central city; until 2020, the distribution was medium high and high density in the northern, eastern, and southwestern townships of the study area, and medium low density in the central urban area.
(2) From 2009 to 2020, the ranking of various driving factors on urban and rural construction land in terms of impact was as follows (from high to low): total fixed asset investment in society as a whole > total fiscal revenue > road network density > total population at the end of the year > urbanization rate > per capita GDP > total annual wages of employees per unit > average GDP > total industrial output > population density > average slope > average elevation. The PD value of total fixed asset investment in the whole society and total fiscal revenue is above 60%; thus, they have become the main driving factors affecting the change of urban–rural construction land.
(3) The driving factors have interactive effects in terms of their impact on urban–rural construction land, and these effects show mutual and nonlinear enhancement. The present study reveals that the PD value of the driving factors in Qixingguan District in each monitoring period has changed. This study reveals the impact of these driving factors on urban–rural construction land and provides a foundation for studying the dynamics of the transformation of such land.

Author Contributions

Y.S.: Conceptualization, Methodology, Software, Writing—original draft. Z.Z.: Resources, Data curation, Formal analysis, Project administration, Funding acquisition. D.H.: Visualization. Q.C.: Supervision. M.F.: Investigation. All authors have read and agreed to the published version of the manuscript.

Funding

This research was funded by the State’s Key Project of Research and Development Plan of China (2018YFB0505400), the National Natural Science Foundation of China (41661088), and the Guizhou Province High-level Innovative Talent Training Plan “Hundred” Level Talents (Qiankehe Platform Talents [2016]5674).

Institutional Review Board Statement

Not applicable.

Informed Consent Statement

Not applicable.

Data Availability Statement

Not applicable.

Acknowledgments

This study was supported financially by the State’s Key Project of Research.

Conflicts of Interest

The authors declare no conflict of interest.

References

  1. Grainger, A. National land use morphology: Patterns and possibilities. Geography 1995, 80, 235–245. [Google Scholar]
  2. Ge, D.; Long, H.; Zhang, Y.; Ma, L.; Li, T. Farmland transition and its influences on grain production in China. Land Use Policy 2018, 70, 94–105. [Google Scholar] [CrossRef]
  3. Jiang, G.; Zhang, R.; Ma, W.; Zhou, D.; Wang, X.; He, X. Cultivated land productivity potential improvement in land consolidation schemes in Shenyang, China: Assessment and policy implications. Land Use Policy 2017, 68, 80–88. [Google Scholar] [CrossRef]
  4. Njoh, A.J. Municipal councils, international NGOs and citizen participation in public infrastructure development in rural settlements in Cameroon. Habitat Int. 2011, 35, 101–110. [Google Scholar] [CrossRef]
  5. Gu, C.; Li, Y.; Han, S.S. Development and transition of small towns in rural China. Habitat Int. 2015, 50, 110–119. [Google Scholar] [CrossRef]
  6. Li, T.; Long, H.; Liu, Y.; Tu, S. Multi-scale analysis of rural housing land transition under China’s rapid urbanization: The case of Bohai Rim. Habitat Int. 2015, 48, 227–238. [Google Scholar] [CrossRef]
  7. Song, X. Discussion on land use transition research framework. Acta Geogr. Sin. 2017, 72, 471–487, (In Chinese with English Abstract). [Google Scholar]
  8. Lambin, E.F.; Meyfroidt, P. Land use transitions: Socio-ecological feedback versus socio-economic change. Land Use Policy 2010, 27, 108–118. [Google Scholar] [CrossRef]
  9. Liu, Y.; Li, Y. Revitalize the world’s countryside. Nature 2017, 548, 275–277. [Google Scholar] [CrossRef] [Green Version]
  10. Tu, S.; Long, H. Rural restructuring in China: Theory, approaches and research prospect. J. Geogr. Sci. 2017, 27, 1169–1184, (In Chinese with English abstract). [Google Scholar] [CrossRef]
  11. Ventura, S.J.; Niemann, B.J.; Moyer, D.D. A multipurpose land information system for rural resource planning. J. Soil Water Conserv. 1988, 43, 226–229. [Google Scholar]
  12. Wasilewski, A.; Krukowski, K. Land conversion for suburban housing: A study of urbanization around Warsaw and Olsztyn, Poland. Environ. Manag. 2004, 34, 291–303. [Google Scholar] [CrossRef] [PubMed] [Green Version]
  13. Pijanowski, B.C.; Robinson, K.D. Rates and patterns of land use change in the Upper Great Lakes States, USA: A framework for spatial temporal analysis. Landsc. Urban Plan. 2011, 102, 102–116. [Google Scholar] [CrossRef]
  14. Livingstone, S.J.; Li, Y.; Rutishauser, A.; Sanderson, R.J.; Winter, K.; Mikucki, J.A.; Björnsson, H.; Bowling, J.S.; Chu, W.; Dow, C.F.; et al. Subglacial lakes and their changing role in a warming climate. Nat. Rev. Earth Environ. 2022, 3, 106–124. [Google Scholar] [CrossRef]
  15. Marsh, S. Plummeting morale in the forest service: Why it should matter to Americans who love nature. Mt. J. 2018, 20, 2020. [Google Scholar]
  16. Liu, M.; Bai, X.; Tan, Q.; Luo, G.; Zhao, C.; Wu, L.; Luo, X.; Ran, C.; Zhang, S. Climate Change Enhances the Positive Contribution of Human Activities to Vegetation restoration in China. Geocarto Int. 2022, 1–24. [Google Scholar] [CrossRef]
  17. Bourne, L.S. Reurbanization, uneven urban development, and the debate on new urban forms. Urban Geogr. 1996, 17, 690–713. [Google Scholar] [CrossRef]
  18. Jensen, J.R.; Toll, D.L. Detecting residential land-use development at the urban fringe. Photogramm. Eng. Remote Sens. 1982, 48, 629–643. [Google Scholar]
  19. López, E.; Bocco, G.; Mendoza, M.; Duhau, E. Predicting land-cover and land-use change in the urban fringe: A case in Morelia city, Mexico. Landsc. Urban Plan. 2001, 55, 271–285. [Google Scholar] [CrossRef]
  20. Braimoh, A.K.; Onishi, T. Spatial determinants of urban land use change in Lagos, Nigeria. Land Use Policy 2007, 24, 502–515. [Google Scholar] [CrossRef]
  21. Weber, C.; Puissant, A. Urbanization pressure and modeling of urban growth: Example of the Tunis Metropolitan Area. Remote Sens. Environ. 2003, 86, 341–352. [Google Scholar] [CrossRef]
  22. Masek, J.G.; Lindsay, F.E.; Goward, S.N. Dynamics of urban growth in the Washington DC metropolitan area, 1973–1996, from Landsat observations. Int. J. Remote Sens. 2000, 21, 3473–3486. [Google Scholar] [CrossRef]
  23. Saizen, I.; Mizuno, K.; Kobayashi, S. Effects of land-use master plans in the metropolitan fringe of Japan. Landsc. Urban Plan. 2006, 78, 411–421. [Google Scholar] [CrossRef]
  24. Ustaoglu, E.; Aydınoglu, A.C. Suitability evaluation of urban construction land in Pendik district of Istanbul, Turkey. Land Use Policy 2020, 99, 104783. [Google Scholar] [CrossRef]
  25. Mann, S. Institutional causes of urban and rural sprawl in Switzerland. Land Use Policy 2009, 26, 919–924. [Google Scholar] [CrossRef]
  26. Colsaet, A.; Laurans, Y.; Levrel, H. What drives land take and urban land expansion? A systematic review. Land Use Policy 2018, 79, 339–349. [Google Scholar] [CrossRef]
  27. Bittner, C.; Sofer, M. Land use changes in the rural-urban fringe: An Israeli case study. Land Use Policy 2013, 33, 11–19. [Google Scholar] [CrossRef]
  28. Diogo, V.; Koomen, E. Land-use change in Portugal, 1990–2006: Main processes and underlying factors. Cartogr. Int. J. Geogr. Inf. Geovis. 2012, 47, 237–249. [Google Scholar] [CrossRef]
  29. Duram, L.A. A pragmatic study of conventional and alternative farmers in Colorado. Prof. Geogr. 1997, 49, 202–213. [Google Scholar] [CrossRef]
  30. Luo, P.; Du, Q.; Lei, Y.; Wang, T. Cellular Automata Based on Geographic Feature and Urban Land Use Evolvement. Geomat. Inf. Sci. Wuhan Univ. 2004, 29, 504–507, (In Chinese with English Abstract). [Google Scholar]
  31. Thamodaran, R.; English, B.; Heady, E.O. A Statewide Projection of Agricultural Land Losses to Non-Agricultural Land Uses; Working Paper; Center for Agricultural and Rural Development, Iowa State University: Ames, IA, USA, 1981. [Google Scholar]
  32. Dewi, D.I.K.; Ratnasari, R.A. Land use change in sub district Mranggen because of residential development. Procedia-Soc. Behav. Sci. 2016, 227, 210–215. [Google Scholar] [CrossRef] [Green Version]
  33. Wang, J.F.; Li, X.H.; Christakos, G.; Liao, Y.L.; Zhang, T.; Gu, X.; Zheng, X.Y. Geographical detectors-based health risk assessment and its application in the neural tube defects study of the Heshun Region, China. Int. J. Geogr. Inf. Sci. 2010, 24, 107–127. [Google Scholar] [CrossRef]
  34. Bai, H.; Li, D.; Ge, Y.; Wang, J.; Cao, F. Spatial rough set-based geographical detectors for nominal target variables. Inf. Sci. 2022, 586, 525–539. [Google Scholar] [CrossRef]
  35. Wu, D.; Yang, L. Evaluation of Coordinated Development between Urbanization and Eco- environment in Wumeng Mountainous Areas of Guizhou—A Case Study of Qixingguan Region. Anhui Agric. Sci. Bull. 2016, 22, 97–102, (In Chinese with English Abstract). [Google Scholar]
  36. Zhou, D.B.; Huang, T.L.; Xiang, T.G.; Xie, G.; Huang, X.Y. Current Situation Analysis and Suggestions of Forest Ecological Industry in Qixingguan District of Bijie City. Mod. Agric. Sci. Technol. 2020, 759, 144–146, (In Chinese with English Abstract). [Google Scholar]
  37. Wang, X.H.; Zhang, Z.H.; Wang, H.B.; Xiao, B.; Liu, H.; Wang, T.; Wu, P.; Pan, Y.L. Geochemical Evaluation Results and significance of Cultivated Land Quality in Qixingguan District, Guizhou Province. Guizhou Geol. 2020, 37, 251–257, (In Chinese with English Abstract). [Google Scholar]
  38. GB/T 21010-2017; Current Land Use Classification. Standardization Administration of China: Beijing, China, 2017. (In Chinese)
  39. Zeng, Y.J. Coupling and Coordination between Urban-Rural Construction Land Transition and Economic and Social Development in Banan District Land Resource Management; Southwest University: Chongqing, China, 2019; (In Chinese with English Abstract). [Google Scholar]
  40. Unwin, D.J. GIS, spatial analysis and spatial statistics. Prog. Hum. Geogr. 1996, 20, 540–551. [Google Scholar] [CrossRef]
  41. Du, W.; Zhao, X.; Zhao, Z.; Chen, C.; Qian, D. Assessment and dynamic mechanisms of the land-use dominant morphology transition: A case study of Hainan Province, China. Environ. Monit. Assess. 2022, 194, 419. [Google Scholar] [CrossRef]
  42. Liu, F.; Qin, T.; Girma, A.; Wang, H.; Weng, B.; Yu, Z.; Wang, Z. Dynamics of land-use and vegetation change using NDVI and transfer matrix: A case study of the Huaihe River Basin. Pol. J. Environ. Stud. 2018, 28, 213–223. [Google Scholar] [CrossRef]
  43. Deng, X.; Huang, J.; Rozelle, S.; Uchida, E. Economic growth and the expansion of urban land in China. Urban Stud. 2010, 47, 813–843. [Google Scholar] [CrossRef] [Green Version]
  44. Wu, K.; Zhang, H. Land use dynamics, built-up land expansion patterns, and driving forces analysis of the fast-growing Hangzhou metropolitan area, eastern China (1978–2008). Appl. Geogr. 2012, 34, 137–145. [Google Scholar] [CrossRef]
  45. Wang, Y.; Wang, S.; Li, G.; Zhang, H.; Jin, L.; Su, Y.; Wu, K. Identifying the determinants of housing prices in China using spatial regression and the geographical detector technique. Appl. Geogr. 2017, 79, 26–36. [Google Scholar] [CrossRef]
  46. Wang, J.F.; Zhang, T.L.; Fu, B.J. A measure of spatial stratified heterogeneity. Ecol. Indic. 2016, 67, 250–256. [Google Scholar] [CrossRef]
  47. Ju, H.; Zhang, Z.; Zuo, L.; Wang, J.; Zhang, S.; Wang, X.; Zhao, X. Driving forces and their interactions of built-up land expansion based on the geographical detector–a case study of Beijing, China. Int. J. Geogr. Inf. Sci. 2016, 30, 2188–2207. [Google Scholar] [CrossRef]
  48. Wang, J.F.; Xu, C.D. Geodetector: Principle and prospective. J. Geogr. 2017, 72, 116–134, (In Chinese with English Abstract). [Google Scholar]
  49. Wu, Z.H.; Li, T. The comprehensive performance evaluation of the high-tech development zone: Analysis based on the natural breakpoint method. Stat. Inf. Forum 2013, 28, 82–88, (In Chinese with English Abstract). [Google Scholar]
  50. García-Ayllón, S. Predictive diagnosis of agricultural periurban areas based on territorial indicators: Comparative landscape trends of the so-called “Orchard of Europe”. Sustainability 2018, 10, 1820. [Google Scholar] [CrossRef] [Green Version]
  51. Li, Y.; Li, Y.; Westlund, H.; Liu, Y. Urban–rural transformation in relation to cultivated land conversion in China: Implications for optimizing land use and balanced regional development. Land Use Policy 2015, 47, 218–224. [Google Scholar] [CrossRef]
  52. Niu, X.; Liao, F.; Liu, Z.; Wu, G. Spatial-Temporal Characteristics and Driving Mechanisms of Land-Use Transition from the Perspective of Urban–Rural Transformation Development: A Case Study of the Yangtze River Delta. Land 2022, 11, 631. [Google Scholar] [CrossRef]
  53. García-Ayllón, S. Rapid development as a factor of imbalance in urban growth of cities in Latin America: A perspective based on territorial indicators. Habitat Int. 2016, 58, 127–142. [Google Scholar] [CrossRef]
  54. Hebbert, M. Urban sprawl and urban planning in Japan. Town Plan. Rev. 1986, 57, 141–158. [Google Scholar] [CrossRef]
  55. Alcock, I.; White, M.P.; Lovell, R.; Higgins, S.L.; Osborne, N.J.; Husk, K.; Wheeler, B.W. What accounts for ‘England’s green and pleasant land’? A panel data analysis of mental health and land cover types in rural England. Landsc. Urban Plan. 2015, 142, 38–46. [Google Scholar] [CrossRef] [Green Version]
  56. Newsome, W.B. French Urban Planning, 1940–1968: The Construction and Deconstruction of an Authoritarian System; Peter Lang: Bern, Switzerland, 2009. [Google Scholar]
  57. Zhang, T. Community features and urban sprawl: The case of the Chicago metropolitan region. Land Use Policy 2001, 18, 221–232. [Google Scholar] [CrossRef]
  58. Schumacher, M.; Durán-Díaz, P.; Kurjenoja, A.K.; Gutiérrez-Juárez, E.; González-Rivas, D.A. Evolution and Collapse of Ejidos in Mexico—To What Extent Is Communal Land Used for Urban Development? Land 2019, 8, 146. [Google Scholar] [CrossRef] [Green Version]
  59. Chen, F.; Bai, X.; Liu, F.; Luo, G.; Tian, Y.; Qin, L.; Li, Y.; Xu, Y.; Wang, J.; Wu, L.; et al. Analysis Long-Term and Spatial Changes of Forest Cover in Typical Karst Areas of China. Land 2022, 11, 1349. [Google Scholar] [CrossRef]
  60. Song, F.; Wang, S.; Bai, X.; Wu, L.; Wang, J.; Li, C.; Chen, H.; Luo, X.; Xi, H.; Zhang, S.; et al. A new indicator for global food security assessment: Harvested area rather than cropland area. Chin. Geogr. Sci. 2022, 32, 204–217. [Google Scholar] [CrossRef]
  61. Wu, L.; Wang, S.; Bai, X.; Chen, F.; Li, C.; Ran, C.; Zhang, S. Identifying the Multi-Scale Influences of Climate Factors on Runoff Changes in a Typical Karst Watershed Using Wavelet Analysis. Land 2022, 11, 1284. [Google Scholar] [CrossRef]
  62. Du, C.; Bai, X.; Li, Y.; Tan, Q.; Zhao, C.; Luo, G.; Wu, L.; Chen, F.; Li, C.; Ran, C.; et al. Inventory of China’s Net Biome Productivity since the 21st Century. Land 2022, 11, 1244. [Google Scholar] [CrossRef]
  63. Xiong, L.; Bai, X.; Zhao, C.; Li, Y.; Tan, Q.; Luo, G.; Wu, L.; Chen, F.; Li, C.; Ran, C.; et al. High-Resolution Data Sets for Global Carbonate and Silicate Rock Weathering Carbon Sinks and Their Change Trends. Earth’s Future 2022, 10, e2022EF002746. [Google Scholar] [CrossRef]
  64. Hu, S.; Zhang, Y.; Yang, Z.; Yan, D.; Jiang, Y. Challenges and opportunities for carbon neutrality in China’s building sector—Modelling and data. Build. Simul. 2022, 15, 1899–1921. [Google Scholar] [CrossRef]
  65. Li, C.; Bai, X.; Tan, Q.; Luo, G.; Wu, L.; Chen, F.; Xi, H.; Luo, X.; Ran, C.; Chen, H.; et al. High-resolution mapping of the global silicate weathering carbon sink and its long-term changes. Glob. Chang. Biol. 2022, 28, 4377–4394. [Google Scholar] [CrossRef] [PubMed]
  66. Zhang, S.; Bai, X.; Zhao, C.; Tan, Q.; Luo, G.; Wu, L.; Xi, H.; Li, C.; Chen, F.; Ran, C.; et al. China’s carbon budget inventory from 1997 to 2017 and its challenges to achieving carbon neutral strategies. J. Clean. Prod. 2022, 347, 130966. [Google Scholar] [CrossRef]
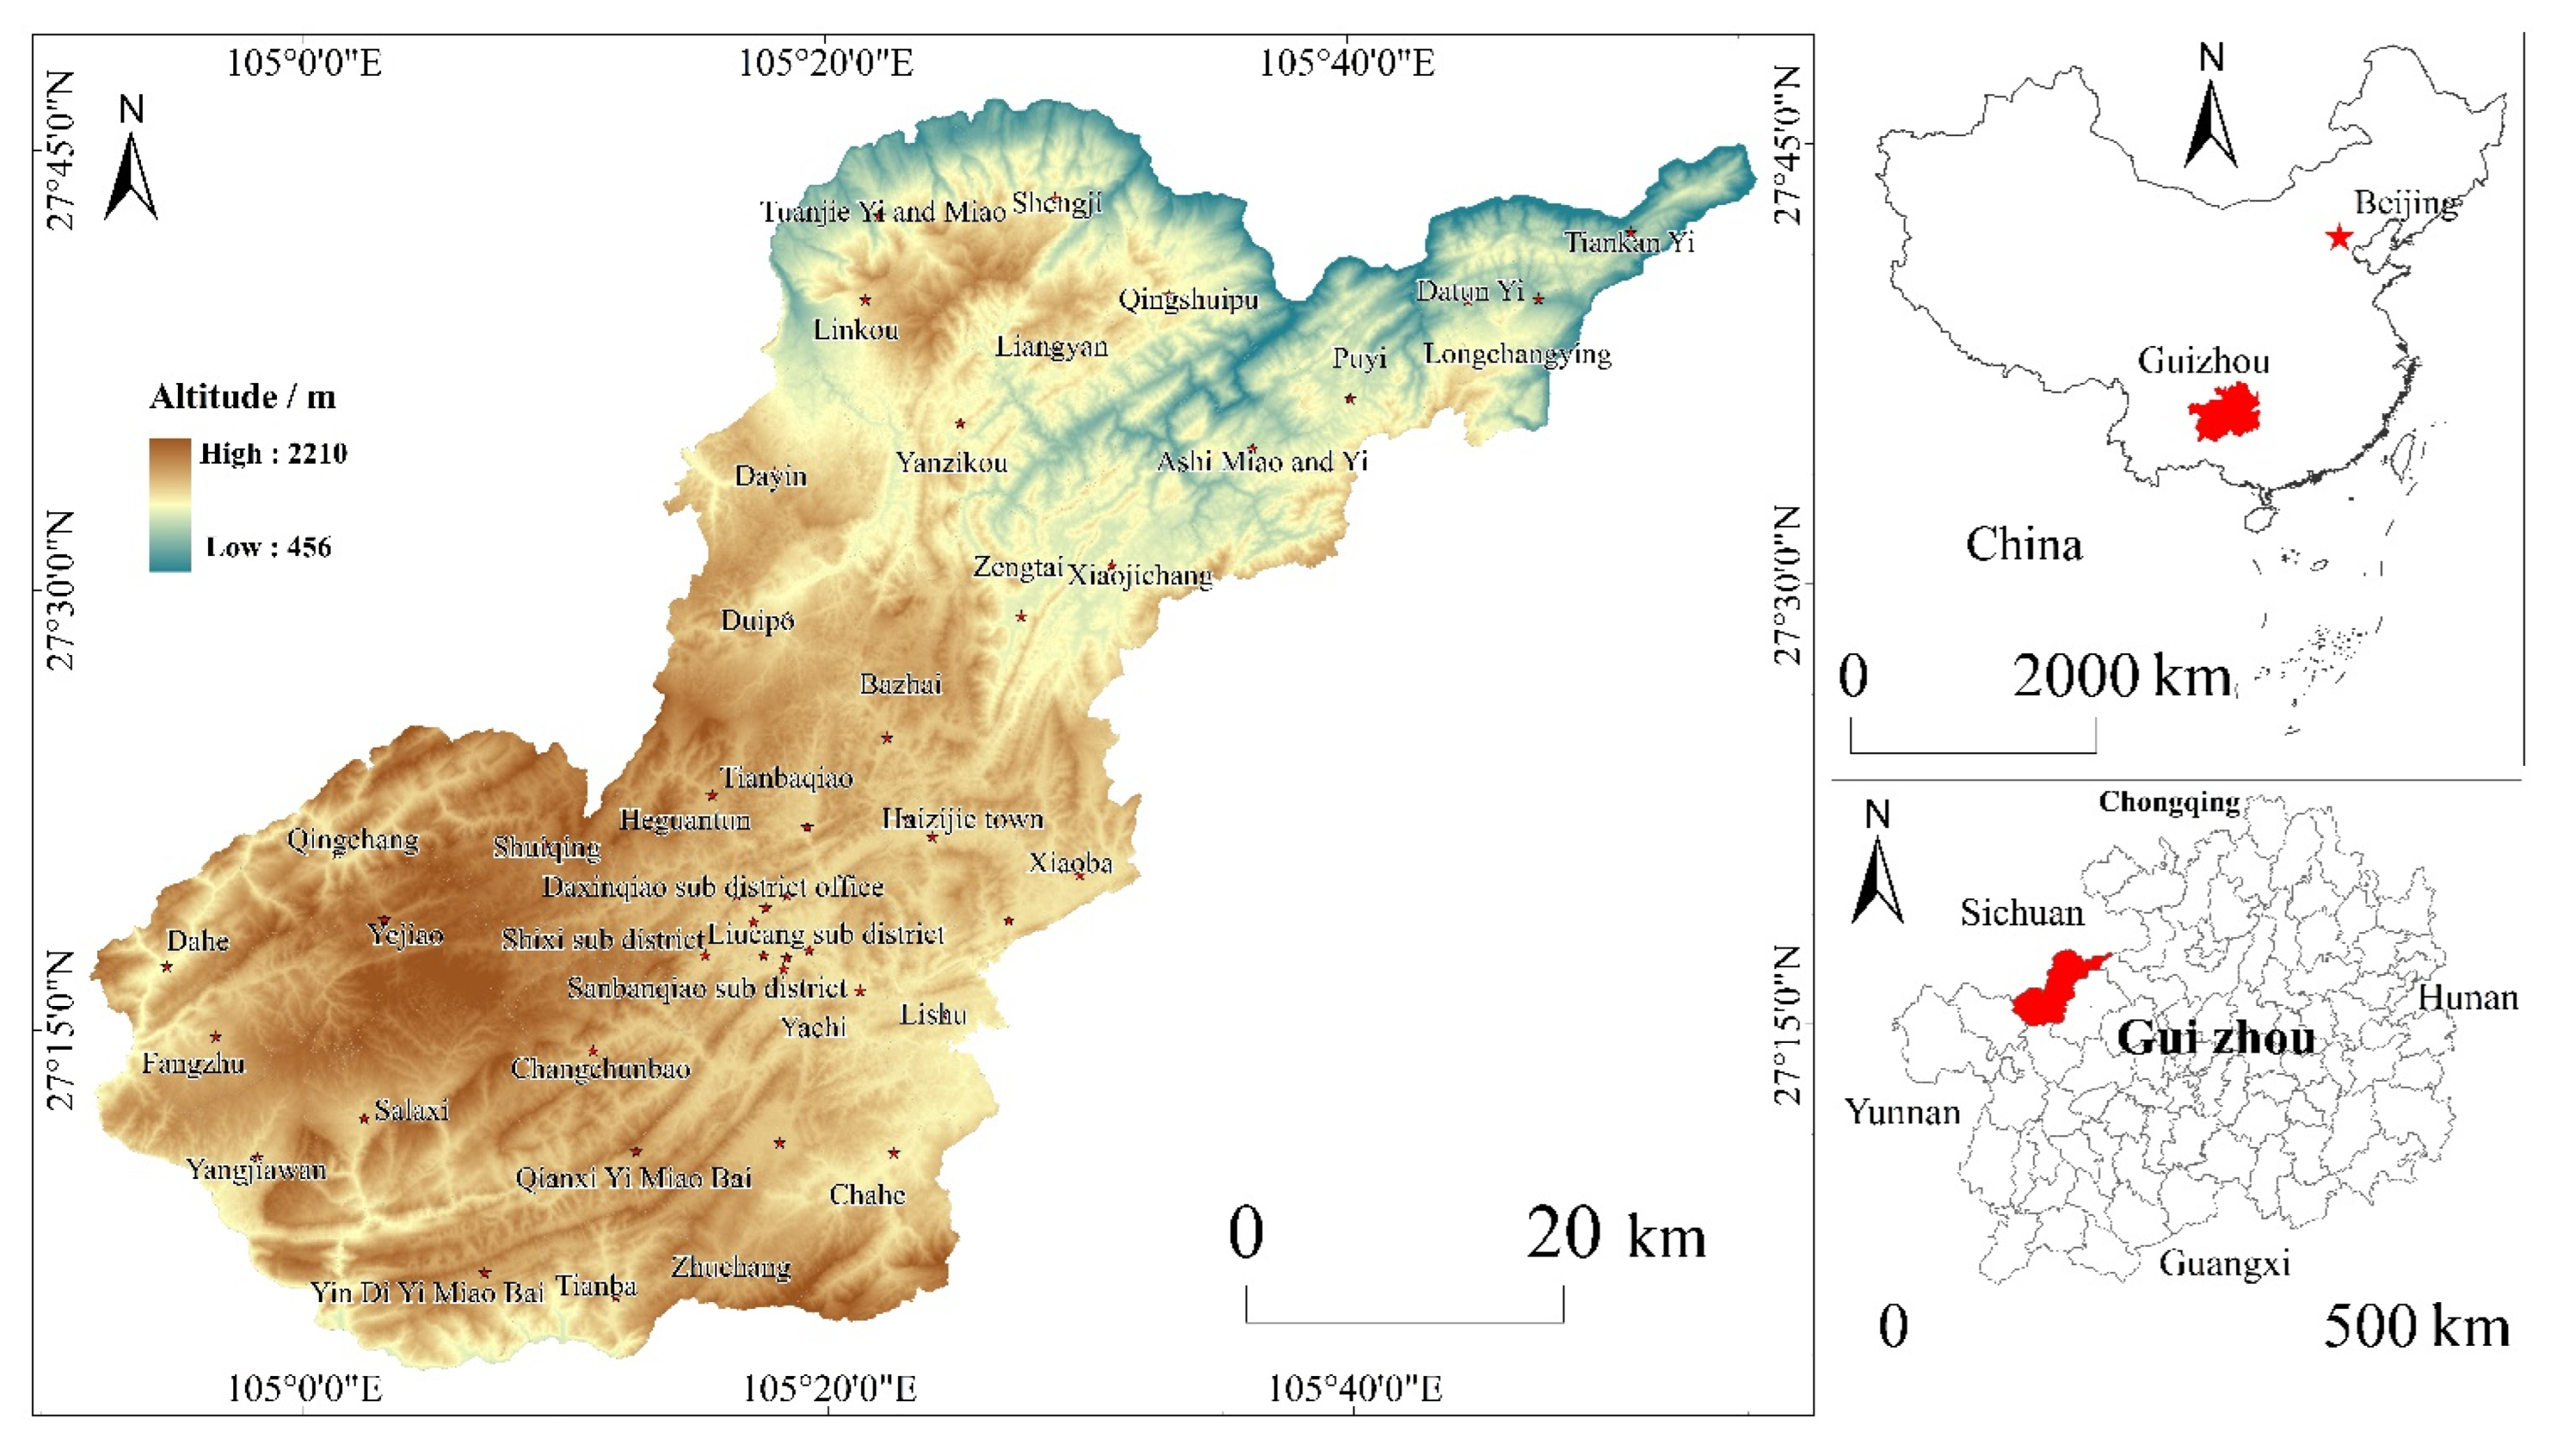
Figure 1. Topographic and location map of study area.
Land 11 01734 g001
Figure 2. Spatial distribution of urban–rural construction land characteristics in Qixingguan District from 2009 to 2020.
Land 11 01734 g002
Figure 3. New sources of urban–rural construction land in Qixingguan District from 2009 to 2020 (hm2, %).
Land 11 01734 g003
Figure 4. End points for the reduction in urban–rural construction land in Qixingguan District from 2009 to 2020 (hm2,%).
Land 11 01734 g004
Figure 5. Change in PD value of detection factor in Seven Star Pass area from 2009 to 2020. X1, per capita GDP; X2, average GDP; X3, urbanization rate; X4, population density; X5, total population at end of year; X6, total industrial output; X7, total fixed assets investment of whole society; X8, total annual wages of employees per unit; X9, total fiscal revenue; X10, average slope; X11, average elevation; X12, road network density.
Land 11 01734 g005
Table 1. Detection indicators of influencing factors of urban–rural construction land changes.
Influencing FactorNumberDetection FactorAccessDefinition of Indicator
Basic natural conditionsX10Terrain slopeBased on DEM, obtained using ArcGIS slope calculation toolBasis of natural conditions
X11Average elevationBased on DEM data, using ArcGIS software partition statisticsBasis of natural conditions
X12Road network densityTotal road area/total areaDegree of traffic development
Level of economic developmentX1GDP per capitaTotal GDP/total population of regionLevel of economic development
X2Average GDPTotal GDP/total area of regionLevel of economic development
X9Gross industrial outputBijie Seven Star Customs District Statistical YearbookLevel of industrial development
X7Total fiscal revenueOutline of National Economic and Social Development PlanLevel of economic strength
X7Completed investment in fixed assets of whole societyTotal investment in social fixed assets/area of urban and rural construction landLand use investment intensity
Social life conditionsX3Urbanization rateUrban permanent population/total regional populationPopulation agglomeration level
X4Population densityTotal population of region/total area of regionPopulation agglomeration level
X5Population densityDirectly obtained from Bijie Qixingguan District Statistical YearbookPopulation agglomeration level
X8Total salary of employees of unit at end of yearDirectly obtained from Bijie Qixingguan District Statistical YearbookSocial life conditions
Table 2. Quantity of change in urban–rural construction land in Qixingguan District (2009–2020) (hm2, %).
Classification of Land UseStatistical Indicator2009201320172020
Urban landNumber of polygons606106025708155
Area2193.143234.554177.095587.29
Proportion21.8525.3428.8624.42
Rural residential landNumber of polygons22,64822,86324,38275,178
Area7536.827614.137793.919552.45
Proportion75.1159.6553.8541.75
Urban industrial and mining landNumber of polygons4366556791974
area195.82668.46671.822086.95
proportion1.955.244.649.12
Traffic landNumber of polygons6740156918,251
Area7.531144.651721.405467.53
Proportion0.088.9711.8923.90
Scenic spots and special landNumber of polygons256256262888
Area101.66103.83108.36185.64
Proportion1.010.810.750.81
Aggregate statisticsTotal area10,034.9712,765.6214,472.5922,879.86
Note: In land use classification, proportion refers to the proportion of each land use type in urban–rural construction land.
Table 3. PD values of detection factors.
Detection FactorX1X2X3X4X5X6X7X8X9X10X11X12
PD value0.3250.2910.3280.1890.3510.2050.8190.3040.6070.1390.1340.440
p value0.0730.4140.2510.5530.0960.4340.0000.1480.0000.3860.5660.193
Table 4. Interaction of detection factors.
X1X2X3X4X5X6X7X8X9X10X11X12
X10.303
X20.8700.185
X30.8680.8400.474
X40.8630.8400.5910.339
X50.3420.9030.8910.8920.302
X60.8680.8140.6420.4100.8910.268
X70.9470.9410.8820.9370.9570.9360.860
X80.8680.8170.5420.6460.8960.5570.8780.386
X90.7530.9060.9150.9120.7510.9700.9310.9250.540
X100.7170.7200.7070.5130.7240.5140.9020.5380.7210.120
X110.3380.4820.5440.4910.3600.4840.8810.5990.6230.2730.099
X120.8190.5290.7940.8510.8480.8290.9160.7640.9130.6250.6760.225
Publisher’s Note: MDPI stays neutral with regard to jurisdictional claims in published maps and institutional affiliations.