1. Introduction
In the context of rapid global industrialization and urbanization, 45% of the world’s population still lives in rural areas and is affected by globalization [
1,
2,
3]. Meanwhile, the disparity and decline of rural development have become global issues in globalization [
4,
5]. Since the end of World War II, differential rural problems have gradually emerged in both developed and developing countries, with rural areas in the United States, the United Kingdom, and Canada, as well as developed countries in Europe and the United States, facing urban–rural disparities, concentrated poverty, cultural conflicts, and irrational land use [
6,
7,
8]. Developing countries, such as Africa and India, face severe land degradation, widespread poverty, food insecurity, and other problems in rural areas [
9,
10]. With the prominence of global rural problems, it is easy to see that rural land development and land use are among the critical issues of rural development, so it has become a human consensus to solve rural problems and explore the long-term evolution trend and sustainable development of rural areas and their land use [
11].
China has always been a major agricultural country, and its villages play a vital role in ensuring its agricultural and food security and sustainable development [
12]. In recent years, along with the continuous promotion of urban–rural integration and rural revitalization strategy, rural-related research topics have gradually become a major socio-economic issue of concern to researchers and the Chinese government [
13]. As one of the carriers of rural society, village settlements are widely used in rural studies [
14]. A rural settlement is a production and living place formed by the interaction of rural residents with the surrounding natural environment, socio-economic environment, and cultural environment [
15]. The integrated development and optimal spatial reorganization of all elements of rural settlements have become an academic hotspot driven by the urgent need and strategy for the sustainable development of national rural society [
16].
Rural settlements are the basic spatial units of rural geography and an important part of the study of human–land relations [
17]. Academics have conducted many studies on rural settlements, rural settlement land use, and rural settlement development and have achieved remarkable results. In studying the evolution of rural settlements, scholars initially focused on the formation and orientation of rural settlements [
18,
19]. With the development of geographic information technology, scholars have paid more attention to the types of rural settlements [
20], spatial distribution, scale [
21,
22,
23,
24], density [
25,
26], driving mechanisms [
27], transformational development, spatial reconfiguration, etc. [
28,
29]. In the studies related to land use change in rural settlements, scholars have focused on national [
30,
31], provincial [
32], regional [
25,
33,
34], and basin [
35,
36] scales of study, and used research methods such as the landscape pattern index method [
37], neighborhood buffer analysis [
38], spatial autocorrelation analysis [
39], and sample zone analysis [
40] to explore the core issues [
41,
42] of the spatial layout of rural settlement land use, driving mechanisms of land use evolution, and spatial optimization and reorganization. In the study of rural settlement development, scholars have devoted themselves to the study of rural settlement development types and patterns [
12,
17,
43], development potential [
44], multifunctionality [
13,
45,
46], and sustainable development [
47,
48]. Several studies have analyzed rural settlements, land use, and rural settlement development separately. However, previous studies have only observed single-factor dynamic changes in rural settlements. There is a lack of in-depth research on the comprehensive development types of different rural settlements, the evolution of settlement development, and surrounding land use elements and there is still a lack of research on the dynamic changes in land use at the microscopic scale of rural settlements in long time series. Few studies have examined the integrated perspective of human–land interaction and rural development. The inadequacy of these studies make it difficult for us to accurately judge and grasp the regularity and stages of the evolution process of rural settlements and to scientifically optimize the planning related to rural settlements in rural revitalization. Therefore, it is necessary to study the dynamic changes in land use in rural settlements on a microscopic scale.
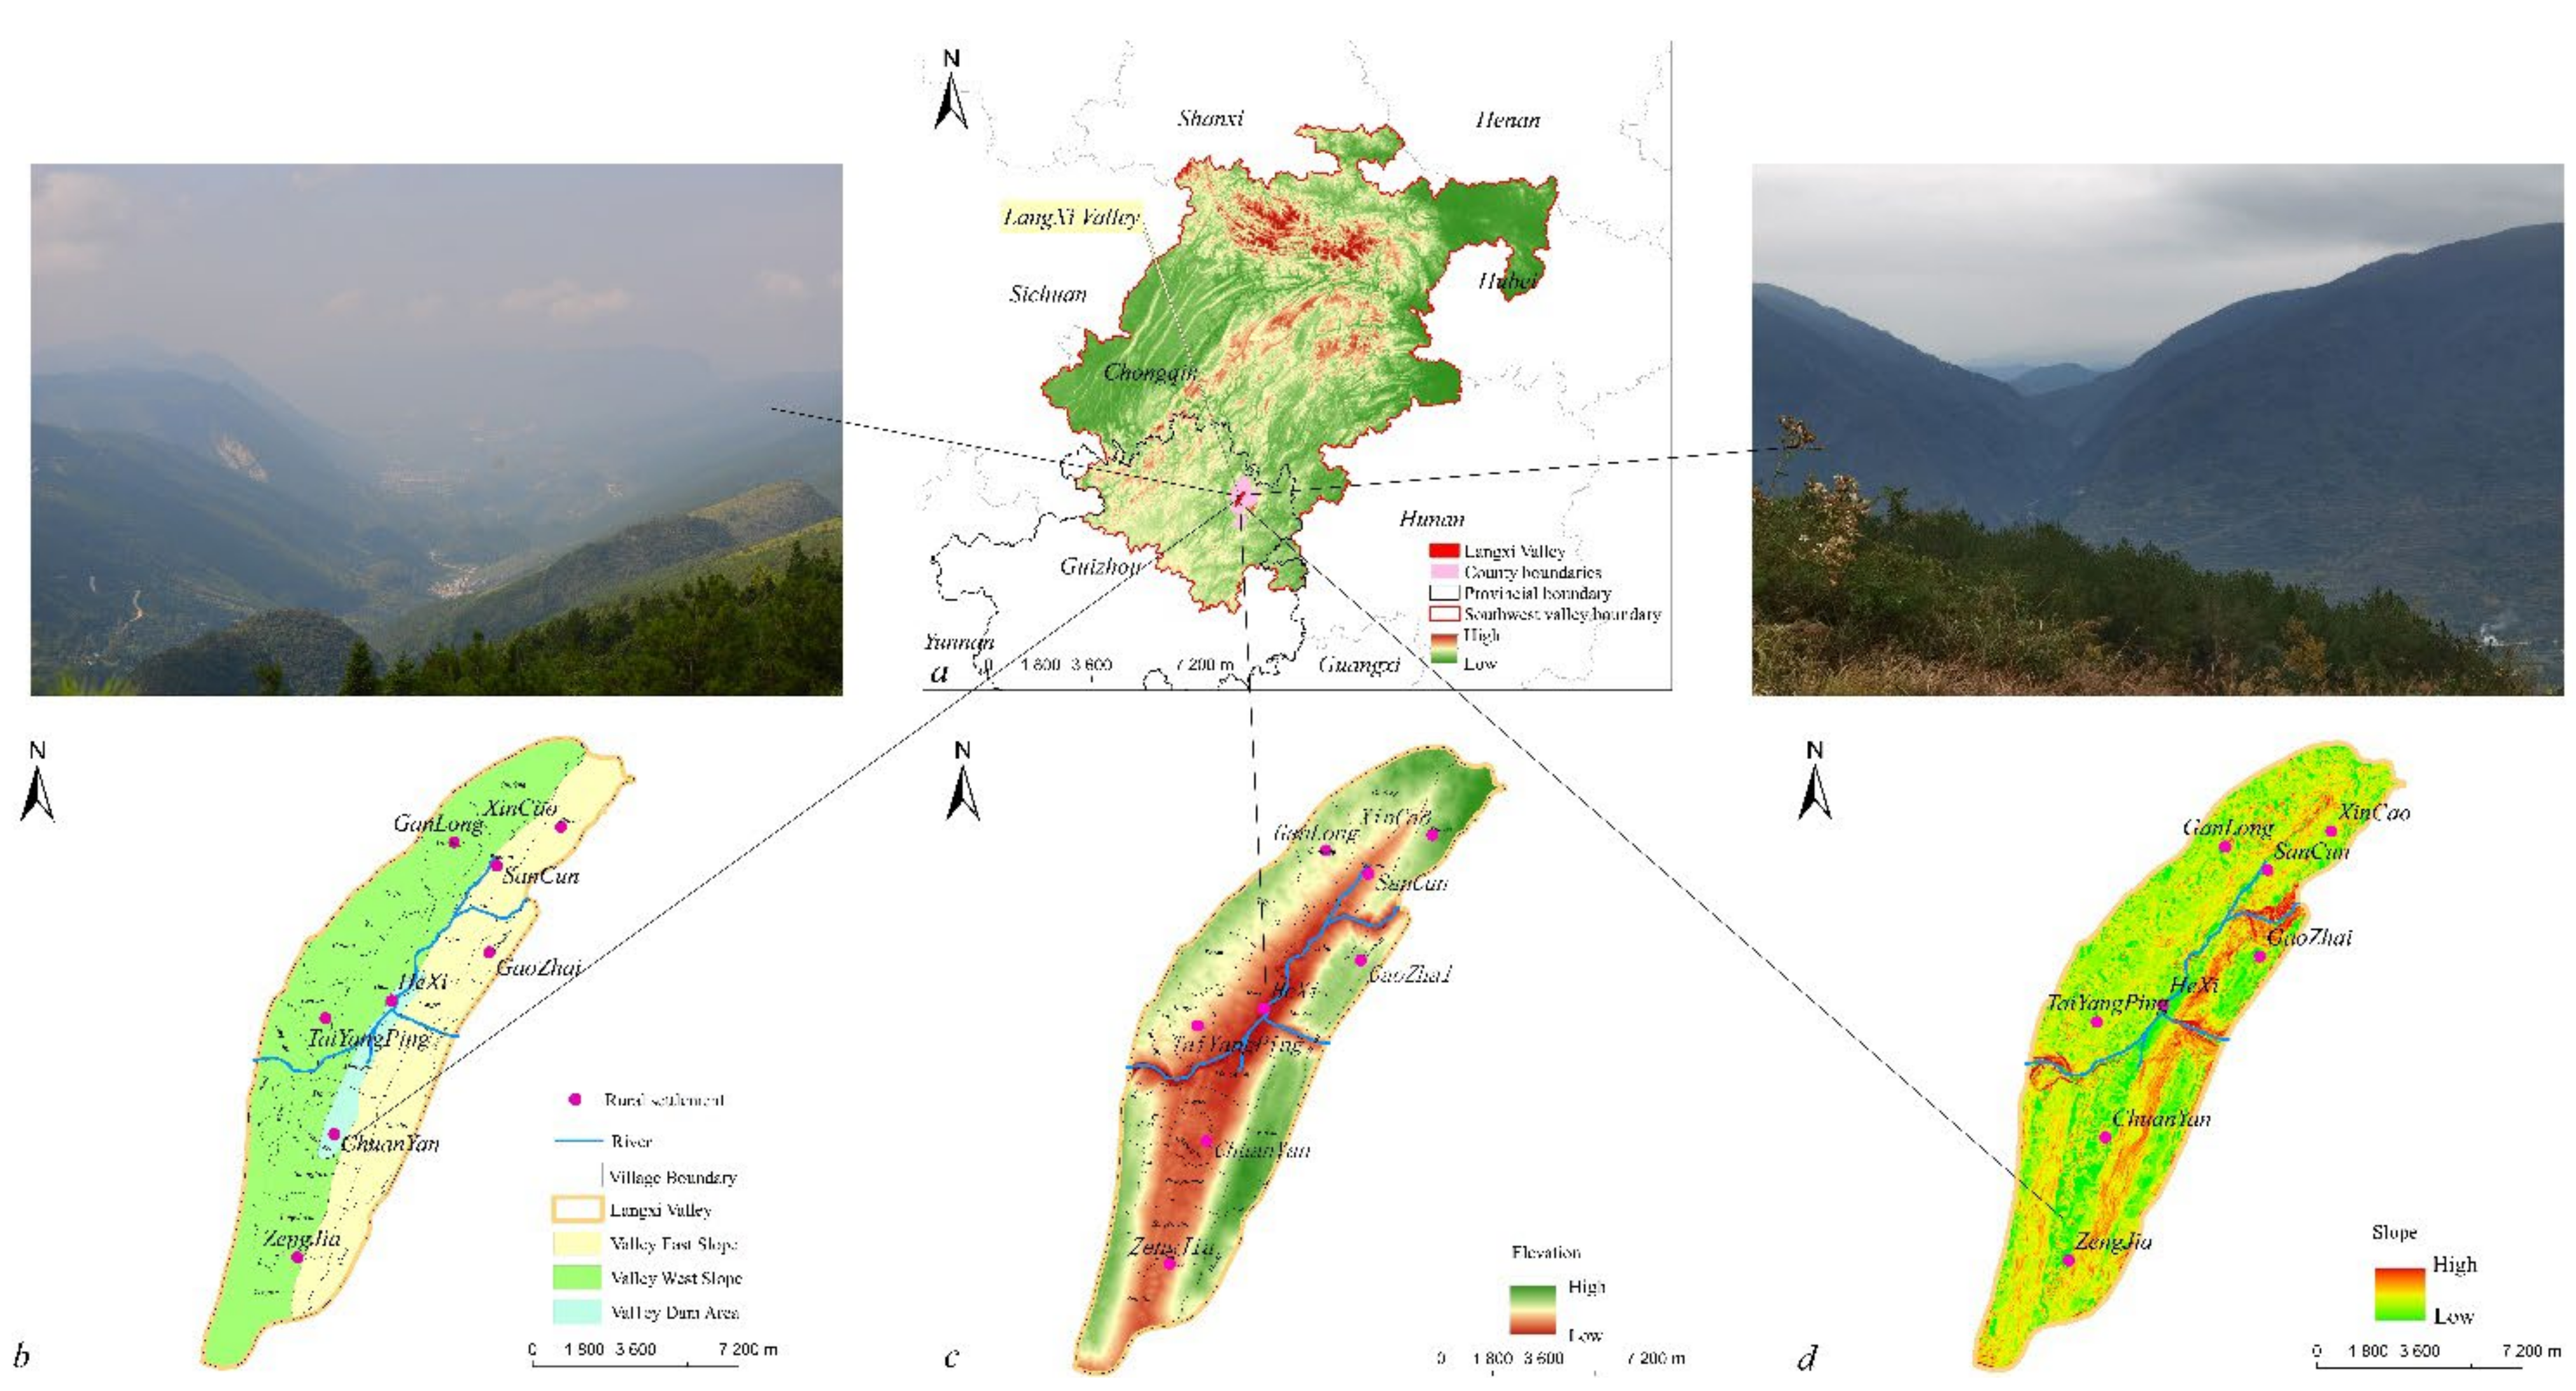
The karst trough valley is one of the typical karst landform types in China, as it is a large area with a flat topography at the bottom of the trough. The region is characterized by high population pressure, low land carrying capacity, relatively lagging socio-economics, considerable topographic relief, and significant differences in spatial patterns of land use. Based on this, clarification of the “people (settlement)—land (land use) relationship and its evolution” in the trough valley is vital for the territory. In the context of the current dualistic development of urban–rural territorial systems, the number, scale, and pattern of land use in and around different rural settlement types in the trough valley varies, and the differences in land use evolution of different rural settlement types reflect the differences in regional rural socio-economic development. Because of this, to explore the land use evolution pattern at the settlement scale in the karst trough valley, this study grasps the “type” of settlement with the help of “typical” settlements. The study uses “micro-scale long time series” to map “large scale short time series.” The study selects different types of settlements in karst troughs and valleys as research objects and explores the spatial and temporal evolution characteristics of land use around different types of settlements on the settlement scale. At the same time, we analyze the land use transfer trajectories of different types of settlements; explore the land use rise and shrinkage patterns; and reveal the interactive feedback mechanisms of land use change (LUCC), land use transformation (LUT), and rural settlement transformation (RST) processes. We aim to explore the driving factors of the spatial differentiation of rural areas to provide a more scientific and reasonable reference basis for the land use of rural settlements under different geomorphological conditions in other karst trough and valley areas, to achieve a balance between the supply and demand of land use in rural settlements in karst troughs and valleys, to promote sustainable rural socio-economic development and ecological–environmental protection, and to provide a reference for enriching the research framework and typical cases of rural land use evolution and land use transformation in China.
Accordingly, we proposed the following research question: What is the development type of rural settlements in the karst trough valley of Southwest China? How does land use change across rural settlement types on the buffer scale? What natural or socio-economic factors influence land use change in rural settlements? Specifically, we tested two main hypotheses: (1) Land use change in rural settlements is driven by natural and socio-economic factors. (2) In the karst trough valley area of Southwest China, there is an interactive feedback mechanism of land use change–land use transformation–rural transformation development. To test these hypotheses, we selected the karst trough valley area in Southwest China as the study area. In
Section 1, we briefly describe the study area and data sources. In
Section 2, we list the appropriate research methods and the selection of typical clusters.
Section 3 analyzes the results of different rural settlement types, land use buffer changes, land use transfer trajectories, and land use coupling states in karst trough valleys. In
Section 4, we analyze the drivers of land use change and feedback mechanisms for different settlement types and highlight our research uncertainties and future research directions. Finally, the conclusions of our study are presented in
Section 5.
4. Results
4.1. Spatial Pattern Analysis of the Evolution of Rural Settlement Types in the Karst Trough
In order to clarify the spatial aggregation characteristics of the evolution of rural settlements in the LangXi trough valley and to classify the types of settlements, the regional rural settlements were analyzed using the nearest neighbor index. The nearest neighbor index analysis was conducted on the regional rural settlements, and the results of the analysis showed that, during the nearly 60 years from 1964 to 2021, the z–value of LangXi trough valley rural settlement was less than 1 in all four time periods, then the trough valley rural settlement showed a clustering trend. The significance level was less than 0.01, indicating that the spatial aggregation of rural settlement types within the trough valley territorial system rejects the null hypothesis of random distribution. From 1964 to 1999, the average observed distances in this period were all smaller than the expected average distances, and the nearest neighbor ratio was approximately 0.4 (0.37–0.39), with a significance level of
p < 0.01, indicating that the karst valley rural settlements showed an overall clustering trend in this period. The number of rural settlement patches clusters significantly decreased, the average observed distance slightly increased, and the nearest neighbor ratio slightly decreased, from 0.396 to 0.372 (
Table 2 and
Figure 3). This shows that the spatial agglomeration of settlements tended to weaken with time evolution. From 2004 to 2021, the cluster z–value decreased sharply from −20.76 to −48.39, indicating that the spatial agglomeration of the clusters showed a sharp weakening trend over time.
Drawing the standard deviation ellipse of the spatial distribution of rural settlement patches can explain the characteristics of centrality, direction, and spatial distribution patterns of rural settlement types in the karst trough valley area. Meanwhile, the direction and intensity of rural settlement development changes and their spatial dispersion trends can be identified by the standard deviation ellipse characteristic values in different periods. The average length of the x-axis from 1964 to 2021 was 1.4 km, the average length of the y-axis was 1.6 km, the rotation angle decreased from 25.59° to 25.31°, and the deviation range of the main parameters of the standard deviation ellipse for each year was approximately 2%, and the basic spatial pattern of the settlement was relatively stable and maintained its distribution in the W–N direction (
Figure 4). This shows that the basic spatial pattern of the settlement in the study area is controlled by the topography of the trough valley and trough dam, as well as the topography of the trough dam, which is surrounded by mountains on both sides, with east-west trough slopes and narrow north-south slopes. The center of the standard deviation ellipse is the center of gravity of rural settlements in the corresponding year, and its migration changes can reflect the overall spatial process of the evolution of rural settlement types in the study area. The center of gravity of the settlement in 1964 was used as the coordinate origin to measure the rate and direction of the settlement center of gravity migration in each period and visualize it. The calculation results show that the average annual rate of gravity migration was 32.12 m/a. In directional change, the gravity of the settlement shifted southeast from 1964 to 2021 and pointed to the trough dam area. The spatial evolution of hotspot areas of rural settlement types in the trough valley differed in each period, and the spatial directionality was stronger from 2004 to 2021 than from 1964 to 2004. The main reason for this is the accelerated urbanization and industrialization of the trough valley area since 2004 and the significant changes in the spatial pattern of settlements.
The study extracted the center of gravity of each settlement patch, used the center of gravity to represent the settlement, and calculated the spatial distribution density of the settlement. Using the ArcGIS nuclear density module, a spatial analysis of nuclear density was conducted to classify the settlement nuclear density in each period into the background, low density, medium density, and high-density zones (
Figure 4). The settlement nucleation density of each period was also classified into the background, low density, medium density, and high-density zones (
Figure 4). The spatial heterogeneity of settlement density distribution in the trough and valley area is prominent, and the high-value area of settlement density distribution from 1964 to 2021 tended to be the trough and dam areas. The background area is mainly located on the slope and top of the valley, part of the geological environment in this area is not suitable for forming settlements, and the distribution of settlements is small. The medium and high-density areas are mainly located in the karst valley trough and dam area with flat terrain, convenient transportation, and good farming conditions and are primarily distributed in a band. The high-density areas are distributed along the traffic arteries and the Yinjiang River, while the low-density areas are scattered in the two wings of the troughs and valleys.
4.2. Analysis of the Buffer Zones in Land Use Change around Typical Rural Settlement Types
From 1964 to 2021, buffer changes, the types, and amounts of land use around the settlements showed differential change characteristics within the buffer area. The land use changes in the settlement’s 0 to 400 m buffer zone showed the evolution characteristics of three buffer interval dimensions. The land use mapping of 0 to 50 m, 50 to 200 m, and 200 to 400 m buffers in four troughs and valleys in typical settlement classes had varying characteristics (
Figure 5).
In general, the change in land type in the buffer zone of the ES of the dam of karst trough valley is mainly concentrated in the buffer range of 0 to 50 m, and the land use types around the settlement are mainly steep-slope arable land, gentle slope arable land, flat dam arable land, and rural settlement, and the number of land types accounts for 30.84%, 13.21%, 12.67%, and 8.23% of the buffer area, respectively. In the buffer zone, the overall trend of land use change shows the expansion of forest land and abandoned land, while rural residential areas and arable land maintain a balance. However, within the 0 to 50m buffer zone, the land use land types around the BS are mainly rural residential areas, orchards, flat dam arable land, and steep-slope arable land, with the numbers accounting for 12.13%, 10.36%, 28.31%, and 21.62%, respectively. The rate of change is mainly based on the expansion of rural settlements, flat dams of arable land over time, and the increase in abandoned land and orchards. The changes in the land use buffer zone around the AS of Xinchao and Ganlong are mainly manifested in four types of land: forest land, arable land, and abandoned land (
Figure 5). Within the 0 to 50 m buffer zone, the overall land use types are mainly steep slope arable land, gently sloping arable land, rural residential areas, and abandoned land, accounting for 36.12%, 23.03%, 12.35%, and 9.16% of the buffer zone area, respectively. The land use around the DS Taiyangping has apparent differences in land use types, quantity, and structural changes in the buffer zone dimension; the number of land use types has increased, and the change in land use quantity is mainly in forestland, cropland, grassland, and abandoned land. In the 0 to 50 m buffer zone range, the buffer zone land types of rural settlements, low-cover grassland, and flat dam cropland show an increase and decrease with time.
4.3. Mapping and Trajectory Analysis of Land Use Changes around Typical Rural Settlement Types
The study introduces a geographic information mapping trajectory model to analyze the spatial and temporal trajectories of land use change around typical settlements in the LangXi trough valley (
Figure 6). From 1964 to 1999, the land use around the trough dam of ES showed an expansion of steep-slope arable land, flat-dam arable land, grassland, and rural residential area, and a contraction of forestland and low-cover grassland in the time-series change characteristics. The trajectory mapping of land use change is as follows: forestland→steep-slope arable land, forestland→flat dam arable land, forestland→irrigated grassland, gently sloping arable land→irrigated grassland, low-cover grassland→steep-slope arable land, low-cover grassland→rural residential areas. The land use at the trough valley top and the trough slope of the AS is mainly steep-slope arable land, flat dam arable land, irrigated grassland expansion, and forestland shrinkage. The trajectory of land use change around the settlement is mainly forestland→steep-slope arable land, forest land→flat dam arable land, forest land→gently sloping arable land. BS at the top of the trough valley is dominated by the expansion of steep-slope arable land, flat dam arable land, grassland, and rural residential area, and the contraction of forestland and low-cover grassland. The trajectory mapping of land use change is mainly: forestland→steep-slope arable land, forestland→flat dam arable land, forestland→irrigated grassland; gently sloping arable land→irrigated grassland, low cover grassland→steep-slope arable land, low cover grassland→rural residential area. The trough slope of the DS is mainly dominated by the expansion of arable land and the shrinkage of forestland grassland, and the land use change trajectory is mainly: forestland→steep-slope arable land, forestland→flat dam arable land, forestland→irrigated grassland, steep-slope arable land→gently sloping arable land; the intensity of arable land use is higher in the trough slope in this period.
From 2004 to 2014, the land use types of the ES were mainly forestland, abandoned land, grassland expansion, steep slope arable land, irrigated grassland, flat-dam arable land, and gently sloping arable land contraction. The land use change trajectory is mainly steep-slope arable land→abandoned land, gentle slope arable land→abandoned land, flat dam arable land→abandoned land, low cover grassland, and irrigated grassland→abandoned land. The land use types of the AS are mainly an expansion of grassland and abandoned land, and contraction of forestland, irrigation grass, gently sloping arable land, and steep sloping arable land, and the trajectory mapping of the surrounding land use changes are mainly forestland→steep sloping arable land, forestland→flat dammed arable land, and forestland→gently slope arable land. The types of land use around the BS are mainly gently sloping arable land, abandoned land, irrigated grassland, low cover grassland, high cover grassland, rural road expansion, steep-slope arable land, forest land, and flat dam arable land contraction. The trajectory of land use change is as follows: steep-slope arable land to fallow land, steep-slope arable land to grassland, forest land to irrigated grassland, forest land to gently sloping arable land, forest land→irrigated grassland, forest land→country roads, gently sloping arable land→abandoned land. The land use types around the DS are mainly arable land, grassland expansion, and forest land contraction, and the land use change trajectory mainly shows forestland→arable land, forest land→irrigated grass, forestland→high cover grass, and irrigated grass→high cover grass.
From 2014 to 2021, the land use types of the ES were forestland, flat dam arable land, rural road expansion, abandoned land, and steep-slope arable land, and slow slope arable land contraction was dominant, and the land use change trajectory around the settlement is mainly: abandoned land→flat dam arable land, irrigated grass→forestland, low cover grass→forestland, abandoned land→forestland. The AS mainly focuses on expanding forestland, abandoned land and grassland, flat dam arable land, gently sloping arable land, and steep sloping arable land shrink. The BS is dominated by the expansion of forest land, rural roads, tea gardens, flat dam arable land, and the shrinkage of arable land and grassland. The land use types of the DS are mainly forestland, abandoned land, grassland expansion, steep-slope arable land, irrigated grassland, flat dam arable land, and slow slope arable land contraction. The trajectory of land use change is mainly steep-slope arable land→abandoned land, gentle slope arable land→abandoned land, flat dam arable land→abandoned land, low cover grassland, and irrigated grassland→abandoned land; the overall trend of land types around the settlement showed shrinkage at this stage.
4.4. Coupled Analysis of Land Use Evolution around Typical Rural Settlement Types
The evolution of land use around different settlement types in the karst trough valley has a mutual influence relationship, and different settlement types in the trough valley were divided into three time periods according to the land use change patterns around different settlements: 1964–2004, 2004–2014, and after 2014. There are dynamic evolutionary coupling processes and dynamic coupling strengths between different settlement types and their surrounding land use changes in the three time periods (
Figure 7). Among them, the ES at the bottom of the trough, such as ZengJia, SanCun, Chuangyan, and the surrounding land use coupling process, show a complete coupling situation. The settlement area showed a local expansion from 1964 to 2004, a balanced expansion from 2004 to 2014, and a significant core expansion after 2014. The land use change around the settlement showed different trends with the settlement expansion, the land use area of steep-slope arable land and gentle slope arable land expanded, and the flat dam arable land decreased. The clusters and their surrounding land use showed an increasing linear trend in coupling intensity.
Regarding the BS of HeXi and GaoZhai in 1964–2021, the coupling process between the settlement and its surrounding land use showed a remote continuous coupling state, and the core of the settlement and the land use around the settlement its coupling intensity showed an inverse linear growth trend. The AS and the surrounding land use changed in this period, and the coupling process of surrounding land use with the settlement as the core showed a local coupling, which exhibited a local expansion from 1964 to 2004. From 2004 to 2014, it showed local shrinkage; after 2014, it showed rapid shrinkage. The land use changes around shrinking settlements showed a gradual decrease in cultivated land on gentle slopes, steep slopes, and flat dams; minor changes in the surrounding forest land; and an increase in the irrigation and grassland areas, and overall, the coupling intensity of shrinking settlements and their surrounding land use changes showed a trend of increasing first and then decreasing. The area of DS showed local expansion from 1964 to 2004; balanced shrinkage from 2004 to 2014; and after 2014, the settlement center transitioned into a significant extinction phenomenon, the settlement and the surrounding land use showed a fundamental coupling disorder, and the coupling intensity of the settlement core and the surrounding land use of the settlement decreased linearly.
5. Discussion
5.1. Analysis of the Homogeneity and Heterogeneity of Land Use Changes around Typical Rural Settlement Types
5.1.1. Homogeneity Analysis of Land Use Changes around Different Settlement Types
The analysis of land use changes in the buffer zone of the ES, AS, DS, and BS found that the homogeneity of land use changes around different settlement types in karst trough valleys mainly manifested in the spatial dimension and the temporal pattern dimension. Homogeneity was manifested as follows: Firstly, spatially, the increment in trough dam settlement showed an inverted U-shaped variation with land class (
Figure 8), the ES, and an increase in land types. The number of settlements and land types of DS on the trough slopes showed a linear change of “\”. A single land type appeared when the settlement on trough slopes died out. At the top of the trough AS with BS, the number of communities and land types showed an “L” change; the development of settlements at the top of the troughs appeared to be flat, and the number of land types decreased. Second, the land types around the ES at the top and bottom of the trough were more and less influenced by the settlement within 200 m. At the same time, within the 200 m buffer zone and outside the 200 m buffer zone, the land use around the early and late settlement retained a particular slope of sloping arable land. Third, the abandonment phenomenon existed inside and outside different settlement types’ 200 m buffer zone. In addition, the homogeneity of the land use of settlements in terms of temporal characteristics was shown by the annual enrichment of land use land types around different settlement types from 1964 to 2021. Land use structure and function around different settlement types in karst trough valleys showed dynamic changes.
5.1.2. Analysis of the Variability of Land Use Change around Different Settlements
Different settlement types in karst trough valleys have differences in the buffer zone and temporal characteristics of land use changes around them. From the analysis of the overall land use changes of different settlement types, it was found that the ES land use evolution at the bottom of the trough valley showed that the closer the location to the center of the settlement, the richer the land use type. Moreover, its land use buffer type and land type shift showed that it was dominated by arable land, orchards, and tea gardens (
Figure 8). The farther it is away from the settlement center, the more homogeneous the land use type is, and the land use type showed the ecological restoration type of use, such as forest land, abandoned land, and grassland. The land use evolution pattern of the BS at the top of the trough showed that the land use types were richer regardless of the distance from the settlement, and the land use types in the buffer zone and around the settlement were mainly arable land. The land use changes in the AS showed a closer distance to the settlements on the slopes of the troughs and valleys. The primary land use type for more homogeneous land use type was mainly arable land, abandoned land, and other valuable methods. The more distant the settlement, the richer the land use type was. The primary land use type is steep-slope arable land, grassland, irrigation grass, and forestland. The DS land use changes on the slopes of the trough valley mainly show that the rural residential areas in the center of the settlement are abandoned, and their buffer zone land class and the land class transfer around the settlement are mainly abandoned land, grassland, and forestland, while in the buffer zone dimension, the closer to the settlement center, the lower the land class richness, and vice versa. Regarding the characteristics of the temporal pattern of land use change in the settlement, the abandoned land, grassland, and forestland around the settlement expanded, and the arable land and residential areas shrank from 1964 to 2021.
5.2. Driving Mechanisms of Land Use Change in Typical Rural Settlement Types
Considering the characteristics of typical settlement types in karst trough valleys, the analysis of land use changes around settlements revealed that land use changes around rural settlements in karst trough valleys are driven by multiple factors and are the result of the interaction between the natural environment and human activities. Natural, human, socio-economic, and environmental factors influence land use changes around different settlement types. Among them, topography, climate, hydrology, geology, soil, and other physical, geographic, and environmental factors directly influence regional differences in rural settlements, especially in the driving mechanism of land use change in rural settlements.
In this study, the influence of regional geological composition and soil texture on the land type change around rural settlements was relatively weak, so the mechanism driving factors were not explored here. In the unique environment of regional karst geomorphology, in addition to geological features partially influencing factors, the changes in cultivation conditions and radius caused by the dual factors of elevation and slope become the main limiting drivers of land use changes around rural settlements. Therefore, land use changes in rural settlements in the LangXi karst trough valley are driven by natural geographic and environmental factors (
Figure 9). The land use change in the settlement is driven by the positive double feedback mechanism of topography and slope, with the dynamic change pattern of “low-low expansion.” The average slope of the typical settlements in SanCun, Chuangyan, and ZengJia is 5–15°, the average elevation is 580 to 795 m, and the land use around the settlements is forest land and arable land expansion (
Figure 9). The driving pattern of land use change in and around a shrinking slotted slope settlement showed “low-low shrinkage” dynamics. The average slope of typical settlements in Ganlong and Xinchu is 15–20°, and the elevation is between 920 and 1170 m. Balanced rural settlements form “medium-medium average” and “high-high extinction” dynamic change driving patterns, respectively, with the medium-high slopes and land use changes showing dynamic equilibrium and extinction.
In summary, the ES showed a trend of spatial expansion to lower elevations and elevation zones over time. The AS showed the trend of atrophy of high elevation and high-altitude settlement centers over time, while the BS showed the trend of balanced rural development in the middle elevation of troughs and valleys. The DS showed the development trend of high altitude and high elevation to restrict the land use of clusters.
The change of land use in and around rural settlements is a process of selective regional development under the combined influence of natural resource conditions and human and socio-economic infrastructure conditions; it can be seen as the result of competition between rural settlement land and other types of surrounding land. Natural factors determine the basic structure of rural settlements and their surrounding land pattern and constitute the substrate for the growth and development of rural settlements. Moreover, they have a significant influence on the origin, change, and extinction of rural settlements in karst troughs; human and socio-economic factors directly or indirectly cause the activity state of rural settlements in the trough and constitute the main drivers of dynamic changes in land use in and around rural settlements on short and medium time scales. The land use changes around the rural settlements in typical karst trough valleys are mainly driven by policy orientation, population change orientation, farmer willingness orientation, farmer livelihood orientation, and economic development regarding human and socio-economic factors, specifically including returning farmland to forest policy (S-RFF), farmers’ behavior and willingness (S-FBW), policy (S-POL), economy(S-ECO), Stone Desertification Management (S-SDM), farmers’ livelihood (S-FL), population loss (S-PL), Precise Poverty Alleviation and Land Policy Innovation (S-PPAL), and Land Remediation (S-LR) (
Figure 9). Under the policy-driven guidance, land use changes around typical rural settlements in the trough valley are influenced by the policy of returning farmland to forest, stone desertification control projects, ecological restoration project construction, and sloping land improvement policy. Precise poverty alleviation and the policy of stone desertification management are significant. Driven by population orientation, the population’s age structure in the trough area is dominated by young children and older adults, and the labor capacity of rural settlements is weak. The labor capacity determines their labor distance and intensity, and the labor distance and intensity affect the planting and tending of rural settlement land, thus affecting the land use pattern of rural settlements in the karst trough area. For example, the population loss of TaiYangPing in the trough valley slope of DS gradually increased from 2000 to 2020 (
Table 3), and the loss rate reached 50%, and a large number of young people in the settlement went out or moved out, and the land use pattern around the settlement changed from comprehensive mixed-use land type to single abandoned land type, and the settlement gradually showed the extinction trend. The labor force of Ganlong and XinCao has left, and middle-aged and young people have been lost, among which the loss of people in Ganlong increased from 21% in 2000 to 46% in 2020. There was dynamic stability in the rate of human flow loss in the trough dam settlements of HeXi and GaoZhai from 2000 to 2020, and the land use changes around the settlements showed a balanced state. The population of the expanding settlement is returning to the land, and the settlement and land use are expanding. Driven by the livelihood orientation of farmers, typical settlements in karst trough valleys diversify with agrochemical livelihoods and show diversity in surrounding land use changes. In general, the evolution of rural settlements at the top and slopes of trough valleys with higher elevation is dominated by more decisive geographical factors; rural settlements in trough dam areas show a stronger correlation with socio-economic factors and are more strongly influenced by population, policies, and economic development levels; rural settlements and their surrounding land use changes have obvious clustering effects toward transportation, rivers, and cultural centers.
5.3. Discussion of the LUCC–LUT–RST Interaction Feedback Mechanism for Typical Rural Settlement Types
Various socio-economic issues mapped out in the development of rural settlements are reflected in their land use. Generally, drawing from the settlement land use changes can reflect the trend changes in regional land use patterns and formulate regular summaries. Land use morphological change is the core element of land use transition research. Land use transformation is the external expression of the transformation of rural settlement development, so the relationship between land use change (LUCC), land use transition (LUT), and rural settlements transformation (RST) are inseparable.
Typical settlements and land use changes in karst trough valleys show the characteristics of 0 to 50 m, 50 to 200 m, and 200 to 400 m buffer zone circle changes (
Figure 10). The process, intensity, and pattern of land use changes around different settlement types are different, thus forming the different processes of settlement land use evolution. From the analysis of the land use transfer matrix and change mapping of settlements, it was found that the ES presents the land use transition process of production–life–ecology (LUT-1); and the AS presents the land use life–production–ecology transition process (LUT-2); the BS presents the production–ecology–ecology land use transition process (LUT-3), and the DS forms the ecology–ecology–ecology land use transition process (LUT-4).
Within the karst trough valley territorial system, driven by external factors of urbanization and agricultural modernization, the land use and the dynamic change of rural settlements in the trough valley are reflected in the rural development level (RSD-level: Ra, Rb, Rc, Rd) and land use (LUD: LUD–a LUD–b, LUD–c, LUD–d) changes and are driven by both to form a regional RST process curve Ta~Td. Meanwhile, land use change development LUD-a~LUD-d (land use morphology change) and rural settlement development level (RSD-level) change together to promote the typical settlement type of the buffer area land use for the transformation interaction process (transformation process formed by ecology–production–life interaction), thus forming the LangXi trough valley rural settlement development and interaction process curve for land use and dividing the typical settlement development in the region into four stages. In the first stage, through the valley settlement subsistence–forest arable land competition stage Ra, the settlement is in the subsistence stage of maintaining basic livelihoods. Food production is the main purpose. Agricultural development is in the primary rough expansion stage, including the land use pattern LUD, which is a manifestation of agricultural land and ecological land competition; land use change, which is a manifestation of forest land; grassland reduction; arable land expansion, such as deforestation; trough slope reclamation; grass reclamation; and other behavioral activities, in the trough valley settlement. In the second stage of the trough valley settlement production, the agricultural land use development stage Rb, the trough valley settlement development is in the stage of sizeable agricultural development, the initial rise of agricultural modernization, and agricultural development from the initial rough expansion gradually transitioned to intensive production, manifested by agricultural chemical planting technology to improve crop yields in the trough valley area. Land use pattern LUD-b shows that the expansion of arable land area is gradually slowing down, while with the change of ecological and land policies, ecological land such as woodland and grassland is being restored. In the third stage of settlement labor, the land abandonment stage Rc, with the continuous promotion of industrialization, urbanization, and agricultural modernization, the population of rural settlements in the trough valley migrated to the cities and towns; the further transformation of settlements occurred, and the development of settlements shifted to a stage dominated by outworking. Land use changes were mainly manifested in the expansion of urban construction land, rural settlements, forestland, and other habited and ecological land, as well as the reduction in arable land and other productive land. In the fourth stage, the land use diversification stage Rd, which focuses on the diversified transformation of the settlement, the development of the trough valley settlement entered the post-industrial stage, the proportion of non-agricultural output value increased rapidly, and the settlement started to become multifunctional and diversified. In this stage, the LUD-d land use change was mainly manifested in the further expansion of habitable and ecological land use and a slight decrease in production land use.
LUT and rural settlement development succession will form differentiated RSD geographical types. Different rural settlement types present different levels of rural development. In summary, the land use change analysis of typical rural settlements in karst trough valleys from 1964 to 2021 under the characteristics of the long time series dimension revealed that the development of typical rural settlements in trough valleys presents four development stages: the traditional production function stage, the traditional industrial development stage (life function stage), the ecological restoration stage (ecological function restoration–development stage), and the ecological function enhancement stage. Within the karst trough valley, spatial reorganization optimization patterns and promotion micro-paths under different natural socio-economic conditions are formed through typical settlement land class changes and shifts, i.e., top-down land use contraction patterns and bottom-up expansion realization patterns of land use. In general, the transformation of land use function around the settlements in the trough valley is relatively apparent, with the land use around the expanded settlements changing from an agricultural production function to a living production function from 1964 to 2021; and the land use around the atrophied settlements changing from agricultural production function to ecological production function, and the land use around the balanced rural settlements changing from an agricultural production function to production and living function. The land use around the disappearing settlements showed changes from production and living functions to ecological functions.
5.4. Contribution to Research, Limitations, and Future Work
In our study, we revealed the mechanisms of settlement-scale land use change, land use transformation, and rural settlement transformation and development reciprocal feedbacks based on settlement micro-scale and case studies in southwest China’s karst trough valley area. However, for the study data, we used image data with different resolutions (2.7 m, 2.7 m, 10 m, 2.5 m, and 2.5 m), Thus when we performed the spatial transformation of the settlement data, there were deviations of about 0.01%, and these deviations can lead to highly slight changes in the rural settlement data.
Based on our analysis of the research on the dynamics of land use buffer zone changes in different settlement types, we synthesized the results and reflected on the limitations of this paper, and we believe that future research could also include the following aspects. (1) To analyze the dynamic changes of land use in the buffer zone of rural settlements in other geomorphic regions and to reveal the homogeneity and differences in land use dynamics in the buffer zone of rural settlements in different geomorphic regions. (2) In other geomorphic areas, the influence of other factors, such as spatial accessibility of the test settlement and watershed, on the dynamic changes of land use in rural settlements are fully considered. (3) Based on various big data models, simulate and predict the future dynamic land use changes in rural settlements. (4) Validate the land use change–land use transformation–rural transformation development model in other geomorphic areas through empirical research.

 ,
, 


