Abstract
Research on land resource carrying capacity (LRCC) focuses on the population that regional land resources can support as well as the grain output they can deliver. China’s major grain-producing areas consist of 13 provinces, and the grain produced in these areas makes up 75% of the country’s gross grain output. To boost the land carrying capacity of major grain-producing areas and to ensure national food security, it is crucial to examine the spatial–temporal evolution patterns of LRCC and to devise optimal regulatory strategies. From the perspective of human–grain relationships, this paper looks into the evolutionary features of the spatial–temporal patterns of the LRCC of China’s major grain-producing areas based on a land resource carrying capacity model, a land resource carrying capacity index model, and a land resource limitation model. We obtain three main results: (1) On the temporal scale, the land resource carrying capacity index (LRCCI) of China’s major grain-producing areas as a whole tapered off over a period from 1980 to 2020, whereas the overall LRCC increased in this period, indicating that the human–grain relationship in China’s major grain-producing areas is improving. (2) On a spatial scale, China’s major grain-producing areas ranked by LRCC from the greatest to the lowest, in 2020, were North China, the middle and lower reaches of the Yangtze River, Northeast China, and other regions. In terms of the carrying state of land resources, provinces with grain surpluses significantly rose during 1980–2020, the growth of LRCC of the aforementioned four major regions markedly slowed down in 2015–2020, and a large gap exists in LRCCI between the 13 provinces, revealing an unbalanced, insufficient development of LRCC in each province. (3) From 2000 to 2020, the limit of land resources on population aggregation in most major grain-producing areas was negative, and its absolute value continued to increase; this suggests that the land resources of major grain-producing provinces set small limits on population aggregation, with great potential for increasing LRCC. Taking into account the research results, this paper gives strategies for regulating the LRCC of China’s major grain-producing areas in a bid to further augment the human–grain carrying capacity of land resources in China’s major grain-producing areas and to guarantee national food security.
1. Introduction
The land resource carrying capacity (LRCC) is defined as the number of people a country or region can sustain with the food produced from its land resources under natural, social, and economic constraints [1,2]. It mirrors relations between land, population, and food. LRCC plays a central role in regional food security; likewise, the LRCC of major grain-producing areas relates largely to national food security [3]. China’s food security has been a global concern [4,5]. In recent years, industrialization and urbanization in China quickened their pace, and these are accompanied by a population boom; as a result, arable land is increasingly being used for construction purposes [6,7,8]. The growing population and overused farmlands pose a major threat to China’s land resource carrying capacity [9,10,11]. Moreover, China’s food security has been under the spotlight, as concerns with arable land degradation, inefficient use, and other land use issues have intensified [12]. In this context, a study on the LRCC of China’s major grain-producing areas and its spatial–temporal evolution from the perspective of the human–grain relationship helps identify the features and rules of the spatial–temporal evolution pattern of LRCC of China’s major grain-producing areas, ensures the grain production and population carrying capacity of these areas, and thereby safeguards the national food security of China.
The idea of carrying capacities may have its origins in the land use practices of prehistoric pastoral tribes. In ecology, this term generally denotes the number of people that a standard land area can sustain in the long term [2,13]. As its connotation is expanding and diversifying, its concept extends to other disciplines [1,14,15,16,17]. A typical example is land resource management, where the carrying capacity is often a reflection of the population–food relationship in a region. Scholars researched the carrying capacity of land resources with substantial results. The scope of their research involves farmland and urban land and is advancing to wider spatial regions from a single city [18,19,20]. In terms of content, in-depth research has been conducted on the connotation of LRCC [1,21], its spatial and temporal changes [22,23], improvement measures [24,25], and so on. With regard to research methodologies, scholars often choose tools such as the ecosystem approach [26], the synthetical index method [27,28], and land resource carrying capacity model [19,26]. As the review of available literature suggests, most scholars simply analyze the regional LRCC level and evaluate the LRCC level by composite index. These researches do help us understand the LRCC level better. However, due to the diversity of research methods and evaluation indexes, it is difficult to compare the differences in the evaluation results of the temporal and spatial scale of the LRCC in a larger scale, which consists of lots of research units, because of the lack of the unified evaluation methods and indicators. This comparison between research units is of great importance because the research units’ comparison could offer us a more clearly understanding of the difference on the evolution pattern of the level, status, development trend, and targeted regulatory strategies of LRCC in a larger, regional scale. Thus, in this study, the unified and standardized evaluation models of land resource carrying capacity and land resource carrying capacity index in the Technical Guidelines for National Population Development Functional Zones of China are selected. Additionally, the spatial–temporal evolution pattern of land resource carrying capacity at the provincial scale in China’s major grain-producing areas was studied from 1980 to 2020 to develop a better understanding about the spatial–temporal evolution pattern of the LRCC in China’s major grain-producing areas and lay a foundation for the national food security.
China’s major grain-producing areas comprise 13 provinces (autonomous regions), namely, Inner Mongolia Autonomous Region, Liaoning Province, Jilin Province, Heilongjiang Province, Shandong Province, Hebei Province, Henan Province, Jiangsu Province, Anhui Province, Jiangxi Province, Hubei Province, Hunan Province, and Sichuan Province. They account for more than 75% of the total grain production of China [29,30] and are crucial to China’s food security. In the case of a crisis in the LRCC in these major grain-producing areas, a food crisis in China and globally would be inevitable [31]. Although the 13 major grain-producing provinces in the study areas are all important national grain-production bases, there are significant differences in many of their aspects among provinces, such as the main functional area orientation, the level of socio-economic development, the tension degree of the human–grain relationship, the level of agricultural productivity, the level of food production technology innovation, and the distribution of agricultural subsidies. On the basis of analyzing the spatial–temporal evolution characteristics of LRCC and the characteristics of land resource limitation degree (LRLD) in each province, we should closely combine the local characteristics and evolution characteristics of LRCC in each province, focus on the level of LRLD, and combine the agricultural production situation and the human–grain relationship in each province to propose effective and targeted land use regulation policies, to improve the level of LRCC of each province, to realize the sustainable use of regional land resources, and to ensure the national food security of China.
Therefore, from the perspective of the human–grain relationship, this paper takes the above 13 provinces in China’s major grain-producing areas as the study areas. This study examines how the LRCC of the 13 provinces evolved in both spatial and temporal dimensions during 1980–2020 based upon the land resource carrying capacity model and the land resource carrying capacity index model. Moreover, this study explores how the land resources of China’s major gain-producing areas limit population aggregation, size, and distributions, utilizing a land resource limitation model. Then, the study proceeds with regulatory strategies for the LRCC of China’s major grain-producing areas from the aspect of human–grain relationships. Its outcomes may serve as a reference for boosting the LRCC in China’s major grain-producing areas, balancing the human–grain relationship, and ensuring national food security. In theory, the results of the study could reflect the population that can be supported by the land grain output of each province in China’s major grain-producing areas based on the human–grain relationship without considering the grain trade in the last 40 years, which is a useful supplement to the existing research that only evaluates the regional land resource carrying capacity. The research results are of great importance to provide scientific basis for land resource development, population distribution, food security, and land resource sustainable development in China’s major grain-producing areas in the future.
The remainder of this paper is structured as follows. Section 2 describes the study areas and data source. Section 3 describes the methodology. The land resource carrying capacity model is used to calculate the evaluation value of LRCC based the human–grain relationship. The land resource carrying capacity index model is used to explore the relationship between the actual population and the theoretical population sustained in the study areas. Moreover, the land resource limitation model is used to evaluate the LRLD of land resource on population aggregation. Section 4 discusses the empirical results of the models. Section 5 presents the regulatory strategies for different regions to improve the LRCC level. Section 6 presents the discussion and conclusions of this study.
2. Study Areas and Data Source
2.1. Study Areas
The study areas in this paper are China’s major grain-producing areas that are defined by the 2001 reform of the grain circulation system as 13 provinces (autonomous regions), viz., Liaoning, Jilin, Heilongjiang, Inner Mongolia, Shandong, Hebei, Henan, Jiangsu, Anhui, Jiangxi, Hubei, Hunan, and Sichuan [29,30] (Figure 1). Geographically, the study areas are divided into four regions: Northeast China (Liaoning, Jilin, and Heilongjiang), North China (Shandong, Hebei, and Henan), middle and lower reaches of the Yangtze River (Jiangsu, Anhui, Jiangxi, Hubei, and Hunan), and other regions (Inner Mongolia Autonomous Region and Sichuan) [31].
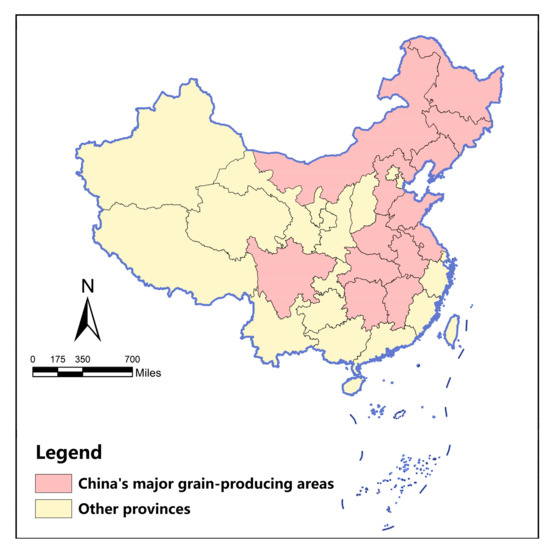
Figure 1.
The location of 13 provinces of China’s major grain-producing areas (the map of China in the figure was produced under the supervision of the Ministry of Natural Resources of People’s Republic of China, drawing number: GS (2019) No.1822).
According to the statistical bulletin of the provinces in 2019 with respect to national economic and social developments, the total area of the study areas is approximately 3.78 million km2, comprising 39.33% of the total area of the country. In 2021, the grain-sown area hit 88,569,100 ha, with 75.29% being the total grain-sown area, and the total grain output was 536,025,400 tons, accounting for 78.50% of the total grain output of the country. In topography, these areas are dominated by plains or low hills with warm and humid climates and fertile soil that is suitable for growing grains [32].
2.2. Data Source
Data in this research contain statistical data and data on geographic information. The statistical data regarding grain output, land area, arable land area, and the total population of the 13 provinces in China’s major grain-producing areas are from 1980 to 2020. These data mainly come from the statistical yearbook of each province in 1980 to 2020, which can be obtained from http://www.chinayearbook.com/ (accessed on 17 August 2022), as well as the official website of National Bureau of Statistics of China, http://www.stats.gov.cn/tjsj/ndsj/ (accessed on 12 September 2022). As for the data on geographic information used in this research, the data are mainly obtained from https://www.resdc.cn/ (accessed on 17 July 2022).
3. Methodology
3.1. Land Resource Carrying Capacity Model
The land resource carrying capacity integrally reflects the relationship between land, food, and population in a region. By measuring the size of the population, whether regional food productivity can sustain a certain level of food consumption can be determined [26,33] and evaluated by a land resource carrying capacity model. The computational formula is described as follows.
LRCC = LP/FCpc
In Formula (1), LRCC denotes the land resource carrying capacity based on the human–grain relationship (unit: person); LP denotes land productivity and is represented by grain output (unit: kg); FCpc indicates the food consumption per capita, namely, 400 kg/person/year as the per capita nutritional security consumption standard according to the international common standard [34].
3.2. Land Resource Carrying Capacity Index Model
To analyze the relationship between the real population size and the regional LRCC, a land resource carrying capacity index model was employed to explore the relation between the actual population and the theoretical population sustained in the major grain-producing areas [29] in a bid to measure the LRCC in these areas. The formula is as follows.
LRCCI = Pa/LRCC
In Formula (2), LRCCI denotes the land resource carrying capacity index; Pa is the real population size (unit: person); and LRCC means the land resource carrying capacity (unit: person). By referring to the existing literature [35], this paper classifies the LRCC in different regions into three categories and six carrying states of land resources according to LRCCI (Table 1).

Table 1.
Type of LRCC based on LRCCI.
According to Table 1, if a region has a grain surplus, then LRCCI is less than or equal to 0.875, and the regional per capita share of grain is greater than or equal to 457 kg/person. A grain surplus indicates that the gross grain output in the region is greater than the total grain consumption of the population, with ample grain yields in the region. The grain surplus can be subdivided into great surplus and surplus. An LRCCI within a range of 0.875 to 1.125 shows that the gross grain output and the total grain consumption of the population in the region are balanced; that is, they are in a state of human–grain balance. In this state, the per capita share of grain is within the range of 356 to 400 kg/person. The human–grain balance can be subdivided into two states, slight surplus and almost overload. An LRCCI greater than 1.125 indicates that the gross grain output is less than the total grain consumption of the population in a region, and the per capita share of grain is less than 356 kg/person, which denotes a population overload, and food shortage is rather serious in this state. Population overload can be further divided into overload and serious overload.
3.3. Land Resource Limitation Model
The land resource limitation degree refers to the limitation degree of land resources on population aggregation, size, and distribution patterns. It can clarify the features and rules of population distributions from the perspective of land resources [3]. Based on the provincial level of China’s major grain-producing areas, a land resource limitation model is combined with the land resource carrying capacity index model to facilitate the analysis of the limitation degree of land resources on population aggregation in 13 provinces and the clarification of the population distribution of China’s major grain-producing areas based on land resources. The calculation formula is as follows.
LRLD = Po/Pa × 100
In Formula (3), LRLD represents land resource limitation degree; Po is the number of overloaded populations relative to the land resources in each province; Pa denotes the real population of each province; the larger the LRLD, the stronger the limitation of land resources on population aggregation in that province.
According to the definitions of the three above models, the land resource carrying capacity model can reflect the population that the grain-production ability in the study areas can support under the current grain consumption level. The land resource carrying capacity index model can reflect a proportional relationship between the actual population and the theoretical carrying population under the current human–grain relationship level. The land resource limitation model can reflect the relationships among regional land, food, and population and can reflect the limitation degree of land resources relative to population aggregation. According to the econometric analysis results of the above models, we can explore the regional LRCC based on the human–grain relationship and find out which aspect of land, food, and population should be used to improve the regional LRCC. That is to say that the results of the models can directly show which perspective, such as land use, food production, and population mobility, should be focused upon in implementing control countermeasures to reduce the restriction of land resources on population aggregation, based on the consideration of the human–grain relationship. The results of models can lay a theoretical foundation and provide scientific basis for proposing regulatory strategies to improve the level of LRCC in the study areas.
4. Results
4.1. Land Resources Use Status of China’s Major Grain-Producing Areas
Table 2 describes the land resources use status of 13 provinces of China’s major grain-producing provinces in 1980 and 2020, including land area per capita, arable land area per capita, and grain yield per unit of arable land.
Table 2.
Land resources use status of China’s major grain-producing areas in 1980 and 2020.
Table 2 reveals that the land area per capita in China’s main grain-producing areas rose by 0.14 ha/person from 1980 to 2020. Among the 13 provinces, only Heilongjiang and Jilin experienced an increase in land area per capita, whereas the other provinces had declining land area per capita. This implies that most of the 13 provinces were experiencing population growth, leads Heilongjiang experiencing the greatest increase (0.85 ha/person) and Inner Mongolia experiencing the greatest decrease (0.77 ha/person) of land area per capita. In terms of the arable land area per capita, the major grain-producing areas witnessed an increase of 0.28 mu/person in general. Among the 13 provinces, 6 provinces (Heilongjiang, Jilin, Liaoning, Inner Mongolia, Hubei, and Sichuan) had an upward trend, whereas 7 provinces—Hebei, Henan, Shandong, Jiangxi, Jiangsu, Hunan, and Anhui—showed a downtrend, with Heilongjiang experiencing the largest increase (4.03 mu/person) and Jiangsu experiencing the largest drop (0.95 mu/person). With regard to the grain yield per unit of arable land, the major grain-producing areas experienced an increase of 3.11 tons/ha. Among the 13 provinces, only Hunan and Sichuan showed a downtrend, while the rest showed an increase compared with 1980, with Henan experiencing the greatest growth at 5.36 tons/ha.
In 2020, the land area per capita, arable land area per capita, and grain yield per unit of arable land in major grain-producing areas were 0.59 hectares/person, 2.18 mu/person, and 6.30 tons/hectare, respectively. By region, the land area per capita of Inner Mongolia was the largest at 2.77 hectares/person, which is above the average of the major grain-producing areas. In addition to Inner Mongolia, the land area per capita of Heilongjiang and Jilin was also above average, while that of the remaining 10 provinces was below average, with Jiangsu Province being the lowest at 0.13 hectares/person. The arable land area per capita of the major grain-producing areas averaged 2.18 mu/person. The arable land area per capita of Heilongjiang, Jilin, and Inner Mongolia was above average, and that of the remaining provinces was below average, with Heilongjiang having the largest arable land area per capita of 8.13 mu/person and Jiangxi Province having the smallest at 0.75 mu/person. In terms of grain yield per unit of arable land, the average of the major grain-producing areas was 6.30 tons/ha, with Hebei, Henan, Shandong, Jiangxi, Jiangsu, Hunan, and Anhui above the average and the rest below the average. Henan Province had the highest grain yield per unit of arable land at 8.37 tons/ha and Inner Mongolia had the lowest at 3.95 tons/ha.
4.2. Spatial–Temporal Patterns of LRCC of China’s Major Grain-Producing Areas
4.2.1. Temporal Evolution Features of Land Resource Carrying Capacity
Table 3 displays the LRCC and LRCCI of the 13 provinces in China’s major grain-producing areas in 1980, 1985, 1990, 1995, 2000, 2005, 2010, 2015, and 2020. As Table 3 represents, from 1980 to 2020, the average value of the LRCC in China’s major grain-producing areas showed an upward trend, from 42 million people in 1980 to 99.2 million people in 2020. In terms of regions, the land resource carrying capacity in all provinces increased to a certain extent, among which Heilongjiang Province had the largest increase, from 33.66 million people in 1980 to 188.5 million people in 2020, which is an increase of 15.484 million people. Hunan Province has the lowest increase, from 66.4 million people in 1980 to 75.4 million people in 2020, with an increase of only 9 million people. At the same time, the LRCC of each province changed unsteadily from 1980 to 2020, with a large increase and decrease; moreover, from 2015 to 2020, the LRCC of Heilongjiang, Jilin, Jiangxi, Hubei, and Hunan provinces decreased to a certain extent.
Table 3.
LRCC and LRCCI of 13 provinces in China’s major grain-producing areas (unit: 100 million people, %).
Generally, the average value of LRCCI of the major grain-producing areas in China showed a downward trend from 1980 to 1995, an upward trend from 1995 to 2000, and a downward trend from 2000 to 2020. From the perspective of the subregions, from 1980 to 2020, with the exception of Hunan Province, the LRCCI increased from 0.796 in 1980 to 0.968 in 2020, showing an upward trend, and the land resource carrying capacity index of the other 12 provinces showed a downward trend as a whole, indicating that the carrying state of land resources in the major grain-producing areas of China gradually improved and the grain production level gradually improved. Specifically, the LRCCI in Inner Mongolia decreased the most, from 1.893 in 1980 to 0.262 in 2020, a decrease of 1.631, indicating that the human–grain relationship in Inner Mongolia improved significantly in recent years. Jiangxi has the lowest decline, from 1.048 in 1980 to 1.001 in 2020, which is a decrease of 0.047, and there is still a risk of food shortage in Jiangxi Province. In addition, the LRCCI in Jiangsu, Sichuan, and other provinces did not significantly improve from 1980 to 2020.
As for the carrying state of land resources, from 1980 to 2020, the number of provinces with a population overload gradually decreased to zero. In 1980, there were seven provinces in a state of population overload, and in 1985, this decreased to four provinces. In 2000, only Liaoning had population overload. Since 2005, no province has been in a state of population overload. From 1980 to 1990, the number of provinces with human–grain balance and grain surplus increased simultaneously. The number of provinces with human–grain balance increased from five in 1980 to nine in 1990, and the number of provinces in the state of grain surplus increased from one in 1980 to three in 1990. In 1995, 2000, 2005, 2010, 2015, and 2020, there were eight, nine, nine, eight, three, and four provinces in the state of human–grain balance, respectively, accounting for 61.54%, 69.23%, 69.23%, 61.54%, 23.07%, and 30.77%. In the above six years, there were three, three, four, five, ten, and nine provinces in the state of grain surplus, respectively, accounting for 23.07%, 23.07%, 30.77%, 38.46%, 76.92%, and 69.23%. Although the number of provinces with grain surplus is increasing as a whole, the development of LRCCI in each province is unstable, and there is a large gap in the grain supply ability. If this is not improved, some provinces may fall into a state of population overload again.
From a larger-scale, regional angle, the major grain-producing areas of China fall into four regions: Northeast China, North China, middle and lower reaches of the Yangtze River, and other regions. Figure 2 illustrates the features of LRCC and LRCCI of the four regions in the above-mentioned years.

Figure 2.
LRCC and LRCCI of the four regions of China’s major grain-producing areas.
As Figure 2 shows, the average value of the LRCC of the major grain-producing areas from 1980 to 2020 was in an overall uptrend, which was up nearly from 42 million people in 1980 to 99.2 million people in 2020. On the whole, the LRCCI showed a downward trend from 1.201 in 1980 to 0.699 in 2020, and the carrying state of land resources changed from the population overload state to the human–grain balance state, indicating that the carrying ability of land resources in major grain-producing areas continuously improved and the level of grain production continuously improved as well. By region, the four regions varied considerably with respect to the average value of LRCC. The middle and lower reaches of the Yangtze River topped the list of the four regions by LRCC from 1980 to 2015, but North China overtook it in first place in 2020, indicating a muted growth of the LRCC of the middle and lower reaches of the Yangtze River and a steady increase in North China’s grain yield. At the same time, the LRCC of Northeast China took second place in 1980–2020, increasing by 257.18% and demonstrating a boom in the grain production of Northeast China over the years. Sichuan had a rather low grain yield, with its LRCC at a lower and fluctuant level. Figure 3 also reveals a significant decline in the growth of the LRCCI of the four regions in the period of 2015–2020.
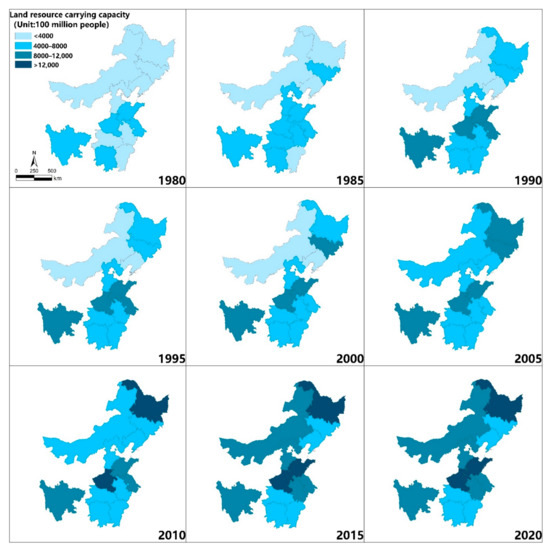
Figure 3.
Spatial pattern of LRCC of China’s major grain-producing areas.
4.2.2. Spatial Evolution Features of Land Resource Carrying Capacity
Figure 3 displays the spatial distribution of the LRCC in the 13 provinces of China’s major grain-producing areas in 1980, 1985, 1990, 1995, 2000, 2005, 2010, 2015, and 2020.
Figure 4 displays the carrying state of land resources in the 13 provinces of China’s major grain-producing areas in 1980, 1985, 1990, 1995, 2000, 2005, 2010, 2015, and 2020.The carrying state of land resources was reflected by the LRCCI. Additionally, the classification standard can be found in Table 1.

Figure 4.
Spatial pattern of carrying state of land resources of China’s major grain-producing areas.
As shown in Figure 3 and Figure 4, the LRCC and the carrying state of land resources of the 13 provinces varied from province to province. As for the LRCC, it shows a year-by-year increasing trend on the whole. The LRCC in Northeast China and some provinces in the middle and lower reaches of the Yangtze River significantly improved. At all levels, the overall gap of the LRCCI of each province is narrowing, but in the later 20 years, the gap widened, with the difference between the highest (Jiangxi Province) and the lowest (Heilongjiang Province) in 2020 being 0.833. The spatial evolution characteristics of LRCC and LRCCI demonstrate that an imbalanced development condition remains in the LRCC in major grain-producing areas.
As for the LRCCI, it can be explained by combining the land resource carrying capacity type. In terms of the spatial distribution of LRCCI, from 1980 to 1990, areas with population overload were dominated by North China, Sichuan, and Inner Mongolia; from 1990 to 2000, the population overload areas were mainly in Liaoning. As the human–grain relationship improved, from 2010 to 2020, the LRCCI was low in central and northern China but high in southern China, and in 2020, most provinces involved had a grain surplus, mainly Northeast China, North China, and Inner Mongolia. Northeast China is vast in territory and rich in resources, but it is scarcely populated, and its abundant black soil offers a great deal of arable land, thus ensuring its grain yield. Three provinces in North China are located in the North China Plain deposited by the Yellow River, Haihe River, and Huaihe River, and they are endowed with fertile soil; thus, they are suitable for large-scale grain cultivation. Inner Mongolia boasts vast stretches of arable land, lies in the Hetao region, and is ideal for growing plant corn, wheat, and other grain crops.
4.3. Land Resource Limitation Degree Based on Population Aggregation
Table 4 shows the statistics distribution of the LRLD, and Figure 5 displays the spatial evolution features of the LRLD of the 13 provinces of China’s major grain-producing areas in 1980, 1985, 1990, 1995, 2000, 2005, 2010, 2015, and 2020.
Table 4.
Statistics of the LRLD of China’s major grain-producing areas in 1980, 1990, 2000, 2010, and 2020.
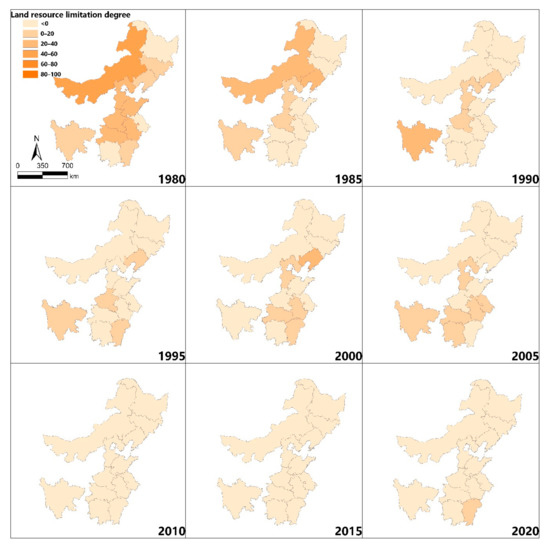
Figure 5.
Spatial pattern of the LRLD of China’s major grain-producing areas.
As Table 4 and Figure 5 suggest, the number of provinces with an LRLD between 20–40 in 2000 differed largely from that in 1980, and the number of provinces with an LRLD between 0–20 in 2020 differed largely from that in 2000. The statistics of the LRLD in the 13 provinces show that the number of provinces with a negative LRLD increased. The LRLD was negative in most of the 13 provinces between 2000 and 2020, with its absolute value increasing, indicating that the land resources in the major grain-producing areas of China set small limits on population aggregation, but it shows great potential for growing LRCC. According to Figure 5, the LRLD of Jiangxi Province remained within the range of 0–20 in 2020, and it was 0.13. There was only one province with a positive LRLD in 2020, which indicates that as science and technology advance and agricultural modernization progresses, the LRLD of China’s major grain-producing areas decreases. Land resources are not the limiting factor of population aggregation.
5. Regulatory Strategies
Based on the spatial–temporal evolution characteristics of the LRCC, LRCCI, and LRLD in the 13 provinces of China’s major grain-producing areas from 1980 to 2020, this paper provides the following regulatory strategies for the LRCC improvement in China’s major grain-producing areas.
- (1)
- Enhancing technological innovations in grain production. As the results show, Liaoning, Jilin, Heilongjiang, Inner Mongolia, Hebei, Henan, Shandong, and Anhui have relatively small LRCCI values, with rather stable grain production levels. Hence, efforts are required in order to fully utilize the resource advantages of these regions, increase investments in agricultural production science and technology, and cultivate high-quality seeds with high yields in addition to nonpolluting fertilizers. Stakeholders may have more new crop varieties planted, reduce farmland pollution, and enhance the quality of arable land for sustainable grain surpluses.
- (2)
- Introducing social capital for the orderly transfer of land. Provinces such as Jiangsu, Hubei, Hunan, and Sichuan have high but unstable LRCCI values, with their carrying state of land resources in a slight surplus. Since societies may not expand farmland in the absence of significant environmental risks, boosting productivity is the main method for increasing food production [36], and social capital plays a vital role in increasing agricultural productivity [37]. Hence, the government is expected to introduce proper social capital to promote the orderly transfer of arable land management rights, improve the intensive utilization of arable land, and develop agriculture on a moderate scale using multiple management models and cooperative management [38]. These efforts help raise grain yields and achieve grain surplus in these provinces.
- (3)
- Formulating grain-producing subsidies in line with local conditions. The LRCCI of Jiangxi Province is between 1.0 and 1.125 from 1980 to 2020, and it is approaching the overload state with an uptrend value; its land resources limit population aggregation to some degree, thus posing a threat to the LRCC. Such circumstances necessitate more food subsidies. Concretely, the government may set competitive grain purchase prices, motivate farmers to grow grains, and train new professional farmers. The government can also cut grain production costs, ban the extensive use of arable land for urbanization purposes, and minimize derelict arable land, with a vision to balance arable land protection and food production.
- (4)
- Stepping up efforts to develop functional zones for grain production and protection zones for major grain product production and optimizing the layout of grain-producing areas. As the LRCC of major grain-producing areas requires balances and developments, improving the comprehensive agricultural production capacity in South China and stabilizing grain production in North China are crucial. To this end, further attempts are needed to develop functional zones for grain production and protection zones for major grain product production, to facilitate the “North-to-South Grain Transfer”, and to maintain the balance of grain between southern and northern China.
6. Conclusions and Discussion
6.1. Conclusions
In this paper, 13 provinces in major grain-producing areas are taken as the study areas, and the spatial–temporal evolution pattern of land resources carrying capacities are examined based on the land resource carrying capacity model and the land resource carrying capacity index model. The land resource limitation degree state relative to regional population aggregation is explored by using the land resource carrying capacity limitation model. The results are as follows.
- (1)
- On a temporal scale, from 1980 to 2020, the LRCC showed an uptrend, changing from 42 million people in 1980 to 99.2 million in 2020. In contrast, the LRCCI values took on the opposite trend and dropped from 1.201 in 1980 to 0.699 in 2020. The opposite evolution trend between LRCC and LRCCI indicated the strengthened the grain production ability of the study areas. As for the LRLD, in 1980, there were ten provinces with LRLD that are positive, which shows a high limitation degree of land resource relative to population aggregation. However, in 2020, there was only one province that still had a positive LRLD. This evolution feature reflects the great alleviation of the limitation of land resources on population aggregation. Thus, from a temporal perspective, the human–grain relationship in China’s major grain-producing areas indicates an ongoing improvement.
- (2)
- On the spatial scale, the LRCC in Northeast China and some provinces in the middle and lower reaches of the Yangtze River significantly improved. Although the overall gap of each province is narrowing as a whole, the gap widened in the later 20 years. In 2020, North China, middle and lower reaches of the Yangtze River, Northeast China, and other regions were ranked by LRCC from the greatest to lowest value. In addition, provinces at a grain surplus level of the carrying state of land resources, significantly increased during 1980–2020, but the growth of LRCC of the four major regions significantly slowed during 2015–2020, and the gap of LRCCI between the 13 provinces was large. The spatial evolution characteristics of the LRCC demonstrate that an imbalance development and insufficient manner condition remains in the LRCC in the major grain-producing areas of China.
- (3)
- As for the LRLD, most provinces of China’s grain-producing areas had negative values, which indicated that there was no limitation for land resources on population aggregation in most provinces. In fact, the LRLD decreased from 1980 to 2020 in the 13 provinces. In 1980, there were ten provinces with a positive land resource limitation degree; five of them had a 20–40 land resource limitation degree value and four of them had a 0–20 land resource limitation degree value. In contrast, in 2020, there was only one province with a positive LRLD value. This indicates that the land resources of the major grain-producing areas set rather small limits on the population’s size, with great potentials for LRCC to improve.
6.2. Discussion
6.2.1. Contribution
The results of this paper show that the 13 provinces in the major grain-producing areas of China varied with LRCC. On the whole, China is witnessing a growing LRCC and improving human–grain relationships. This coincides with existing research outcomes [21,28,29]. In comparison to the current literature [17,39,40], this paper integrates the land resource carrying capacity model, the land resource carrying capacity index model, and the land resource limitation model together to further explore the LRCC status of major grain-producing areas in China, rather than evaluating the LRCC level only. Based on the empirical results, some meaningful findings of this research are that the carrying ability of land resources for the population in most provinces of China’s major grain-producing areas increased during the last 40 years, and most provinces have the potential to carry a greater size of the population based on the current grain-producing ability. In addition, most provinces show lower limitations for land resources on population aggregation. This paper also finds an unbalance and insufficiency of the LRCC of China’s major grain-producing areas. Therefore, regulatory strategies are proposed to contribute to ensuring national food security and human-grain balance.
6.2.2. Limitation and Future Perspectives
However, this paper only analyzes the LRCC from the perspective of human–grain relationships without the consideration of the grain trade between provinces. In fact, the provinces in China’s major grain-producing areas not only shoulder the responsibility to offer grain product for itself, but also need to provide grain products for other provinces that are not defined as the major grain-producing areas. Thus, the grain trade between provinces should be further considered to improve the calculation accuracy of LRCC for the provinces in China’s major grain-producing areas. In addition, the LRCC has rich connotations, and it relates closely to socioeconomic growth and ecosystems. Hence, future research should study the connotation and extension of LRCC from a wider perspective and focus on how other factors may affect the carrying capacity of land resources. Finally, this paper mainly explored the spatial–temporal evolution pattern of LRCC in China’s major grain-producing areas on the provincial scale. In fact, more accurate and scientific research results should be reflected in a smaller research scale, such as the county scale. Thus, a smaller research scale on the spatial–temporal evolution pattern of LRCC can provide another future research opportunity.
Author Contributions
J.G. is responsible for conceptualization, formal analyses, writing—original draft preparation, and writing—review and editing. R.Z. is responsible for writing—review and editing and methodology. G.S. is responsible for writing—review and editing. Y.Z. (Yuxin Zhan) is responsible for investigation. Y.Z. (Yaohui Zhu) is responsible for visualization. All authors have read and agreed to the published version of the manuscript.
Funding
This research was funded by the Ministry of Education Humanities and Social Sciences Foundation Youth Project of China, Grant Number: 19YJC630037; the National Natural Science Foundation of China, Grant Number: 42101254, 41971247; Fundamental Research Funds for the Central Universities, Grant Number: N2114002.
Institutional Review Board Statement
Not applicable.
Informed Consent Statement
Not applicable.
Data Availability Statement
The data presented in this study are available in the article.
Conflicts of Interest
The authors declare no conflict of interest.
References
- Lane, M. The carrying capacity imperative: Assessing regional carrying capacity methodologies for sustainable land-use planning. Land Use Policy 2010, 27, 1038–1045. [Google Scholar] [CrossRef]
- Kessler, J.J. Usefulness of the human carrying capacity concept in assessing ecological sustainability of land-use in semi-arid regions. Agric. Ecosyst. Environ. 1994, 48, 273–284. [Google Scholar] [CrossRef]
- Gao, J.; Zhao, R.; Zhan, Y. Land comprehensive carrying capacity of major grain-producing areas in Northeast China: Spatial–temporal evolution, obstacle factors and regulatory policies. Sustainability 2022, 14, 11322. [Google Scholar] [CrossRef]
- Hou, M.; Zhong, S.; Xi, Z.; Yao, S. Does large-scale ecological restoration threaten food security in China? A moderated mediation model. Ecol. Indic. 2022, 143, 109372. [Google Scholar] [CrossRef]
- Liu, X.; Xu, Y.; Engel, B.A.; Sun, S.; Zhao, X.; Wu, P.; Wang, Y. The impact of urbanization and aging on food security in developing countries: The view from Northwest China. J. Clean. Prod. 2021, 292, 126067. [Google Scholar] [CrossRef]
- Li, F.; Qin, Z.; Liu, X.; Chen, Z.; Wei, X.; Zhang, Q.; Lei, M. Grain production space reconstruction and land system function tradeoffs in China. Geogr. Sustain. 2021, 2, 22–30. [Google Scholar] [CrossRef]
- Wang, L.; Zheng, W.; Tang, L.; Zhang, S.; Liu, Y.; Ke, X. Spatial optimization of urban land and cropland based on land production capacity to balance cropland protection and ecological conservation. J. Environ. Manag. 2021, 285, 112054. [Google Scholar] [CrossRef]
- Yang, D.; Zhang, P.; Jiang, L.; Zhang, Y.; Liu, Z.; Rong, T. Spatial change and scale dependence of built-up land expansion and landscape pattern evolution—Case study of affected area of the lower Yellow River. Ecol. Indic. 2022, 141, 109123. [Google Scholar] [CrossRef]
- Long, H.; Ge, D.; Zhang, Y.; Tu, S.; Qu, Y.; Ma, L. Changing man-land interrelations in China’s farming area under urbanization and its implications for food security. J. Environ. Manag. 2018, 209, 440–451. [Google Scholar] [CrossRef]
- Zhou, Y.; Li, X.; Liu, Y. Cultivated land protection and rational use in China. Land Use Policy 2021, 106, 105454. [Google Scholar] [CrossRef]
- Lyu, X.; Wang, Y.; Niu, S.; Peng, W. Spatio-temporal pattern and influence mechanism of cultivated land system resilience: Case from China. Land 2021, 11, 11. [Google Scholar] [CrossRef]
- Xie, X.-X.; Zhang, A.-L.; Cai, Y.-Y.; Zhang, Y. How government-led land consolidation efforts achieve grain production stability? An empirical analysis in Hubei Province, China. Land Use Policy 2020, 97, 104756. [Google Scholar] [CrossRef]
- Wei, Y.; Huang, C.; Li, J.; Xie, L. An evaluation model for urban carrying capacity: A case study of China’s mega-cities. Habitat Int. 2016, 53, 87–96. [Google Scholar] [CrossRef]
- Zhou, W.; Elshkaki, A.; Zhong, S.; Shen, L. Study on relative carrying capacity of land resources and its zoning in 31 provinces of China. Sustainability 2021, 13, 1459. [Google Scholar] [CrossRef]
- Zhao, L.L.; Li, J.Y.; Shao, Q.L. Evaluation of urban comprehensive carrying capacity: Case study of the Beijing-Tianjin-Hebei urban agglomeration. Environ. Sci. Pollut. Res. 2020, 27, 19774–19782. [Google Scholar] [CrossRef]
- Ma, P.; Ye, G.; Peng, X.; Liu, J.; Qi, J.; Jia, S. Development of an index system for evaluation of ecological carrying capacity of marine ecosystems. Ocean. Coast. Manag. 2017, 144, 23–30. [Google Scholar] [CrossRef]
- Cheng, K.; Fu, Q.; Cui, S.; Li, T.; Pei, W.; Liu, D.; Meng, J. Evaluation of the land carrying capacity of major grain-producing areas and the identification of risk factors. Nat. Hazards 2017, 86, 263–280. [Google Scholar] [CrossRef]
- Shi, Y.; Shi, S.; Wang, H. Reconsideration of the methodology for estimation of land population carrying capacity in Shanghai metropolis. Sci. Total Environ. 2019, 652, 367–381. [Google Scholar] [CrossRef]
- Xue, Q.; Yang, X.; Wu, F. A three-stage hybrid model for the regional assessment, spatial pattern analysis and source apportionment of the land resources comprehensive supporting capacity in the Yangtze River Delta urban agglomeration. Sci. Total Environ. 2020, 711, 134428. [Google Scholar] [CrossRef]
- Cui, G.; Zhang, X.; Zhang, Z.; Cao, Y.; Liu, X. Comprehensive land carrying capacities of the cities in the Shandong Peninsula blue economic zone and their spatio-temporal variations. Sustainability 2019, 11, 439. [Google Scholar] [CrossRef]
- Yu, G.H.; Sun, C.Z. Land carrying capacity spatiotemporal differentiation in the Bohai Sea coastal areas. Acta Ecol. Sin. 2015, 35, 4860–4870. [Google Scholar]
- Li, J. Evaluation of spatial-temporal variation of land comprehensive carrying capacity of Yangtze River economic zone and diagnosis of obstacle factors. East. China Econ. Manag. 2019, 33, 67–75. (In Chinese) [Google Scholar]
- Li, J.J.; Wei, Y.; Li, Y. Dynamic evaluation and simulation of land carrying capacity in a karst mountainous area—A case study of Guiyang. Arab. J. Geosci. 2022, 15, 598. [Google Scholar] [CrossRef]
- Sun, M.; Wang, J.; He, K. Analysis on the urban land resources carrying capacity during urbanization—A case study of Chinese YRD. Appl. Geogr. 2020, 116, 102170. [Google Scholar] [CrossRef]
- Zhang, F.; Zhu, F. Exploring the temporal and spatial variability of water and land resources carrying capacity based on ecological footprint: A case study of the Beijing-Tianjin-Hebei urban agglomeration, China. Curr. Res. Environ. Sustain. 2022, 4, 100135. [Google Scholar] [CrossRef]
- Luo, W.; Ren, Y.; Shen, L.; Zhu, M.; Jiang, Y.; Meng, C.; Zhang, P. An evolution perspective on the urban land carrying capacity in the urbanization era of China. Sci. Total Environ. 2020, 744, 140827. [Google Scholar] [CrossRef]
- Cao, M.; Ma, S.; Han, C. Potential productivity and human carrying capacity of an agro-ecosystem: An analysis of food production potential of China. Agric. Syst. 1995, 47, 387–414. [Google Scholar] [CrossRef]
- Cheng, X.Y.; Yang, Q.Y.; Bi, G.H. Spatial-temporal difference of land resource carrying capacity in Jiangjin District of Chongqing. Resour. Environ. Yangtze Basin 2019, 28, 2319–2330. (In Chinese) [Google Scholar]
- Wang, L.; Zhong, X.; Liu, Z.; Zhang, J.; Yu, D. Study on spatial-temporal difference of land resource carrying capacity in Guanzhong-Tianshui region based on human-food relationship. J. Anhui Agric. Univ. 2018, 45, 501–505. (In Chinese) [Google Scholar]
- Wang, Y.W.; Huang, Y. Impact of agricultural resource mismatch on agricultural eco-efficiency: As evidenced by China’s 13 main grain producing provinces. Ecol. Econ. 2022, 38, 129–137. (In Chinese) [Google Scholar]
- Zou, S.; Zhang, L.; Huang, X.; Osei, F.B.; Ou, G. Early ecological security warning of cultivated lands using RF-MLP integration model: A case study on China’s main grain-producing areas. Ecol. Indic. 2022, 141, 109059. [Google Scholar] [CrossRef]
- Liu, B.T.; Lu, P.; Liu, S.; Li, Z.Q. The spatio-temporal pattern and optimization of multifunctional cultivated land in China’s major grain producing areas. East. China Econ. Manag. 2021, 35, 92–99. (In Chinese) [Google Scholar]
- Zhang, C.; Yang, Y.Z.; Feng, Z.M.; Lang, T.T.; Liu, Y. Spatial-temporal pattern of land resource carrying capacity in countries along the belt and road based on human-food relationship. J. Nat. Resour. 2022, 37, 616–626. (In Chinese) [Google Scholar]
- Liu, Y.; Zhou, Y. Reflections on China’s food security and land use policy under rapid urbanization. Land Use Policy 2021, 109, 105699. [Google Scholar] [CrossRef]
- Pang, B.; Li, Y.Y.; Zhang, P.Y.; He, J.J. Spatial-temporal variation analysis of land resource carrying capacity in central plains economic region using multi-scale, multi-perspective vision. J. Henan Univ. (Nat. Sci.) 2017, 47, 661–670+680. (In Chinese) [Google Scholar]
- Acevedo, M.F.; Harvey, D.R.; Palis, F.G. Food security and the environment: Interdisciplinary research to increase productivity while exercising environmental conservation. Glob. Food Secur. 2018, 16, 127–132. [Google Scholar] [CrossRef]
- Kehinde, A.D.; Adeyemo, R.; Ogundeji, A.A. Does social capital improve farm productivity and food security? Evidence from cocoa-based farming households in Southwestern Nigeria. Heliyon 2021, 7, e06592. [Google Scholar] [CrossRef]
- Lyu, X.; Peng, W.; Niu, S.; Qu, Y.; Xin, Z. Evaluation of sustainable intensification of cultivated land use according to farming households’ livelihood types. Ecol. Indic. 2022, 138, 108848. [Google Scholar] [CrossRef]
- Liu, H. Comprehensive carrying capacity of the urban agglomeration in the Yangtze River Delta, China. Habitat Int. 2012, 36, 462–470. [Google Scholar] [CrossRef]
- Tsou, J.; Gao, Y.; Zhang, Y.; Genyun, S.; Ren, J.; Li, Y. Evaluating urban land carrying capacity based on the ecological sensitivity analysis: A case study in Hangzhou. Remote Sens. 2017, 9, 529. [Google Scholar] [CrossRef]


Publisher’s Note: MDPI stays neutral with regard to jurisdictional claims in published maps and institutional affiliations. |
© 2022 by the authors. Licensee MDPI, Basel, Switzerland. This article is an open access article distributed under the terms and conditions of the Creative Commons Attribution (CC BY) license (https://creativecommons.org/licenses/by/4.0/).