1. Introduction
Urban dwellers account for about 55% of the global population, and this proportion is predicted to reach nearly 70% in 2059, with urban economic productivity accounting for more than 80% of the global GDP [
1]. Land use has been an important research component for global ecological changes and sustainable social development [
2,
3,
4,
5]. As a major carrier of basic human life and daily activities, land merits accurate and timely understanding of urban land-use information, which is extremely important for tapping the inherent development potential of cities, improving urban spatial governance, and ensuring high-quality urban development [
6,
7,
8,
9].
Early urban land-use classification mapping started with field surveys and visual interpretation of remote-sensing images, which had higher classification accuracy [
10]. However, this approach required interpreters to have profound knowledge and was characterized by poor timeliness and high cost [
11]. Along with the development of remote sensing and computer technology, image-element-based and object-oriented methods have been gradually proposed, which have improved the ability to classify land-use features in remote-sensing images to a certain extent [
12,
13]. However, the heterogeneity of land-use features in remote-sensing images and the confusion of image elements usually lead to a decrease in urban land-use classification accuracy. For example, the spectral characteristics of commercial and residential areas in remote-sensing images are very similar, and it is difficult to further improve the accuracy of land-use classification while relying only on remote-sensing images [
14,
15].
In recent years, due to the gradual availability of open-source data and the diversification of data sources, many other data sources in addition to remote-sensing images have become important sources of data for urban land-use classification, including mobile phone data, Sina Weibo social media data, Twitter check-in record data, OpenStreetMap (OSM) road network data, point-of-interest (POI) data, etc. Mobile phone data can be used to indicate the social function of land use [
16]. Sina Weibo social media data can be used to estimate temporal trend patterns in land-use types [
17]. The spatio-temporal characteristics of geo-tagged tweets in Twitter can reflect dynamic population distribution characteristics and further facilitate land-use classification [
18]. OSM can be used to create a subdivision of urban land-use parcel units, and such parcel unit data can represent socio-economic functions [
19]. However, when subdividing feature units, roads of different widths and administrative levels cannot be divided directly using road centerlines, resulting in a lack of parcel unit segmentation and further reducing the characterization of land-use features within the unit [
20]. POI data can capture the spatial and temporal characteristics of human activities and provide new opportunities for classifying parcels of different uses in cities [
21]. However, users of POI data must consider its intrinsic spatial dependencies and not only information on the frequency of POI occurrence [
22].
Based on multisource Big Data, artificial intelligence algorithms can fully mine the spatial and temporal characteristics of urban land-use features to obtain richer feature information and achieve better urban land-use classification mapping [
23]. For example, Gong et al. realized basic urban land-use type mapping in China in 2018 based on the random forest classification method, medium- and high-resolution remote-sensing imagery, and spatially and temporally assisted Big Data [
24]. Zong et al. performed urban land-use classification in Lanzhou City by comparing urban classification accuracy under different feature data combinations using remote-sensing images, network data, and other data sources and selecting the optimal feature combination [
25]. Tu et al. proposed an EULUC-seg framework based on the random forest model, which used high-resolution remote-sensing images and socioeconomic data to further refine the original urban classification results [
26]. These studies have improved the accuracy of urban land-use classification to a certain extent. However, most of the sampling strategies are still single-sample and multiple-sample methods. Single-sample means that a point with certain rules or a random point in a parcel unit is selected as a model-training sample point [
27]. These methods have a higher probability of misclassification of land-use features because a single point is hardly representative of parcel type. Multiple samples are expanded from a single sample by selecting multiple points in a parcel unit as model-training sample points [
28,
29]. This can most likely reduce the accuracy of land-use classification, as incorrect sample points in a parcel may interfere with the classification results. Both approaches fail to take into account the problem of land-use confusion in a parcel unit. Hence, the classification results may not be sufficient to meet the needs of other functions, such as urban planning and environmental monitoring, due to the insufficient processing of multisource data and the continued confounding of urban land-use classification results.
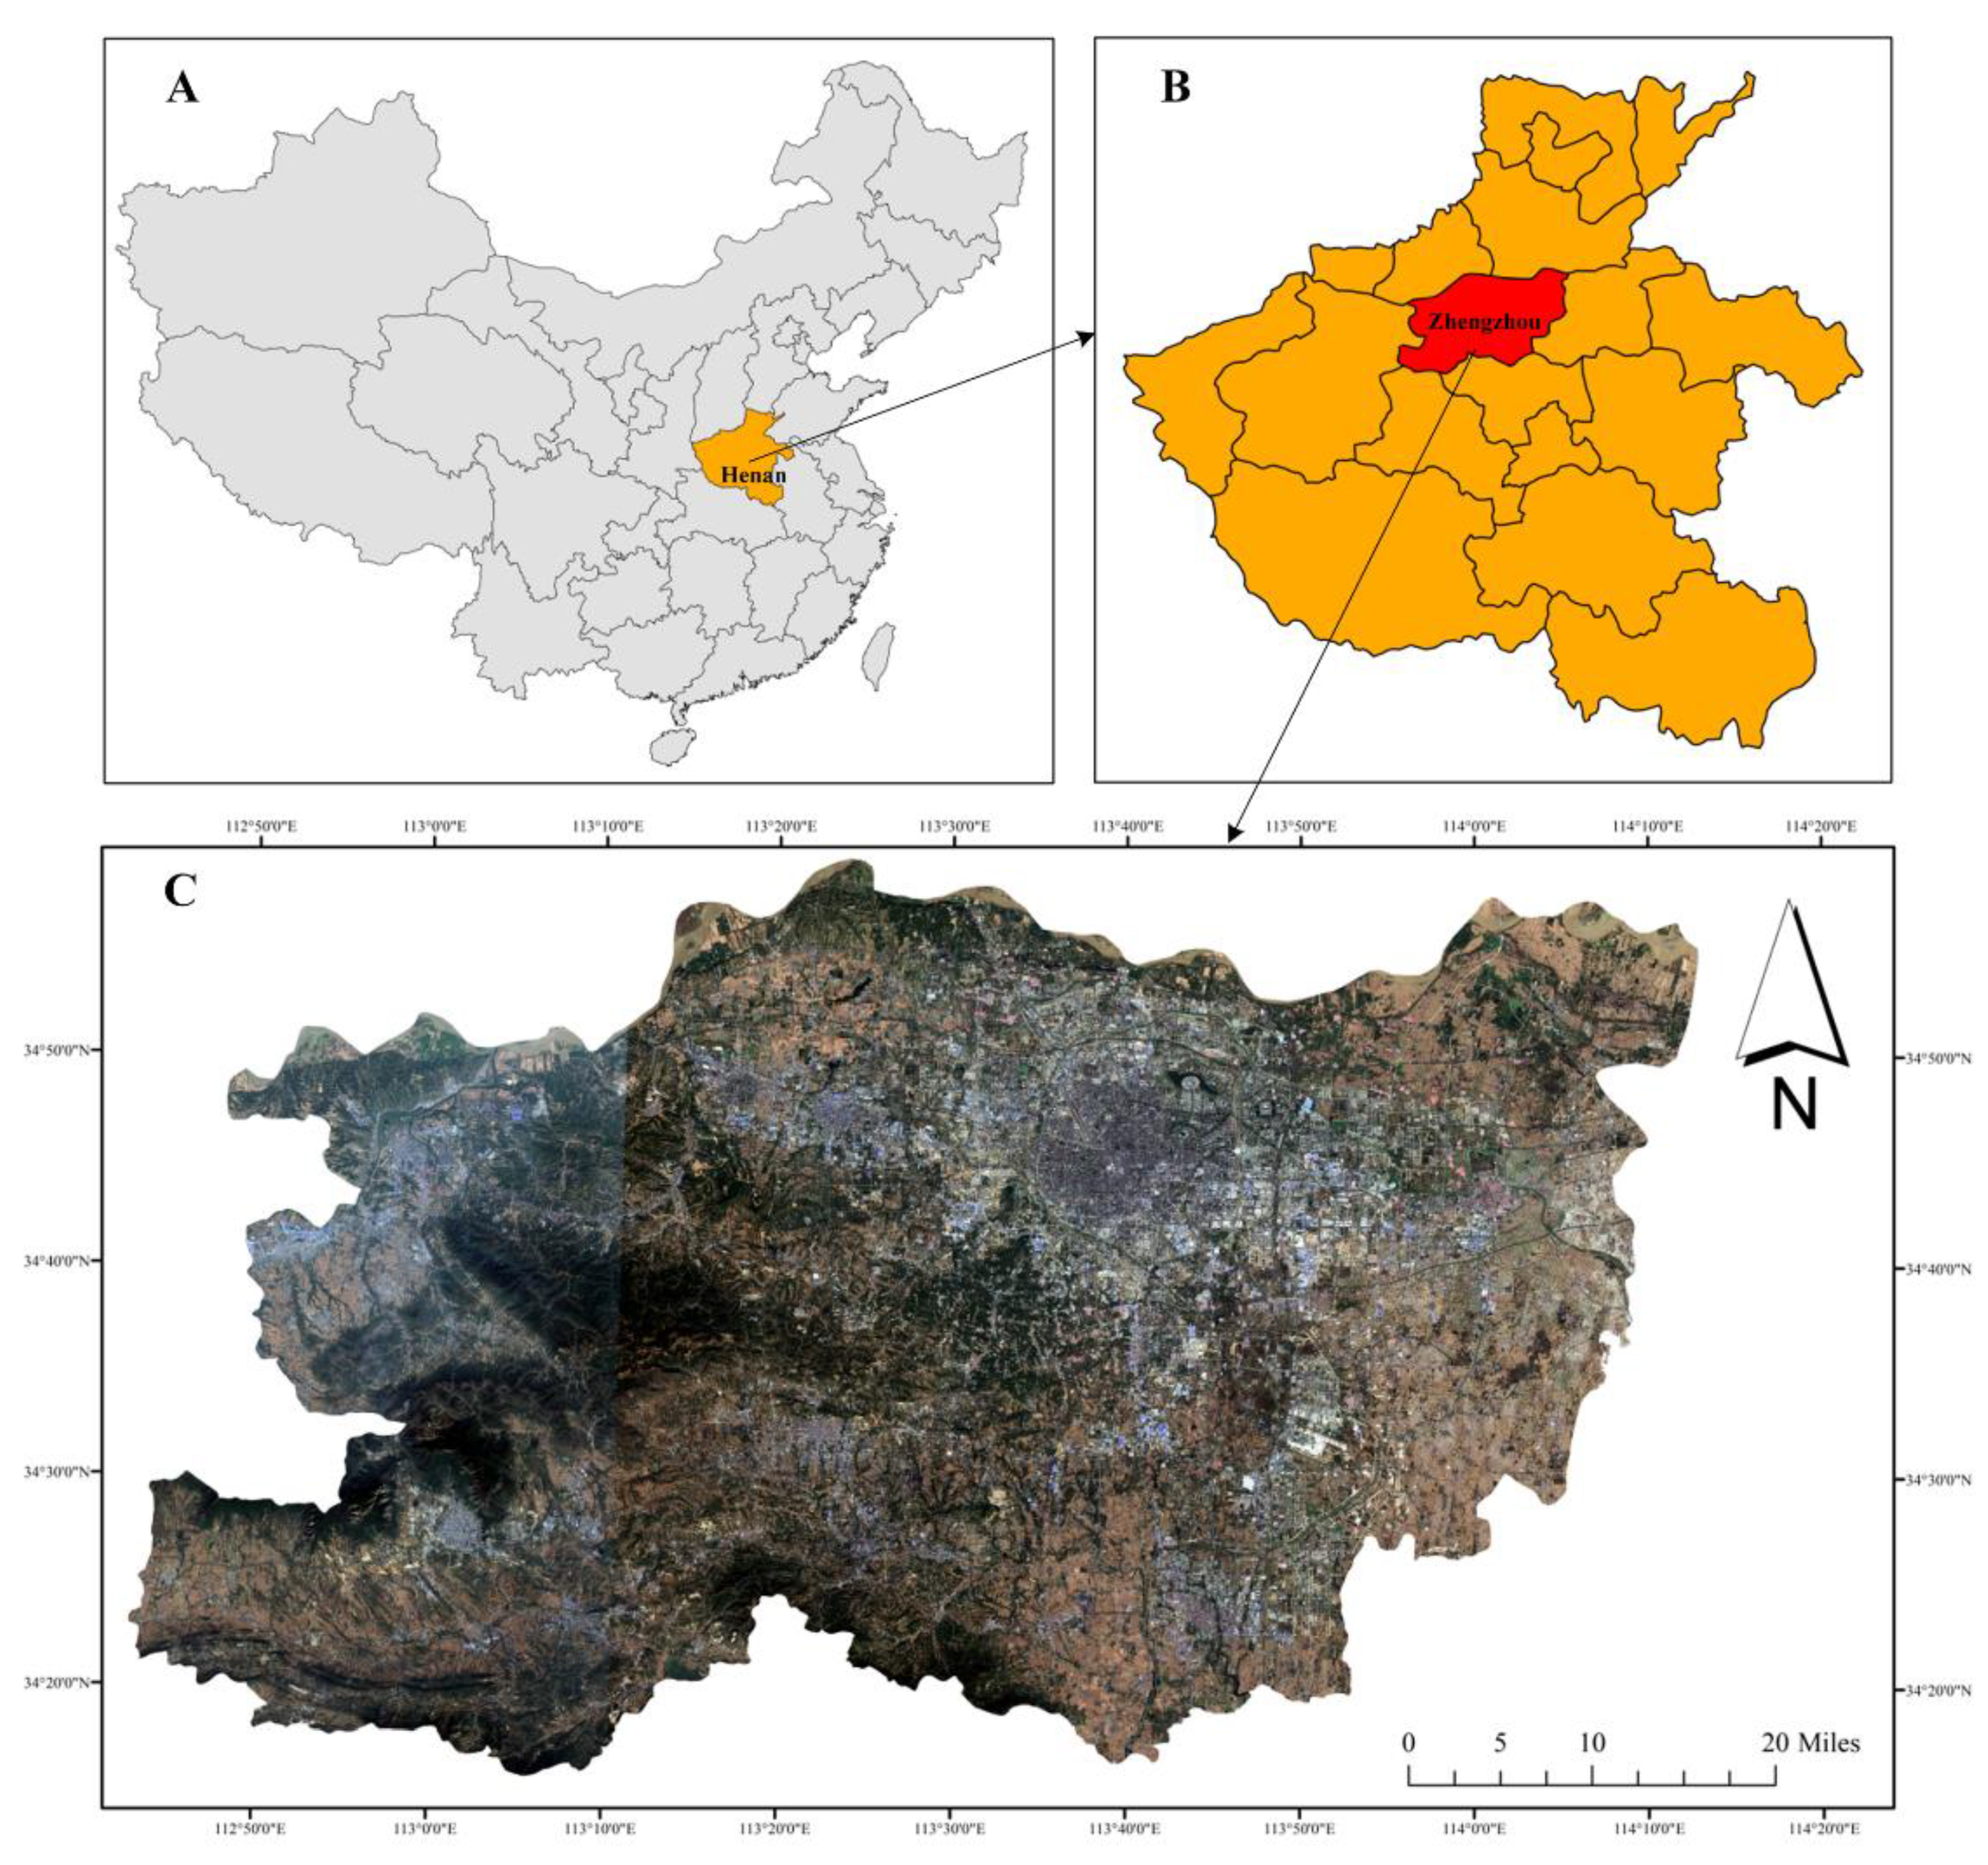
To reduce the influence of feature confusion on land-use classification and, thus, further improve land-use classification-mapping accuracy, this paper proposes an urban land-use classification method that uses a multisample “voting mechanism” while fully processing multiple sources of data. Using Zhengzhou City as the study area, road buffers are generated according to reasonable thresholds and combined with impervious surface data to generate high-quality basic land-mapping units. Multisource data, such as Sentinel-2 and POI, are preprocessed to construct a multitemporal high-dimensional feature library. To improve classification accuracy, multiple samples are collected for a single parcel as a sample dataset. A random forest model is then used for training and testing to obtain preliminary urban land-use classification results. Finally, the multisample classification results are filtered according to the “voting mechanism” to determine the types of parcels, to achieve high-precision urban land-use classification mapping, and to provide decision support for sustainable urban development governance.
3. Methodology
This paper proposed a high-precision urban land-use classification method based on multisource data and a multisample “voting mechanism” (
Figure 3). First, the OSM road network and impervious surface data [
34] were used to create basic mapping units, and the final sample plots were verified by visual interpretation and field survey. Meanwhile, the multisource data were processed to build a high-dimensional feature library. The training sample data and high-dimensional feature data were input into random forests for training and were tested using validation sample data to obtain preliminary classification results. Finally, the preliminary classification results were filtered based on a multisample “voting mechanism” to obtain the final urban land-use classification map.
3.1. Road Network Data Processing
In this study, the acquired OSM road network data were integrated into seven categories, including highways, urban expressways, primary trunk roads, secondary roads, tertiary roads, minor roads, and special types of road. The road network was generated by sampling different classes of roads to establish buffer zones according to the actual situation in the city. The specific road sampling distances are shown in
Table 3.
3.2. Feature Extraction
Previous studies have shown that, when multitemporal remote-sensing image spectral features are used, the classification effect is much better than with single-temporal remote-sensing images [
7]. Therefore, in this paper, remote-sensing images for four time periods (months) in Zhengzhou City in 2018 were selected, thus extracting a set of high-dimensional spatial and temporal features.
First, the average normalized vegetation index and the average normalized building index over the four time periods were calculated based on the bands, and two remote-sensing index features were obtained. Second, the mean, contrast, variance, synergy, correlation, dissimilarity, entropy, and second-order moments of the eight bands were calculated based on a gray-level co-occurrence matrix (GLCM) to obtain 4 × 8 × 8 texture features. Finally, the POI data were combined into five classes, and kernel density analysis and Euclidean distance analysis were performed to obtain five features. Therefore, 2 spectral features, 256 texture features, and 5 POI features were selected in this study, for a total of 263 high-dimensional spatial and temporal features, which are detailed in
Table 4.
3.2.1. Texture Features
The Sentinel-2 remote-sensing image bands of 1, 9, and 10 were removed, and bands 2, 3, 4, 5, 6, 7, 8, and 8A were resampled to unify the spatial resolution to 10 m, as shown in
Table 5.
The gray-level co-occurrence matrix method was introduced to extract attribute information, such as adjacent interval, intensity, and spatial arrangement of the gray-scale distribution of remote-sensing images in geographic space, and to improve the spatial distribution characteristics of the images.
3.2.2. Index Features
The normalized difference vegetation index (NDVI) and the normalized difference building index (NDBI) were introduced to enhance the characteristics of land-use classification within cities.
This index is normally used to monitor and reflect vegetation cover status and is the most widely used vegetation index. It quantifies vegetation by measuring the difference between the near-infrared band (strong reflection of vegetation) and the red band (absorption of vegetation) and effectively reflects the spatial distribution and temporal variation of vegetation, weakens the influence of anomalous values brought about by atmospheric and other factors, and has better spatial and temporal adaptability [
35]. The NDVI is calculated using Equation (1):
where R refers to the band reflectance in the red band, and NIR is the band reflectance in the near-infrared band. The NDVI takes on values between −1 and 1 and is generally 0 when the surface cover is bare soil or rock; when the surface is covered with vegetation, the value is positive and is positively correlated with the vegetation cover. The greater the vegetation cover, the higher the value of the NDVI.
The normalized building index is proposed to reflect information on building land use and the intensity of urbanization [
36], as shown in Equation (2):
where NIR is the band reflectance in the near-infrared band, and SWIR refers to the band reflectance in the mid-infrared band. It takes on values between −1 and 1 and is positively correlated with the likelihood of an image element being a building site.
3.2.3. POI Features
In this study, a total of 72,061 POI data points were obtained from the Baidu Map API interface. According to the EULUC classification system adopted in this paper, relevant POI data were reclassified by attribute according to the classification rules shown in
Table 6.
The processed residential communities, public services, administrative centers, and commercial centers were analyzed separately for kernel density and normalized to unify the POI data of each category to the same order of magnitude for easy analysis and comparison. A Euclidean distance analysis was performed for transportation.
3.3. Multisample Voting
A limited number of selected sample units and mixed land use within the parcels results in less room for improving land-use classification accuracy [
37]. Therefore, a research concept of multipoint-result-voting selection was designed (
Figure 4). First, by deploying multiple random points inside a basic mapping unit, the sample size was effectively increased, and the randomness of the model was reduced. After the multiple points were trained by random forests, preliminary land-use classification results were obtained. The predicted results for the multiple points were then filtered by “voting”, and the main land-use type of the site was selected as the land-use type of the basic mapping unit to further determine and refine the classification results. This approach could reduce the influence of mixed features to a certain extent, screen out erroneous samples, and improve land-use classification accuracy.
3.4. Random Forest
Random forest is an integrated learning algorithm for data mining with decision-tree-based classifiers [
38] that is now widely used for land-use classification [
39]. It is composed of a number of weak decision tree classifiers, and multiple decision trees are combined to form a forest. Each decision tree learns features and predictions independently with its own rules so that different decision trees do not have the same results. The results of all the decision-makers are aggregated, and the final classification result is decided by “voting”. The model not only can effectively and quickly process large amounts of data with high classification accuracy, but also has strong anti-noise and anti-interference ability when facing a large amount of redundant data and can effectively avoid overfitting. Studies using the random forest model for classification have proved the superiority of the model over other classification methods [
40].
From the algorithmic perspective of the model, the classification process of random forest is simple. First, a training set is generated by random sampling of the original dataset; second, individual subdecision trees are constructed. The training data are placed on the subdecision trees, and each subdecision tree produces one result; finally, the results of the subdecision trees are voted on, and the one with the highest number of votes is the final classification result.
Regarding the parameters of random forest, the decision tree classifier includes both mtry and ntree parameters, where mtry refers to the number of variables used in a single decision tree node, and ntree refers to the number of decision trees in the random forest model. Moreover, the random forest model evaluates model generalization performance by the out-of-bag (OOB) score, where OOB is the ratio of the number of misclassified samples to the total number of samples in the original data that were not sampled.
3.5. Evaluation Methodology
In this study, overall accuracy (OA), producer’s accuracy (PA), and user’s accuracy (UA) were used for accuracy evaluation.
OA is the proportion of the number of correctly classified samples to the total number of samples. The mathematical expression is as follows:
where
p is the number of categories,
represents the number of correct classifications of a particular category, and
N represents the total number of samples.
PA is the proportion of correctly classified samples to the predicted samples. Its mathematical expression is as follows:
where
represents the number of correctly classified samples in a category, and
represents the total number of samples in a category.
UA is the proportion of correctly classified samples to the real samples. Its mathematical expression is as follows:
where
represents the number of correctly classified samples in a category, and
represents the total number of real features.
5. Discussion
In this paper, the “voting” mechanism of multiple point prediction for basic mapping units was combined with a random forest model to extract land-use classification information within the city. The overall classification accuracy of Level I features was 85.07%, and the overall classification accuracy of Level II features was 74.62%, both of which were higher than the results of other methods, thus realizing fine-scale urban land-use mapping. The research results show that the use of spatial and temporal feature information from remote-sensing images and POI data, as well as the use of the multisample voting classification method for land parcels, could reduce the influence of confusion of land-use features in land parcels on the classification results to a certain extent and could achieve the purpose of promoting the fine-scale mapping of urban land-use.
5.1. Contributions of Different Features
In previous studies, Tu et al. pointed out that the features influencing Sentinel-2 were the main factors affecting classification when compared to other features [
26]. Chang et al. and Sun et al. each suggested that the spatial features of POI were beneficial for urban land-use classification [
1,
12]. To explore the contributions of different features to urban land-use classification, this paper discusses the contributions of all the features using random forests. As can be seen in
Figure 10, in the mean decrease Gini contribution regarding Level I features, the most important ones were administrative centers and commercial centers, and among the top eight most important features, POI features were clearly more important than remote-sensing features. Regarding Level II features, the first four important features were all based on POI data and had higher values, followed by remote-sensing features. In mean decrease accuracy, regarding Level I features, both remote-sensing features and POI features accounted for larger proportions, and the difference between them was smaller, but POI features were still more important. Regarding Level II features, the top three most important features were among the POI features, and the contribution of the POI features was also greater than that of remote-sensing features.
In general, POI features appeared to be more important in land-use classification. This may be because the processed POI spatial features could distinguish different land-use features well and could effectively improve land-use classification accuracy.
5.2. Shortcomings
Although the method proposed in this paper achieved a good classification effect for Zhengzhou urban land use, it still had some shortcomings. First, under the EULUC classification system, the mixing of land uses within cities imposed severe constraints on classification accuracy. It is necessary to consider adjusting urban land-use classification and cognitive rules and to consider adopting more multidimensional urban Big Data features to realize fine-scale land-use mapping in cities. Second, the selection of feature data needs to be improved. Although a high-dimensional feature library was constructed in this study, it contained some features that could not contribute to distinguishing land-use classes, leading to data redundancy and low computational efficiency. Future studies should consider streamlining feature data, increasing the diversity and uniqueness of features, and improving feature quality.
6. Conclusions
This paper took Zhengzhou City as the study area, proposed the construction of a high-dimensional feature library using multisource data, adopted a multisample voting mechanism for urban land-use information extraction on the basis of random forest classification, and achieved 85.37% accuracy for primary feature classification mapping and 78.05% accuracy for secondary feature classification mapping. Among these approaches, the superiority of the multitemporal high-dimensional feature library in extracting urban land-use information maximized the extraction of effective information and enhanced the authenticity, reliability, and applicability of the classification results. In addition, the research idea of multipoint result voting could effectively reduce the influence caused by the mixing of multiple land uses within a parcel and improved urban land-use classification accuracy. Ultimately, this paper further improved the accuracy of fine-scale urban land-use mapping by combining multisource data and a multisample voting mechanism, as well as providing a reference basis for urban managers to conduct sustainable planning.
The feature selection and methods still need to be further discussed and improved. On the one hand, data such as population data and building height can be added. Moreover, the method can be optimized and improved in future studies by combining cutting-edge technologies, such as deep learning, to improve the generalization ability in different spatial and temporal scenarios.


 ,
, 


