Article

Spatial–Temporal Evolution Patterns and Influencing Factors of China’s Urban Housing Price-to-Income Ratio

1
College of Geography and Environmental Sciences, Zhejiang Normal University, Jinhua 321004, China
2
Key Laboratory of Watershed Earth Surface Processes and Ecological Security, Zhejiang Normal University, Jinhua 321004, China
3
School of Geographical Science, Nanjing Normal University, Nanjing 210023, China
*
Author to whom correspondence should be addressed.
Land 2022, 11(12), 2224; https://doi.org/10.3390/land11122224
Submission received: 3 November 2022 / Revised: 30 November 2022 / Accepted: 5 December 2022 / Published: 7 December 2022
(This article belongs to the Special Issue Urbanization and City Development in China's Transition)

Abstract

:
The housing price-to-income ratio (PIR) is an important indicator for measuring the health of the real estate market and detecting residents’ housing affordability. Including data of 336 cities in China from 2009 to 2020 as the research unit, the PIR’s spatial and temporal evolution characteristics are explored by using the urban rank-size rule and Markov chain, and its influencing factors are explored using the random forest model. The results show the following: (1) The PIR is in a normal distribution pattern, and there was a significant positive spatial correlation, which tended to increase. (2) Spatially, the PIR shows an overall distribution trend of “high in the east and low in the west”, and a rising trend of fluctuation is shown in the average PIR. (3) The PIR’s time evolution has high stability. China’s urban PIR is primarily the stable type from 2009 to 2015 and mainly the upward transfer type from 2015 to 2020. (4) The influence of economic, demographic, social, and expected factors on the PIR decreases, among which real estate investment density, industrial structure level, residents’ consumption level, and real estate activity are the dominant factors enhancing trends and showing a complex nonlinear relationship.

1. Introduction

After the global financial crisis of 2009, China’s real estate market recovered and re-entered a rapid development track. Housing prices in large cities have risen rapidly. During 2009–2020, using the four first-tier cities of Beijing, Shanghai, Guangzhou, and Shenzhen as examples, the housing prices in the four cities rose by more than 250%, and the growth rate of urban residents’ income was lower than 185%. The urgent problem of residents’ slow income growth and rapidly rising housing prices in China’s urban development process requires resolution.
The housing price-to-income ratio (PIR) is the ratio of urban housing prices to residents’ annual household income. Compared with the price to rent ratio (PRR), debt to income ratio (DTI), housing vacancy rate (HVR), and other indicators reflecting the health of the real estate market, PIR has certain advantages. PRR needs to be combined with economic development trends, inflation expectations, and house price appreciation, and used under the conditions of economic development and currency stability. DTI is an important indicator to measure the loan capacity, but this indicator must be further distinguished by housing loan values. HVR is an important indicator of real estate market bubbles, but there is no unified standard and no reliable data source for this indicator. PIR is an important indicator for measuring urbanites’ housing affordability and a common indicator for judging whether the urban housing price level lies within a reasonable range. This reflects the relationship between urban household income and housing expenditure [1,2,3]. By analyzing the PIR, we can reveal the evolution of urban housing affordability, explore the rationality of urban housing price levels, and expand the research on the related fields of urban housing prices.
With Europe and the United States’ relatively early urbanization process, their housing markets are more mature, and extensive research on housing price levels and affordability has been conducted by foreign scholars there. Weicher first used the concept of PIR in 1977, using the ratio of the median sales price per house to the median annual household income, to calculate housing affordability in the United States during 1949–1975 [4]. Through the use of economic theories and geographic information system spatial analysis, foreign scholars’ research on the PIR has transitioned from qualitative to quantitative analysis, producing fruitful theoretical and empirical results. Their results mainly focus on determining the concept and connotation of the PIR model construction as well as its measurement [5,6], regional differences, and influencing factors [7,8]. Gan differentiated the concepts of purchase, repayment, and income affordability, and the overall distribution of household income and housing prices was used to construct a housing affordability index [6]. Costello considered Australia’s state capital cities as research objects, embedding the dynamic present value model into the vector autoregression model to analyze the degree of residential price spillover between cities [9]. Hu analyzed bubbling in the PIR in various states in the United States [8].
Owing to the delayed start of China’s real estate market, Chinese scholars’ research on the housing market and prices began relatively late. However, related research has gradually increased owing to the market’s rapid development. Chinese research on PIR draws on foreign real estate theory, mainly focusing on using economic theory to build a PIR calculation model [10,11] and using empirical data to calculate the urban or regional PIR level [12,13,14]. Scholars explored the PIR’s temporal and spatial evolution characteristics [15,16,17] and revealed the driving factors of its temporal and spatial changes [18,19,20]. Liu used the PIR of 35 cities in China as research objects and analyzed whether there was a bubble in the real estate market by examining their stability [13]. Chen used the dynamic stochastic general equilibrium model to derive the dynamic expression of the PIR, linking it with macroeconomic fundamentals and the monetary policy stance to explore long-term predictability [21]. Yin used the PIR to build a housing spatial justice model and analyzed the spatiotemporal variation characteristics of both the PIR and housing resource allocation justice in Nanjing [17].
These studies have the following shortcomings. First, the existing research primarily uses cross-sectional or discontinuous data and lacks continuity and stability. Second, the geographical perspective primarily analyzes PIR’s spatial distribution and spatiotemporal evolution characteristics, while research on the influencing factors and formation mechanism remains insufficient. Third, regarding influencing factors, the existing research primarily uses the spatial econometric model to analyze them as a whole and lacks analysis and investigation of the influencing factors’ nonlinear relationship.
The academic contributions of this study and the expansion of existing related research are primarily reflected in the following three aspects. First, China’s prefecture-level administrative regions from the basic unit were used to explore PIR’s spatial pattern and evolution characteristics from 2009 to 2020. This ensures the integrity of the research area and continuity of the research period, enriching the research form. Second, exploring PIR’s evolution characteristics from spatiotemporal levels using the rank-size rule, global spatial autocorrelation, and Markov chain methods, and effectively integrating the two characteristics expands PIR research. Third, by using the random forest model in machine learning to reveal PIR’s influencing factors, we not only measure the overall impact of each factor on the PIR but also reveal its nonlinear relationship, which helps to deepen understanding of the PIR.
The rest of this paper is arranged as follows: the second section describes the data sources and related research methods; the third section analyzes the spatial and temporal differentiation patterns and evolution characteristics of China’s PIR; the fourth section explores influencing factors; and finally, the fifth section provides a summary, proposing the policy conclusions and contributions of the study.

2. Materials and Methods

2.1. Data Sources

The selected study units were 336 cities above the prefecture level in China, excluding Hong Kong, Macau, Taiwan, Sansha, and Danzhou in Hainan. Taking the PIR of cities above the prefecture level from 2009 to 2020 as the indicator, the housing price data were collected from the real estate transaction centers of various cities and the China Housing Price Market Platform (http://www.creprice.cn/, accessed on 2 November 2022). Residential price is the average residential transaction price per unit floor area in each city. Residents’ income, construction area, and related economic data were obtained from the “China City Statistical Yearbook” [22], the China Statistical Yearbook for Regional Economy [23], the “China Urban Construction Statistical Yearbook” [24], provincial statistical yearbooks, and city statistical yearbooks.

2.2. Research Method

This study included the PIR of Chinese cities as research objects and used the rank-size rule, Markov chain, and other methods to analyze its spatiotemporal evolution characteristics. Thereby, we used the random forest model to detect the factors driving the PIR.

2.2.1. Housing Price-to-Income Ratio Model

The UN-Habitat Urban Indicators Tool Kit Guide defines the PIR as the ratio of the median free market price of a residential unit in an area to the median annual household income, which means the time (in years) required to purchase a dwelling household without taking out bank loans and generating any consumption. In recent years, while the overall income of urban and rural residents in China has increased steadily, the income gap between different cities has gradually widened [25,26]. China has not formed a society dominated by middle-income families, and the PIR calculated by the median household income tends to deviate from reality. In addition, owing to the lack of median statistics for housing prices and income data, Chinese scholars often use the ratio of the average housing price to the average household income to calculate the PIR. This study compared various PIR calculation methods considering data availability. The formula used is as follows [17]:
P I R = H P H I = A R A F n A I n = A R A F A I
where PIR is the urban housing PIR; HP is the average sales price of urban housing, which is the product of the average residential unit area price (AR), the urban per capita residential building area (AF), and the urban per capita population (n); HI is the annual income of urban households in cities, which is the product of the annual per capita disposable income (AI) of urban residents and the number of urban households per capita (n).

2.2.2. Rank-Size Rule

The rank-size rule examines the scale distribution of specific elements in a region from the factor and element scale rank [27,28], and is the most extensive and classic method in a hierarchy study [29]. To date, the rank-size rule has been widely applied to research on scale hierarchy and differences in floating population, tourism flow, traffic flow, resource flow, and so on. The rank-size rule and fractal theory were introduced to explore the rank distribution and fractal characteristics of the PIR in Chinese cities. Its basic and logarithmic forms are expressed as [30]:
P i = P 1 × R i q
ln P i = ln P 1 q ln R i
where Pi is the housing price–income ratio of the ith city, P1 is the housing PIR of the first city, Ri is the rank of city i, and q is the Zipf dimension. The Zipf dimension reflects spatial distribution and hierarchical structural changes in the regional PIR. When q = 1, q < 1, and q > 1, the hierarchical distribution of the regional PIR is in the optimal, normal (equalization), and Pareto (centralization) distribution modes, respectively.

2.2.3. Markov Chain

The Markov chain is a Markov process with a discrete time and state [31,32], and is an effective tool for revealing the changes and processes of PIR in Chinese cities. By discretizing the continuous PIR into k types, the method calculates the probability distribution of the corresponding type and its inter-annual variation, approximating the process of the PIR’s evolution in each city. The transfer process of the types of PIR in different cities in different years is represented by a k × k Markov probability matrix M [33], where mij represents the one-step transition probability value, which indicates that a city belongs to type I at time t and transfers to type j at time t + 1. The expression is as follows [34]:
m i j = n i j n i
where nij is the sum of the number of cities of type i transformed from the city of type i at time t to type j at time t + 1 during the research period, and ni is the sum of the city number of type i at all times during the research period.

2.2.4. Random Forest Model

The random forest model is a data mining method based on a classification and regression tree, an integrated machine learning technology [35,36]. The bootstrap resampling method is typically used in the random forest model to extract multiple samples from the original sample throughout replacements, modeling each bootstrap sample as a decision tree. Multiple decision trees are combined to obtain the final result by voting scoring rules, which means voting decides whether it is a classification. If it is a regression, then the mean is calculated. The model has the unique advantage of easy implementation and interpretability, which can effectively avoid the problem of collinearity variables and model overfitting. Simultaneously, it also evaluates the importance of variables and has a strong predictive function. It is widely used in clustering, discriminant, regression, and prediction research [37,38,39,40].
The random forest model was constructed and calculated using the Random Forest package in the R software, which establishes a PIR regression analysis model and related influencing factors, identifying the PIR’s dominant influence in different years based on the increases in mean square error and the node purity factor. The relevant parameters are set as follows: ntree (the number of decision trees) = 500, mtry (the number of variables selected when the decision tree is split) = 5, and the default values are used in other parameters.

3. Results

3.1. Static Distribution Characteristics of Housing Price-to-Income Ratio

3.1.1. Evolutionary Characteristics of Scale Distribution of Housing Price-to-Income Ratio

Through double logarithmic linear fitting of the PIR and its corresponding rank in various cities in China, the fitting equation’s relevant parameters are listed in Table 1. The goodness of fit regarding the equation for the PIR for each year (2009–2020) was 0.91. These results show that the equation for each year has a high degree of fit; that is, the rank-scale rule better expresses the PIR scale distribution characteristics in Chinese cities. From 2009 to 2020, the Zipf dimension fluctuated between 0.2994 and 0.4075, showing a fluctuating upward trend. During 2009–2011, the Zipf dimension showed an inverted “U”-shaped trend that first increased and then decreased, and it increased again during 2012–2017. There was a slight decline during 2018–2020. The Zipf dimension of each year (2009–2020) was lower than 1, indicating that the PIR in Chinese cities is a balanced normal distribution model; that is, the difference in each city’s PIR is relatively small, and the regional PIR has a low priority. The rise in the Zipf dimension reflects that the PIR trend was more concentrated than that of dispersion; the PIR of middle-rank cities has increased rapidly, making the PIR system in Chinese cities more reasonable.

3.1.2. Global Spatial Autocorrelation Characteristics of Housing Price-to-Income Ratio

Global spatial autocorrelation was used to detect the overall spatial agglomeration characteristics of PIR in Chinese cities (Table 2). Table 2 shows that Moran’s I value of residential rents in the Yangtze River Delta from 2009 to 2020 is higher than 0.10, and is significant at the 0.001 confidence level, indicating that there is a significant positive spatial correlation between the PIR in Chinese cities. This means that the PIRs in cities with closer distances have strong similarity, and the house PIR has an obvious spatial dependence. Furthermore, Moran’s I value increased from 0.1431 in 2009 to 0.1997 in 2020, indicating that the agglomeration of PIR in Chinese cities is increasing, and cities with similar PIR tend to be spatially closer.

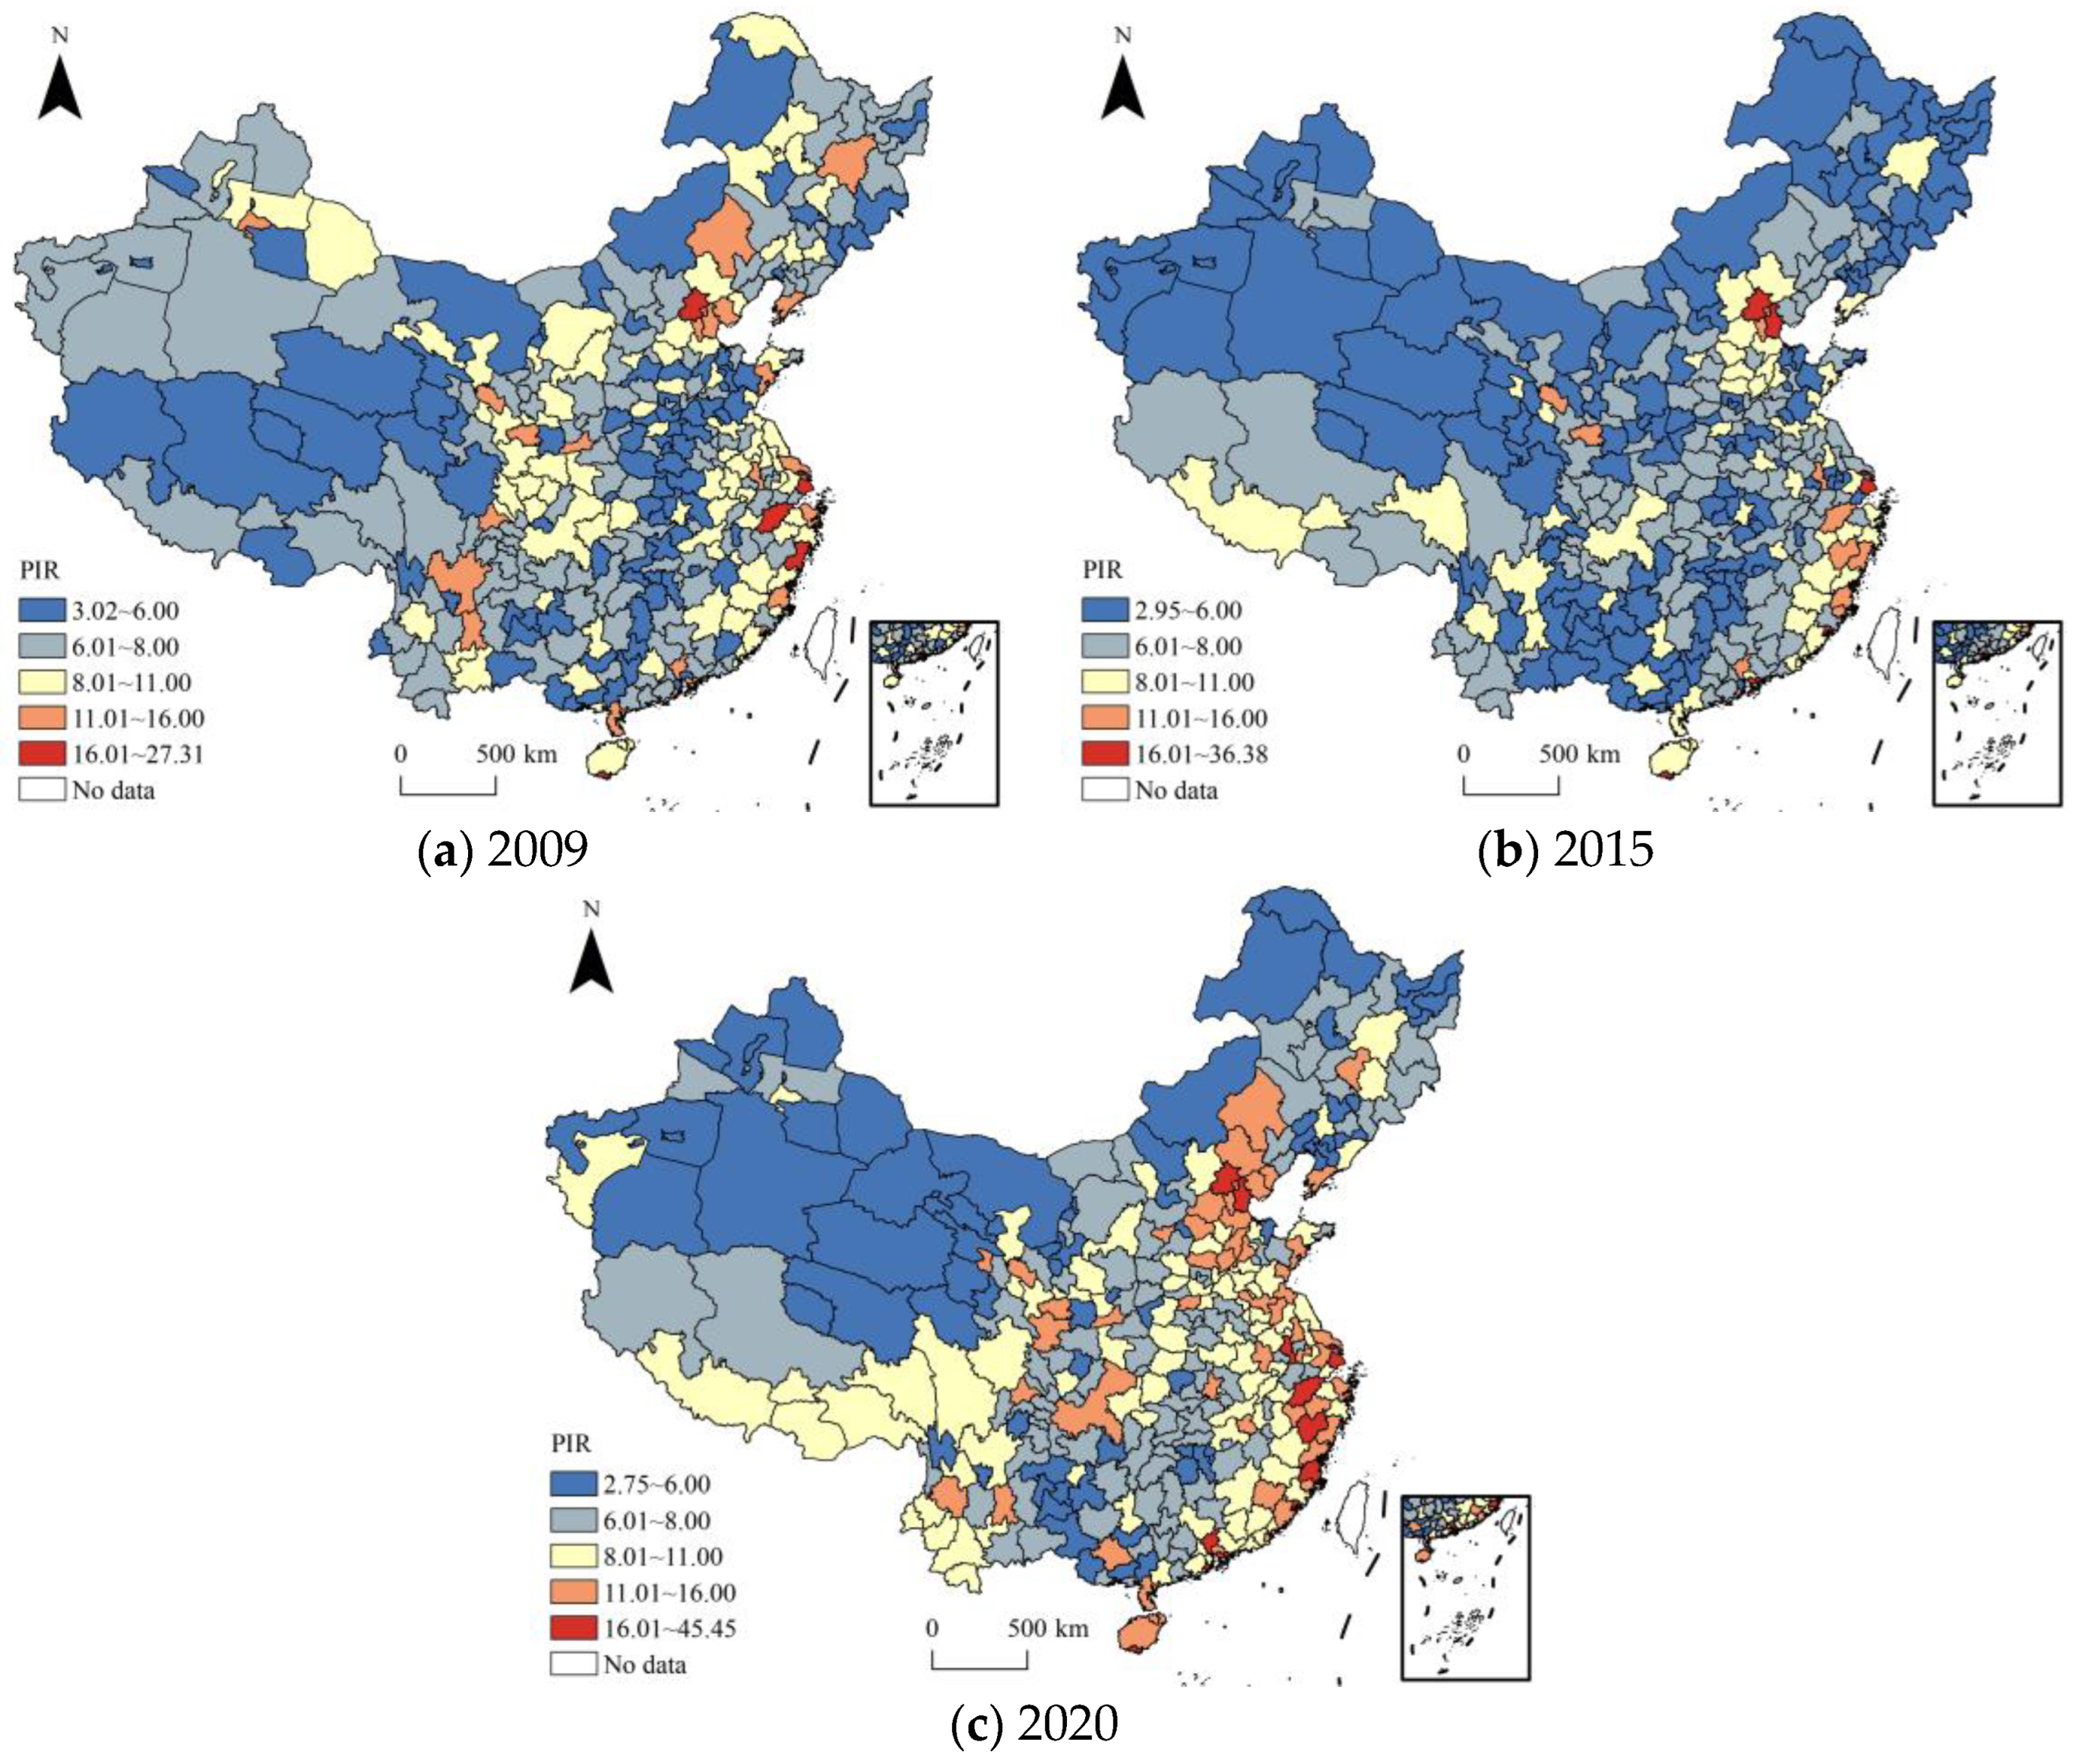
3.1.3. Spatial Distribution Pattern of Housing Price-to-Income Ratio

Based on existing research results and the PIR’s data characteristics [2,41], the PIR of Chinese cities is divided into five categories: (1) low PIR cities (PIR ≤ 6), with no difficulty in housing payment; (2) moderate PIR cities (6 < PIR ≤ 8), with mild difficulty in housing payment; (3) higher PIR cities (8 < PIR ≤ 11), with moderate housing payment difficulties; (4) high PIR cities (11 < PIR ≤ 16), with severe housing payment difficulties; and (5), ultra-high PIR cities (PIR > 16), with very severe housing payment difficulties.
The PIR’s spatial distribution in Chinese cities (Figure 1) shows that in 2009, five cities had very severe housing difficulties: Beijing, Shanghai, Sanya, Hangzhou, and Wenzhou. Twenty-four cities had severe housing difficulties, primarily in the eastern coastal areas, such as Tianjin, Dalian, Qingdao, Ningbo, Xiamen, and Shenzhen. Cities of this type are also seen in a few provincial capital cities in the west, such as Chengdu, Kunming, Xi’an, and Lanzhou. Approximately 85 cities had moderate housing difficulties, mainly in Jiangsu, central Zhejiang, central Anhui, western Fujian, Chongqing, eastern Sichuan, and other regions. One hundred and thirty-four cities with mild housing difficulties were widely distributed, primarily in Shanxi and Liaoning, as well as in Heilongjiang, northern Anhui, western Hunan, Guangdong, Xinjiang, and other regions. Ninety-one cities had no housing payment difficulties, mostly located in the central and western regions. Shandong is also widely distributed.
In 2015, six cities had severe housing payment difficulties; Tianjin, Xiamen, and Shenzhen entered this category, while Hangzhou and Wenzhou exited it. There were 11 cities with severe housing payment difficulties, primarily located in the eastern coastal areas and western provincial capitals. There were 55 cities with moderate housing payment difficulties, primarily located in Hebei, central Zhejiang, Fujian, Hainan, Chongqing, and other regions. One hundred and twenty cities had mild housing payment difficulties, mostly located in the central and western regions, including Anhui, Henan, Sichuan, and Yunnan. There were 147 cities without housing payment difficulties, primarily in the northeastern, central, and western regions, among which Jilin, Heilongjiang, Hubei, Hunan, Guangxi, Inner Mongolia, Xinjiang, and other provinces had greater distribution.
In 2020, 12 cities had very severe housing payment difficulties, including Guangzhou, Fuzhou, Nanjing, Hangzhou, Lishui, and Zhuhai. Fifty-one cities had severe housing payment difficulties, primarily located in the coastal areas of the East China Sea and the capital cities in the central and western regions. There were 93 cities with moderate housing payment difficulties, mainly located in Anhui, Shandong, Henan, Guangdong, Yunnan, Tibet, and other regions. One hundred and twelve cities had mild housing payment difficulties, mostly distributed in the central and western regions including Hunan, Hubei, Henan, Guangxi, Sichuan, and other regions. There were 71 cities without housing payment difficulties, primarily distributed in the northeastern and western regions, such as Liaoning, Heilongjiang, Guangxi, Guizhou, Inner Mongolia, Qinghai, and Xinjiang.
Overall, the PIR ratio showed a spatial distribution of “high in the east and low in the west”, and its value showed a fluctuating trend of first falling and then rising. Judging from the increase in the PIR, the increase in the east was higher and the increase in the west was lower. From the perspective of the number of various types, the number of cities with very severe, severe, and moderate housing difficulties increased. The number of cities with mild difficulty in housing payment and those with no housing payment difficulties decreased, reflecting that the income growth rate of most urban residents is struggling to outpace the rate of increase in housing prices.

3.2. Analysis on Spatial–Temporal Evolution Characteristics of Housing Price-to-Income Ratio

3.2.1. Time Evolution Characteristics of Housing Price-to-Income Ratio

Based on the previous classification of the PIR, we calculated the transition state matrix of the PIR in Chinese cities and used the Markov chain to calculate the Markov probability transition matrix in 2009–2015 and 2015–2020 (Table 3). Using ArcGIS software, we visualized the spatial changes in PIR types in the two periods of 2009–2015 and 2015–2020 (Figure 2).
As shown in Table 1, the probability values on the main diagonal in the two time periods are relatively high, indicating that the PIR in each city has high stability for the initial PIR during the changing process. (1) The probability values on all diagonal lines were higher than those on nondiagonal lines. The minimum probability value on the diagonal line is 0.6525 and the maximum is 0.9091, indicating development of the urban housing market and residents’ income levels. Although each city’s PIR generally showed an upward trend, the distribution changed very little compared with the initial stage; the probability of maintaining the initial state level was at least 65.25%. (2) The transfer probability between the urban PIRs was small, and the maximum probability value on the off-diagonal line was 0.2979, which was lower than that on the diagonal line. The changes in the urban PIR in all time periods were primarily toward the adjacent types. Although there were some nonadjacent types, the probability value was small, meaning that the temporal changes in the urban PIR were primarily gradual; the relative probability of leaping changes was lower. (3) Regarding time characteristics, the probability that cities with relatively low house prices with stable incomes of 2009–2015 is higher than that of 2015–2020, and the probability of cities with relatively high house prices that remained stable is lower than that of 2015–2020, indicating that in the 2009–2015 period, cities with relatively high house prices and incomes fluctuated greatly. From 2015 to 2020, cities with relatively low house price–incomes underwent large changes, which meant that the house PIR would gradually change from a stable bottom to a top.

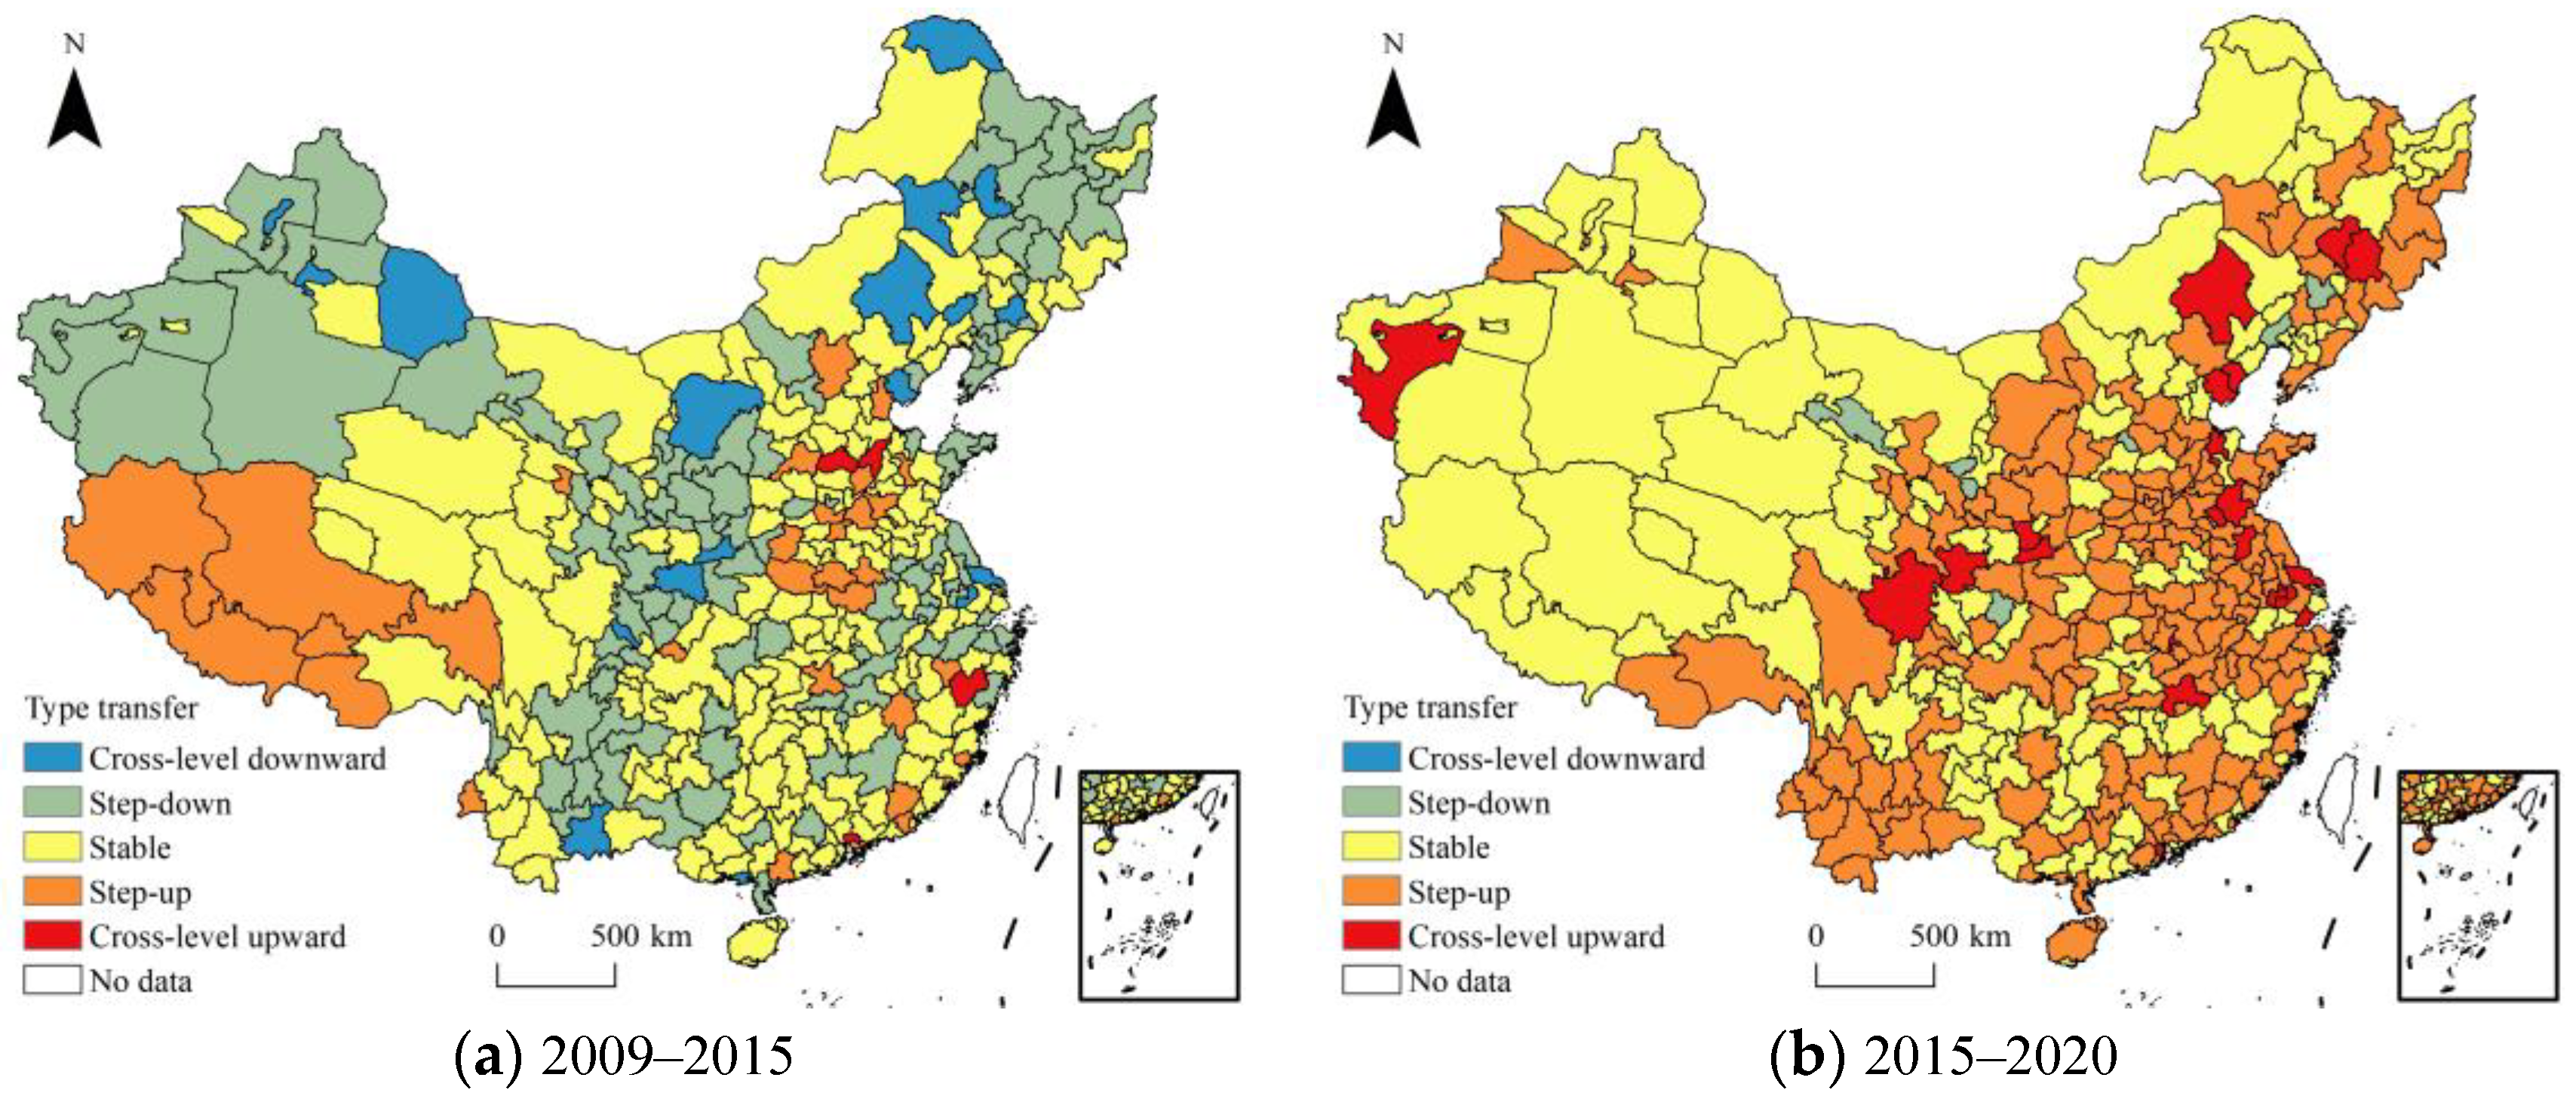
3.2.2. Spatial Evolution Characteristics of Housing Price-to-Income Ratio

Regarding the number of PIR transfer types of 2009–2015, they were dominated by stable cities. There were 172 stable cities, accounting for 50.74% of the study area, and downward transfer cities were also more distributed, accounting for the majority of the study area, 38.64%. From 2015 to 2020, the PIR transfer type was dominated by upward transfers. There were 196 upward-transferring cities, accounting for 57.82% of the study area, and there were also more stable cities, accounting for 40.41% of the study area.
In the spatial distribution of house PIR transfer types, there were only 36 upward-transferring cities during 2009–2015, and only Xingtai, Lishui, Dezhou, and Dongguan had cross-level upward transfers within regions, such as Henan, Shandong, and Tibet. Downward-transferring type cities were widely distributed, where 18 were of the cross-level downward transfer type, primarily in Inner Mongolia, Xinjiang, and other regions. One hundred and thirteen were in the downward type, primarily in the northeast, central, and western regions, such as Liaoning, Heilongjiang, Anhui, Sichuan, Shaanxi, Gansu, and Xinjiang. From 2015 to 2020, the number of upward-shifting cities was relatively large and widely distributed, where 21 were inter-level upward-shifting cities, mostly located in Jiangsu, Shandong, Hebei, Jilin, and other regions. One hundred and seventy-five of them were upward-shifting cities, which were relatively concentrated in Anhui, Shandong, Henan, Hubei, Guangdong, and Yunnan; there were six downward-shifting cities: Yangquan, Jinzhou, Tieling, Bazhong, Zhangye, and Zhongwei, all of which are located in the northeast, central, and western regions, and all are step-down transfer types.
Overall, the PIR in Chinese cities was dominated by a stable type during 2009–2015, and it changed to an upward shift during 2015–2020, which meant that over time, the PIR in most cities increased, and residents’ housing capacity declined further.

3.3. Influencing Factors of Spatial Pattern of Housing Price-to-Income Ratio

3.3.1. Selection of Influencing Factors

Significant spatial differences exist in the PIR, including many driving factors for housing price and resident income levels. The factors affecting the PIR are also complex, according to the theory of supply/demand and urban characteristic price theory, as well as the research practice of many scholars on housing prices and PIR [42,43,44]. Most studies are based on urban economic (Gross Domestic Product, income level, industrial structure, etc.), population (population size, population structure, population density, etc.), and social (education level, medical level, cultural level, etc.) factors. This study selected 16 factors to explore PIR’s impact in Chinese cities (Table 4).

3.3.2. Identify and Analyze Influencing Factors

The random forest model was used to explore the factors influencing the PIR (Table 5). The goodness of fit in 2009, 2015, and 2020 was 64.28%, 76.72%, and 84.27%, respectively. Overall, the fitting effect of the model was good. The following section focuses on the increase in the mean squared error (%IncMSE) to analyze the effect of various factors on the PIR.
(1) Driven by economic factors. The influence of the economic development and resident consumption levels on the PIR showed a fluctuating upward trend, and the influence of the industrial structure level, real estate investment density, and urban salary level showed an upward trend. Judging from the average value of the three-year increase in the mean squared error, the influence of real estate investment density, industrial structure level, resident consumption level, urban salary level, and economic development level weakened. The first three indicators ranked in the top three among the 16 indicators, reflecting that economic factors have the biggest effect in the PIR.
(2) Driven by demographic factors. The impact of the urban development level and real estate activity on the PIR showed a fluctuating upward trend, the impact of the population attraction level showed a fluctuating downward trend, and the impact of talent potential showed a downward trend. Judging from the average value of the three-year increase in the mean squared error, the influence of real estate activity, talent potential, the urban development level, and the population attraction level decreased in sequence, among which real estate activity and talent potential ranked fourth and fifth, respectively, among the 16 indicators, reflecting that the demographic factor has important effects on the change in the PIR.
(3) Driven by social factors. The impact of public service investment and cultural development level on the housing PRI showed a trend of first rising, and then falling. The impact of medical and health care level increased, and the impact of urban greening level declined. Judging from the average value of the three-year increase in the mean squared error, the influence of public service investment, medical and health care, urban greening, and cultural development levels gradually weakened, and the ranking of the four factors did not enter the top five. This shows that social factors have a relatively minor impact on the PIR.
(4) Driven by anticipating factors. The impact of economic development and housing price growth expectations on the PIR generally showed an upward trend, while the impact of revenue growth expectations showed a fluctuating downward trend. From the mean value of the three-year increase in the mean squared error, the impact of housing price growth, revenue growth, and economic development expectations gradually decreased. Additionally, the impact of the three factors did not rank in the top ten, indicating that the anticipation factors have the least impact on the house PIR.

3.3.3. Influence Law of Dominant Factors

The above analysis and Table 4 show that the top five in the mean value of the three-year increase in mean squared error were real estate investment density, industrial structure level, resident consumption level, real estate activity, and talent potential rank. From the mean value of the three-year increase in node purity, the real estate investment density, industrial structure level, resident consumption level, real estate activity, and urban salary level ranked in the top five. Their real estate investment density, industrial structure level, resident consumption level, and real estate activity ranked in the top four. Therefore, they are taken as the dominant influencing factors, and the dominant factor dependence diagram is drawn (Figure 3).
Real estate investment density had a significant positive impact on the PIR. With an increase in the average land real estate development investment, the impact on the PIR is generally strengthened; that is, it is positively correlated with the PIR. In 2009, the impact of real estate investment density on the PIR initially decreased, and then increased. When the average land investment in real estate development exceeded four million yuan/km2, the impact on the PIR tended to be stable. In 2015 and 2020, real estate investment density showed an overall upward trend toward the PIR. When the local average real estate development investment exceeded 50 million yuan/km2, its impact on the PIR became more stable. Over the past few years, the impact of real estate investment density on PIR has gradually increased. It is worth noting that the results of this study are very similar to Bai’s study [45]. Bai used panel data models with fixed effects to analyze the influencing factors of unit house prices in China’s provinces, and found that the completed area of real estate is positively correlated with house prices from the national level [45]. The investment amount of real estate development is a reflection of the construction area and completed area of real estate, which further proves real estate investment density’s significant positive impact on PIR is reliable.
The industrial structure level had a positive impact on the PIR and a positive correlation with it. In 2009, the impact of the industrial investment level on the PIR was relatively stable at low and high levels and showed a rapid growth momentum at the medium level. That is, when the proportion of tertiary industry’s added value in GDP was less than 32% or more than 60%, the impact of the industrial structure level on the PIR was relatively stable. When it was between 32% and 60%, the impact of the industrial structure level showed a rapid upward trend. In 2015, the impact of industrial structure on the PIR showed an upward trend. In 2020, the added value of tertiary industry accounted for less than 72% of GDP, and the impact on the PIR showed an upward trend, with a proportion higher than 72%, and the impact on the PIR tended to be stable. The impact of industrial structure level on the PIR showed a fluctuating upward trend. In addition, Zhang believes that the increase in the proportion of the tertiary industry in cities will drive rising housing prices in other cities, and the spatial spillover effect of housing prices in cities with a higher proportion of the tertiary industry is stronger, which is consistent with the findings here [46].
Resident consumption level had a significant positive impact on the PIR and a positive correlation with the overall PIR. In 2009, when the per capita retail sales of consumer goods were less than 10,000 yuan/person, the impact of resident consumption level on the PIR was at a low level, whereas when it was higher than 18,000 yuan/person, the impact on the PIR was stable at a high level. In 2015 and 2020, the impact of the resident consumption level on the PIR showed an increasing trend. When the per capita retail sales of social consumption were less than 65,000 yuan/person in 2015 and less than 30,000 yuan/person in 2020, the impact of the resident consumption level on the PIR was relatively low; when they were more than 78,000 yuan/person in 2015 and more than 50,000 yuan/person in 2020, the impact on the PIR was relatively high. The impact of resident consumption level on the PIR gradually increased over time. Yang discussed the relationship between housing prices and household consumption in China, and found that housing prices have a negative impact on household consumption [47]. This differs from the positive effect of household consumption on PIR in this study. This may be because Chinese families continue to accumulate housing wealth after owning houses, and reduce other forms of consumption, resulting in the substitution effect of housing wealth on the consumption of Chinese urban households [47].
Real estate activity had a positive impact on the PIR and was positively correlated with it overall. In 2009, when the proportion of the real estate industry was less than 1%, the impact on the PIR was low. When it was higher than 1%, a phased increasing trend was observed. When it was higher than 3%, the impact was stable at a high level. When the proportion of real estate practitioners was less than 2% in 2015 and 1.2% in 2020, the impact of real estate activities on the PIR was low. When it exceeded 2.5% in 2015 and 1.6% in 2020, the impact of real estate activity on PIR increased. The impact of real estate activity on the PIR showed an overall trend of increasing volatility. Wang analyzed the influencing factors of the county-level unit housing price in China, and found that the real estate activity has a positive impact on housing price, and the higher the urban administrative grade, the greater the real estate activity [48]. This study not only found the positive influence of real estate activity on PIR, but also further revealed the difference law of the influence of real estate activity on different cities.

4. Conclusions

This study included 336 cities in China as the research units, took the urban PIR as the research object, used the urban rank-size rule, Markov chain, and other methods to explore the temporal and spatial evolution characteristics of the PIR from 2009 to 2020, and used the random forest model to explore the factors that influence the PIR. The study found that the PIRs in Chinese cities are all in a balanced normal distribution model, and there is a significant positive spatial correlation that constantly increased. The PIR’s spatial pattern showed a distribution trend of “high in the east and low in the west,” and its value showed a fluctuating upward trend. The time evolution of the PIR had a high stability. The type of China’s urban PIR is mainly the stable type from 2009 to 2015 and upward transfer type from 2015 to 2020. Real estate investment density, industrial structure level, resident consumption level, and real estate activity were the dominant factors affecting the PIR in Chinese cities. These factors’ influence on the PIR generally tended to increase, and the impact of housing prices on income had a complex nonlinear relationship.
Overall, since the growth rate of urban residents’ income in most cities in China was far slower than that of housing prices, the PIR in most cities was on the rise. From 2009 to 2020, the average PIR in Chinese cities was above seven, while the first-tier cities represented by Beijing, Shanghai, Guangzhou, and Shenzhen had a PIR of more than 20 in 2020. For typical residents in these cities, the possibility of purchasing ordinary commercial housing independently from their own income is decreasing.
This study puts forward the following suggestions: (1) Owing to the significant regional differences in the PIR, more targeted control strategies should be proposed for cities with different PIR types. For example, cities with no housing payment difficulties and mild housing difficulties should strengthen real estate market supervision and ensure its stable and orderly development, transform the comparative advantage of housing prices into a competitive advantage of development, and enhance the city’s competitiveness and attractiveness. In cities with moderate housing difficulties and severe housing difficulties, the positioning of “houses are for living in and not for speculative investment” should be implemented, and real estate control measures such as restrictions on purchases, sales, and loans should be improved. Housing prices in cities with very severe housing difficulties are far beyond the affordability of ordinary residents. Therefore, these cities should increase the construction and supply of affordable housing, actively cultivate and develop the residential rental market, implement both physical security and rental subsidies, increase the supply of public rental housing, and formulate and improve the rental-purchase equal rights system in line with the actual city. (2) The rise in the PIR means that the housing price increase exceeds the growth in residents’ income. Therefore, while controlling housing prices, actively developing the economy and increasing residents’ income level so that residents’ income growth exceeds the increase in housing prices long-term. The method of squeezing the bubble rather than piercing the bubble fundamentally solves the problem of excessive housing prices. Multiple measures are required to stabilize income growth. For example, stabilizing market players to further increase wage income and operating income, promoting employment and alleviating structural employment conflicts, optimizing income distribution structure, increasing adjustment efforts such as taxation, social security, and transfer payments, and striving to increase the income of low-income groups.
PIR plays an important role in measuring residents’ housing affordability and real estate health. Based on the geographical spatial perspective, this study intuitively demonstrates the spatiotemporal evolution of the PIR at the urban scale in China and integrates PIR’s temporal and spatial differentiation characteristics in the research, highlighting the disciplinary characteristics of geography. We construct the influencing factor system of PIR from economic, demographic, social, and expected factors. The screening of influencing factors comes from the influencing factor system of up to 16 indicators. This research process is more comprehensive and objective than the “a priori” calculation that directly selects a small number of factors, and it will provide a reference for further deepening the research of PIR. In addition, this study uses the nonlinear algorithm of machine learning to reveal the relationship between PIR influencing factors, which enriches PIR research methods and provides regional policy guidance and theoretical basis for real estate market regulation.
Since this study primarily examined the spatiotemporal differentiation of urban PIR, it did not consider the temporal and spatial differences in the PIR between different income groups. In addition, owing to the low housing affordability of the low- and middle-income groups, research on the rent-to-income ratio of these groups should be strengthened. There is no uniform international standard for calculating the PIR in the literature. This study may omit some factors that affected the housing affordability of residents in the construction of the PIR calculation model, such as household consumption expenditure, down payment ratio, bank loan interest rate, and house purchase taxes and fees. To accurately analyze the spatial and temporal differentiation of the regional PIR and residents’ ability to pay, the impact of these factors on PIR should be considered in future research. In addition, PIR, PRR, DTI, and HVR only reflect certain characteristics of the real estate market situation. In the future, while comparing and studying the differences between PIR, PRR, DTI, and HVR, we should integrate them to build a housing health index to comprehensively measure the regional housing market’s development.

Author Contributions

Conceptualization, W.H. and S.Y.; methodology, S.Y. and H.G.; software, W.H. and S.Y.; formal analysis, W.H. and S.Y.; data curation, S.Y. and H.G.; writing—original draft preparation, W.H. and S.Y.; writing—review and editing, W.H., S.Y. and H.G.; visualization, W.H. and S.Y.; supervision, S.Y. All authors have read and agreed to the published version of the manuscript.

Funding

This research was funded by the Ministry of Education Humanities and Social Sciences Research Youth Fund Project (No. 22YJCZH057), the National Natural Science Foundation of China (No. 42201258), the Project Supported by Scientific Research Fund of Zhejiang Provincial Education Department (No. Y202147150; Y202249668), the 2021 Public Welfare Science and Technology Research Program Project of Jinhua City (No. 2021-4-381), and the Open Fund of Key Laboratory of Watershed Earth Surface Processes and Ecological Security of Zhejiang Normal University (No. KF-2022-09).

Data Availability Statement

The datasets used and analyzed in the current study are available from the corresponding author on reasonable request.

Acknowledgments

The authors wish to thank the editor and anonymous reviewers for their constructive comments, which were considerably useful in improving the paper.

Conflicts of Interest

The authors declare no conflict of interest.

References

  1. Damen, S.; Vastmans, F.; Buyst, E. The effect of mortgage interest deduction and mortgage characteristics on house prices. J. Hous. Econ. 2016, 34, 15–29. [Google Scholar] [CrossRef]
  2. Uwayezu, E.; Vries, W.T.D. Access to affordable houses for the low-income urban dwellers in Kigali: Analysis based on sale prices. Land 2020, 9, 85. [Google Scholar] [CrossRef] [Green Version]
  3. Bangura, M.; Lee, C.L. Housing price bubbles in Greater Sydney: Evidence from a submarket analysis. Hous. Stud. 2022, 37, 143–178. [Google Scholar] [CrossRef]
  4. Weicher, J.C. The affordability of new homes. Real. Estate. Econ 1977, 5, 209–226. [Google Scholar] [CrossRef]
  5. Malpezzi, S. Urban housing and financial markets: Some international comparisons. Urban Stud. 1990, 27, 971–1022. [Google Scholar] [CrossRef]
  6. Gan, Q.; Hill, R.J. Measuring housing affordability: Looking beyond the median. J. Hous. Econ. 2009, 18, 115–125. [Google Scholar] [CrossRef] [Green Version]
  7. Suhaida, M.S.; Tawil, N.M.; Hamzah, N.; Che-Ani, A.I.; Basri, H.; Yuzaineec, M.Y. Housing affordability: A conceptual overview for house price index. Procedia Eng. 2011, 20, 346–353. [Google Scholar] [CrossRef] [Green Version]
  8. Hu, Y.; Oxley, L. Bubbles in US regional house prices: Evidence from house price-income ratios at the State level. Appl. Econ. 2018, 50, 3196–3229. [Google Scholar] [CrossRef]
  9. Costello, G.; Fraser, P.; Groenewold, N. House prices, non-fundamental components and interstate spillovers: The Australian experience. J. Bank. Financ. 2011, 35, 653–669. [Google Scholar] [CrossRef]
  10. Feng, Q.; Wu, G.L. Bubble or riddle? An asset-pricing approach evaluation on China’s housing market. Econ. Model. 2015, 46, 376–383. [Google Scholar] [CrossRef]
  11. Zhang, C.C.; Jia, S.; Yang, R.D. Housing affordability and housing vacancy in China: The role of income inequality. J. Hous. Econ. 2016, 33, 4–14. [Google Scholar] [CrossRef]
  12. Shen, L. Are house prices too high in China. China Econ. Rev. 2012, 23, 1206–1210. [Google Scholar] [CrossRef]
  13. Liu, W.C. The study on the stationarity of housing price-to-rent and housing price-to-income ratios in China. World Acad. Sci. Eng. Technol. 2014, 8, 30–34. [Google Scholar]
  14. Leung, K.M.; Yiu, C.Y.; Lai, K.K. Responsiveness of sub-divided unit tenants’ housing consumption to income: A study of Hong Kong informal housing. Hous. Stud. 2022, 37, 50–72. [Google Scholar] [CrossRef]
  15. Liu, W.C. Do multiple housing bubbles exist in China? Further evidence from generalized sup ADF tests. J. Econ. Forecast. 2016, 19, 135–145. [Google Scholar]
  16. Ge, T.; Wu, T. Urbanization, inequality and property prices: Equilibrium pricing and transaction in the Chinese housing market. China Econ. Rev. 2017, 45, 310–328. [Google Scholar] [CrossRef]
  17. Yin, S.G.; Ma, Z.F.; Song, W.X.; Liu, C.H. Spatial justice of Chinese metropolis: A perspective of housing price-to-income ratios of Nanjing, China. Sustainability 2019, 11, 1808. [Google Scholar] [CrossRef] [Green Version]
  18. Lin, Y.J.; Chang, C.O.; Chen, C.L. Why homebuyers have a high housing affordability problem: Quantile regression analysis. Habitat Int. 2014, 43, 41–47. [Google Scholar] [CrossRef]
  19. Li, P.; Song, S.F. What Pushes Up China’s Urban Housing Price So High? Chin. Econ. 2016, 49, 128–141. [Google Scholar] [CrossRef]
  20. Gan, L.; Ren, H.; Xiang, W.; Wu, K.; Cai, W.G. Nonlinear influence of public services on urban housing prices: A case study of China. Land 2021, 10, 1007. [Google Scholar] [CrossRef]
  21. Chen, N.K.; Cheng, H.L. House price to income ratio and fundamentals: Evidence on long-horizon forecastability. Pac. Econ. Rev. 2017, 22, 293–311. [Google Scholar] [CrossRef]
  22. NBSC (National Bureau of Statistics China). China City Statistical Yearbook 2010–2021; China Statistical Publishing House: Beijing, China, 2010–2021. [Google Scholar]
  23. NBSC (National Bureau of Statistics China). China Statistical Yearbook for Regional Economy 2010–2021; China Statistical Publishing House: Beijing, China, 2010–2021. [Google Scholar]
  24. MHURDC (Ministry of Housing and Urban-Rural Development of the People’s Republic of China). China Urban Construction Statistical Yearbook 2009–2020; China Statistical Publishing House: Beijing, China, 2009–2020. [Google Scholar]
  25. Shen, J.F.; Shum, W.Y.; Cheong, T.S.; Wang, L. COVID-19 and regional income inequality in China. Front. Public Health 2021, 9, 687152. [Google Scholar] [CrossRef] [PubMed]
  26. Lu, H.; Zhao, P.; Hu, H.; Zeng, L.G.; Sheng, K.; Lv, W.D. Transport infrastructure and urban-rural income disparity: A municipal-level analysis in China. J. Transp. Geogr. 2022, 99, 103293. [Google Scholar] [CrossRef]
  27. Tan, M.H. Uneven growth of urban clusters in megaregions and its policy implications for new urbanization in China. Land Use Policy 2017, 66, 72–79. [Google Scholar] [CrossRef]
  28. Arshad, S.; Hu, S.; Ashraf, B.N. Zipf’s law, the coherence of the urban system and city size distribution: Evidence from Pakistan. Phys. A 2019, 513, 87–103. [Google Scholar] [CrossRef]
  29. Modica, M. The impact of the European Union integration on the city size distribution of the Member States. Habitat Int. 2017, 70, 103–113. [Google Scholar] [CrossRef]
  30. Reggiani, A.; Nijkamp, P. Did Zipf anticipate spatial connectivity structures? Environ. Plan. B 2015, 42, 468–489. [Google Scholar] [CrossRef]
  31. Hierro, M.; Maza, A. Foreign-born internal migrants: Are they playing a different role than natives on income convergence in Spain? Appl. Geogr. 2010, 30, 618–628. [Google Scholar] [CrossRef]
  32. Jiang, H.; Chen, S.P. Dwelling unit choice in a condominium complex: Analysis of willingness to pay and preference heterogeneity. Urban Stud. 2016, 53, 2273–2292. [Google Scholar] [CrossRef]
  33. Flores-Segovia, M.A.; Castellanos-Sosa, F.A. Proximity effects and labour specialization transitions in Mexico: A spatial Markov chain analysis. Reg. Stud. 2021, 55, 575–589. [Google Scholar] [CrossRef]
  34. Du, Q.; Wu, M.; Xu, Y.D.; Bai, L.B.; Yu, M. Club convergence and spatial distribution dynamics of carbon intensity in China’s construction industry. Nat. Hazard. 2018, 94, 519–536. [Google Scholar] [CrossRef]
  35. Breiman, L. Random forests. Mach. Learn. 2001, 45, 5–32. [Google Scholar] [CrossRef]
  36. Wang, S.J.; Liu, Z.T.; Chen, Y.X.; Fang, C.L. Factors influencing ecosystem services in the Pearl River Delta, China: Spatiotemporal differentiation and varying importance. Resour. Conserv. Recycl. 2021, 168, 105477. [Google Scholar] [CrossRef]
  37. McAlexander, R.J.; Mentch, L. Predictive inference with random forests: A new perspective on classical analyses. Res. Polit. 2020, 7, 2053168020905487. [Google Scholar] [CrossRef] [Green Version]
  38. Medeiors, M.C.; Vasconcelos, G.F.R.; Veiga, A.; Zilberman, E. Forecasting inflation in a data-rich environment: The benefits of machine learning methods. J. Bus. Econ. Stat. 2021, 39, 98–119. [Google Scholar] [CrossRef]
  39. Li, L.; Niu, N.; Li, X. Factors affecting the long-term development of specialized agricultural villages north and south of Huai river. Land 2021, 10, 1215. [Google Scholar] [CrossRef]
  40. Wang, Y.; Zhan, Z.; Mi, Y.; Sobhani, A.; Zhou, H.Y. Nonlinear effects of factors on dockless bike-sharing usage considering grid-based spatiotemporal heterogeneity. Transp. Res. Part D 2022, 104, 103194. [Google Scholar] [CrossRef]
  41. Li, Y.S.; Li, A.H.; Wang, Z.F.; Wu, Q. Analysis on housing affordability of urban residents in mainland China based on multiple indexes: Taking 35 cities as examples. Ann. Data Sci. 2019, 6, 305–319. [Google Scholar] [CrossRef]
  42. Napoli, G. Housing affordability in metropolitan areas. The application of a combination of the ratio income and residual income approaches to two case studies in Sicily, Italy. Buildings 2017, 7, 95. [Google Scholar] [CrossRef] [Green Version]
  43. Wang, Y.; Wang, S.J.; Li, G.D.; Zhang, H.G.; Jin, L.X.; Su, Y.X.; Wu, K.M. Identifying the determinants of housing prices in China using spatial regression and the geographical detector technique. Appl. Geogr. 2017, 79, 26–36. [Google Scholar] [CrossRef]
  44. Yap, H.J.B.; Ng, X.H. Housing affordability in Malaysia perception, price range, influencing factors and policies. Int. J. Hous. Mark. Anal. 2018, 11, 476–497. [Google Scholar] [CrossRef]
  45. Bai, Y.; Tan, M. Empirical testing of influencing factors of China’s housing prices: Evidence from provincial panel data. Res. World Econ. 2018, 9, 9–14. [Google Scholar] [CrossRef]
  46. Zhang, L.; Wang, H.; Song, Y.; Wen, H. Spatial spillover of house prices: An empirical study of the Yangtze delta urban agglomeration in China. Sustainability. 2019, 11, 544. [Google Scholar] [CrossRef] [Green Version]
  47. Yang, Z.; Zhao, L. A reexamination of housing price and household consumption in China: The dual role of housing consumption and housing investment. J. Real Estate Financ. Econ. 2018, 56, 472–499. [Google Scholar] [CrossRef]
  48. Wang, S.; Wang, J.; Wang, Y. Effect of land prices on the spatial differentiation of housing prices: Evidence from cross-county analyses in China. J. Geogr. Sci. 2018, 28, 725–740. [Google Scholar] [CrossRef]
Figure 1. Spatial differentiation pattern of PIR in China during 2009–2020.
Land 11 02224 g001
Figure 2. Spatial differentiation pattern of type transfer of PIR in China.
Land 11 02224 g002
Figure 3. The partial dependence of dominant factors on PIR. (a) real estate investment density in 2009, (b) industrial structure level in 2009, (c) resident consumption level in 2009, (d) real estate activity in 2009, (e) real estate investment density in 2015, (f) industrial structure level in 2015, (g) resident consumption level in 2015, (h) real estate activity in 2015, (i) real estate investment density in 2020, (j) industrial structure level in 2020, (k) resident consumption level in 2020, (l) real estate activity in 2020. W yuan represent ten thousand yuan.
Land 11 02224 g003
Table 1. Scale parameters of rank-size distribution of PIR in China during 2009–2020.
Year200920102011201220132014201520162017201820192020
Zipf dimension0.31780.33520.30000.29940.30770.31100.32900.36670.40750.39480.38100.3806
Goodness of fit0.92300.92120.91420.93260.93560.94360.94770.95460.94610.91510.91810.9179
Table 2. Global Moran’s I statistics of PIR in China during 2009–2020.
YearMoran’s IE(I)Z(I)p-Value
20090.1431−0.00307.62640.0000
20100.1474−0.00307.99040.0000
20110.1242−0.00306.67840.0000
20120.1166−0.00306.29380.0000
20130.1085−0.00305.89460.0000
20140.1379−0.00307.47190.0000
20150.1651−0.00309.03250.0000
20160.1742−0.00309.42650.0000
20170.2076−0.003011.12780.0000
20180.1967−0.003010.61740.0000
20190.2136−0.003011.44100.0000
20200.1997−0.003010.78430.0000
Table 3. Markov chain transitional matrix of PIR in China.
ti/ti+12009–20152015–2020
1234512345
10.84210.15590.00190.00000.00000.80400.19060.00540.00000.0000
20.17110.73330.09430.00130.00000.06030.73130.20840.00000.0000
30.00180.21570.72940.05300.00000.00000.08350.75700.15950.0000
40.00000.00000.29790.65250.04960.00000.00000.11970.80280.0775
50.00000.00000.00000.15790.84210.00000.00000.00000.09090.9091
Table 4. Influencing factors of spatial differentiation of PIR in China.
Variable TypeCharacteristic VariableVariable Description
Economic factorsEconomic development level (X1)GDP per capita (yuan)
Industrial structure level (X2)The added value of the tertiary industry as a percentage of GDP (%)
Real estate investment density (X3)Real estate development investment per land (10,000 yuan/km2)
Resident consumption level (X4)Retail sales of social consumer goods per capita (yuan/person)
Urban salary level (X5)Average salary of on-the-job employees (yuan)
Demographic factorUrban development level (X6)Proportion of urban population (%)
Population attraction level (X7)Permanent Resident Population/Household Registration Population (%)
Real estate activity (X8)Proportion of real estate employees (%)
Talent potential (X9)Number of college students per 10,000 people (person)
Social factorsPublic service investment (X10)Local financial expenditure/resident population (yuan/person)
Cultural development level (X11)100-person public library collection (volume/100-person)
Medical and health care level (X12)Number of health institutions per 10,000 people (pieces)
Urban greening level (X13)Green coverage rate of built-up area (%)
Anticipation factorEconomic development expectations (X14)GDP growth rate (%)
Housing price growth expectations (X15)Residential price growth rate (%)
Revenue growth expectations (X16)Growth rate of disposable income of urban residents (%)
Table 5. Detection results of the influencing factors of PIR in China.
Characteristic Variable200920152020
%IncMSEIncNodePurity%IncMSEIncNodePurity%IncMSEIncNodePurity
X10.193180.46320.118672.68160.4577175.2361
X20.7790305.07051.2890244.66123.0922784.7567
X32.4888304.88943.1482603.29036.09721463.4815
X41.5575159.76460.7492226.96512.0959606.8249
X50.3797179.44000.7055180.31041.7010536.0614
X60.307668.99610.2746140.46971.2012284.4809
X70.6179132.35340.2775145.38780.5314473.3038
X81.0445254.23660.5038175.56951.7182493.1011
X91.9162242.31980.6800169.91070.3570192.1998
X100.5629107.06950.8931434.75050.5365237.1809
X110.2048114.01090.2258240.8432−0.0544148.4339
X120.027369.68120.180581.38710.8612322.6669
X130.3931150.59350.145376.74440.0783104.5517
X14−0.044884.7003−0.010669.48760.027985.8699
X150.0860155.13040.2928129.60630.2847167.8503
X160.2391146.24150.122570.59950.1469120.4598
Note: %IncMSE refers to the increase in mean squared error (%); that is, the increase in the random forest model estimation relative to the original error after the random variable is taken. The greater the %IncMSE value, the more important the variable is. IncNodePurity refers to the increase in node purity; that is, the degree of influence of this variable on each decision tree node. The larger the IncNodePurity value, the more important the variable is.
Publisher’s Note: MDPI stays neutral with regard to jurisdictional claims in published maps and institutional affiliations.

