Article

Uncovering Stakeholders’ Participation to Better Understand Land Use Change Using Multi-Agent Modeling Approach: An Example of the Coal Mining Area of Shanxi, China

1
College of Environment and Resources Sciences, Shanxi University, Taiyuan 030006, China
2
Institute of Loess Plateau, Shanxi University, Taiyuan 030006, China
*
Author to whom correspondence should be addressed.
Land 2022, 11(12), 2257; https://doi.org/10.3390/land11122257
Submission received: 16 October 2022 / Revised: 30 November 2022 / Accepted: 7 December 2022 / Published: 10 December 2022

Abstract

:
Recent decades have witnessed increasing human disruption and the acceleration of fragile natural habitats, especially in coal mining areas in developing countries or regions, which will inevitably lead to sharp land use and cover change (LUCC). Most LUCC models focus more on the research of “land” than “human” in human-land coupled systems, while the simulation and prediction of LUCC involving stakeholders are still deficient. Aiming to reveal the shaping process of LUCC through the stakeholders’ participation, we conducted an in-depth interview in a typical coal mining area of Shanxi, China, and developed an agent-based model by quantifying the stakeholders’ land-use decision-making rules to simulate and predict land use change in different scenarios. The analysis illustrated that the stakeholders’ participation in different periods had shaped the land use pattern in the coal mine area. The area of cultivated land has decreased from 272.34 hm2 to 118.89 hm2, while industrial and mining land increased dramatically by 78.66 hm2 from 2012 to 2019. The attitude and willingness of farmers towards land use varied greatly and were affected by livelihood capital. Part-time farmers whose agricultural income only accounted for 20–80% of the total income were in favor of farmland requisition by coal mining enterprises compared to full-time farmers. We quantified the rules between the attributes of the stakeholders at the micro level and land use changes at the macro level and proposed the multi-agent simulation model, which was effective and verified by a fitting test where the overall accuracy of the Kappa coefficient was 0.83 and could be used to predict future LUCC in research areas by setting the decision parameters in specific scenarios. These outcomes provided a scientific reference for landscape simulation and the prediction of a human-land coupling system while promoting the effectiveness of spatial planning policies.

1. Introduction

Land use/cover change (LUCC) in coal mining areas is a complex process. This complexity originates from societal demands, coal mining activities, environmental capacities, policy and institutional settings, and stakeholders’ participation [1]. Stakeholder participation is the process where stakeholders’ attitudes, willingness, and behavior are involved and included in the decision-making processes of land use. The stakeholders in the LUCC systems are diverse and operate and interact at different levels, constantly changing the structure and composition of the landscape [2]. Nevertheless, very few studies have incorporated the perspective of the stakeholders into spatial LUCC models in the context of resource integration, which has been proven to be the stage of fast and intense LUCC. Therefore, to guide the rational utilization and development of land resources in mining areas, it is particularly important to study the evolution characteristics of land use and understand the internal mechanism of the stakeholders’ attitude, willingness, and behavior in different land-use scenarios.
China has become the world’s largest energy producer and consumer [3]. It is becoming increasingly essential in influencing international energy patterns. The energy resource endowment of rich coal, alongside shortages in oil and gas, has led China to retain a coal-dominated energy structure in the foreseeable future [4]. However, mining activities are often accompanied by negative effects, such as excavation and destruction, which expropriate massive areas of rural land, resulting in land degradation, drought, and abandonment which further destroys the fragile ecological environment of the area. In order to promote the coordinated utilization of “land-mineral” resources and the combination of energy security and ecological civilization construction, China has accelerated its efforts toward becoming green and low-carbon, including the large-scale integration of coal mineral resources owing to impending severe global problems such as climate change, environmental risks and challenges, and energy and resource constraints [5,6]. Shanxi Province is the most important energy and heavy chemical industry base in China, known as the “coal sea”, and is rich in coal resources. With long-term large-scale coal mining, Shanxi has become the key and difficult area directly related to the ecological civilization construction of China. Under the “coal resources integration” goal, Shanxi Province adjusts the energy-resource structure and promotes a series of ecological restoration projects [7,8]. The land use in the coal mine area is thus characterized by multiple dimensions of change.
With the intervention of the government, coal mining enterprises, farmers, and other stakeholders, the coal mining area has formed a unique land use pattern in the process of land cessation, expansion, and diversification, which has become a major factor driving land-use change in regions with high pressure on land [9]. China’s rural land policy is to adhere to and improve the basic system of collective ownership of rural land and rely on the reform of the land system to promote the scientific and orderly circulation of rural land under the guarantee of the separation of powers [10,11,12]. In the context of government macro-control, land use is subject to diverse stakeholders; as such, profound changes have occurred in the ecological landscape of typical coal mining areas, especially after the integration of mineral resources and the merger and reorganization of coal enterprises. When mining enterprises need to requisition agricultural land owing to mining activities, they need to apply for a land requisition from relevant land management departments, which include land compensation fees, resettlement subsidies, and aboveground material compensation fees. As the direct decision-maker of land, the land-use behavior of stakeholders is an integrated result of endogenous development needs and exogenous driving forces. Influenced by a variety of factors, the optimal behavior of stakeholders determines the state of each individual plot, which then shapes the structure of the landscape [13].
Most LUCC models, such as the Markov model and cellular automata model, focus more on the research of “land” than “human” in a human-land coupled system, as such that simulating the choices of direct land-use by decision-makers is challenging [14,15,16,17,18,19,20]. As such, it is impossible to analyze the impact of the macro policy and stakeholders’ participation in land use decision-making behavior and its results. Engaging stakeholders from different social units in the LUCC model building and assessment stages can be one step forward in the land use planning process. Stakeholder participation in the LUCC analysis has been an ongoing topic in spatial planning. Multi-agent models (MAS) allow the exploration of spatial emergence patterns produced by interactions between stakeholders and environments and simulate policy scenarios that are relevant to local stakeholders’ concerns [21]. Therefore, this ‘bottom-up’ approach is well adapted to the simulation of rural land evolution.
A multi-agent model was used to establish a new spatial planning model and combined with its respective advantages to conducting spatial planning in Nijmegen, the Netherlands [22]. A family farm model land use change in the Amazon (LUCITA) was constructed to simulate the development of family farms and the land use behavior of farmers in the Amazon rainforest [23]. Based on the perspective of residents, government, and real estate developers, the multi-agent model is established to simulate the dynamic succession process of the urban spatial structure in Haizhu District, Guangzhou [24]. The calculation idea of the genetic algorithm is introduced into the multi-agent system to build the optimal allocation model of excavated land use, and it is applied to the land use planning of the Caidian District, Wuhan city [25]. Although multi-agent systems are adequately suitable for simulating the interaction between human behavior and the geographical landscape, learning the mechanism of the coupling effect of farmers, enterprises, and the government on land use change in mining areas is difficult. Nevertheless, the selection of agents, the formulation of decision rules, and the improvement of model accuracy remain challenging in related research.
In this paper, we studied typical villages affected by coal mining in China to investigate the land transfer attitude and willingness of local stakeholders based on participatory rural assessments and establish a multi-agent model for simulating and predicting land use patterns in different scenarios. With this step forward, our study was guided by the following questions: (1) What are the differences in the stakeholders’ attitudes and willingness on land use decisions? How should we quantify the subjective decision of stakeholders to realize the simulation of land use pattern evolution in the study area? (2) How can we build a model to describe and simulate the complex dynamic decision-making mechanisms of joint actions among stakeholders? What is the validity and accuracy of the model? (3) How can we illustrate the implications of stakeholders’ participation in different scenarios, and what is the future land use change? What are the long-term implications of current “farming-mining” trends in coal mining areas? This study aims to reveal the land-use change mechanism affected by the stakeholders’ participation in different scenarios and provides a theoretical basis and decision support for land-use modeling, planning, circulation, and conservation in coal mining areas.

2. Data and Methods

2.1. Research Area

The research area comprised two neighboring villages (Qian Yuanji and Hou Yuanji), which were selected as representative regions of the coal mine area located in Shanxi province, China (Figure 1). The region expands approximately 3 km from north to south and 1.9 km from east to west, covering approximately 400 hm2, whereof 180 hm2 has been expropriated by various industrial and mining enterprises. Yuanji Village has nearly 870 households, with a permanent resident population of 2423. Agricultural cultivation is the primary economic activity of most local residents. The main crops include corn, potatoes, and walnuts. The lowest per capita annual income was approximately 5000 yuan (2019).
Large-scale coal mining in Yuanji Village began in 2011 and had been operating for 10 years. Throughout its existence, it underwent a complete life cycle, including exploration, exploitation, and closure. Consequently, coal mining degraded and transformed the original cultivated land and grassland. To gradually restore the damaged landform and vegetation, the enterprise implemented several ecological restoration measures. For example, they built an ecological park in the mining area, planted various trees, flowering plants, and nurseries, developed the local tourism industry, and improved public services.

2.2. Data Sources and Processing

The attributed information of the stakeholders was obtained based on participatory rural assessment (PRA). Local administrative leaders in charge of rural development were interviewed to understand the overall situation of land use in the village, wherefrom a questionnaire was designed according to the actual situation. This was based on the face-to-face interviews that were conducted with a random sample of stakeholders to understand their livelihood capital and willingness to undergo land use transfer. The interview focused on the following four aspects: (1) Basic information about the farmers: total family population, gender, age, health status, income structure, education level, and so on. (2) Information on the farmers’ land use: cultivated land area, land requisition area, cultivated land quality, crop type, and yield. (3) Information on the farmers’ willingness to use land: planting intention, land requisition subsidy, and land requisition intention. (4) Information on coal-related enterprises: production capacity, mineral boundaries, land requisition compensation, development planning, and so on. A total of 250 questionnaires were distributed and collected, of which 236 were recovered. An attribute database of farmers and enterprises was established based on the survey data.
The following data were acquired to support our research (Table 1), and the spatial resolution of these geographic data was 30 m.

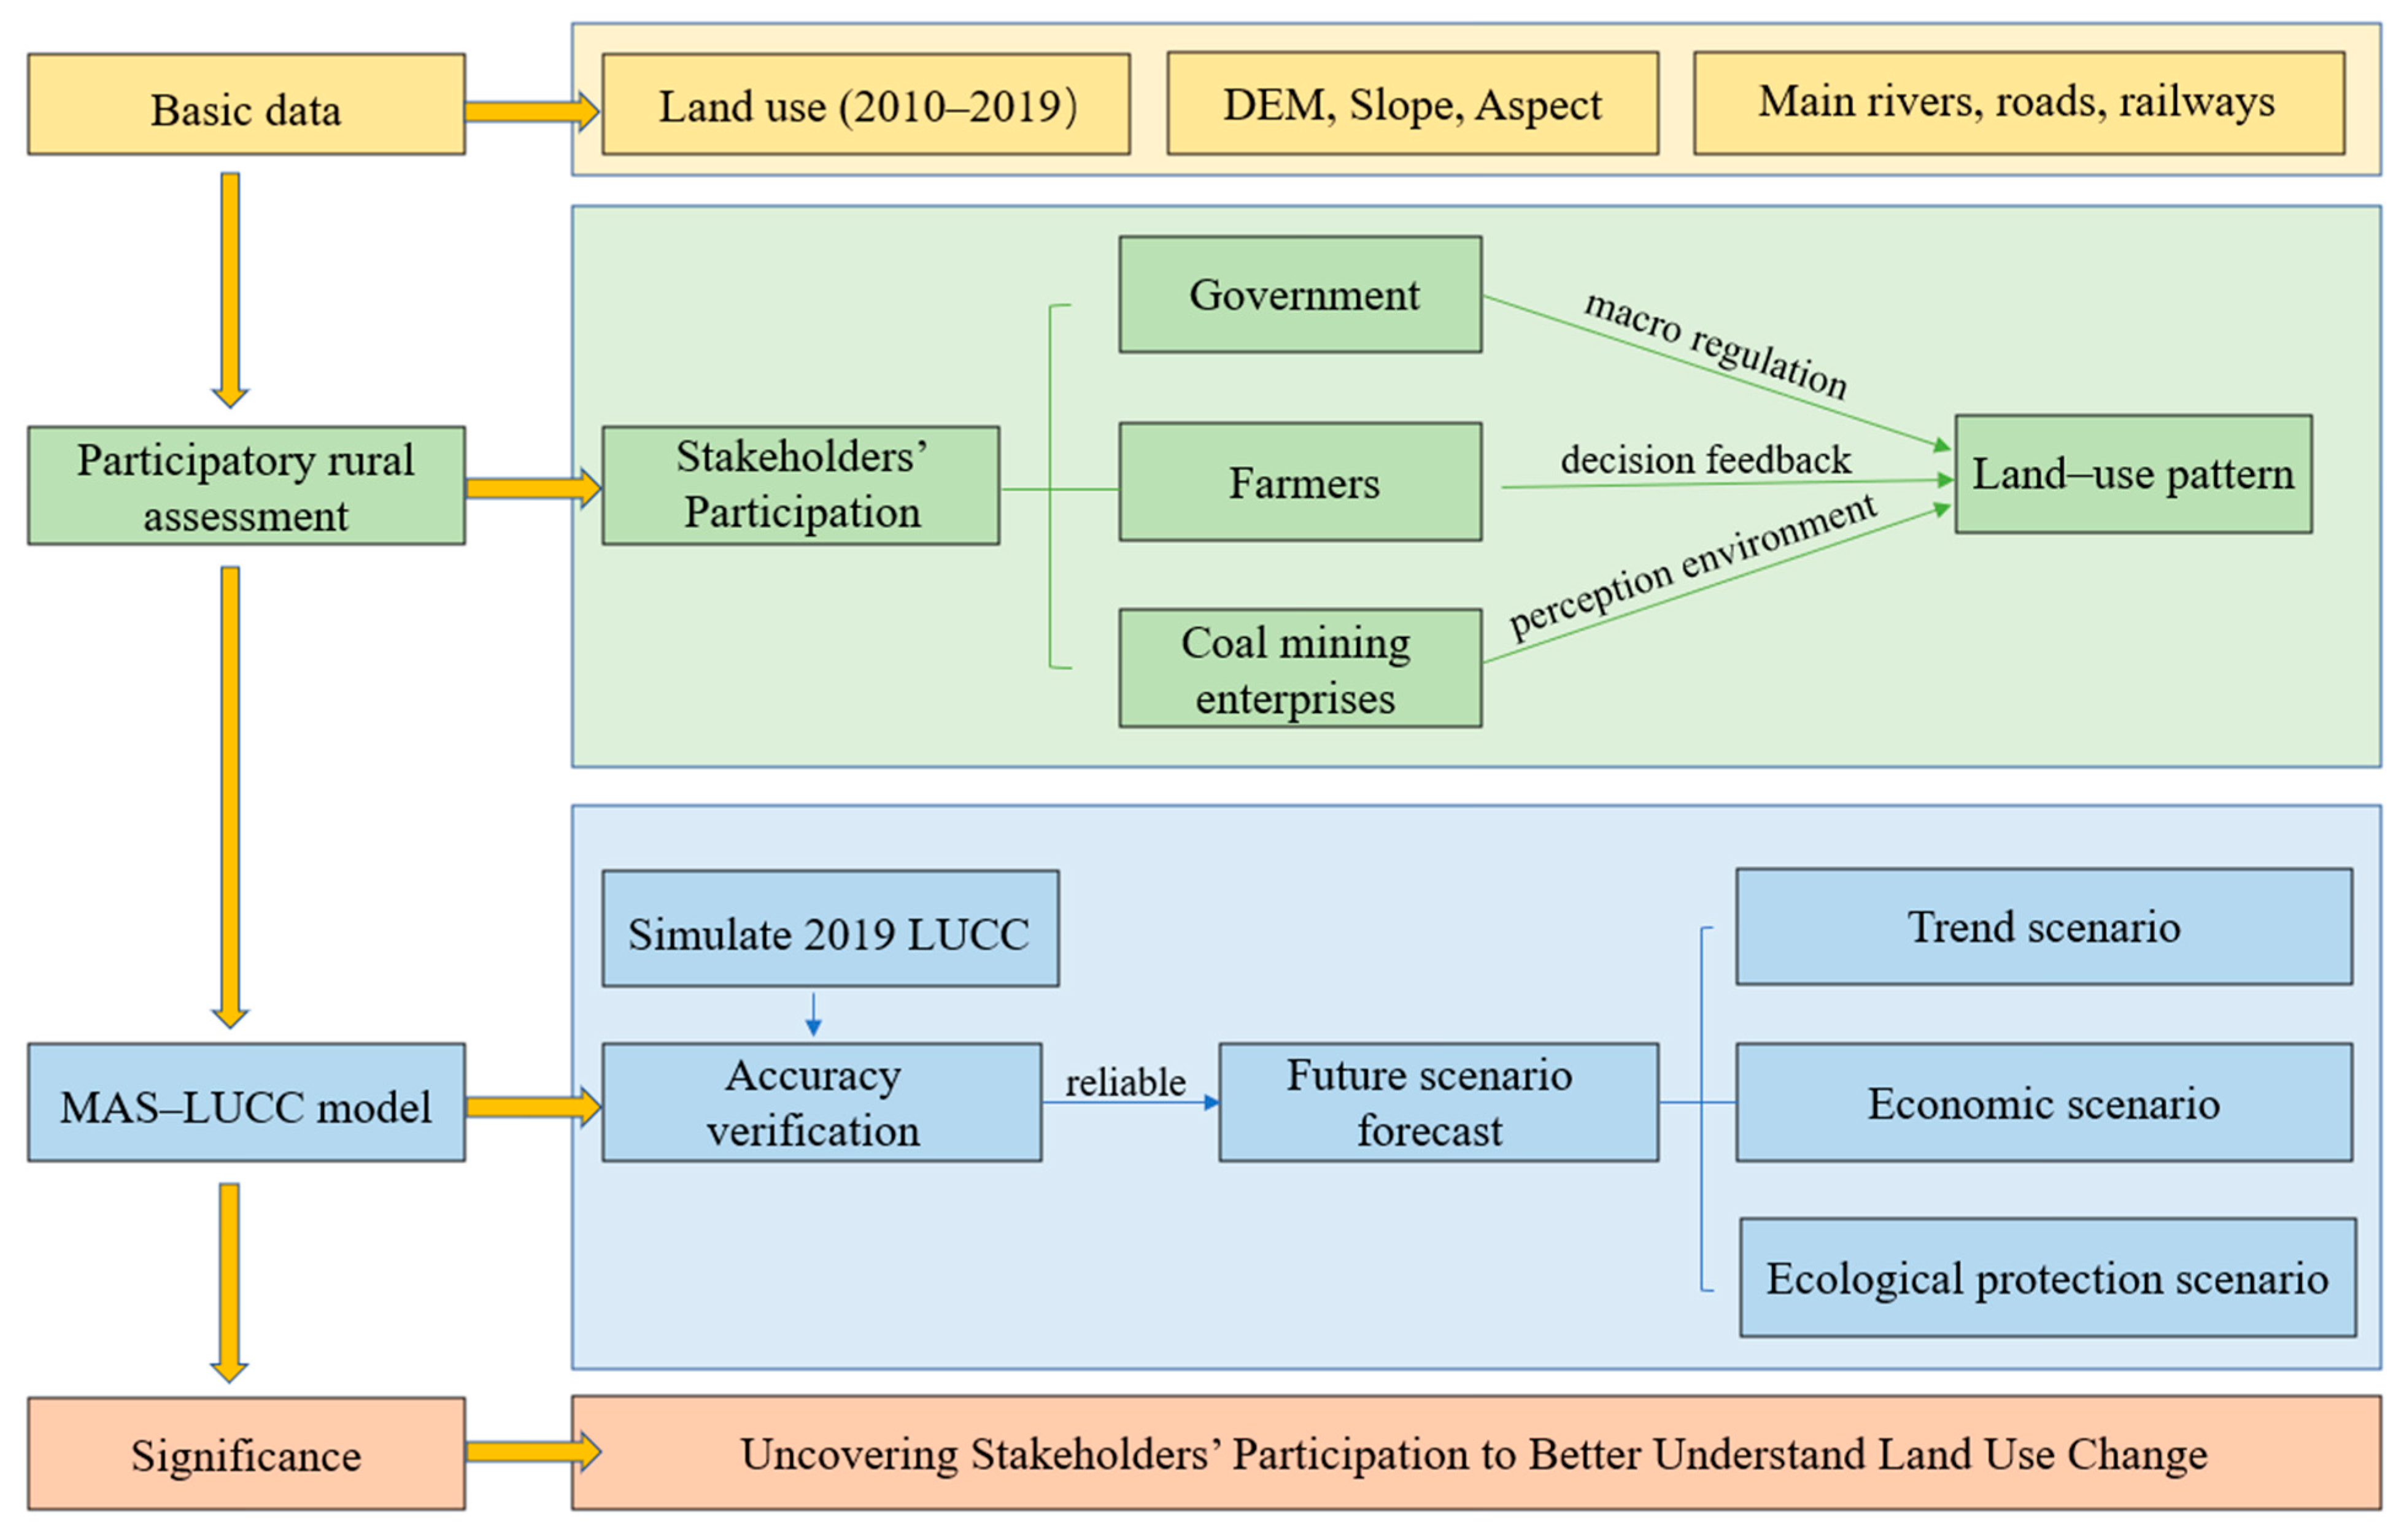
2.3. Multi-Agent Modeling

2.3.1. Multi-Agent Simulation Structure

The multi-agent model (MAS) adopts a bottom-up approach to construct stakeholder individuals with decision-making rights in the real system as agents and establish a model library of individual behaviors and characteristics. MAS interacts with multi-agent and external environments to complete virtual mapping from the entire real world to a multi-agent system [26,27,28,29,30]. In the entire simulation process, the ideal state of the model was that agents could develop in the best direction according to their needs, economic conditions, and policy planning. The comprehensive decision-making of multiple agents constitutes the decision-making mechanism of regional land-use change, which is transformed into behavior output and directly affects land-use types. Once land use type change, LUCC, will changes as a whole. Under the condition of model accuracy verification, different policy scenarios can be set to simulate the development and evolution of regional land-use patterns.
In the case of LUCC in rural regions, these processes comprise the actions and interactions of different stakeholders operating at different levels, which continuously change the structure and composition of the landscape. These stakeholders include farmers, nature conservation organizations, urban developers, and policymakers, among others [31].
In this study, the factors that affect the subjective willingness to land use type change are mainly reflected in the two aspects of enterprises and farmers. Because of the nature of macro-control, the government has become a subject without spatial attributes; therefore, it has not been considered. The framework of the research is illustrated in Figure 2.

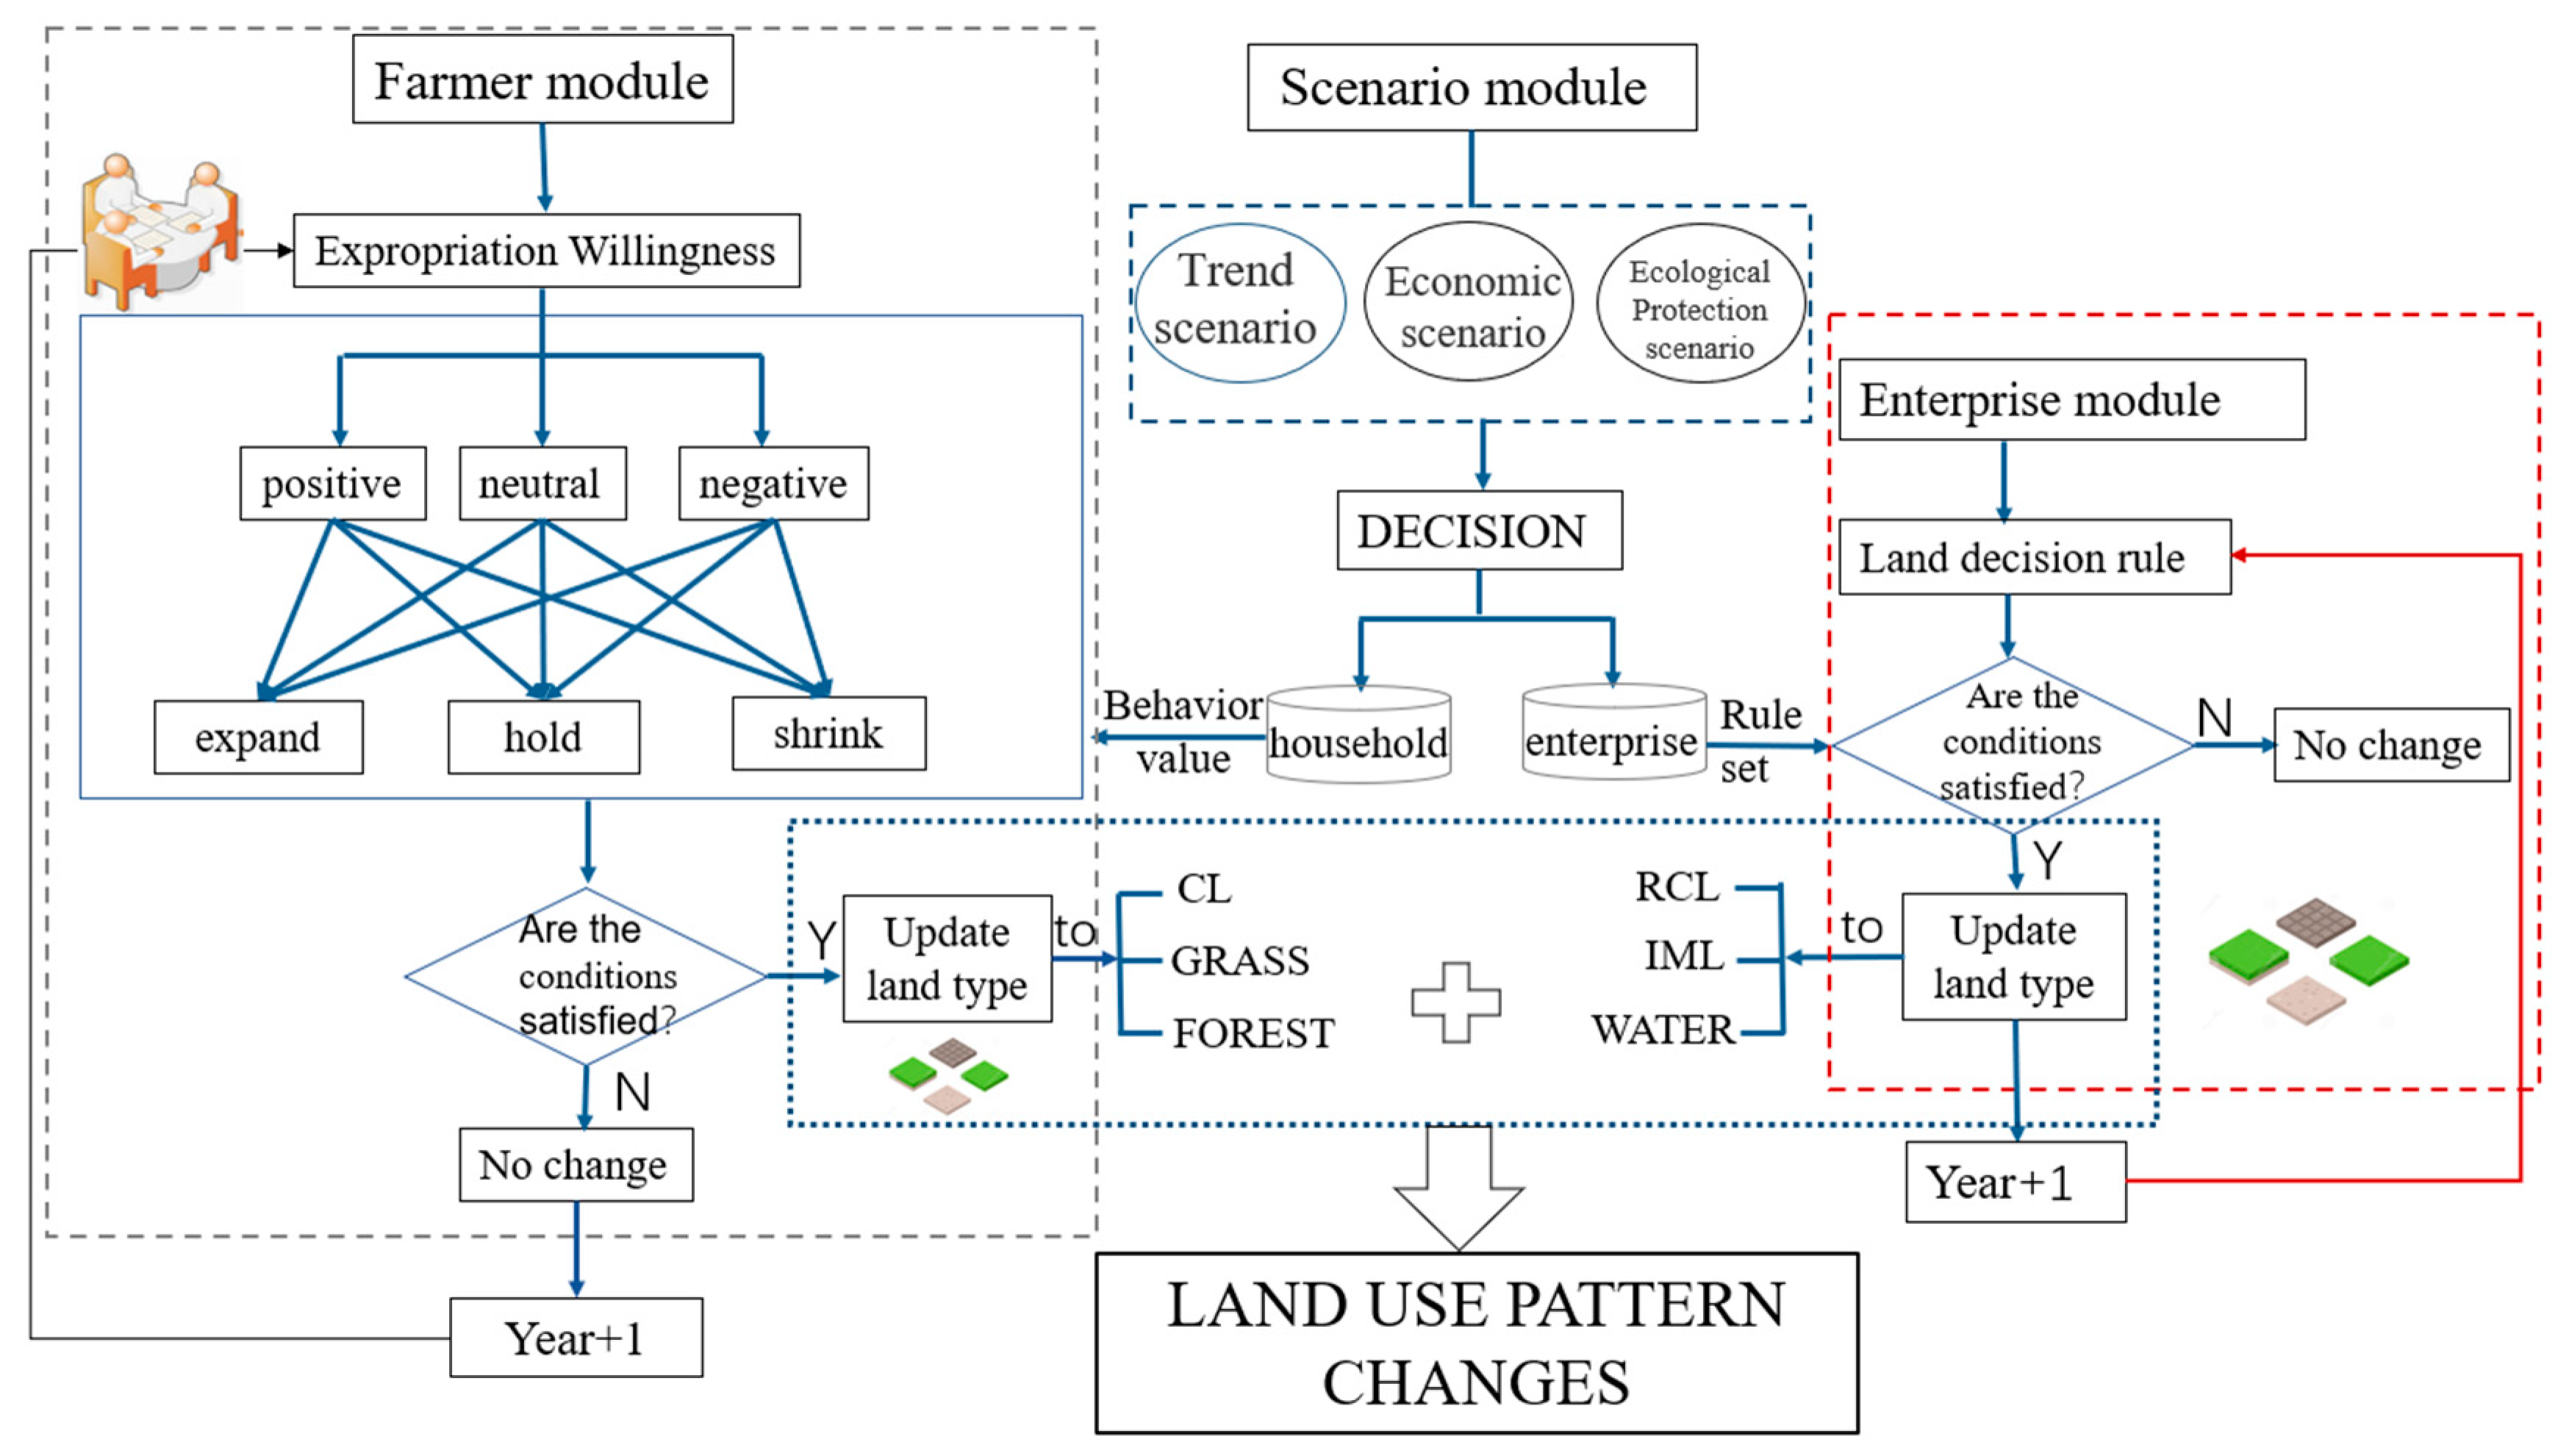
2.3.2. Multi-Agent Land Use Decision-Making Mechanism

The core of agent-based modeling is the design of the agent behavior rules [31]. In this study, we demonstrated how the processes of land-use behavior could be captured and formalized in rules and equations. Each decision process is expressed in a probability between 0 and 1.
The MAS- LUCC model framework of Yuanji Village was constructed based on the acquired data (Figure 3). The model framework comprises three parts: the farmer, enterprise, and scenario modules. Each agent makes spatial decisions on its patches under the influence of its own conditions and external environmental factors to obtain the decision-making preferences of farmers and enterprise agents on each patch.
(1)
Farmer module
The farmers’ willingness to acquire land is the criterion for their spatial decision-making. According to the previous research results, we selected the key factors that affect a farmer’s willingness to cultivate and calculated the weight coefficients of each factor by using an analytic hierarchy process and fuzzy comprehensive evaluation method to express the impact on the farmers’ willingness to cultivate. The specific calculation formula of the farmers’ behavior decision probability is as follows:
d w i l l i n g n e s s = k = 1 5 ( w k · i k )
where d w i l l i n g n e s s is the behavior decision probability of farmers,   w k is the weight of the household influencing factor k,   and   i k is the value of influence factor i.
The farmers’ willingness to farm influenced land decision-making behavior, which depended on whether the conversion probability of the parcel was consistent with the conversion threshold. If the conversion probability of the plot was greater than the threshold, the plot changed according to the farmers’ land-use decisions; otherwise, the land type of the plot did not change. This rule is reflected in Equation (2). In actual research, the difference in the farmers’ willingness to acquire land is mainly reflected in the difference in the conversion threshold. Under the decision-making effect of the probability selection of all the farmers’ agents, the regional land-use pattern changes. The interannual change in the farmers’ willingness to acquire land affects the decision probability of farmers in different years and then continuously adjusts the behavior decision matrix of the whole model. Under the ownership relationship between the farmers and land, the land pattern of the research area constantly changes with subsequent decisions.
L U C C =   P i   g r a s s l a n d > P c d , P i = g r a s s l a n d P i   f o r e s t l a n d > P l d , P i = f o r e s t l a n d P i   r u r a l   c o n s t r u c t i o n   l a n d > P n c j s y d , P i = r u r a l   c o n s t r u c t i o n   l a n d P i   i n d u s t r i a l   a n d   m i n i n g   l a n d > P g k y d , P i = i n d u s t r i a l   a n d   m i n i n g   l a n d P i   w a t e r   a r e a > P s y , P i = w a t e r   a r e a
where LUCC is the transformed land-use type. Pi cultivated land, Pi grassland, Pi forestland, Pi rural construction land, Pi industrial and mining land, and Pi water area represent the land types corresponding to the ith plot of farmers, the probability of the cultivated land, grassland, woodland, residential land, industrial and mining land, and water area, respectively. Pgd, Pcd, Pld, Pncjsyd, Pgkyd, and Psy represent the conversion probability threshold values for the cultivated land, grassland, woodland, residential land, industrial and mining land, and water area, respectively. Pi = cultivated land, Pi = grassland, Pi = forestland, Pi = rural construction land, Pi = industrial and mining land, and Pi = water area represents the farmers’ land parcel i that was transformed into cultivated land, grassland, forestland, rural construction land, industrial and mining land, and water area, respectively.
(2)
Enterprise module
The individual and economic characteristics of enterprises affect their expansion decision-making behavior. In other words, the decision of whether to increase or decrease the scale of the enterprise land or move the enterprise to other places affects the change in land use. According to the survey results, the main factors affecting the transformation of enterprise land types were mineral income, coal production, convenient transportation, altitude, and slope. Enterprises adjust their investment development strategies according to the interaction of these factors. The land type conversion rule of enterprise agents is determined by the development probability and proportion of industrial and mining land. The specific calculation method is as follows:
U i , j r t = α T i , j t + β R i , j t + γ P i , j t + δ I i , j t + ε
P i , j e t = P i , j e t U i , j r t U i , j r t = e x p U i , j r t m = 1 , n = 1 m , n e x p U i , j r t
where U i , j r t represents the land utility value of the land unit (i,j) at time t. T i , j t ,   P i , j t ,   R i , j t ,   and   I i , j t represent the distance from the land unit to the road, the distance from the residential area, population density, and production capacity, respectively. α ,   β ,   γ ,   and   δ are the weight coefficients of each influencing factor. ε is a constant. P i , j d t is the probability that land unit (i,j) and is selected as industrial and mining land.
(3)
Scenario module
Scenario analysis is defined as a method to predict the possible situation or consequences of a forecast object on the premise that a certain phenomenon or trend will continue in the future. Scenarios have been increasingly used to address environmental and land use issues via stakeholder participation [32]. The scenario design describes the comprehensive consideration of human and environmental systems, which is a balance between qualitative and quantitative methods. Region-specific scenarios were simulated in an agent-based model incorporating rural farmer characteristics, and the driving factors were analyzed and adjusted according to the characteristics of regional development to highlight the spatial development trend of the study area under different strategies and policies. Three ‘what-if’ scenarios were built: a “trend scenario” (Scenario 1), a “large-scale resource development scenario” (Scenario 2), and an “ecological protection scenario” (Scenario 3).
Scenario 1: This does not change the current driving factors of land use change in the study area. The simulation rules for this scenario were constructed according to the statistical data of 2019, which do not involve economic and ecological policies. The trend of land use change in Yuanji Village in 2026 was simulated according to the trend of the land use change from 2012 to 2019.
The main goal of Scenario 2 was to promote the rapid growth of the regional economy. According to the development trend of industrial and mining land in Yuanji village from 2012 to 2019, the enterprises increased their compensation for land requisition and constantly expanded industrial and mining land. At this time, the land development pattern does not consider the occupation of agricultural land. It adheres to the principle of economic construction and development as the center and pays less attention to landscape protection and environmental sustainability.
Scenario 3 focused on resource and environmental management. In this scenario, management aimed to avoid the loss of labor force, guide farmers to return home to their plants, encourage villagers to participate in the construction of local agricultural projects, provide various employment for villagers, and conduct free training and professional guidance to help villagers learn modern agricultural skills. Therefore, a large number of grasslands and woodlands were converted into cultivated land. In addition, under this policy, enterprises actively adjusted the industrial structure, reduced the occupation of agricultural farmland, conducted large-scale surface restoration and afforestation in coal mining areas, developed characteristic and leisure agriculture, extended the agricultural industrial chain, improved the rural ecological environment, and realized the sustainable development of the rural economy.

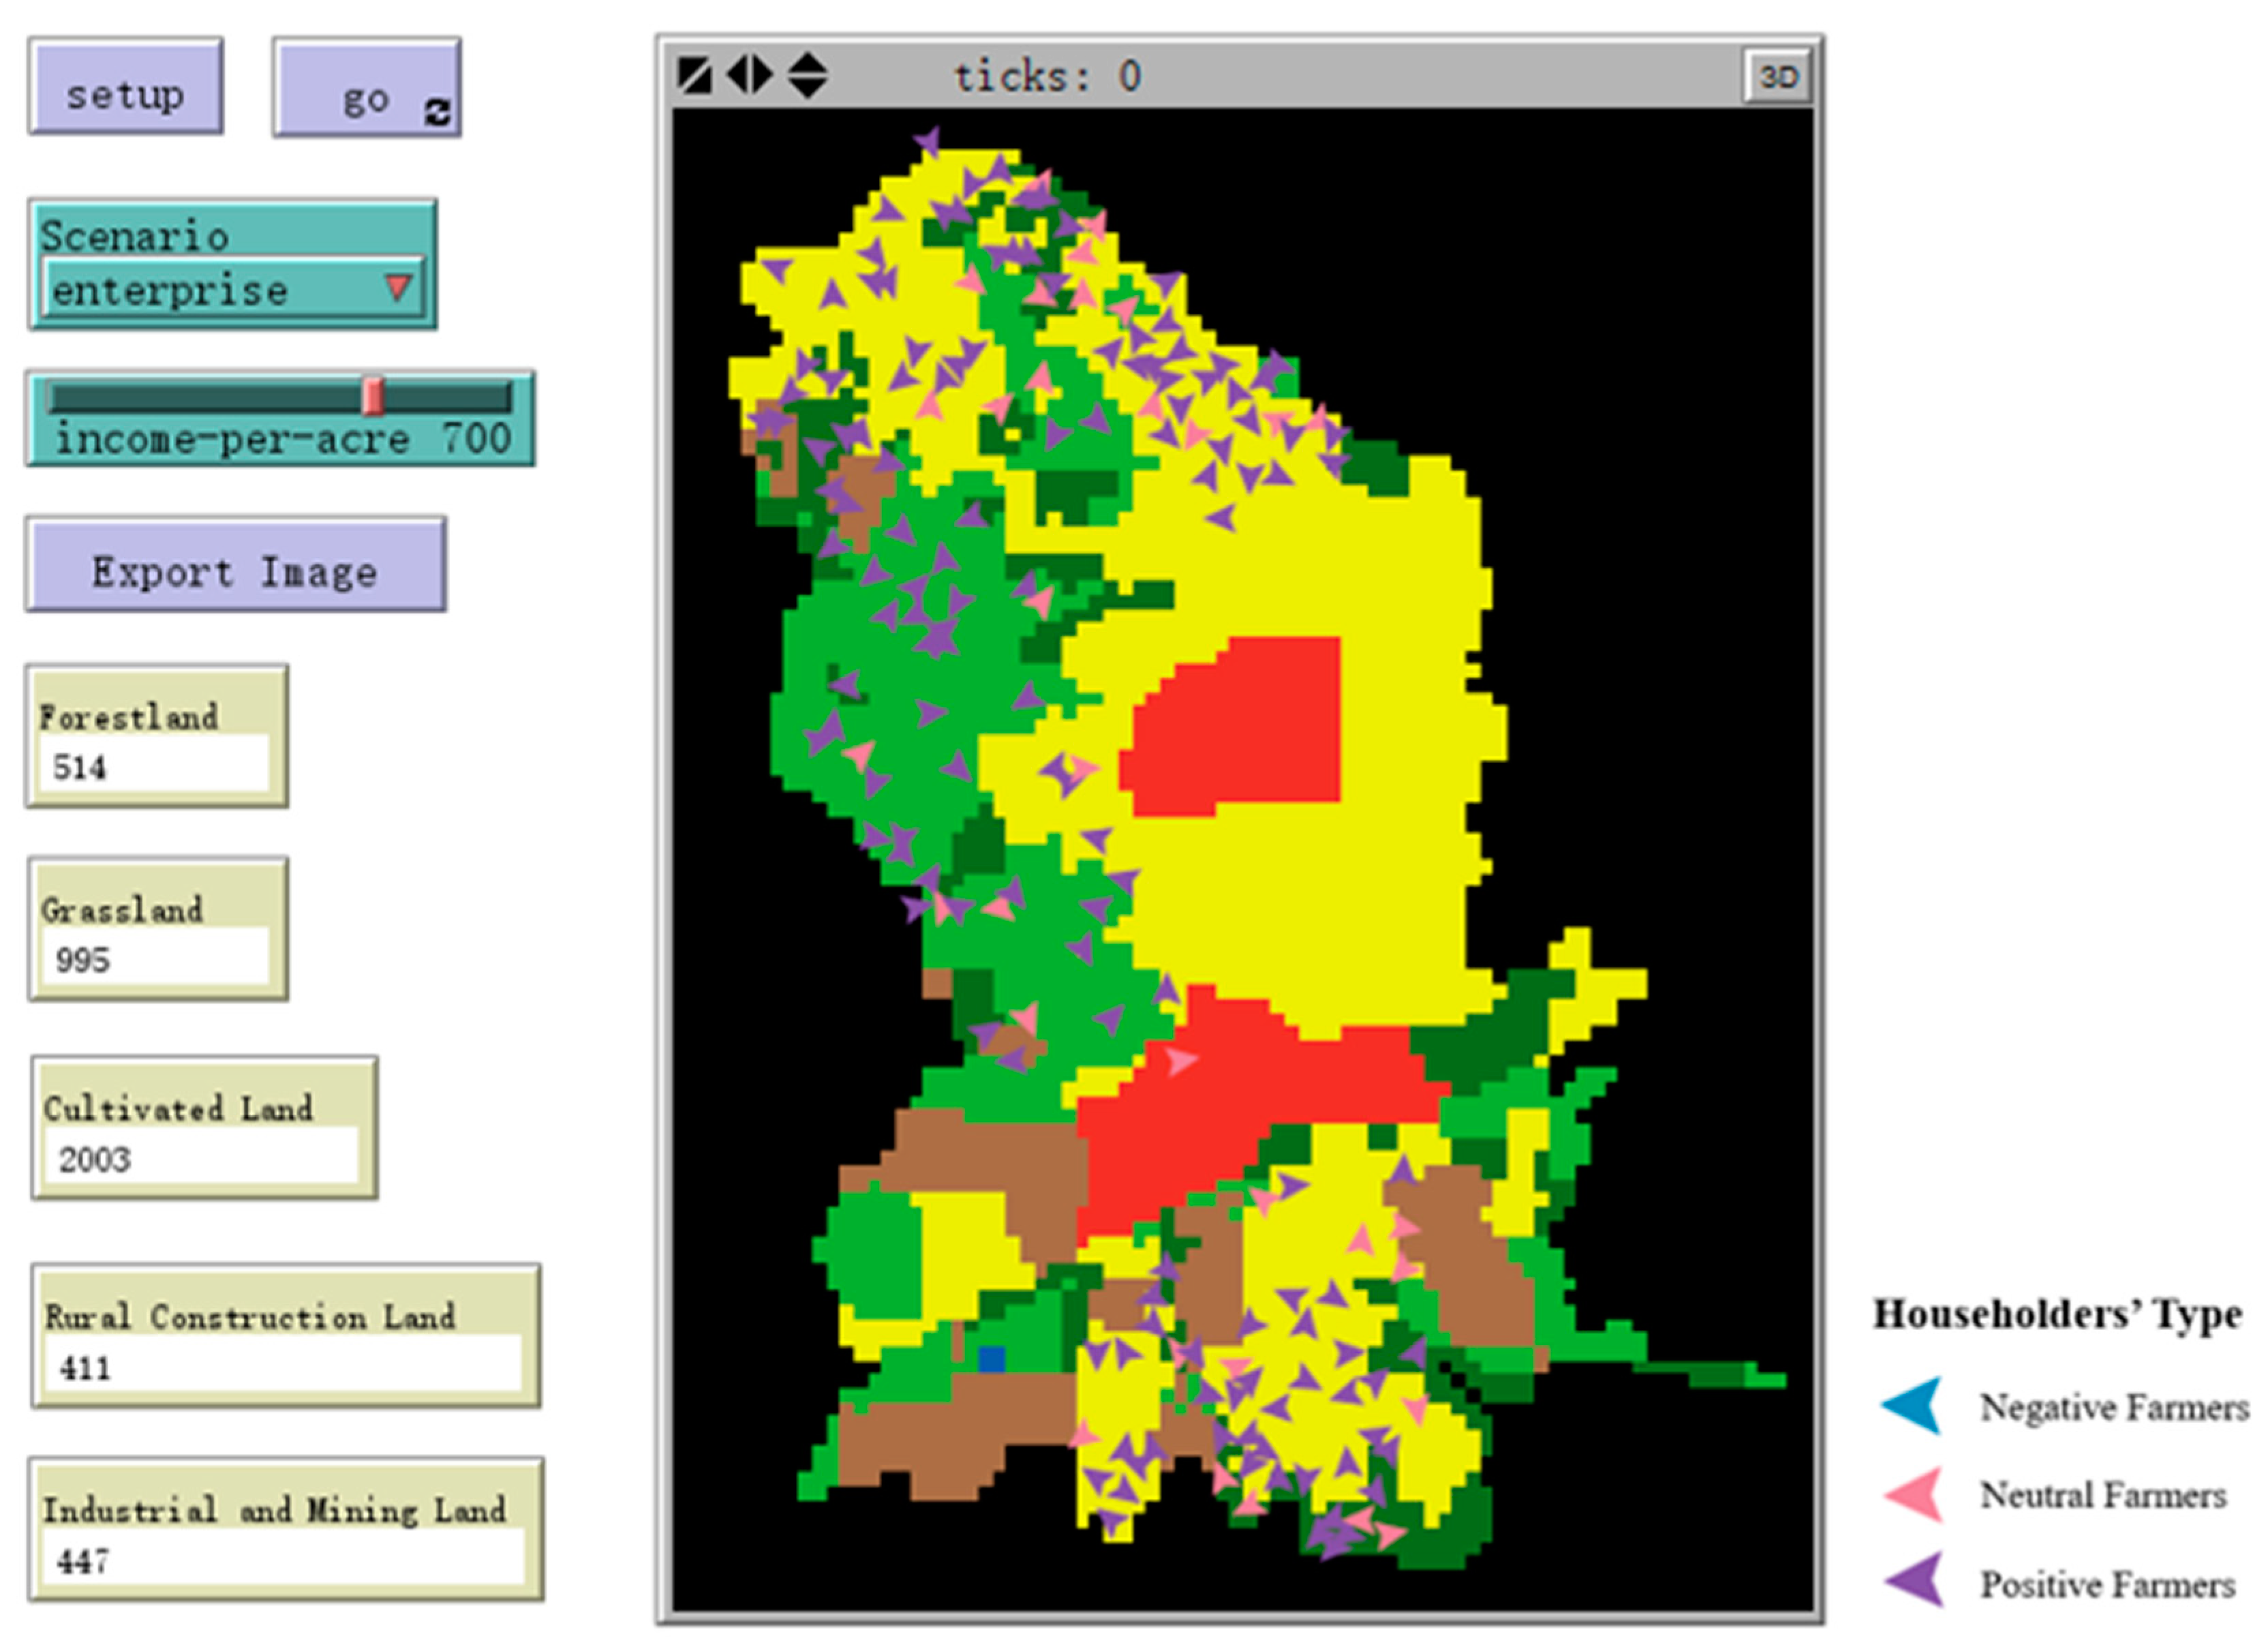
2.3.3. Model Implementation and Statistical Tests

The realization of a multi-agent model requires the establishment of a controllable artificial experimental environment using the Netlogo software platform. Netlogo is based on the concept of the complex applicable system theory (CAS) [33]. It is a programming environment suitable for modeling complex systems that evolve over time. It can be used to simulate both natural and social phenomena. The MAS-LUCC in this study was modeled using discrete time intervals.
The processed and converted basic data were imported into the model. In this study, the existing situation of land use in 2012 was taken as the initial state of the model, and the initial states of various land types were input into the model in the form of patches. The cells in the grid represent 30 m. Each step was equivalent to one year. The simulation period was 2012–2019. The agent of the model and its decision behavior rules were constructed by programming on the program page. The land use change in Yuanji Village in 2019 was simulated by setting ticks. The model uses random rules with limited space to create newly generated farmer-owned lands. According to these rules, a state variable is given to represent newly generated farmers, and the corresponding land location and specific land use types are randomly matched within the village boundary. The initial filling of each type of agent and attribute parameters to be explored in the model were set. To perform scenario analysis, repeated simulations under different constraints need to be performed to obtain the dynamic simulation results of different land use patterns (Figure 4).
High credibility is the premise of the development and application of the model, and the simulation results of the multi-agent model must be tested. Although uncertainties accumulate during a simulation run, a large number of agents within the model and multiple simulation years lead to a partial cancellation of random errors. This study used the point-by-point comparison method to evaluate, in more detail, which conversions were simulated correctly and to compare the simulated land use pattern with the actual interpretation image to verify the simulation accuracy of the model. The actual land use classification map for 2019 was compared with the simulated land use classification map for 2019, and the Kappa coefficient of each category was calculated.
The Kappa coefficient was calculated using the IDRISI software to test the fitting degree of the land use simulation results and the actual interpretation image. The Kappa coefficient was calculated using the IDRISI software to test the fitting degree of the land use simulation results and actual interpretation. The formula is as follows. The calculation results were divided into five groups to show the consistency of different levels: 0.0~0.20, extremely low consistency, 0.21–0.40, general consistency, 0.41–0.60 medium consistency, 0.61–0.80, high consistency, and 0.81–1 almost completely consistent. The calculation formulas are shown in Equations (5) and (6).
  K = P 0 P c 1 P c
P O = s n ,   P c = a 1 * b 1 + a 0 * b 0 n * n
where n is the total number of pixels; a0 and a1 are the number of pixels with real grid values of 0 and 1, respectively; b0 and b1 are the number of pixels with simulated grid values of 0 and 1, respectively; and s is the number of pixels with the same corresponding pixel value in the two images.

3. Results and Analysis

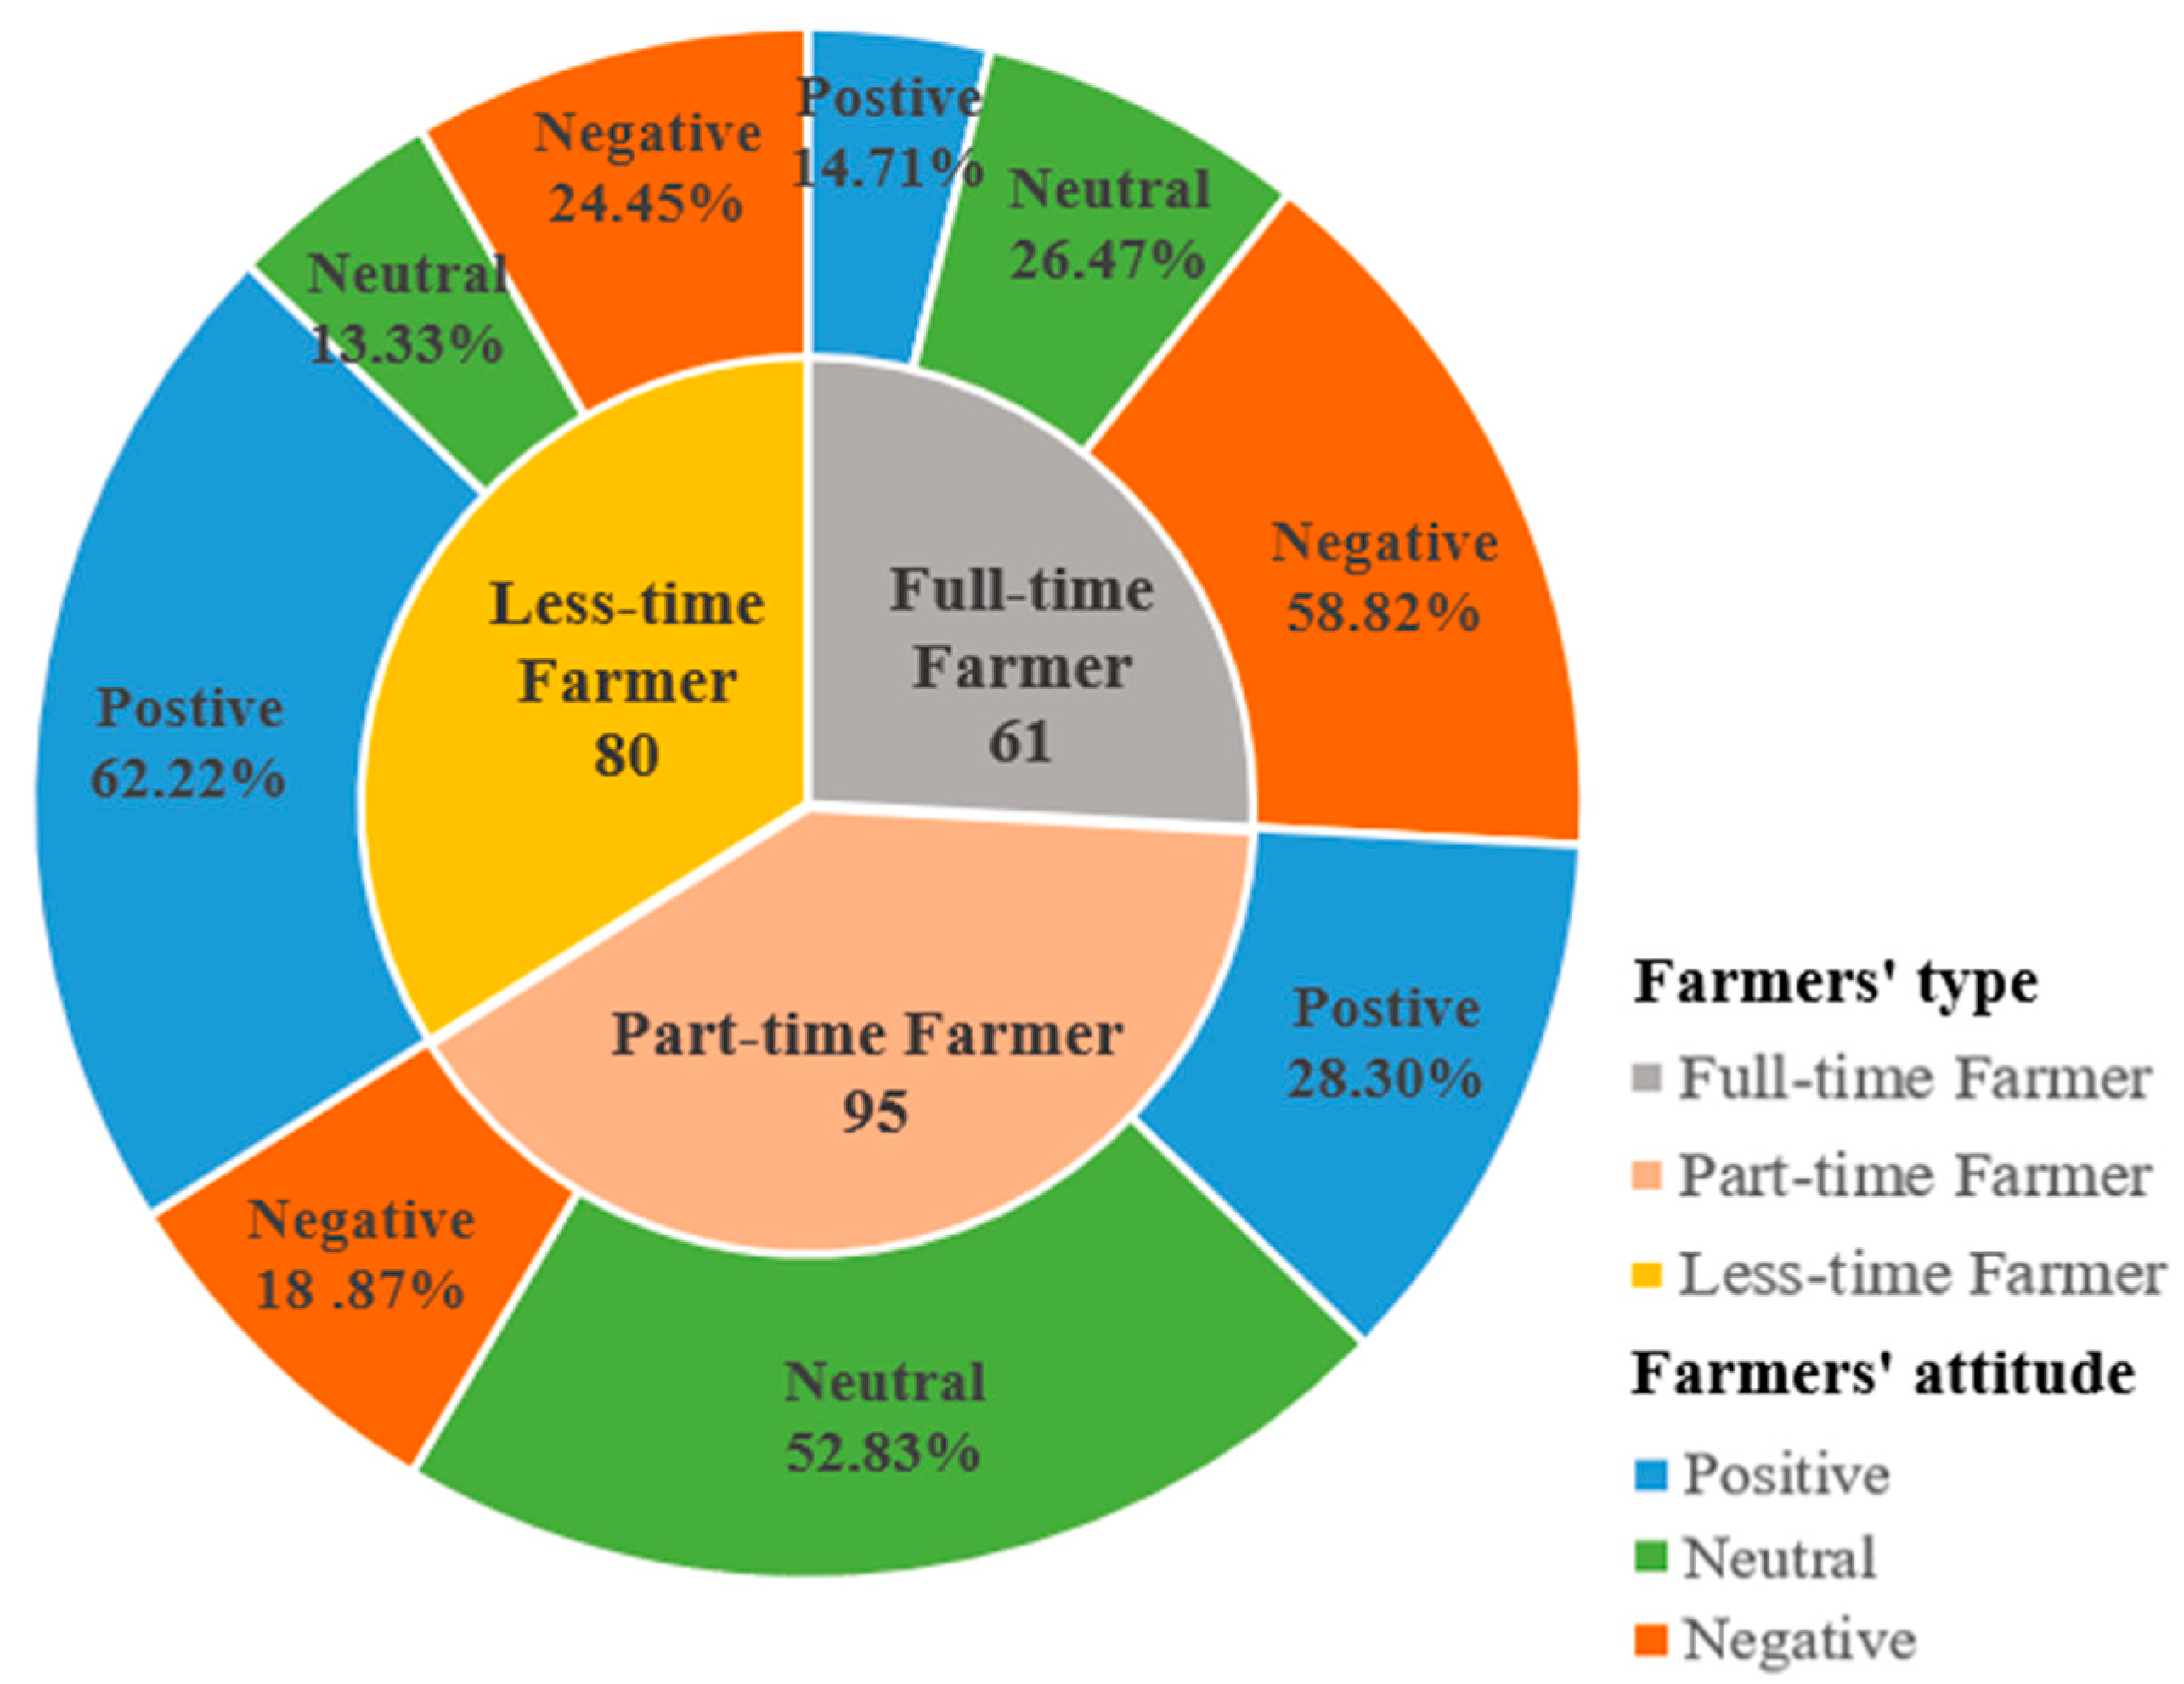
3.1. The Attitude towards Land Requisition of Farmers with Different Livelihood Types

The attributes of each stakeholder should be defined ideally. There are a lot of difficulties in verifying the specific information of each farmer in practice. The information of some local farmers was collected based on the PRA survey to represent the heterogeneity of farmers in the study area. Farmers of the same type have similar livelihood characteristics and behavior trajectories.
The sample households were classified according to their livelihood sources and mainly divided into three types (Figure 5). Among the 236 farmers surveyed, 26% are full-time farmers, and agricultural income accounted for more than 80% of the total income. A total of 40% of the farmers were part-time farmers who had additional sources of income such as breeding, local specialty sales, etc. The remaining 34% of the farmers had more diverse sources of income in addition to agricultural income and spent the least time in agricultural activities. Agricultural income accounts for less than 20% of the total income.
The farmers were divided into three further levels according to their attitude towards land requisition based on PRA. The farmers who approved land requisition with a positive and flexible attitude were classified as a positive type, and those who firmly opposed land requisition were classified as negative farmers. The remaining farmers who had an ambiguous position towards land requisition were classified as neutral farmers. Among the full-time farmers, 58.82% opposed land requisition, 26.47% were neutral farmers, and only 14.71% were supportive farmers. Among the part-time farmers, negative farmers accounted for 18.87%, neutral farmers were 52.83%, and positive farmers were 28.30%. Among the less-time farmers, there were many supportive farmers, accounting for 62.22%, negative farmers at 24.45%, and neutral farmers at 13.33%. There are significant differences among the different types of farmers in terms of land requisition willingness (p < 0.05). Part-time farmers rather than full-time farmers were in favor of farmland requisition.
The farmers’ attitude to land requisition was affected by livelihood capital to varying degrees. In order to identify the key influencing factors in the process of land requisition, the accurate simulation of the complex mechanism between the farmers’ attitude towards land requisition and LUCC change served for further model construction; the multinomial logistics regression model (Table 2) was used to analyze the impact of livelihood capital for different types of farmers on the choice of land requisition attitude. We found that the labor capacity (p < 0.05), cultivated land area (p < 0.05), cultivated land quality (p < 0.05), agricultural income (p < 0.05), and land requisition subsidies (p < 0.05) were the significant factors which influenced farmers’ attitude towards land requisition. Incorporating these elements into the MAS-LUCC model could promote a more accurate simulation of land use change in mining areas.

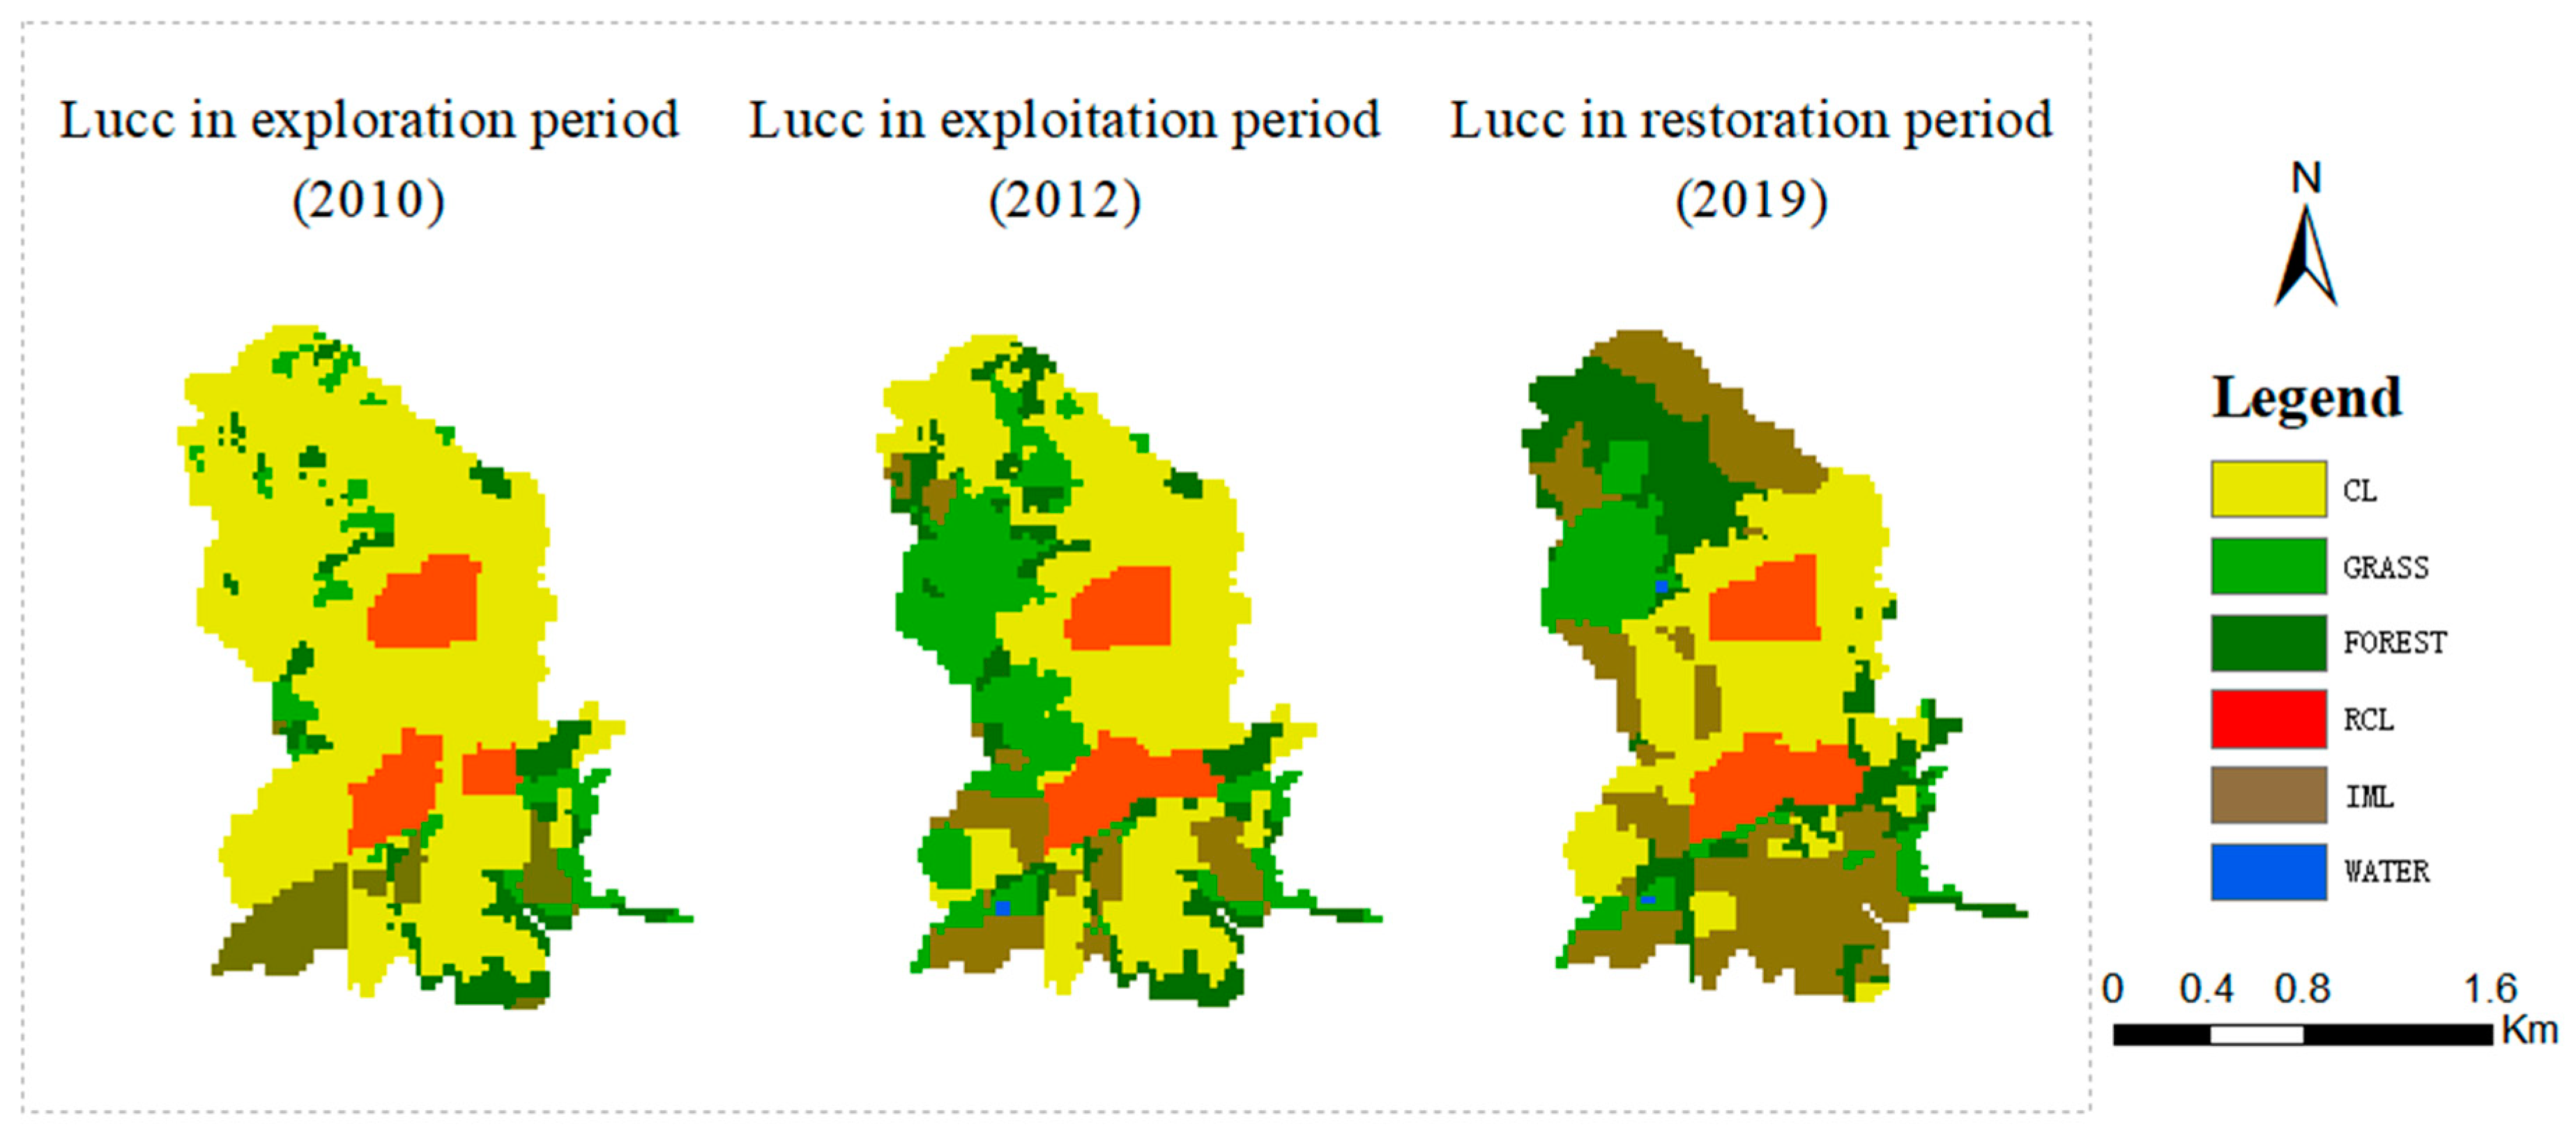
3.2. The Land Use Change Arising from Stakeholders’ Decision-Making Behavior

Although there are differences in the farmers’ attitudes towards land requisition in Yuanji village, most of them hold a positive attitude. Farmers’ attitudes lead to certain decision-making behaviors, which can also affect the land use pattern of mining areas. This is an internal feedback mechanism that makes future LUCC in coal mining dependent on farmers’ previous actions. The field study shows that mining activities in Yuanji Village originated in 2012 and experienced a period of exploration, exploitation, and restoration. The farmers’ decision-making behavior in different periods has given rise to the dynamic changes of the LUCC in coal mining. The process of farmland cessation, farmland expansion, and farmland diversification are shaping the structure of the landscape in the coal mine areas.
We applied a participatory rural assessment to obtain the decision-making behavior of stakeholders and selected and interpreted remote sensing images from 2010, 2012, and 2019, which represent the different coal mining life periods. We found that the trajectory of the land-use behavior of stakeholders in the study area showed phased changes (Table 3).
At the beginning of the life cycle of coal mining (before 2011), the main body of regional land use comprised farmers, and their livelihood was mainly agricultural production. Correspondingly, cultivated land is the most dominant land type, which is throughout the entire region, whereas the area of forest land and grassland is poor, and the spatial distribution is relatively scattered.
During the exploitation stage (2012–2017), with the development of mining activities, enterprises began to expropriate agricultural land on a large scale. The behavior choice of farmers in Yuanji village gradually changed from a completely agricultural livelihood to accepting land requisition so as to obtain a higher compensation value with land resources. Local farmers turned to more diversified livelihoods, such as abandoning traditional agricultural farming methods and becoming miners and industrial workers due to land requisition. At this stage, high-quality cultivated land was gradually requisitioned, agricultural land continued to shrink, and industrial and mining land expanded rapidly.
During the ecological restoration period (after 2018), the phenomenon of recessive unemployment in agriculture was prominent; farmers began to learn modern agricultural skills, and the livelihoods of the local farmers became more diversified. Furthermore, the enterprise entered a stage of transformation and development. In order to balance resource development and environmental protection, the enterprise has carried out ecological restoration in the mining area, reclaimed and restored the land and vegetation in the mining area, and built an ecological park to greatly improve the living environment. At this stage, although industrial and mining land is still occupying and expanding to high-quality cultivated land, the speed has slowed down. The change in the rural land use pattern shows an increase in forest land, grassland, and water area and a decrease in industrial and mining land.
The land use pattern presented by the remote sensing images of the mining area in the corresponding period is consistent with the above description (Figure 6). Figure 6 and Table 4 show the land-use distribution patterns during the three periods. Affected by the agents’ decision-making, the land use pattern of Yuanji village has changed dramatically.

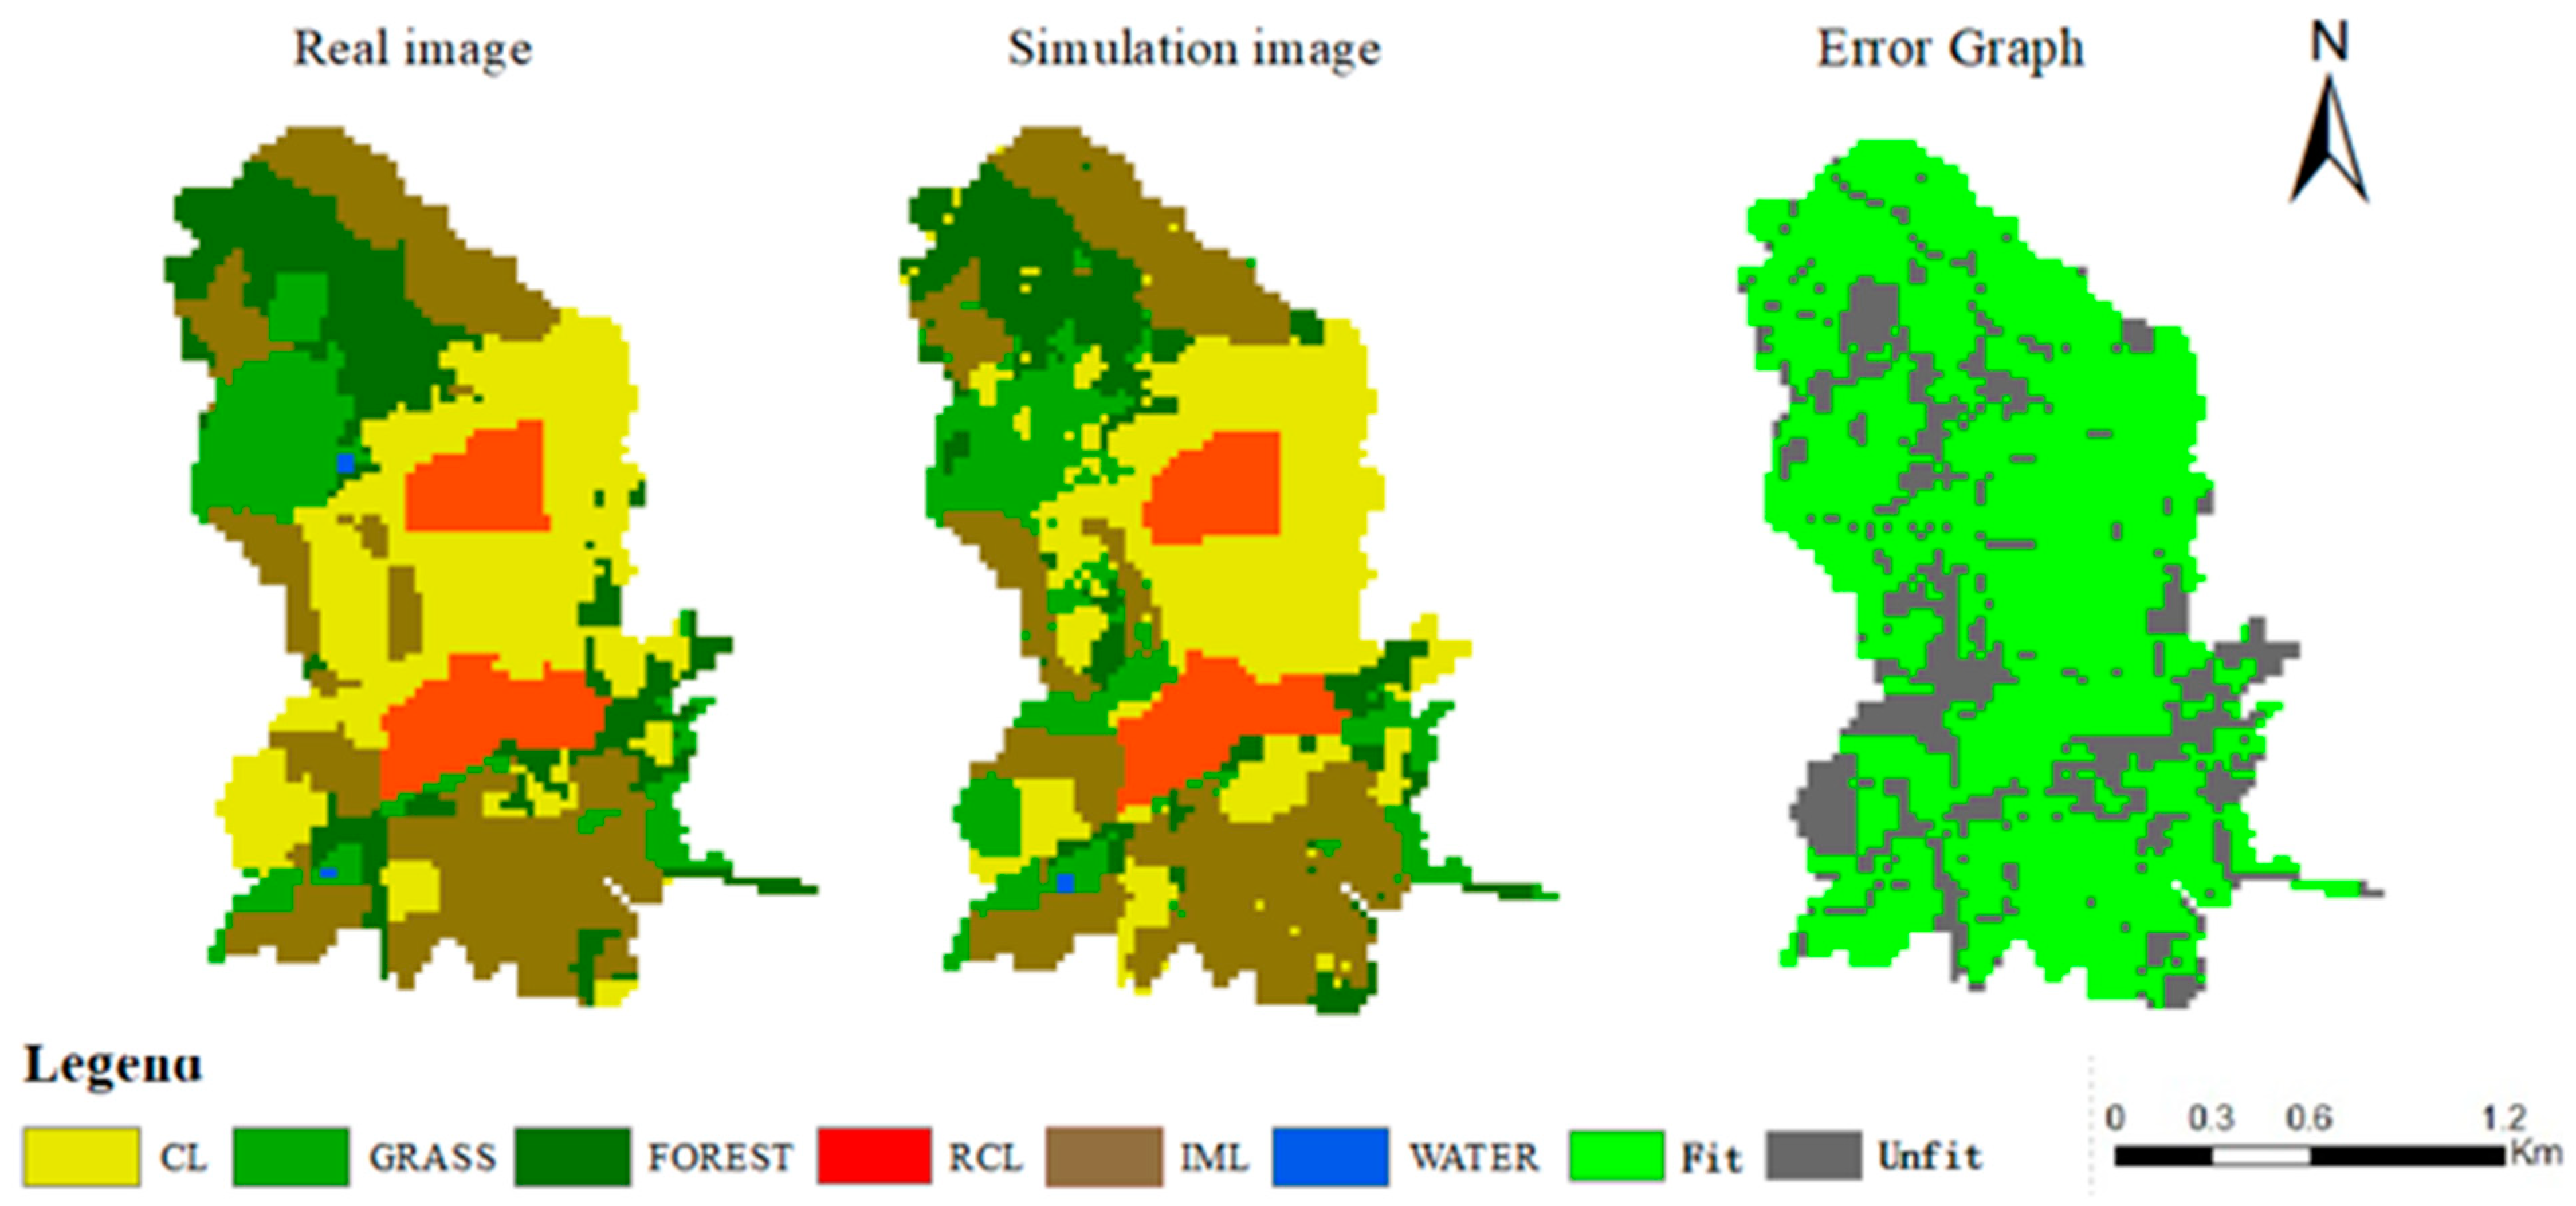
3.3. Construction and Accuracy Verification of the Multi-Agent Model

The livelihood capital of each farmer was obtained based on the PRA results, and the farmers’ livelihood capital and farmers’ decision behavior coupling database was further established. According to the results of logistic regression analysis, we chose the appropriate variables to calculate the farmers’ willingness and decision-making behavior of land requisition, which could directly lead to a change in the plot status.
Different analyses indicated that attitudes towards land requisition differed significantly by the type of farmers (Figure 7). From the farmers’ willingness for land requisition, with d w i l l i n g n e s s being the willingness range of the farmers, we obtained the values of the positive farmers as concentrated above 0.7, while the values of neutral farmers are between 0.2 and 0.7, and the values of negative farmers are below 0.2. Based on the calculation of the farmers’ willingness towards land use, we determined that setting the boundary of farming willingness to between 0.2 and 0.7 could provide better simulation results. An “agents-LUCC” coupling database was established based on the results.
The farmers’ willingness led to certain actions, which could also affect their future options and decisions by changing their internal factors. Farmers in the study area presented differences in land use decisions (Figure 8). Among the farmers who decided to expand their land, the farmers who opposed land requisition accounted for the majority. On the contrary, most farmers who took a positive attitude towards land requisition chose to reduce their land or even stop farming.
Guided by various geographical and environmental impact factors, we selected farmers and enterprises as decision-making subjects, quantified the decision-making rules of the agents, and built a mining area land-use pattern evolution model based on multi-agent collaborative control rules in the virtual simulation platform Netlogo. Taking 2012 as the base year, the land use pattern of Yuanji Village in 2019 was simulated by the LUCC model and was constructed with 10 steps per year.
The high reliability of the model is the premise for subsequent forecasting. To verify the accuracy and feasibility of the model, the simulation results for 2019 were compared with the land-use remote sensing interpretation results (Figure 9). The general distribution positions of the various land-use types on the two maps were essentially the same. The simulation situations of construction land, rural cultivated land, and industrial and mining land agree with the actual situation, while the simulated land patches of woodland and grassland are more fragmented.
We performed a superposition analysis of the land use simulation results in 2019 and interpreted the actual land use status data according to remote sensing images, and further compared them point by point. The simulation accuracy of the cultivated land, grassland, rural construction land, and industrial and mining land was over 65%, whereas the fitting effect of the forest land and water area was weak to such an extent that it needed to be further improved. The overall accuracy was 76.31%, and the model results were credible.
A more detailed verification was conducted, in which the Kappa coefficients of each land use type were calculated to further test the model accuracy, which was consistent with the results of the superposition analysis. (Table 5) The results demonstrate a 0.83 overall Kappa coefficient with high consistency, indicating that the multi-agent model constructed in this study is adequately applicable for simulating land use patterns in Yuanji Village.

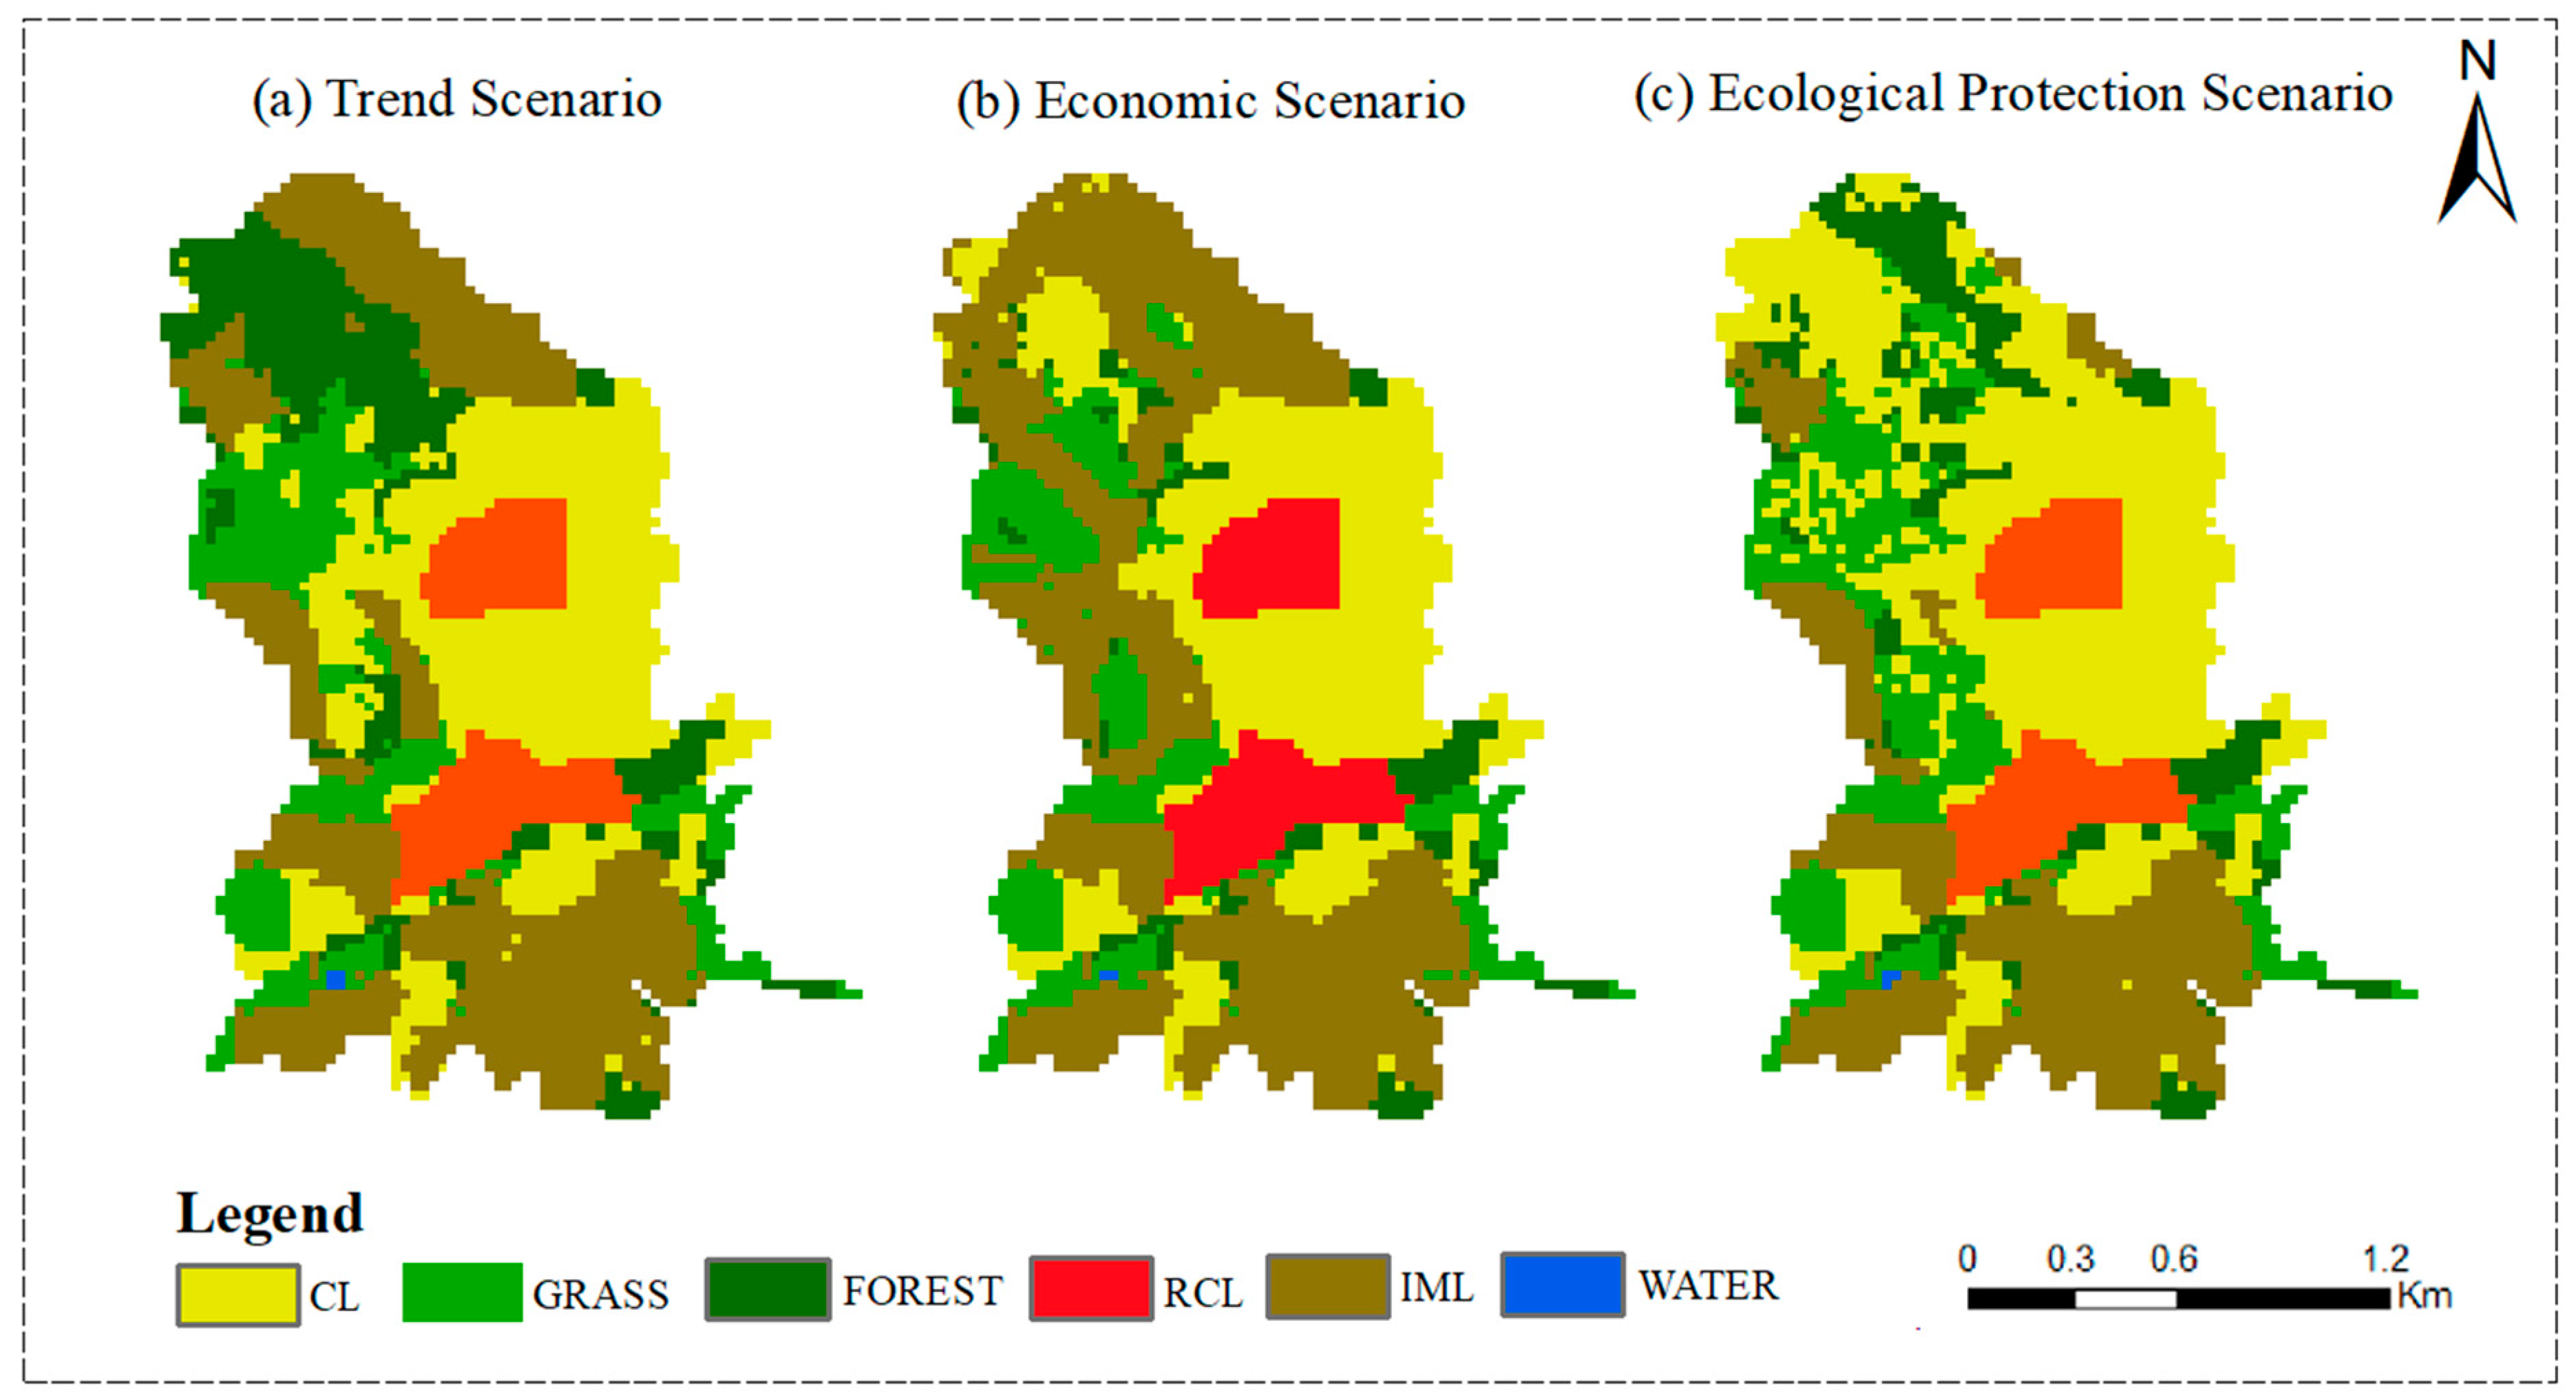
3.4. Future Land Use Pattern under Different Simulation Scenarios

Three ‘what-if’ scenarios were built by setting different scenario development models and parameters. We simulated the results of the spatial-temporal dynamic change in land in 2026 and performed a comparative analysis in terms of quantity and spatial change (Figure 10). The land-use pattern showed overall consistency, with differences in some places. Under the assumptions of the simulation and the set of indicators used, the “trend scenario” (Figure 10a) was revealed to be the most favorable of the three for the desired future landscape multifunctionality. The spatial distribution of land use under the trend scenario is consistent with the land use pattern in 2019.
The simulation results of the economic scenario (Figure 10b) show that industrial and mining land has become the mainland type, the rate of industrial and mining land encroaching on other land use types has accelerated significantly, and a large area of forest land in the northwest has been replaced by cultivated land.
Under the ecological protection scenario (Figure 10c), the areas of forestland, grassland, and cultivated land are increasing, and industrial and mining land is decreasing. This result has benefited from the vigorous advocacy of large-scale land restoration and afforestation in the mining area. Compared with other scenarios, the regional ecological environment under this scenario has been effectively improved, which is advantageous for sustainable land development.
The area and conversion probability of different land-use types were calculated based on these three scenarios (Figure 11). Cultivated land and grassland in the three scenarios showed a decreasing trend compared with that in 2019. There is little difference between rural construction land and the water area. Industrial and mining land increasingly occupies ecological spaces such as cultivated land, forest land, and grassland. The change in the trend of forestland is greatly affected by policies, and there are different development states under different forecast scenarios.

4. Discussion

The combination of individual agents and a probabilistic decision-making approach which the MAS-LUCC model framework proposed in this paper, allowed us to simplify and include the inherent variability of the decision-making behavior of local stakeholders in the rural mining area and achieve the simulation of land use in the study area. The verification results compared with the field investigation results show that the overall accuracy of the model is high, and the simulation results are reliable. However, the simulation effect of forest land and water area is not ideal, mainly because the decision behavior design of farmers and enterprise agents is based on the behavior rules of cultivated land and industrial and mining land, which cannot better reflect the randomness of forest land change in the study area, or better reflect the reality of the scattered distribution of the water area.
The application of the multi-agent method to land use change simulations is a research hotspot [34,35]. The advantages of MAS have attracted many researchers’ attention for its application in agricultural systems and communities to enhance the administrative result [36,37,38,39,40,41,42,43,44]. Although multi-agent systems are very suitable for simulating the interaction between human behavior and geographical landscapes, the application of MAS in man-earth coupling systems in mining areas still faces many challenges. As the MAS- LUCC models are developed to deal with complex human-environmental systems, it is unlikely to gather all the required data to parameterize the model [23]. The government, enterprises, and farmers interact and participate in the land use decision-making process, which ultimately affects the use of land. This paper focuses more on the parameterization of agents and less on the relationship between the farmers’ neighbors and the complex social network structure among farmers, enterprises, and governments. In addition, the randomness and spontaneity of human activities and policy implementation are difficult to express in the model, which makes it difficult to simulate the dynamic changes quantitatively [31]. This level of uncertainty can be decreased by including the knowledge of different stakeholders in the construction of MAS.
China’s unique land system has created a complex land transfer mechanism that brings diverse stakeholders [24]. This uncertainty exacerbates the difficulty of prediction, as describing the driving factors of the agents’ decision-making will lead to complexity in the decision-making process while considering a single factor cannot fully reflect the real intention of decision-making. To ensure the authenticity of the decision-making results, it is important to select a reasonable number of parameters among the agents for simulating the rationality of decision-making behavior. The multi-agent model we built has been preliminarily verified for accuracy. We will enlarge the research area with further field surveys and questionnaire interviews and adjust the model parameters and important rules to uncover the stakeholders’ interactions, promoting the simulation and prediction of land use with the MAS-LUCC model we proposed. The full integration of this concept into the stakeholders’ participation mechanism will be the focus of future research.

5. Conclusions

Land use and its change in the coal resources integration context are complex processes that include actors and factors at different spatial and social levels, and mining activities and stakeholder participation have a profound impact on them [8,26]. Based on remote sensing images and participatory rural assessment, this study analyzed the dynamic changes in the stakeholders’ land use decision-making behavior and land use patterns in Yuanji village during different coal mining periods. We proposed a dynamic multi-agent model of land use in Yuanji Village based on geospatial data and the stakeholders’ participation to understand the macro-level land-use change model from the perspectives of dynamics, evolution, and subjectivity. In addition, combined with the current situation of regional socioeconomic development, three scenarios were set to predict the land pattern change in Yuanji Village in 2026. The main conclusions are as follows.
(1)
The trajectory of the land-use behavior of stakeholders in the study area show phased changes, which aroused significant changes in the land-use pattern of mining areas. The farmers’ attitude towards land use changes with their livelihood capital composition. Among them, labor capacity, cultivated land area, cultivated land quality, per capita annual income of families, and the importance of land requisition subsidies are considered to be important factors affecting farmers’ attitudes towards land requisition, which lead to certain land use decision-making behaviors.
(2)
The LUCC model based on a multi-agent framework was established using Netlogo software. Combined with the behavior decision rules of the stakeholders, the regional land-use change in 2019 was simulated. The overall fitting accuracy of the model was 76.31%, and the overall accuracy of the kappa coefficient test was 0.83, which demonstrates that the established model has certain credibility and accuracy for simulating the change in land use patterns of Yuanji Village.
(3)
Three scenarios were designed to predict the trajectory of land-use change in 2026. The trend scenario presents the most likely land use pattern of the village in the future natural development state. The economic development scenario shows that industrial and mining land occupy other land types over a large area and become the mainland type. The land-use pattern under the ecological protection scenario was the most suitable. The areas of cultivated land, forest land, and grassland will expand with landscape restoration and vegetation reconstruction.

Author Contributions

Conceptualization, H.Z.; methodology, H.Z. and X.Z.; software, Y.C. and M.G.; validation, Y.L.; formal analysis, H.Z.; investigation, Y.C.; writing—original draft preparation, M.G.; writing—review and editing, H.Z.; supervision, X.Z. and Y.L. All authors have read and agreed to the published version of the manuscript.

Funding

This work was supported by the National Natural Science Foundation of China (Grant numbers 41871193, U1910207).

Data Availability Statement

Summarized data are presented and available in this manuscript and the rest of the data used and/or analyzed are available from the corresponding author on reasonable request.

Conflicts of Interest

The authors declare that they have no known competing financial interests or personal relationships that could have appeared to influence the work reported in this paper.

References

  1. Berkel, D.; Verburg, P.H. Combining exploratory scenarios and participatory backcasting: Using an agent-based model in participatory policy design for a multi-functional landscape. Landsc. Ecol. 2012, 27, 641–658. [Google Scholar] [CrossRef] [PubMed] [Green Version]
  2. Reulier, R.; Delahaye, D.; Viel, V. Agricultural landscape evolution and structural connectivity to the river for matter flux, a multi-agents simulation approach. Catena 2018, 174, 524–535. [Google Scholar] [CrossRef]
  3. China’s State Council Information Office. White Paper: Energy in China’s New Era. [R/OL]. Available online: http://www.scio.gov.cn/ztk/dtzt/42313/44537/index.htm (accessed on 25 November 2022).
  4. Lin, J.; Fridley, D.; Lu, H.; Price, L.; Zhou, N. Has coal use peaked in China: Near-term trends in China’s coal consumption. Energy Policy 2018, 123, 208–214. [Google Scholar] [CrossRef]
  5. Sun, Z.; Wang, W.; Zhu, W.; Ma, L.; Dong, Y.; Lu, J. Evolutionary game analysis of coal enterprise resource integration under government regulation. Environ. Sci. Pollut. Res. 2021, 29, 7127–7152. [Google Scholar] [CrossRef]
  6. Li, B.; Haneklaus, N. The role of clean energy, fossil fuel consumption and trade openness for carbon neutrality in China. Energy Rep. 2022, 8, 1090–1098. [Google Scholar] [CrossRef]
  7. Li, L.; Lei, Y.; Wu, S.; He, C.; Yan, D. Study on the coordinated development of economy, environment and resource in coal-based areas in Shanxi Province in China: Based on the multi-objective optimization model. Resour. Policy 2018, 55, 80–86. [Google Scholar] [CrossRef]
  8. Cao, X. Policy and regulatory responses to coalmine closure and coal resources consolidation for sustainability in Shanxi, China. J. Clean. Prod. 2017, 145, 199–208. [Google Scholar] [CrossRef]
  9. Bakker, M.M.; Alam, S.J.; Dijk, J.V.; Rounsevell, M. Land-use change arising from rural land exchange: An agent-based simulation model. Landsc. Ecol. 2015, 30, 273–286. [Google Scholar] [CrossRef] [Green Version]
  10. Wu, Y.; Hui, E.C.M.; Zhao, P.; Long, H. Land use policy for urbanization in China. Habitat Int. 2018, 77, 40–42. [Google Scholar] [CrossRef]
  11. Wang, J.; Lin, Y.; Glendinning, A.; Xu, Y. Land-use changes and land policies evolution in China’s urbanization processes. Land Use Policy 2018, 75, 375–387. [Google Scholar] [CrossRef]
  12. Liu, P.; Rayenscroft, N. Collective action in implementing top-down land policy: The case of Chengdu, China. Land Use Policy 2017, 65, 45–52. [Google Scholar] [CrossRef]
  13. Brady, M.; Sahrbacher, C.; Kellermann, K.; Happe, K. An agent-based approach to modeling impacts of agricultural policy on land use, biodiversity and ecosystem services. Landsc. Ecol. 2012, 27, 1363–1381. [Google Scholar] [CrossRef]
  14. Buya, S.; Tongkumchum, P.; Owusu, B. Modelling of land-use change in Thailand using binary logistic regression and multinomial logistic regression. Arab. J. Geosci. 2020, 13, 437. [Google Scholar] [CrossRef]
  15. Aburas, M.; Ahamad, M.S.S.; Omar, N. Spatio-temporal simulation and prediction of land-use change using conventional and machine learning models: A review. Environ. Monit. Assess. 2019, 191, 205. [Google Scholar] [CrossRef]
  16. Sun, B.; Robinson, D.T. Comparison of Statistical Approaches for Modelling Land-Use Change. Land 2019, 7, 144. [Google Scholar] [CrossRef] [Green Version]
  17. Cerrillo, R.M.N.; Rodriguez, G.P.; Rumbao, I.C.; Lara, M.A.; Bonet, F.J.; Mesas-Carrascosa, F.J. Modeling Major Rural Land-Use Changes Using the GIS-Based Cellular Automata Metronamica Model: The Case of Andalusia (Southern Spain). ISPRS Int. J. Geo-Inf. 2020, 9, 458. [Google Scholar] [CrossRef]
  18. Song, X.; Hansen, M.C.; Stehman, S.V.; Potapov, P.V.; Tyukavina, A.; Vermote, E.F.; Townshend, J.R. Global land change from 1982 to 2016. Nature 2018, 560. [Google Scholar] [CrossRef]
  19. Noszczyk, T. A review of approaches to land use changes modeling. Hum. Ecol. Risk Assess. 2019, 25, 1377–1405. [Google Scholar] [CrossRef]
  20. Mozgeris, G.; Jukneliene, D. Modeling Future Land Use Development: A Lithuanian Case. Land 2021, 10, 360. [Google Scholar] [CrossRef]
  21. Dai, E.; Ma, L.; Yang, W.; Wang, Y.; Tong, M. Agent-based model of land system: Theory, application and modelling framework. J. Geogr. Sci. 2020, 30, 1555–1570. [Google Scholar] [CrossRef]
  22. Ligtenberg, A.; Bregt, A.K.; Lammeren, R.V. Multi-actor-based land use modelling: Spatial planning using agents. Landsc. Urban Plan. 2001, 56, 21–33. [Google Scholar] [CrossRef]
  23. Deadman, P.; Robinson, D.; Moran, E.; Brondizio, E. Colonist Household Decisionmaking and Land-Use Change in the Amazon Rainforest: An Agent-Based Simulation. Environ. Plan. B Plan. Des. 2004, 31, 693–709. [Google Scholar] [CrossRef] [Green Version]
  24. Liu, X.; Xia, L.; Yeh, G.O. Multi-agent systems for simulating spatial decision behaviors and land-use dynamics. Chin. Sci. Earth Sci. 2006, 49, 1184–1194. [Google Scholar] [CrossRef]
  25. Yuan, M.; Liu, Y. Land use optimization allocation based on multi-agent genetic algorithm. Trans. Chin. Soc. Agric. Eng. 2014, 30, 191–199. [Google Scholar] [CrossRef]
  26. Evans, T.P.; Manire, A.; Castro, F.D.; Brondizio, E.; Mccracken, S. A dynamic model of household decision-making and parcel level landcover change in the eastern amazon. Ecol. Model. 2001, 143, 95–113. [Google Scholar] [CrossRef]
  27. Fontaine, C.M.; Rounsevell, M. An agent-based approach to model future residential pressure on a regional landscape. Landsc. Ecol. 2009, 24, 1237–1254. [Google Scholar] [CrossRef]
  28. Gan, J.; Langeveld, J.; Smith, C.T. An Agent-Based Modeling Approach for Determining Corn Stover Removal Rate and Transboundary Effects. Environ. Manag. 2014, 53, 333–342. [Google Scholar] [CrossRef]
  29. Le, Q.B.; Park, S.J.; Vlek, P.L.G.; Cremers, A.B. Land-use dynamic simulator (ludas): A multi-agent system model for simulating spatio-temporal dynamics of coupled human–landscape system. i. structure and theoretical specification. Ecol. Inform. 2008, 3, 135–153. [Google Scholar] [CrossRef]
  30. Macal, C.M.; North, M.J. Tutorial on agent-based modelling and simulation. J. Simul. 2010, 4, 151–162. [Google Scholar] [CrossRef]
  31. Valbuena, D.; Verburg, P.H.; Bregt, A.K.; Ligtenberg, A. An agent-based approach to model land-use change at a regional scale. Landsc. Ecol. 2010, 25, 185–199. [Google Scholar] [CrossRef]
  32. Wu, Z.; Zhou, L.; Wang, Y. Prediction of the Spatial Pattern of Carbon Emissions Based on Simulation of Land Use Change under Different Scenarios. Land 2022, 11, 1788. [Google Scholar] [CrossRef]
  33. Carbo, J.; Sanchez-Pi, N.; Molina, J.M. Agent-based simulation with NetLogo to evaluate ambient intelligence scenarios. J. Simul. 2018, 12, 42–52. [Google Scholar] [CrossRef]
  34. Bert, F.; North, M.; Rovere, S.; Tatara, E.; Macal, C.; Podesta, G. An agent based model to simulate structural and land use changes in agricultural systems of the argentine pampas. Ecol. Model. 2011, 222, 3486–3499. [Google Scholar] [CrossRef]
  35. Bijandi, M.; Karimi, M.; van der Knaap, W.; Bansouleh, B.F. A novel approach for multi-stakeholder agricultural land reallocation using agent-based modeling: A case study in iran. Landsc. Urban Plan. 2021, 215, 0169–2046. [Google Scholar] [CrossRef]
  36. Koch, J.; Dorning, M.A.; Berkel, D.V.; Beck, S.M.; Sanchez, G.M.; Shashidharan, A.; Smart, L.S.; Zhang, Q.; Smith, J.W.; Meentemeyer, R.K. Modeling landowner interactions and development patterns at the urban fringe. Landsc. Urban Plan. 2018, 182, 101–113. [Google Scholar] [CrossRef]
  37. White, S.S.; Selfa, T. Shifting Lands: Exploring Kansas Farmer Decision-Making in an Era of Climate Change and Biofuels Production. Environ. Manag. 2013, 51, 379–391. [Google Scholar] [CrossRef]
  38. Chang, H.; Ai, P.; Li, Y. Land tenure policy and off-farm employment in rural china. Iza J. Dev. Migr. 2018, 8, 9. [Google Scholar] [CrossRef] [Green Version]
  39. Cui, Y.; Zhang, H.; Hao, X.J.; Zhang, X.Y. Sustainable livelihood of farmers in Yangquan mining area of Shanxi Province. Acta Ecol. Sin. 2020, 40, 6821–6830. [Google Scholar]
  40. Wang, J.; Xin, L.; Wang, Y. How farmers’ non-agricultural employment affects rural land circulation in china? J. Geogr. Sci. 2020, 30, 378–400. [Google Scholar] [CrossRef]
  41. Wu, X.; Ding, J.; Lu, B.; Wan, Y.; Shi, L.; Wen, Q. Eco-Environmental Effects of Changes in Territorial Spatial Pattern and Their Driving Forces in Qinghai, China (1980–2020). Land 2022, 11, 1772. [Google Scholar] [CrossRef]
  42. Mitter, H.; Larcher, M.; Schoenhart, M.; Stoettinger, M.; Schmid, E. Exploring Farmers’ Climate Change Perceptions and Adaptation Intentions: Empirical Evidence from Austria. Environ. Manag. 2019, 63, 804–821. [Google Scholar] [CrossRef] [PubMed]
  43. Liang, P.; Yang, X. Landscape spatial patterns in the Maowusu (Mu Us) Sandy Land, northern China and their impact factors. Catena 2016, 145, 321–333. [Google Scholar] [CrossRef]
  44. Papa, C.; Nzokou, P.; Mbow, C. Farmer Livelihood Strategies and Attitudes in Response to Climate Change in Agroforestry Systems in Kedougou, Senegal. Environ. Manag. 2020, 66, 218–231. [Google Scholar] [CrossRef] [PubMed]
Figure 1. Location of the Yuanji village in Shanxi Province, CHINA.
Land 11 02257 g001
Figure 2. The framework of this research.
Land 11 02257 g002
Figure 3. The framework of the MAS-LUCC model in the study.
Land 11 02257 g003
Figure 4. The simulation process of the model in Netlogo software (5.3.1).
Land 11 02257 g004
Figure 5. The farmers’ attitudes towards land requisition based on different livelihoods.
Land 11 02257 g005
Figure 6. Land use pattern in the different periods: cultivated land (CL), grassland (GRASS), forestland (FOREST), rural construction land (RCL), industrial and mining area (IML), water (WATER).
Land 11 02257 g006
Figure 7. Land requisition willingness of different types of farmers.
Land 11 02257 g007
Figure 8. Land use behavior of different types of farmers.
Land 11 02257 g008
Figure 9. LUCC simulation results in 2019: cultivated land (CL), grassland (GRASS), forestland (FOREST), rural construction land (RCL), industrial and mining area (IML), water (WATER), and the error graph.
Land 11 02257 g009
Figure 10. Land use forecast results of three scenarios in 2026.
Land 11 02257 g010
Figure 11. The area and conversion probability of different land-use types in three scenarios.
Land 11 02257 g011
Table 1. Statistical table of research data in this study.
Data TypeData ContentData Source
Land use dataLand use (2010–2019)Remote sensing image interpretation (Landsat-8)
Environmental variables dataDEM, Slope, Aspect http://www.gscloud.cn
(accessed on 13 March 2022)
Main rivers, roads, railways
Agents’ attributes dataGovernment’s attributes informationField investigation and interview
Farmers’ attributes information
Enterprises’ attributes information
Table 2. Importance of factors affecting farmers’ attitude towards land requisition. (*: p < 0.05, indicating significant difference; **: p < 0.01, indicating extremely significant difference.)
Influence FactorsEstimation ResultsWalddfp
Land area−0.2940.05510.033 *
Land requisition subsidy−11.63121.27510.014 *
Agricultural income−5.90813.38610.008 **
Health condition−2.1153.40410.045 *
Age of farmer−0.2970.18410.029 *
Cultivated land quality2.6898.04610.038 *
Fixed assets−0.4990.15710.692
Level of education4.2201.65210.199
Neighborhood relations0.2320.07410.299
Friend relief ability0.6340.15110.697
*: p < 0.05, indicating significant difference; **: p < 0.01, indicating extremely significant difference.
Table 3. The change in the land use decision-making actions of stakeholders in different coal mining life periods.
Coal Mining Life PeriodLand Use Decision of StakeholdersLand Use Pattern
EnterpriseFarmer Household
Exploration
(before 2011)
-Engaging in agricultural production.Cultivated land was the main land use type.
Exploitation
(2012—2017)
Large scale mining of mineral resources.Began to develop sidelines, such as miners, industrial workers, and so on.Industrial construction land has expanded, while cultivated land has shrunk.
Ecological restoration
(after 2018)
Implement ecological restoration and develop modern agriculture and tourism.Learn modern agricultural skills and broaden employment opportunities.The area of forest land, grassland, and water area increased significantly.
Table 4. Area and proportion of land use types in three coal mining life periods: cultivated land (CL), grassland (GRASS), forestland (FOREST), rural construction land (RCL), industrial and mining land (IML).
Land Use Type201020122019
Area
(hm2)
Ratio
(%)
Area
(hm2)
Ratio
(%)
Area
(hm2)
Ratio
(%)
CL272.3469.18 180.2745.79 118.8930.20
GRASS25.026.36 89.5522.75 44.9111.41
FOREST30.67.77 46.2611.75 71.6418.20
RCL36.099.17 36.999.40 38.799.85
IML29.617.52 40.2310.22 118.8930.20
WATER00.00 0.360.09 0.540.14
Overall393.66100393.66100393.66100
Table 5. Accuracy test of simulation results: cultivated land (CL), grassland (GRASS), forestland (FOREST), Rural construction land (RCL), industrial and mining area (IML), water (WATER).
Land Use TypeCLGRASSFORESTRCLIMLWATEROverall
Accuracy74.26%67.33%54.52%90.26%90.54%33.33%76.31%
Kappa0.700.560.560.920.880.400.83
Publisher’s Note: MDPI stays neutral with regard to jurisdictional claims in published maps and institutional affiliations.

