1. Introduction
Aerial photogrammetry as a remote sensing technique provides the capacity for reconstructing the topographic features of the terrain, which was previously photographed from the air. Thus, by analyzing aerial photographs [
1,
2], important and high-quality information about the space and its previous and current state can be obtained with great precision. Aerial photographs from previous and current epochs, with equipment for processing and presenting spatial data, provide the possibility of multipurpose use [
3,
4]. Therefore, it is possible to analyze the displacements of terrain surface (landslides), or such as changes in vegetation, hydrography, infrastructure, settlements and such phenomena [
5]. In terms of monitoring landslides, very useful information can be obtained through the process of interpreting the relationship between the present and the previous situation, as well as through the extent and prediction of changes. The advantages of this method of data collection, compared to other forms, including satellite imaging, are complete autonomy in operation, cost and the possibility of analyzing the state of the space from significantly earlier recording periods [
6,
7,
8,
9].
The subject matter of the research in the present paper is the “Umka” landslide near Belgrade. The research was designed with the aim of obtaining answers about the geomorphologic and morphometric changes of this landslide over time, based on historical aerial photographs. The aim of the paper is to present this analysis as a methodological framework for other research related to the monitoring of geomorphologic changes in unstable terrains. The research hypothesis assumes that the qualitative and quantitative analysis of archival aerial photographs will yield data on geomorphologic phenomena and features, which are characteristic of the landslide subject, such as frontal and secondary scarps, bulging, depressions, dredging phenomena, etc.
The research includes data from several epochs of recording. The time period covered by the research is from 1959 to 2018. As a data source, analog and digital aerial photographs of the Military Geographical Institute of the Serbian Army (MGI) were used. During the process of processing analog imagery, it was necessary to convert them from analog to digital format. For this purpose, well-known digitization models were used, as given in the examples [
8,
10]. In the further process of primary processing of analog and digital imagery (for all four epochs of surveying), it was necessary to create orthophoto maps. During the creation of orthophoto maps, standard activities were carried out, according to known and adopted methods such as preprocessing of historical aerial images (scanning, cleaning and improving the quality), determination of missing parameters of internal and external orientation (flight height, overlap, flight direction, fiducial marks), triangulation of aerial images, terrain extraction, orthophoto mosaicking, 3D-feature collection and GIS analysis [
11,
12]. Geological mapping for each of the mentioned epochs was carried out through the processes of 3D photogrammetric processing using dedicated software and standard methods and approaches, as well as modern trends such as alignment of scanned images, camera calibration, dense point cloud generation and classification, building DEM and orthomosaic generation and finally building a stereo 3D model for use in content mapping [
13,
14,
15,
16].
It is assumed that the applied methodology and obtained results can be useful for other analyses and monitoring and/or reconstruction of landslide dynamics in the Republic of Serbia and beyond.
2. Case Study
The “Umka” landslide is in the central part of the Republic of Serbia, near the settlement carrying the same name, Umka, with communication to the settlement of Barič and along the right riverbank of the Sava River. The settlement of Umka belongs to the Belgrade settlements of Posavina and extends in the southwestern part of the municipality of Čukarica, 20 km away from the city center of Belgrade (
Figure 1).
In the area of the “Umka” landslide and its surroundings, there are plain and hill types of relief. The “Umka” landslide was formed on the unevenly urbanized hillsides that span between the River Sava, streams of Stepašanica and Duboko, with average terrain slope from 9° up to more than 25° (in the zones of landslide main scarps). The watershed passes of the slope, on which the landslide was formed, are 350–1050 m away from the local erosion base of the Sava River, with a maximum height difference of approximately 135 m. The slopes affected by the sliding process are sporadically undulated, with pronounced occurrences of valleys, elevations, secondary scars and depressions that are of the dm-m order of magnitude [
17,
18,
19]. In the wider area of the hilly high grounds of the research area, an intensive sliding process has developed, which has variable dynamics, as well as river and stream erosion. Extensive phenomena of instability affected all river and stream valley sides. In parts of the area where watercourse erosion has stopped, and thick river sediment has been deposited at the foot of the slopes, the processes are of a calmer character, and vice versa. Large distribution of landslides in a wider area is closely related to the characteristic geological structure of the terrain. Most slopes with a gradient >8° are affected by an active sliding process. “Umka” landslide is the most systematically investigated and largest populated landslide in Serbia. The “Umka” landslide firstly was mentioned in the work of the famous Serbian geographer J. Cvijić in 1909 [
20], but the first detailed geological description of it was by Luković in 1951 [
21]. Detailed engineering geological and geotechnical investigations of the “Umka“ have been performed on several occasions from 1978 up to 2010 [
22], while the first permanent GNSS landslide monitoring station was installed in 2010 [
23].
The geological structure of the “Umka” landslide consists of Miocene (Pannonian), Pliocene (Pontian) and Quaternary sediments. Pannonian sediments are represented by argillaceous marls, marls, marley clays and rare interlayers of marl and limestone up to 10 cm thick. The thickness of the Pannonian sediments is from 10 to 170 m. Pont is represented by gray-blue marley and ferruginous clays, siltstones and fine-grained sand, the sediments are up to 10 m thick [
17]. The Quaternary is represented by the Pleistocene, built of gravel, sand, clay, conglomerate, sandstone and loess, as well as the Holocene, built of sandy clay, sand and loess [
18].
3. Materials and Methods
3.1. Data
The Umka settlement area was surveyed using analog cameras in several epochs (1959–1988), with different flight parameters and overlaps. Imagery that originates from 1959 is panchromatic images taken were at 1:32,500 scale using an RC-8 camera with a focus of 153.3. Imagery from 1970 is also panchromatic, at 1:26,000 scale taken by an RC-10 camera with a focus of 115.24. The most up-to-date imagery from 2007 to 2017 was taken with an UltraCamXP digital photogrammetric camera, with a 40 cm resolution.
Table 1 shows all available analog historical aerial photographs of the Umka area, with the most important information, such as longitudinal overlap, recording scale, flight height, focal length of the camera and assessment of the possibility of using the images for photogrammetric processing and analysis of landslide activity according to Corominas et al. [
24] and Đurić [
18,
19]. Out of a total of seven available acquisition time series, only two had a potential application (1959 and 1962), and one series had an excellent possibility of application (1970). The other series had limited or very limited application, usually due to the difference in tones between overlapping images, which make it impossible to automatically identify the tie points, or due to the fact that the surface of the “Umka” landslide was on the edge of the images or even cut off.
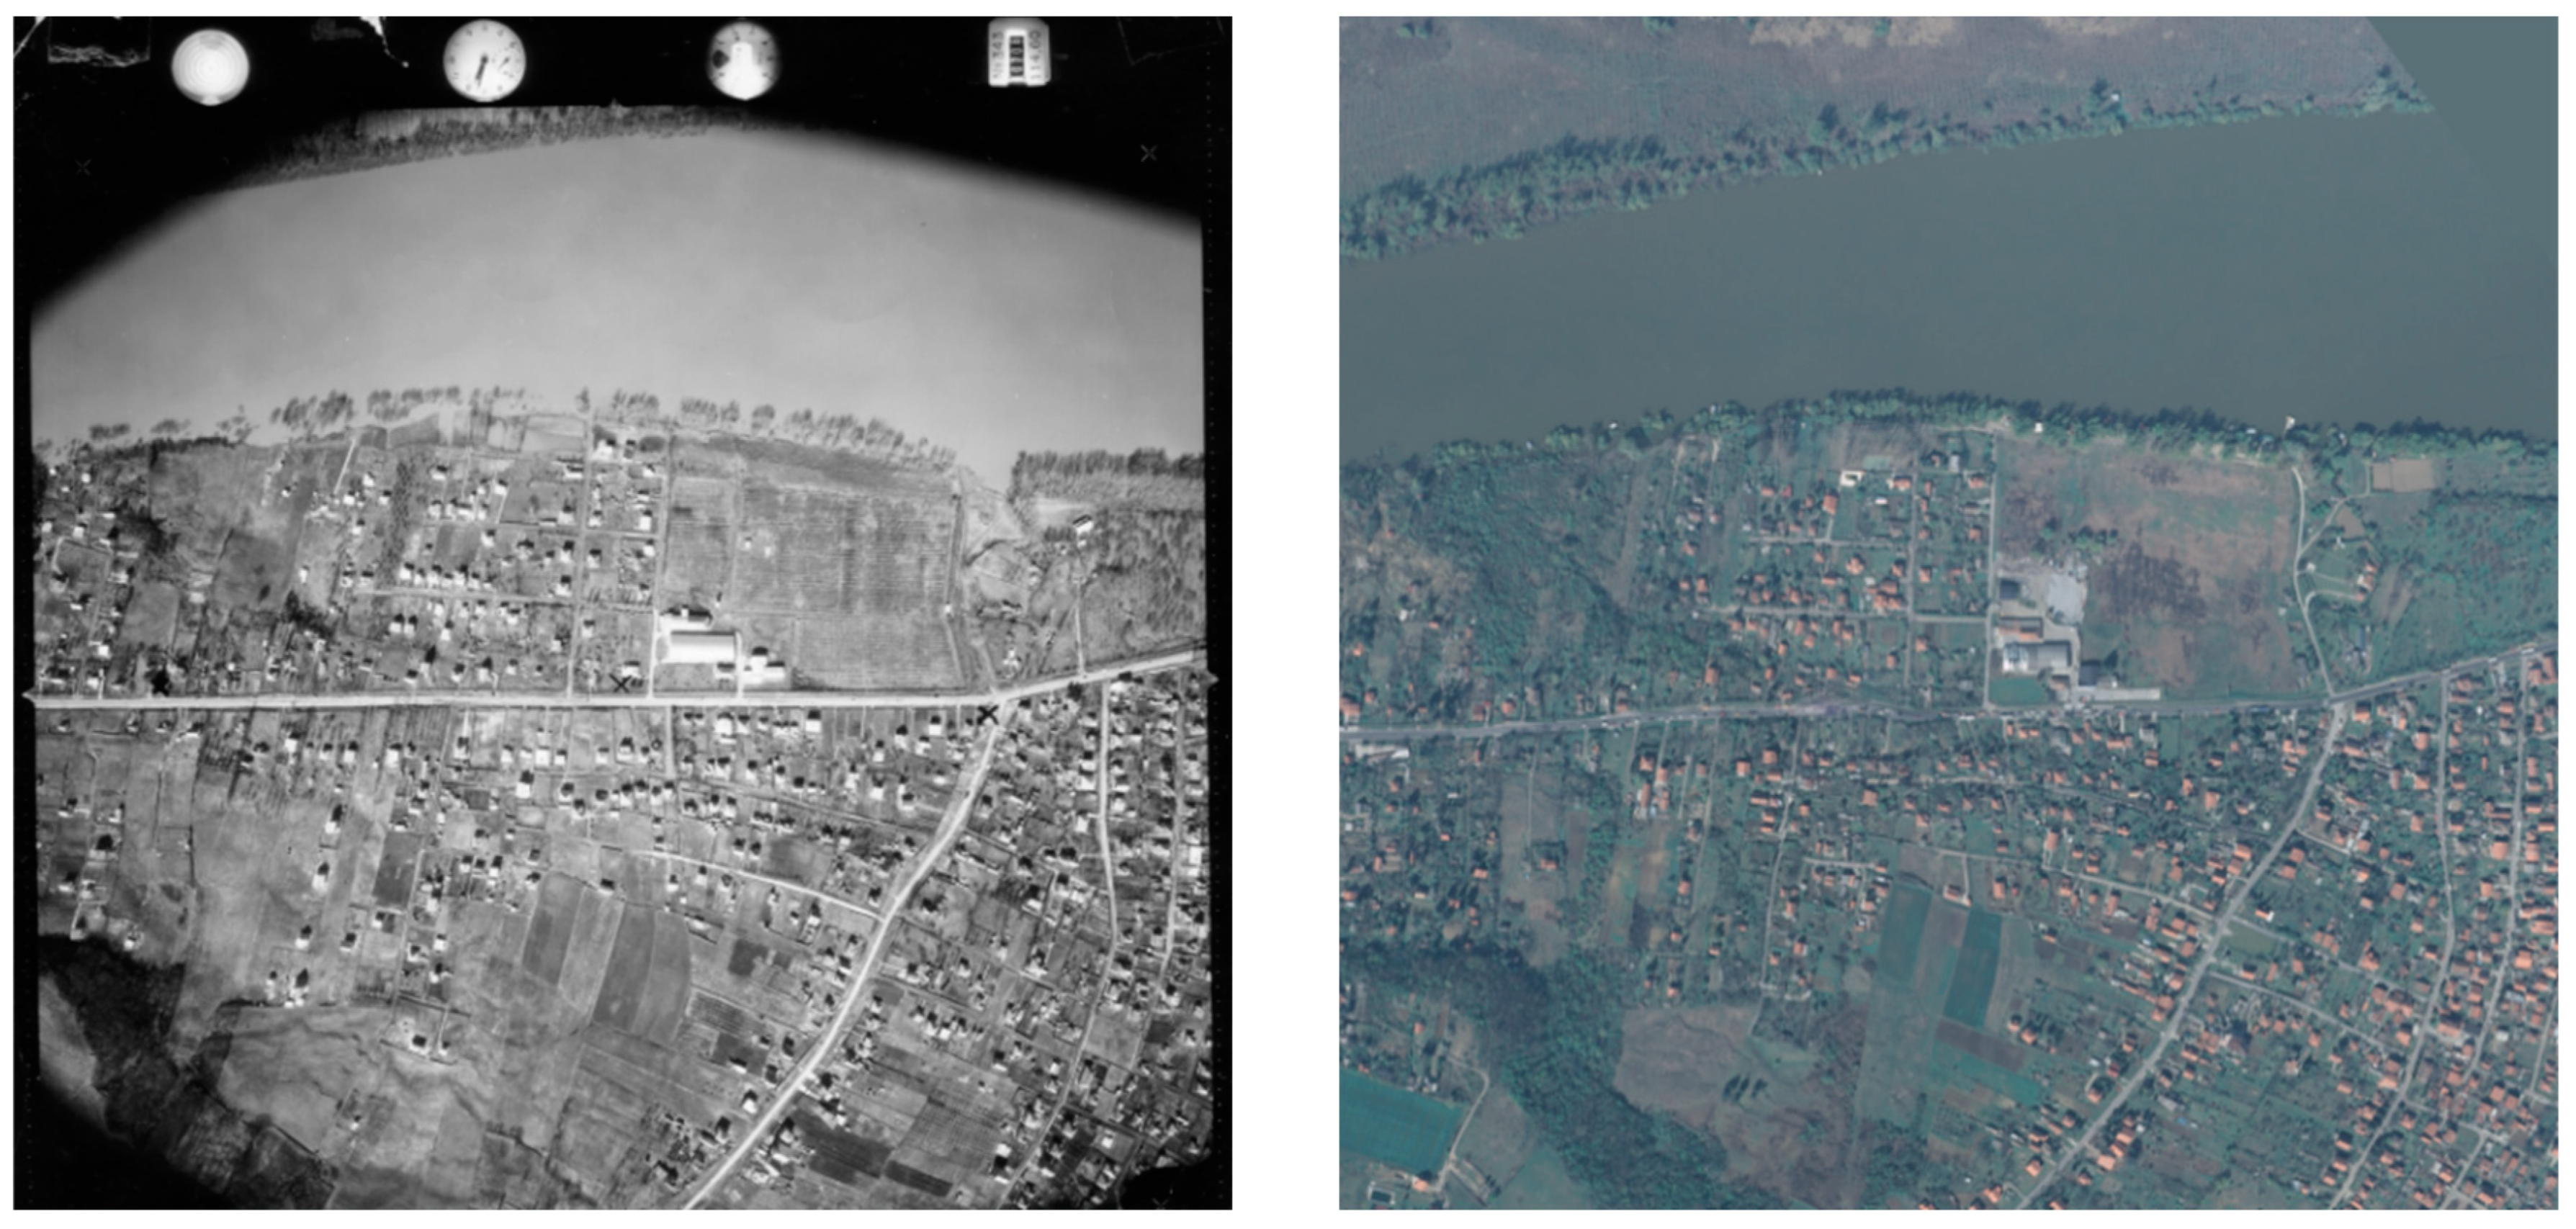
In the present research, most of the imagery was recorded in analog format, while the imagery created after 2000 was in digital format (
Figure 2).
The quality of the imagery, as well as the corresponding scans, was good to excellent, except for one series from 1967, where white spots could be observed, which were the result of physical damage to the initial recordings. In
Table 1, the excellent applicability of aerial photographs is defined by the series of images that can be used for photogrammetric analysis with high reliability and without major difficulties and the need for image processing (
Figure 3B). A possible application is defined by the images that are of slightly lower quality and less favorable scale, but can still be used for photogrammetric analysis of slightly lower reliability (
Figure 3A). The limited application is defined by the images that, with additional processing, can be used for photogrammetric analysis of the “Umka” landslide. In these images, the landslide is located at the very edge of the images, so deformations and errors in photogrammetric products are likely expected. Imagery of this quality should be avoided (
Figure 3C). Very limited application defines the images as unusable for photogrammetric analysis and production of photogrammetric products due to unfavorable scale, overlap of image quality and landslide position, while their application is reduced mainly to visual identification and overview of the research area (
Figure 3D).
In addition to the mentioned analog recordings, recordings obtained with a digital camera from several series were also used.
Table 2 shows the digital archival aerial photographs covering the “Umka” landslide area, with the most important information such as size and number of pixels, average flight height, focal length of the camera, scale and finally the assessment of the applicability of the images for photogrammetric processing. For the purposes of this research, two sets of imagery from 2007 and 2018 were selected for the analysis.
3.2. Primary Data Preparation and Photogrammetric Processing
Selected aerial photographs for the epochs of 1959 and 1970 were previously scanned and converted into digital form before being subjected to primary processing. This was achieved using standardized procedures using a DeltaScan-6-type photogrammetric scanner. Scanned images in their original state could not be used as a measurement base due to deformations caused by the central projection, the nonverticality of the image and the different heights of the terrain and features on it [
12]. Therefore, it was necessary to perform orthorectification of each individual image [
1,
16].
During the further processing of the images for the indicated acquisition epochs (
Figure 2), the procedure consisted of the following stages: provision of a digital elevation model, determination of orientation and control points, orthorectification of individual acquisition lines, radiometric correction of individual DOP, mosaicking of orthorectified images, formation of a photogeological map and quality control of the photogeological map [
25,
26].
Such image processing enabled further collection of information on the morphology and relevant quantitative and qualitative data on the landslide dynamics of the “Umka” landslide (
Figure 3). This was achieved by applying modern algorithms and tools, as well as by comparing selected pairs of orthophotos. The data were obtained in the form of vectors and displacement intensity of the identified pixels (
Figure 3). The simplified algorithm of photogrammetric processing and analysis of historical aerial photographs for landslide monitoring is shown in
Figure 4.
For photogrammetric processing, we used the Agisoft Metashape software package, which has a very intuitive and user-friendly interface. For 3D quantitative feature collection and analysis, we used the ILWIS 3.1 stereo pair from the DEM module. For quantitative analysis, we used the CalTech COSI-Corr ENVI-based module for coregistration and subpixel measurements on digital orthophotos, while for GIS analysis and data visualization, we used QGIS.
Based on such data, possibilities were created for generating the maps of surface deformations. These maps were later used to reconstruct the dynamics of the “Umka” landslide under the morphological and dynamic conditions that prevailed during the analyzed period. This methodology and the obtained results provided data for determining the condition of the landslide for the periods before the establishment of the automatic GNSS monitoring station on the “Umka” landslide. The obtained results can also be used for the 3D geotechnical analysis of the stability of the “Umka” landslide since high-resolution DEMs were produced.
3.3. Analysis of Geomorphological Changes
We performed qualitative and quantitative analyses of the historical aerial photographs and orthophoto mosaics. Quantitative analysis included visual photogeological (stereoscopic) interpretation of selected and created 3D stereo pairs. By conducting this analysis, it was possible to outline all landslide terrain surface deformation (scarps, bulges, eroded riverbanks, landslide boundaries).
Based on the digital orthophotos of identical coordinate system, resolution and pixel size, it was possible to perform their software correlation at the pixel level in order to determine deformations, i.e., movements of the terrain surface (quantitative analysis). The software program, which was used during the analysis of digital and analog images of the “Umka” landslide, is COSI-Corr, developed by the researchers of the Observatory of Tectonics at the California Institute of Technology “Caltech”. More about the possibilities and theoretical foundations of the application of this method can be found in the work of Ayoub et al. [
27]. All recording preprocessing steps and procedures applied for quantitative data analysis for the purposes of this paper were performed in accordance with the user manual of the COSI-Corr software program [
28].
3.3.1. Qualitative Photogeological Analysis of Historical Aerial Photographs
For the qualitative analysis of imagery, sets of images from 1959, 1970, 2007 and 2018 were used, in order to achieve a uniform temporal difference between them. By analyzing the previously created orthophotos and their DEMs of different resolutions for the selected sets, four photogeological maps of exodynamic phenomena and shapes were created, which were then comparatively analyzed and based on which a qualitative analysis of the sliding process was performed over a period of time of almost 60 years, with the creation of accompanying photogeological maps.
3.3.2. Quantitative Analysis of Historical Orthophoto Mosaics
For the purposes of this paper, archival orthophoto imagery from 2003, 2010 and 2018 was available and used, without accompanying DEMs, which were generated subsequently based on available georeferenced images and described procedures.
Based on the established methods, precise correlation of photogrammetrically created orthophotos was performed using the COSI-Corr software to determine deformations, i.e., movements on the terrain surface, based on changes in the position of characteristic pixels. For the quantitative analysis, two pairs of images were created and correlated. The first pair consisted of archival orthophoto images for 2003 and 2010, while the second pair consisted of orthophoto images for 2010 and 2018. In this way, data on surface two-dimensional movement values were obtained for the period before the establishment of permanent GNSS monitoring. The orthophotos used for the analysis were of slightly lower resolution with the presence of significant parts of the terrain under vegetation. Based on the guidance from Ayoub et al. [
28], a statistical correlator with a search window of 64 × 64 pixels was used, which enabled the registration of displacements greater than 1 m that were expected for the analyzed time periods.
4. Results
Through the study and analysis of aerial images, qualitative photogeological analysis enables earth scientists to learn about geological information. It may be feasible to identify geological characteristics rather clearly from the direct evidence provided by the camera image in locations where the geomorphology closely mirrors the geological conditions. In these regions, it is simple to establish formational contacts and structural links, and a lot of routine mapping can be performed directly on the aerial photos. The results of the qualitative photogeological analysis of the “Umka” landslide for different time periods are shown in
Figure 5.
The visual and statistical analysis of geomorphological data concluded that the sliding process has significantly intensified over the past 60 years. After the visual analysis, the statistical processing of the selected geomorphological forms for all four sets was performed (
Table 3).
Landslide boundaries remained unchanged over time, while the distribution and magnitude of deformations within the body of the landslide (such as secondary scarps and bulging) varied significantly. On the geomorphological maps, it was clearly observed that the smallest changes were recorded within the foot of the landslide (Block A), while the greatest changes and deformations were experienced by all other parts of the “Umka” landslide. Over time, some secondary scarps disappeared or were masked due to vegetation, while in the place of some, over time, bulging appeared and vice versa. The above points to the distinct activity and dynamics of the landslide, the intensity of which culminated during or after 1970, which coincides with intensive urbanization and the construction of weekend houses on the body of the landslide. After reviewing the imagery, it was established that in some parts, after 1970, entire parts of weekend settlements disappeared and that a significant number of buildings no longer even physically existed on the surface of the landslide (
Figure 6).
Basic data on processed pairs of orthophotos and results based on the described methodology are presented in
Table 4.
The number of displacement vectors before and after filtering is shown in
Table 4. The vectors and their RBF interpolation in raster form are shown in
Figure 6.
Based on the quantitative analysis of historical aerial photographs, it may be concluded that on the analyzed pairs of photographs representing two time series, there was a significant change in the dynamics of surface movements.
During the first period from 2003 to 2010, the largest movements were recorded in the broader zone of the borders of Blocks A and B in the northern part (
Figure 7), where movements of over 1 m were registered during the time period of seven years. At the same time, during geotechnical investigations and field visits, as well as expertise in constructions, the greatest damage to residential and auxiliary buildings was determined, which continues to the present day (
Figure 7—top right). Somewhat smaller displacements were registered in the central part of Block B under the state road and around the road along Rucka. Parts of Block B under the state road IB26 remained “uncovered” using this method of analysis, which is most likely a consequence of the dense vegetation that was present in that area during the acquisition, and which made it impossible to clearly distinguish and monitor the movements.
During the second period from 2010 to 2018, the largest displacements were again recorded in the broader zone of the borders of Blocks A and B, but this time with a slightly smaller area of displacement covered. Slightly larger movements were registered in the central part of Block B under the state road IB26 and in the area of the road along Rucka compared to the first analyzed pair, which clearly indicates a change in the dynamics of the landslide itself during the analyzed period. Parts of Block B under the state road IB26 were masked by vegetation using this method as well, thus yielding no significant results. During the terrain landslide damage mapping of objects and infrastructure in the 1990s that was performed by the Highway Institute from Belgrade, no significant deformations were recorded around the road to Rucka. However, at the same location, deformations were evidenced during the mapping campaign in 2007 and 2008.
For validation of the results of quantitative analysis, we made a field visit (2017) within the zones of the greatest deformations in the area along the road to Rucka and State Road No. IB26, where we recorded several serious damages to housing objects. For example, Objects 4 and 89 had clearly visible significant deformations on construction because of the landslide activity (
Figure 7—top right and bottom right).
The aforementioned movements had impacted the appearance of landscape changes around this landslide. Changes in the morphology of landslides and vegetation cover are noticeable [
29], as well as the existence and movement of a certain number of constructions (houses and other constructions) during the second epoch [
19].
5. Discussion
In this research, the collection of raw information on the area of the “Umka” landslide was carried out based on historical aerial photographs from the MGI archive and digital orthophotos from the Mapsoft archive. In the first step (preprocessing), the selected images were processed through scanning and orthorectification to create orthophoto maps, as in other known examples [
9,
15]. According to existing data, the MGI archive contains a total of 5780 inventory units: 3800 films and 1980 other inventory units, mainly photograms [
9]. The applied methods can be categorized as manual, semiautomatic and automatic, based on the extent of the necessary intervention of the analyzing process [
15]. In the next step, the method of primary processing of images, i.e., photogrammetric processing and analysis of the subject images, was applied, as it is in the case of the Bovan lake study, where historical aerial photographs were used for monitoring environmental changes [
16]. At this stage, numerous problems arose. The biggest ones were during the identification of orientation points on historical analog imagery. Parts of the terrain, especially the urban parts of Umka and the surrounding settlements, have changed significantly over several decades, which made it impossible to identify the optimal number of orientation points. The errors that occurred during the processing and rectification of such images were large when processing individual sets, while the precise reconstruction of elevations was almost impossible, so the application of DEMs obtained in this way was limited mainly for the purposes of generating orthophotos with satisfactory accuracy. The analysis and processing of digital imagery were significantly easier because in the metadata of the images themselves, as a rule, a record of external and internal orientation exists (height from which the acquisition was made, sensor size, resolution, exposure, etc.). However, to achieve high accuracy of DEM elevations, based on digital images, identification of at least several relevant landmark (GCP) points was required. As a result of the work, the data obtained had a high planar (X,Y) geometric accuracy and were suitable for use in qualitative and quantitative photogeological analysis similar to the case [
7]. The obtained results show that our method of working is well planned and successfully implemented. There are well-known examples of monitoring changes on the land due to the occurrence of landslides by other researchers [
26,
30,
31,
32,
33,
34]. As examples, we would mention research in Mačva and Kolubara districts, affected by occasional flooding of the Jadar river in springtime [
26], and using aerial photographs that potentially give extensive data coverage and its use in landslide assessment [
30] applied in two case studies, one at the eastern flank of Mam Tor situated at the head of Hope Valley in Derbyshire, UK, and another at the East Pentwyn landslide at the eastern face of the Ebbw Fach valley in the South Wales Coalfield. Our results indicate that the selected materials/recordings and the applied methods of their primary processing have compatibility and traceability with the aforementioned research.
In the further course of the research, the analysis and processing of data was performed similarly to previous research [
30,
32,
35,
36]. In the aforementioned research, the possibilities of analyzing historical aerial maps for the needs of reconstruction of dynamics and changes in the geomorphological characteristics of landslides are presented. Thus, aerial photographs from different time periods were analyzed, on the basis of which detailed geomorphological maps of the development of specific landslides were made. Multitemporal maps created based on aerial photographs from 1954, 1961, 1969, 1980 and 1991 years, allowed analysis of the evolution of the Tessina landslide [
32]. Through the analysis of historical aerial photographs and photogrammetric measurements on them, geomorphological characteristics and assessments of terrain deformations were successfully reconstructed. For example, in the study of landslides in Slovakia near the settlement of Ljubjetova, aerial photographs of different scales from four epochs (1969, 1977, 1988 and 1998) were used, on the basis of which the dynamics of the landslide were reconstructed [
36]. On the territory of the Republic of Serbia, on the right bank of the Danube near Novi Sad, using historical aerial and satellite images, the phenomena of instability, the rupture complex and the neotectonic activity of landslides were analyzed. Similar to the mentioned examples, in our research, the movements of features on the surface of the “Umka” landslide were analyzed through four epochs: 1959, 1970, 2007 and 2018 in the time span of 60 years. Reliable results were obtained, which served for more detailed analyses of monitoring the dynamics and characteristics of this landslide.
During the processing and quantitative analysis of the historical orthophotos, several limitations arose: recognizable features had to be present in all images; through quantitative analysis, it was possible to detect displacements that depended on the resolution and were larger than the pixel size of the orthophoto imagery; it was possible to determine only displacements along the x- and y-coordinate axis; and finally, the precision of the measurement depended on the initial accuracy of the orthophoto.
This research shows the successful application of historical aerial photographs and orthophotos for monitoring spatial changes, i.e., the dynamics of the “Umka” landslide. This research also represents a specific case of a combination of knowledge and methods of remote sensing in monitoring the dynamics of landslide movement over an extended period. The specifics are highlighted through used procedures, materials and equipment (aerial cameras, photogrammetric scanners, photogrammetric, software, etc.) and the methodological framework of the research. Our methodological framework has shown that the obtained spatial information can be used with the accuracy needed to describe and understand the events related to this landslide. We believe that our methodological framework will be applicable to other landslides and surveys [
37,
38] and will assist in long-term planning, monitoring, prediction and assessment of the dynamics of spatial changes.
6. Conclusions
This paper presents the application of a methodological framework for monitoring the dynamics of the “Umka” landslide using historical aerial photographs. Data from four time epochs over a period of 60 years were used for the analysis. The research used the data and experiences of the detailed engineering geological and geotechnical investigations of this landslide, which were performed at the end of the 20th century and at the beginning of the 21st century. These data showed that this sliding area is one of the largest and deepest in the Republic of Serbia, which was the goal of our research.
In the given methodological framework, knowledge from various fields, such as remote sensing, GIS, geology, cartography and geography, was integrated. The methodological framework included the following basic stages: selection and scanning of aerial photographs, orthorectification of imagery and photogrammetric preparations for their further processing, creation of spatial models according to the state at the time of creation of the aerial photograph and primary processing of photographs using methods of 3D and 2D photogrammetric data processing. Further data processing was carried out using the vectorization method in the environment of the central database with respect to the basic cartographic and topographical rules, as well as the choice of the symbology of the mapped elements.
The results of the research show the possibilities and potential of using historical aerial photographs for the purpose of monitoring the dynamics of the “Umka” landslide. The surface movements of constructions, geomorphological elements of landslides (borders, frontal and secondary scarps, bulging, depressions, dredging, embankments, etc.), embankments along the local main road and the riverbanks of the Sava River were analyzed (
Figure 5,
Figure 6 and
Figure 7;
Table 3). The results of the research also show the possibility of using the historical orthophotos for quantitative subpixel change measurements that are likely the consequence of landslide activity. Using the described procedures, it is possible to obtain from historical orthophotos the intensity of 2D vectors that represent the surface movement.
The analyzed elements represent dominant features in observing the dynamics of this and other landslides. Therefore, the presented methodological framework can be taken as an example or a matrix for monitoring the dynamics of any landslide and in any location. Using this method, it was confirmed that the “Umka” landslide is an active landslide, with different dynamics of movement in individual isolated geotechnical blocks.
The greatest damage was recorded on constructions located in the zone of block boundaries, where the slip surface overlaps.
It was established that the central part of the landslide is the most intense in terms of movement; thus, this block was recognized as having the greatest displacements and changes in terrain morphology. Significant damage to constructions and infrastructure was recorded in the most intense parts of the landslide. Other parts of the landslide had occasional greater or lesser intensifications that caused significant damage to constructions and infrastructure. The greatest damage was recorded on constructions located in the zone of block boundaries, where the slip surface overlaps.
This analysis also points to the fact that the anthropogenic impact in the total time period was significant due to urbanization and unplanned development, and that the resulting changes were the consequence of spontaneous and induced changes in the dynamics of the “Umka” landslide. The only visible anthropogenic changes were recorded in the imagery from 1970 in the form of the existence of a certain number of constructions, which were not observed in the previous and in the later era.
Changes in the micro-landscape, i.e., the geomorphology of landslides, have been expressed. Changes in morphology and vegetation are visible, as well as movement and accumulation of material around the road communication in the initial upper part of the landslide. In the following period, it would be beneficial to continue monitoring the detected changes.
It is therefore concluded that this paper provides good opportunities for the use of historical aerial photographs in the quantitative and qualitative assessment of changes in the dynamics of landslides, as well as opportunities for further research that includes the environment in general. This paper is expected to provide access to a better approach in understanding and monitoring spatial changes that occur over a long period of time, as well as the ability to recognize patterns of change. Our analysis showed that such a model can be used for research with high scientific reliability.
Author Contributions
U.M.Đ. prepared the data layers, figures, and tables; U.M.Đ., D.R.Đ. and S.T.B. performed the experiments and analyses. S.M.D. and S.R. supervised the research, finished the first draft of the manuscript, edited and reviewed the manuscript, and contributed to the model construction and verification. All authors have read and agreed to the published version of the manuscript.
Funding
This research was funded by Research Project 1.21/2021 “Model for using MGI digital topographic maps in field conditions with portable devices” by the Ministry of Defense of the Republic of Serbia and Research Project 1.23/2022 “Collection of topographical data by unmanned aerial photogrammetric systems” by the Ministry of Defense of the Republic of Serbia.
Data Availability Statement
Not applicable.
Conflicts of Interest
The authors declare no conflict of interest. The funders had no role in the design of the study, in the collection, analyses, or interpretation of data, in the writing of the manuscript, and in the decision to publish the results.
References
- Lillesand, T.; Kiefer, R.W.; Chipman, J. Remote Sensing and Image Interpretation; John Wiley & Sons: Hoboken, NJ, USA, 2015; ISBN 111834328X. [Google Scholar]
- Tobak, Z.; Szatmári, J.; van Leeuwen, B. Small Format Aerial Photography–Remote Sensing Data Acquisition for Environmental Analysis. J. Environ. Geogr. 2008, 1, 21–26. [Google Scholar] [CrossRef]
- Collier, P.; Inkpen, R.; Fontana, D. The Use of Historical Photography in Environmental Studies. Cybergeo Eur. J. Geogr. 2001, 184, 1–9. [Google Scholar] [CrossRef]
- Dyce, M. Canada between the Photograph and the Map: Aerial Photography, Geographical Vision and the State. J. Hist. Geogr. 2013, 39, 69–84. [Google Scholar] [CrossRef]
- Gigović, L.; Drobnjak, S.; Pamučar, D. The Application of the Hybrid Gis Spatial Multi-Criteria Decision Analysis Best–Worst Methodology for Landslide Susceptibility Mapping. ISPRS Int. J. Geoinf. 2019, 8, 79. [Google Scholar] [CrossRef] [Green Version]
- Gong, P. Remote Sensing of Environmental Change over China: A Review. Chin. Sci. Bull. 2012, 57, 2793–2801. [Google Scholar] [CrossRef] [Green Version]
- Pinto, A.T.; Gonçalves, J.A.; Beja, P.; Honrado, J.P. From Archived Historical Aerial Imagery to Informative Orthophotos: A Framework for Retrieving the Past in Long-Term Socioecological Research. Remote Sens. 2019, 11, 1388. [Google Scholar] [CrossRef] [Green Version]
- Bakrač, S.; Milonjić, Z.; Đorđević, D.; Srdić, Z.; Tatomirović, S. Using the Military Geographical Institute Photogrammetric Documentation Archive Data for Scientific and Other Research—The Necessity and Importance of Digitization. In Sinteza 2017—International Scientific Conference on Information Technology and Data Related Research; Sinteza: Oradea, Romania, 2017; pp. 40–43. [Google Scholar] [CrossRef]
- Bakrač, S.; Drobnjak, S.; Stanković, S.; Vučićević, A.; Stamenković, N. Preparation of Photogrammetric Archive Documentation for Scientific and Other Research; Singidunum University: Beograd, Serbia, 2018; pp. 17–22. [Google Scholar]
- Wrobel, B.P. The Evolution of Digital Photogrammetry from Analytical Photogrammetry. Photogramm. Rec. 1991, 13, 765–776. [Google Scholar] [CrossRef]
- Wolf, P.R.; Dewitt, B.A. Elements of Photogrammetry: With Applications in GIS; McGraw-Hill: New York, NY, USA, 2000; Volume 3. [Google Scholar]
- Redecker, A.P. Historical Aerial Photographs and Digital Photogrammetry for Impact Analyses on Derelict Land Sites in Human Settlement Areas. Int. Arch. Photogramm. Remote Sens. Spat. Inf. Sci. 2008, 37, 5–10. [Google Scholar]
- Robinson, A.H.; Kimerling, A.; Li, X.; Ming, X.; Song, W.; Qiu, S.; Qu, Y.; Liu, Z.; Atzeni, P.; Ceri, S.; et al. Elements of Cartography; McGraw-Hill: New York, NY, USA, 1999; Volume 230, ISBN 0471555797. [Google Scholar]
- Conte, G.; Rudol, P.; Doherty, P. Evaluation of a Light-Weight LiDAR and a Photogrammetric System for Unmanned Airborne Mapping Applications. Photogramm. Fernerkund. Geoinf. 2014, 2014, 287–298. [Google Scholar] [CrossRef] [Green Version]
- Szatmári, J.; Tobak, Z.; Novák, Z. Environmental Monitoring Supported by Aerial Photography—A Case Study of the Burnt Down Bugac Juniper Forest, Hungary. J. Environ. Geogr. 2016, 9, 31–38. [Google Scholar] [CrossRef]
- Bakrač, S.; Marković, V.; Drobnjak, S.; Đorđević, D.; Stamenković, N. Using Historical Aerial Photography for Monitoring of Environment Changes: A Case Study of Bovan Lake, Eastern Serbia. J. Environ. Eng. Landsc. Manag. 2021, 29, 305–317. [Google Scholar] [CrossRef]
- Abolmasov, B.; Marjanović, M.; Milenković, S.; Đurić, U.; Jelisavac, B.; Pejić, M. Study of Slow Moving Landslide Umka Near Belgrade, Serbia (IPL-181). In Workshop on World Landslide Forum; Springer: Cham, Switzerland, 2017; pp. 419–427. [Google Scholar] [CrossRef]
- Uroš, Đ.; Biljana, A.; Radmila, P.; Branislav, T. Using ArcGis for Landslide Umka 3D Visualization. In Proceeding of 17th Meeting of the Association of European Geological Societies; Serbian Geological Society: Belgrade, Serbia, 2011; pp. 21–25. [Google Scholar]
- Đurić, U. Quantitative Risk Assessment of “Umka” Landslide near Belgrade; University of Belgrade, Faculty of Mining and Geology: Belgrade, Serbia, 2020. [Google Scholar]
- Cvijić, J. Jezerska Plastika Šumadije; Litografija Kralj. Srp. Drž. Štamparije: Belgrade, Serbia, 1909. [Google Scholar]
- Luković, T.M. Važniji Tipovi Naših Klizišta i Mogućnosti Njihovog Saniranja. Geološki Vesnik Savezne Uprave Geološka Istraživanja 1951, 9, 275–310. [Google Scholar]
- Abolmasov, B.; Milenković, S.; Jelisavac, B.; Vujanić, V. Landslide Umka: The First Automated Monitoring Project in Serbia. In Landslide Science and Practice; Springer: Berlin/Heidelberg, Germany, 2013; pp. 339–345. [Google Scholar]
- Abolmasov, B.; Milenković, S.; Marjanović, M.; Đurić, U.; Jelisavac, B. A Geotechnical Model of the Umka Landslide with Reference to Landslides in Weathered Neogene Marls in Serbia. Landslides 2015, 12, 689–702. [Google Scholar] [CrossRef]
- Corominas, J.; van Westen, C.; Frattini, P.; Cascini, L.; Malet, J.P.; Fotopoulou, S.; Catani, F.; van den Eeckhaut, M.; Mavrouli, O.; Agliardi, F.; et al. Recommendations for the Quantitative Analysis of Landslide Risk. Bull. Eng. Geol. Environ. 2014, 73, 209–263. [Google Scholar] [CrossRef] [Green Version]
- Wolf, P.R.; Dewitt, B.A.; Wilkinson, B.E. Elements of Photogrammetry with Application in GIS; McGraw-Hill: New York, NY, USA, 2014; ISBN 0071761128. [Google Scholar]
- Balogun, A.L.; Rezaie, F.; Pham, Q.B.; Gigović, L.; Drobnjak, S.; Aina, Y.A.; Panahi, M.; Yekeen, S.T.; Lee, S. Spatial Prediction of Landslide Susceptibility in Western Serbia Using Hybrid Support Vector Regression (SVR) with GWO, BAT and COA Algorithms. Geosci. Front. 2021, 12, 101104. [Google Scholar] [CrossRef]
- Ayoub, F.; Leprince, S.; Avouac, J.-P. Co-Registration and Correlation of Aerial Photographs for Ground Deformation Measurements. ISPRS J. Photogramm. Remote Sens. 2009, 64, 551–560. [Google Scholar] [CrossRef]
- Ayoub, F.; Leprince, S.; Keene, L. User’s Guide to COSI-CORR Co-Registration of Optically Sensed Images and Correlation; California Institute of Technology: Pasadena, CA, USA, 2009; Volume 38. [Google Scholar]
- Fensham, R.J.; Fairfax, R.J. Aerial Photography for Assessing Vegetation Change: A Review of Applications and the Relevance of Findings for Australian Vegetation History. Aust. J. Bot. 2002, 50, 415–429. [Google Scholar] [CrossRef]
- Walstra, J.; Dixon, N.; Chandler, J.H. Historical Aerial Photographs for Landslide Assessment: Two Case Histories. Q. J. Eng. Geol. Hydrogeol. 2007, 40, 315–332. [Google Scholar] [CrossRef] [Green Version]
- Casson, B.; Delacourt, C.; Baratoux, D.; Allemand, P. Seventeen Years of the “La Clapière” Landslide Evolution Analysed from Ortho-Rectified Aerial Photographs. Eng. Geol. 2003, 68, 123–139. [Google Scholar] [CrossRef]
- van Westen, C.J.; Lulie Getahun, F. Analyzing the Evolution of the Tessina Landslide Using Aerial Photographs and Digital Elevation Models. Geomorphology 2003, 54, 77–89. [Google Scholar] [CrossRef]
- Fell, R.; Corominas, J.; Bonnard, C.; Cascini, L.; Leroi, E.; Savage, W.Z. Guidelines for Landslide Susceptibility, Hazard and Risk Zoning for Land Use Planning. Eng. Geol. 2008, 102, 85–98. [Google Scholar] [CrossRef] [Green Version]
- Skilodimou, H.; Bathrellos, G.; Koskeridou, E.; Soukis, K.; Rozos, D. Physical and Anthropogenic Factors Related to Landslide Activity in the Northern Peloponnese, Greece. Land 2018, 7, 85. [Google Scholar] [CrossRef] [Green Version]
- Dewitte, O.; Jasselette, J.C.; Cornet, Y.; Collignon, A.; Demoulin, A. Tracking Landslide Evolution over Decades: Application of Aerial Digital Photogrammetry to the Oudenaarde Area (W Belgium). In Proceedings of the IAMG 2006—11th International Congress for Mathematical Geology: Quantitative Geology from Multiple Sources, Madrid, Spain, 22–30 August 2006. [Google Scholar]
- Prokešová, R.; Kardoš, M.; Medveďová, A. Landslide Dynamics from High-Resolution Aerial Photographs: A Case Study from the Western Carpathians, Slovakia. Geomorphology 2010, 115, 90–101. [Google Scholar] [CrossRef]
- Palmisano, F.; Vitone, C.; Cotecchia, F. Methodology for Landslide Damage Assessment. In Proceedings of the Procedia Engineering; Elsevier: Amsterdam, The Netherlands, 2016; Volume 161. [Google Scholar]
- Uzielli, M.; Nadim, F.; Lacasse, S.; Kaynia, A.M. A Conceptual Framework for Quantitative Estimation of Physical Vulnerability to Landslides. Eng. Geol. 2008, 102, 251–256. [Google Scholar] [CrossRef]
| Publisher’s Note: MDPI stays neutral with regard to jurisdictional claims in published maps and institutional affiliations. |
© 2022 by the authors. Licensee MDPI, Basel, Switzerland. This article is an open access article distributed under the terms and conditions of the Creative Commons Attribution (CC BY) license (https://creativecommons.org/licenses/by/4.0/).


 and
and 


