Article

Cross-County Characteristics of Water–Ecology–Economy Coupling Coordination in the Wuding River Watershed, China

1
School of Public Administration, Shandong Technology and Business University, Yantai 264005, China
2
Development Research Center, National Forestry and Grassland Administration, Beijing 100714, China
*
Author to whom correspondence should be addressed.
Land 2022, 11(12), 2283; https://doi.org/10.3390/land11122283
Submission received: 25 November 2022 / Revised: 8 December 2022 / Accepted: 12 December 2022 / Published: 13 December 2022
(This article belongs to the Special Issue Socioeconomic Evaluation of Climate Change Impacts on Land Ecosystems)

Abstract

:
Investigating the coupling coordination relationship between water resources, ecology and the economy is the basis process for watershed governing to achieve sustainable development. Taking the Wuding River watershed (one of the largest tributaries of the Yellow River) as an example, we used the coupling coordination model to analyze the coupling coordination relationship of the water–ecology–economy system between 2001 and 2020, and then used grey correlation and partial correlation analyses to explore the main influencing factors and cross-county characteristic of the coupling coordination. The results show that the water, ecology and economy subsystems changed slightly before 2007. After 2007, the economy developed rapidly, while the water and ecology increased for a short time and then decreased after 2013. The water–ecology–economy coupling coordination was on the verge of dysfunctional decline. Water and ecology were the main influencing factors on the coupling coordination. The coupling coordination showed a cross-county characteristic. Water and ecology in upstream counties had significant positive correlations with the coupling coordination in downstream counties. The economy subsystem in upstream counties, however, had significant negative correlations with water and ecology in downstream counties. Our findings provide an empirical mode to measure transregional characteristics of coupling coordination and could support the construction of a coordination governance mode in the Wuding River watershed.

1. Introduction

Optimizing coordinated relationships between water resources and economic development is a key process for sustainable development in a watershed. Water is an indispensable natural resource for human survival and development [1,2]. A watershed provides clean and sufficient freshwater to support human production and living activities, and helps settlements to grow into cities [3]. The world’s big cities (population > 750,000) cover less than 1% of the land surface; however, their water source watersheds cover around 41% of the land surface [4,5]. From 1900 to 2010, the global water demand has increased by almost eightfold [6]. Driven by future economic development and population growth, more than 2.5 billion people will be exposed to water scarcity in 2050 [7,8]. Economic development, on the other hand, increasingly impacts watersheds because of increased water consumption, point and non-point source pollutions [9,10], which pose a significant constraint on water usability [11]. The conflict between increasing water demand and constrained water usability is one of the most severe challenges for sustainable development [12,13].
Ecological conservation in a water source watershed has been recognized as being more cost effective than investing in additional treatment facilities. The watershed ecosystem links the natural environment and human society [14], and its ecological factors such as vegetation and water quality are affected by socio-economic development [15]. Since 1900, 90% of urban water source watersheds have experienced a degradation in water quality, mainly caused by increasing pollution with sediment, phosphorus and nitrogen [5,16]. Treatment and monitoring, as well as infrastructure investment, have increased to ensure the delivery of clean water, increasing their cost by around 53% for one-third of cities globally [17]. Natural ecological conservation is a more economic path to protect the freshwater supply. The natural ecosystem provides multiple ecosystem services, including water and soil conservation, as well as cleaning up pollutants [18]. In United States, the forest ecosystem provides 50% of the total water yield, although it covers only 36% of the total land surface [19]. In Europe, nutrient pollution is the leading cause of watershed ecosystem degradation [20]. Nutrient pollution weakens ecosystem services and aggregates high treatment costs [21]. In China, the natural ecosystem provides 7.7% of the global freshwater to feed 18.5% of the world population [22]. However, due to the rapid development of industrialization and urbanization, the overuse of water resources, pollutant emissions and aggregated sediment discharge in upper and middle watersheds have caused ecological degradation and limited water resource utilization in downstream areas [23,24]. The contribution of human activity to river flow reduction and aggregated sediment discharge in the Wei River reaches 82.8% and 95.6%, respectively [25]. Establishing the coordinating relationships between water resources, ecology and the economy and eliminating the conflict between upstream and downstream areas are crucial measures for watershed sustainable development in China [26].
The Yellow River watershed is a core birthplace of ancient Chinese civilizations. It supports more than 150 million people and 15% of China’s cropland [27]. In recent decades, siltation sediment, degradation in water quality and river flow reduction have increased substantially in the Yellow River watershed [28,29]. Moreover, the teleconnection between water supply and human activities aggravates conflict between increasing water demand and constrained water usability [17,29,30]. Improved knowledge of the relationship between water resources, ecology and economic development is critical for sustainable development in the Yellow River watershed. As one of the largest tributaries of the Yellow River, Wuding River is known as “the Pocket Yellow River”. It is the main source of the sediment load of the Yellow River [31]. Its average annual sediment load is over 2 × 10⁸ t, which accounts for one eighth of the total sediment load of the Yellow River [32]. Water resources are the basic driving factor for the ecological situation and economic development in the watershed [33]. Since the 1960s, in order to reduce soil erosion and improve the ecological environment, a series of engineering measures including vegetation restoration and dam construction [34,35,36] have been carried out and have changed the hydrological processes in the Yellow River watershed [37,38,39]. These measures have improved vegetation cover [40,41] and resulted in significant reductions in runoff and annual sediment discharge [33,40,42,43,44,45]. However, few studies have explored the relationship between water resources, ecology and economic development, as well as the teleconnection between upstream and downstream areas. Thus, we integrated remote sensing data and meteorological data with economic and social statistical records to investigate the coupling coordination relationship between water resources, ecology and economic development in the Wuding River watershed during the period of 2001–2020. Then, we explored the cross-county characteristics of the coupling coordination relationship between the upstream and downstream areas. Based on the coupling coordination relationship and its cross-county characteristics, our study can provide decision support to construct a collaborative governance mode in the watershed. Specifically, we addressed the following questions: (1) what is the coupling coordination relationship between water resources, ecology and economic development in the Wuding River watershed? (2) Does the coupling coordination relationship have cross-county characteristics?

2. Materials and Methods
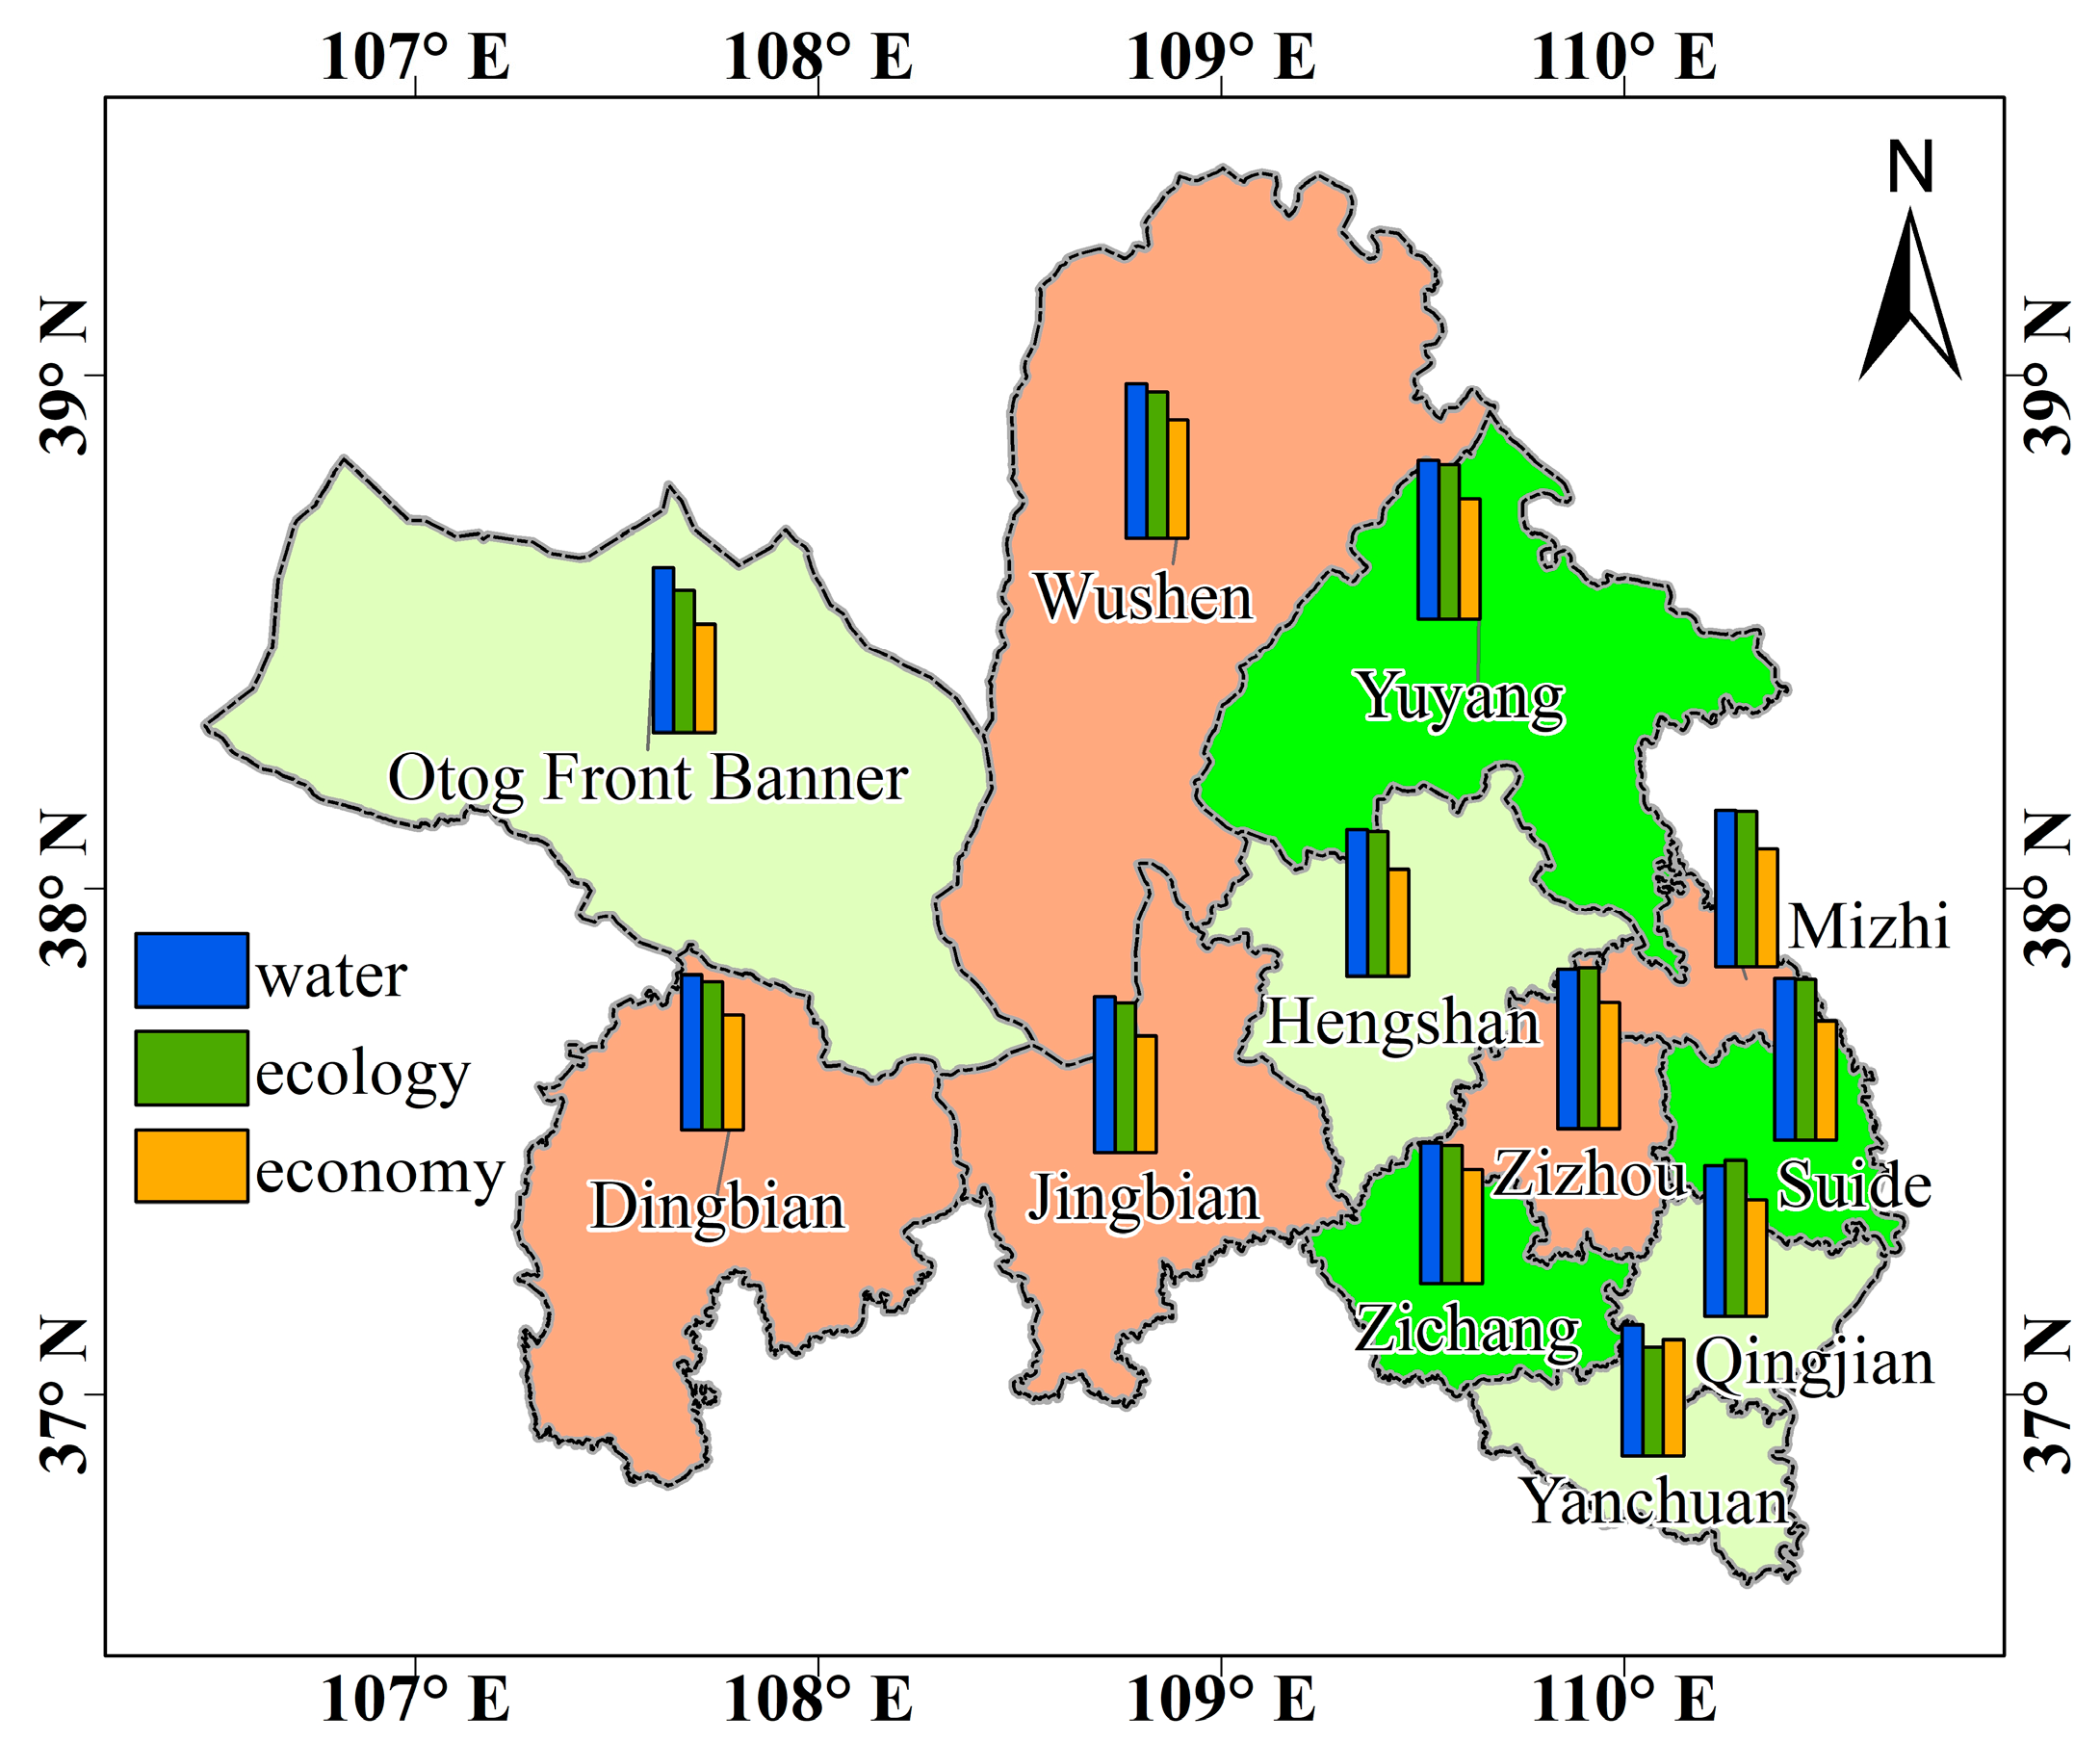
2.1. Study Area

The Wuding River rises at the northern foot of Baiyu Mountain in Shaanxi Province and has a total length of 491.2 km. The river flows through 12 counties and banners in total. Figure 1 shows spatial patterns of elevation (a), vegetation leaf area index (b), average annual temperature (c) and total annual precipitation (d) of the Wuding River watershed. The elevation of the watershed rises from the downstream area of the eastern watershed to the upstream area of the western watershed. The vegetation leaf area index increases from west and northwest to southeast. The Wuding River watershed has a temperate monsoon climate. The mean annual temperature decreases from low elevations in river valleys to high elevations in northern and southern parts of the watershed. The mean annual precipitation increases from northwest to southeast.

2.2. Evaluation Index System and Data

Following evaluation indices in previous studies and taking data availability into account, we established the evaluation index system (Table 1) to investigate the water–ecology–economy coupling coordination relationship. The water, ecology and economy subsystems were the target layers. Water resources provide freshwater for economic development, and should be used efficiently to achieve sustainable development. The water subsystem thereby contained the water resource situation (including annual total precipitation, surface water and groundwater storages) and water resource utilization (including water consumption per capita and per million yuan, and domestic water). The watershed ecosystem produces freshwater and cleans up pollutants, so the ecology subsystem contained ecosystem functions (including net primary productivity, water conservation capacity, vegetation leaf area index) and pollutant emissions (including wastewater, solid waste and waste gas emissions). Different economic development qualities and structures have different water utilization efficiencies. The economy subsystem consequently contained the economic and social situation (including gross domestic product per capita, fixed investment per capita, disposable income) and the industrial structure (including proportions of different industries). The index weights were determined by the entropy weight method.
The precipitation records for between 2001 and 2020 were derived from the China Meteorological Data Network (http://data.cma.cn/, accessed 15 July 2022), and were interpolated to the spatial raster data by means of ANUSplin software. The ANUSplin software incorporates the elevation factor as a covariate with the independent spline variables using the partial thin plate spline method, and has a higher accuracy than other interpolation methods in obtaining spatially continuous meteorological data in mountainous area [46]. The surface water storage, pollutant emissions and economic indices subsystems were derived from the official statistical yearbook (http://www.stats.gov.cn/tjsj/, accessed 15 July 2022). Groundwater storage was derived from the Gravity Recovery and Climate Experiment (GRACE) dataset of the Center for Space Research (CSR), National Aeronautics and Space Administration (NASA) [47]. Net primary productivity (NPP) and vegetation leaf area (LAI) data were derived from the Moderate Resolution Imaging Spectro radiometer (MODIS) of the National Aeronautics and Space Administration (NASA) [48,49]. The water conservation capacity was calculated by annual total precipitation minus annual total evapotranspiration (ET). The ET data were derived from the MODIS ET dataset [50].

2.3. Statistical Methods

2.3.1. Coupling Coordination Model

First, we calculated the subsystem evaluation index and comprehensive index of all subsystems [51]. The original data were standardized to eliminate different magnitudes and unit between different indices. The calculation equation is as follows:
Positive indices:
  X tij   = X tij     X min X max     X min      X min     X tij     X max
Negative indices:
    X tij   = X max     X tij X max     X min      X min     X tij     X max
where Xtij is the original jth value in the index array of county i in t year; X′tij is the standardized value; and Xmax and Xmin are the maximum and minimum values of the original index array, respectively.
The subsystem evaluation index of water, ecology and economy is calculated as follows, respectively:
  U i = 1 , 2 , 3 = i = 1 n ω i X tij ,   i = 1 n ω i = 1  
where Ui is the evaluation index of the ith subsystem, and ω i is the index weight of the ith index.
The comprehensive index of water–ecology–economy is calculated as follows:
T = α U 1 + β U 2 + γ U 3
where T is the comprehensive index of water–ecology–economy; α, β, and λ are the subsystem weights of water, ecology and economy, respectively. Following previous studies [51,52,53], the subsystem weights of water resources (α), ecology (β) and economy (λ) are defined as 0.3, 0.4 and 0.3, respectively.
Second, the coupling degree is calculated as follows:
C = n { ( U 1 , U 2 , U 3 )   /   [ ( U 1 + U 2 + U 3 ) ] } 1 n
where C is the coupling degree and it ranges from 0 to 1; n is the number of all subsystems; When C = 1, there is the strongest coupling relationship between the three subsystems.
Third, to measure the coupling coordination relationship of water resources, ecology and the economy, the coupling coordination degree is calculated as follows:
D = C   ×   T
where D is the coupling coordination degree. Table 2 shows the classification of the coupling coordination degree.

2.3.2. Grey Correlation Analysis Model

We used grey correlation analysis to compare contributions of different subsystems on their coupling coordination relationship in each county. The grey correlation analysis uses the similarity degree between geometric shapes of parent sequence and subsequences to judge their correlation degree [54]. The coupling coordination degree (D) of each county in Wuding River Watershed in 2001–2020 was set as a parent sequence, while the concurrent water resource evaluation index (U1), ecology evaluation index (U2) and economy evaluation index (U3) were set as subsequences, respectively.
First, the original datasets were standardized using Equations (1) and (2). Then, the standardized data were used to calculate the correlation coefficient. The calculation equation is as follows:
R ij ( t ) = min i min j | x i ( t ) - y i ( t ) |   ×   ρ | x i ( t )   -   y j ( t ) | | x i ( t ) - y j ( t ) |   + ρ max i max j | x i ( t )   -   y j ( t ) |
where yi and xi are the parent sequence and subsequence at the sampling point t, respectively, ρ is the resolution coefficient, and we took ρ = 0.5 in the study.
The correlation degree of each subsequence xij is calculated as follows:
x ij = 1 n i , j = 1 n R ij ( t )   0     x ij     1  
where xij is the correlation degree; n is the number of samples.

3. Results

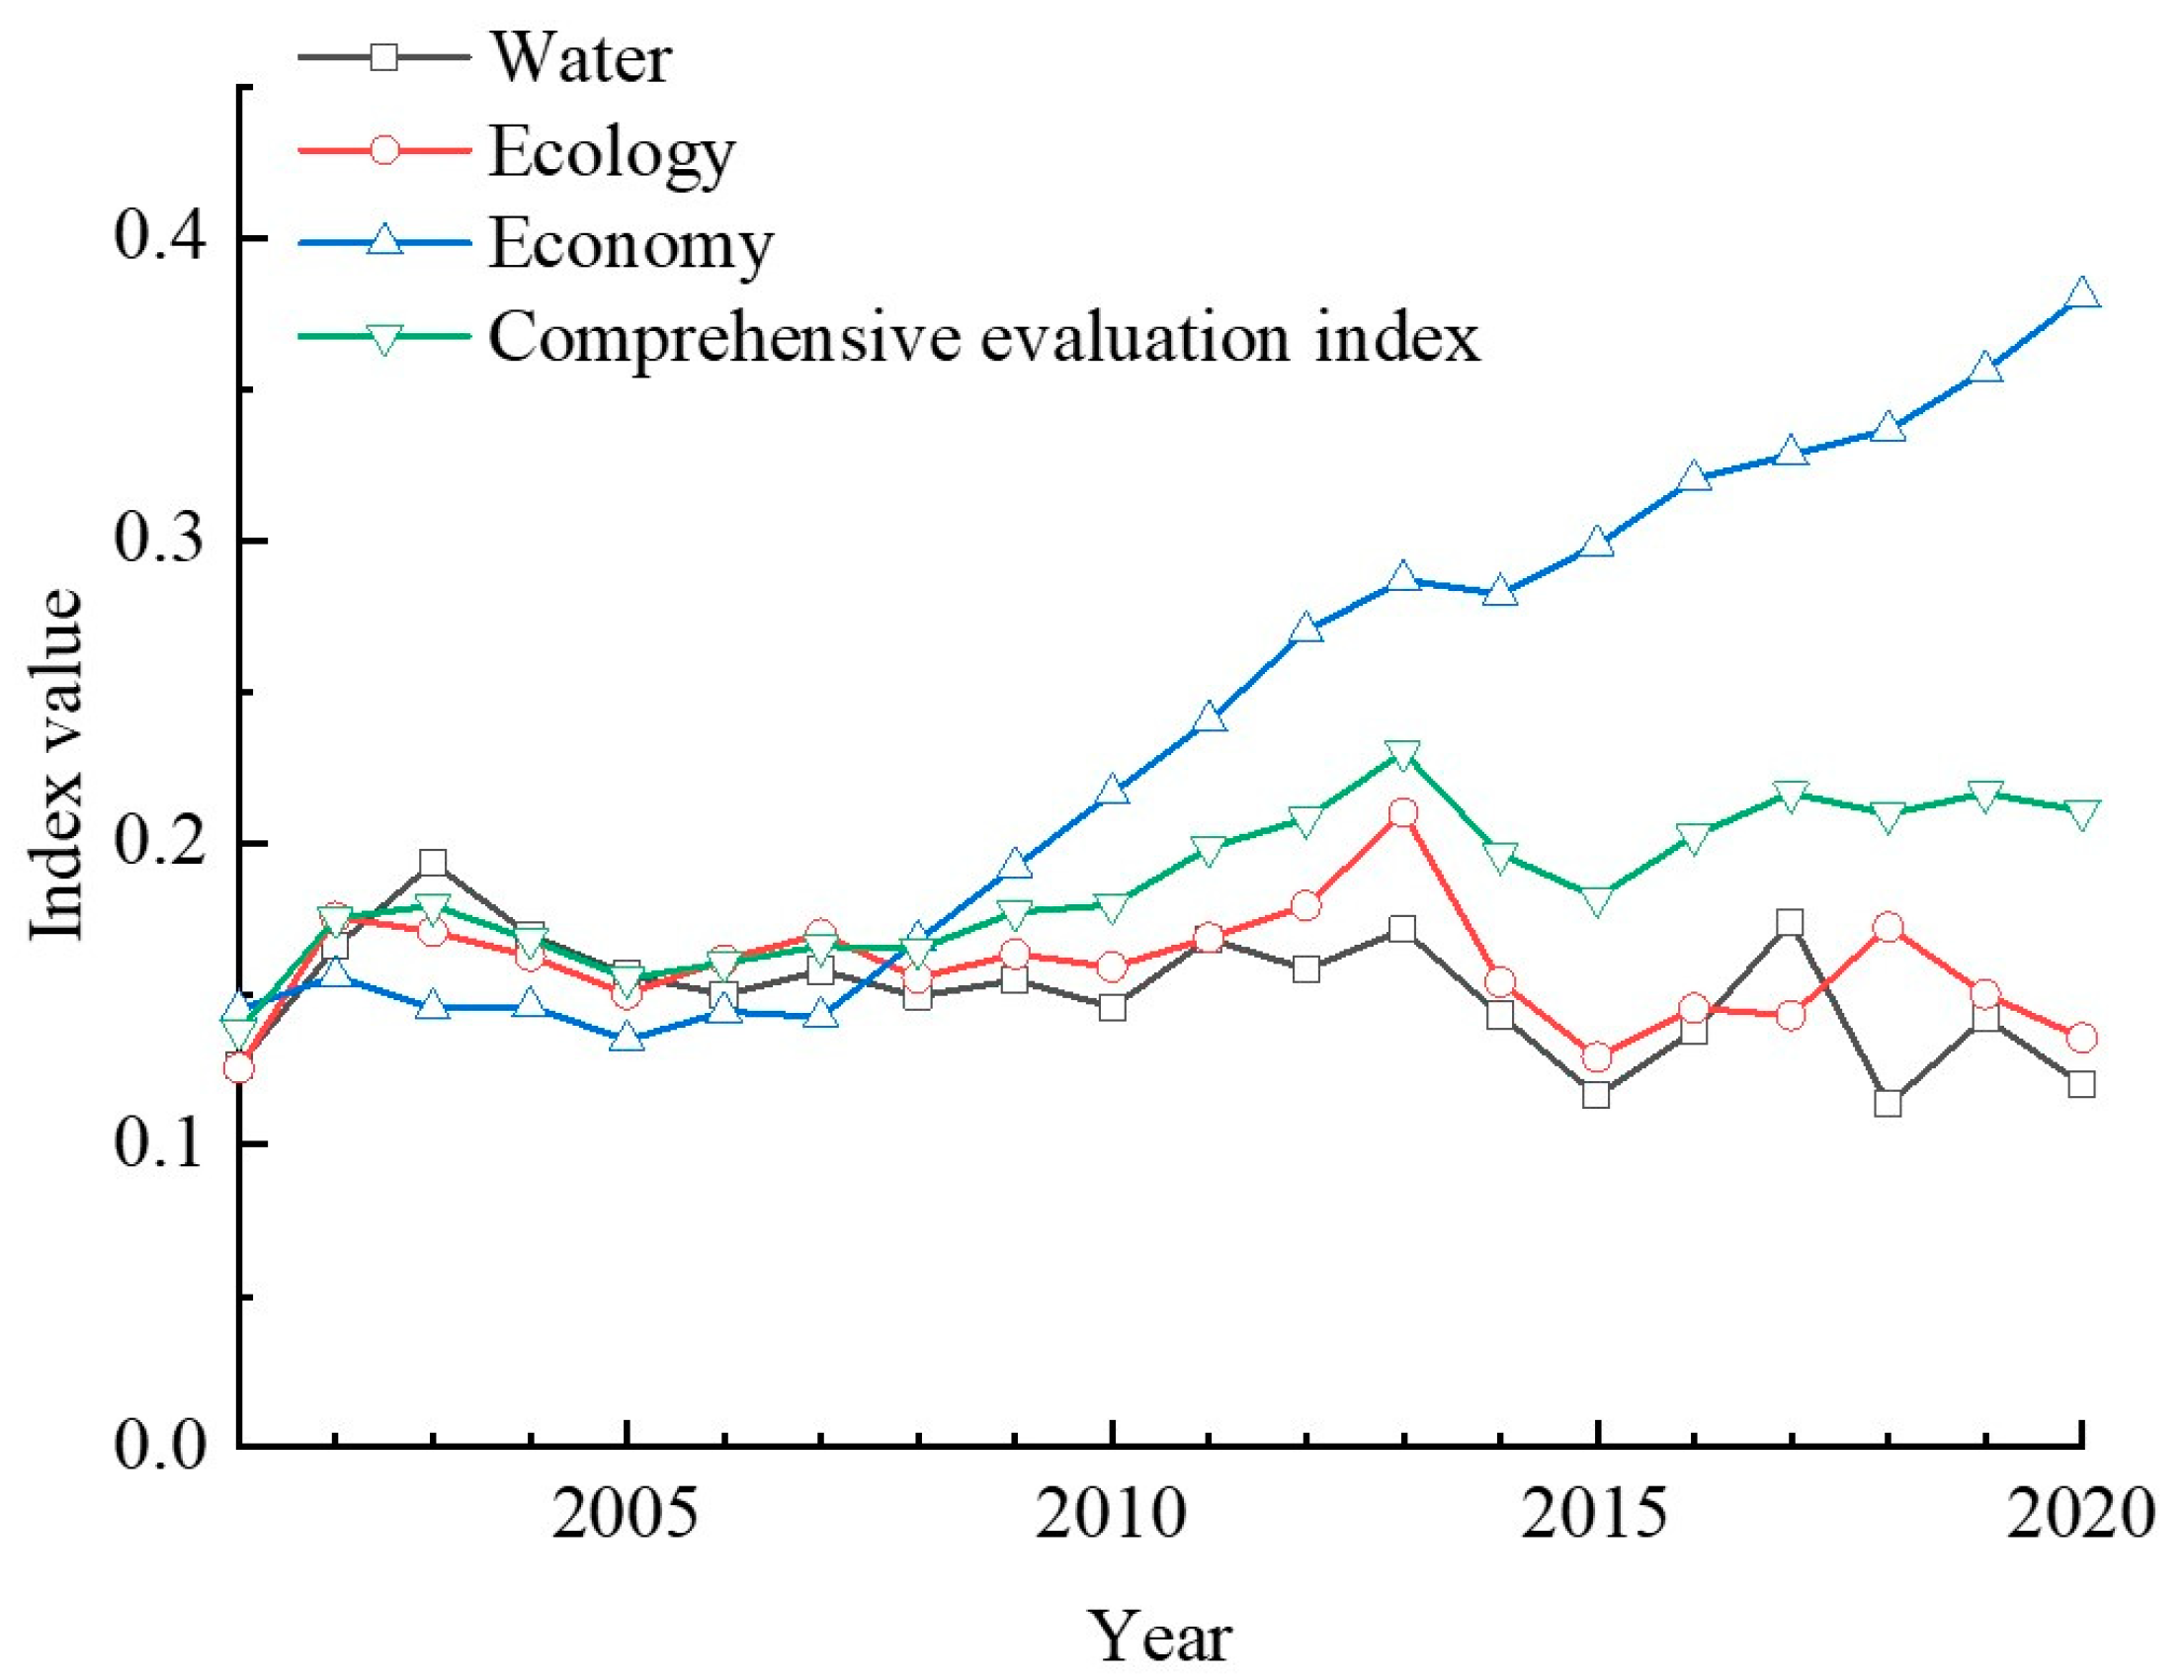
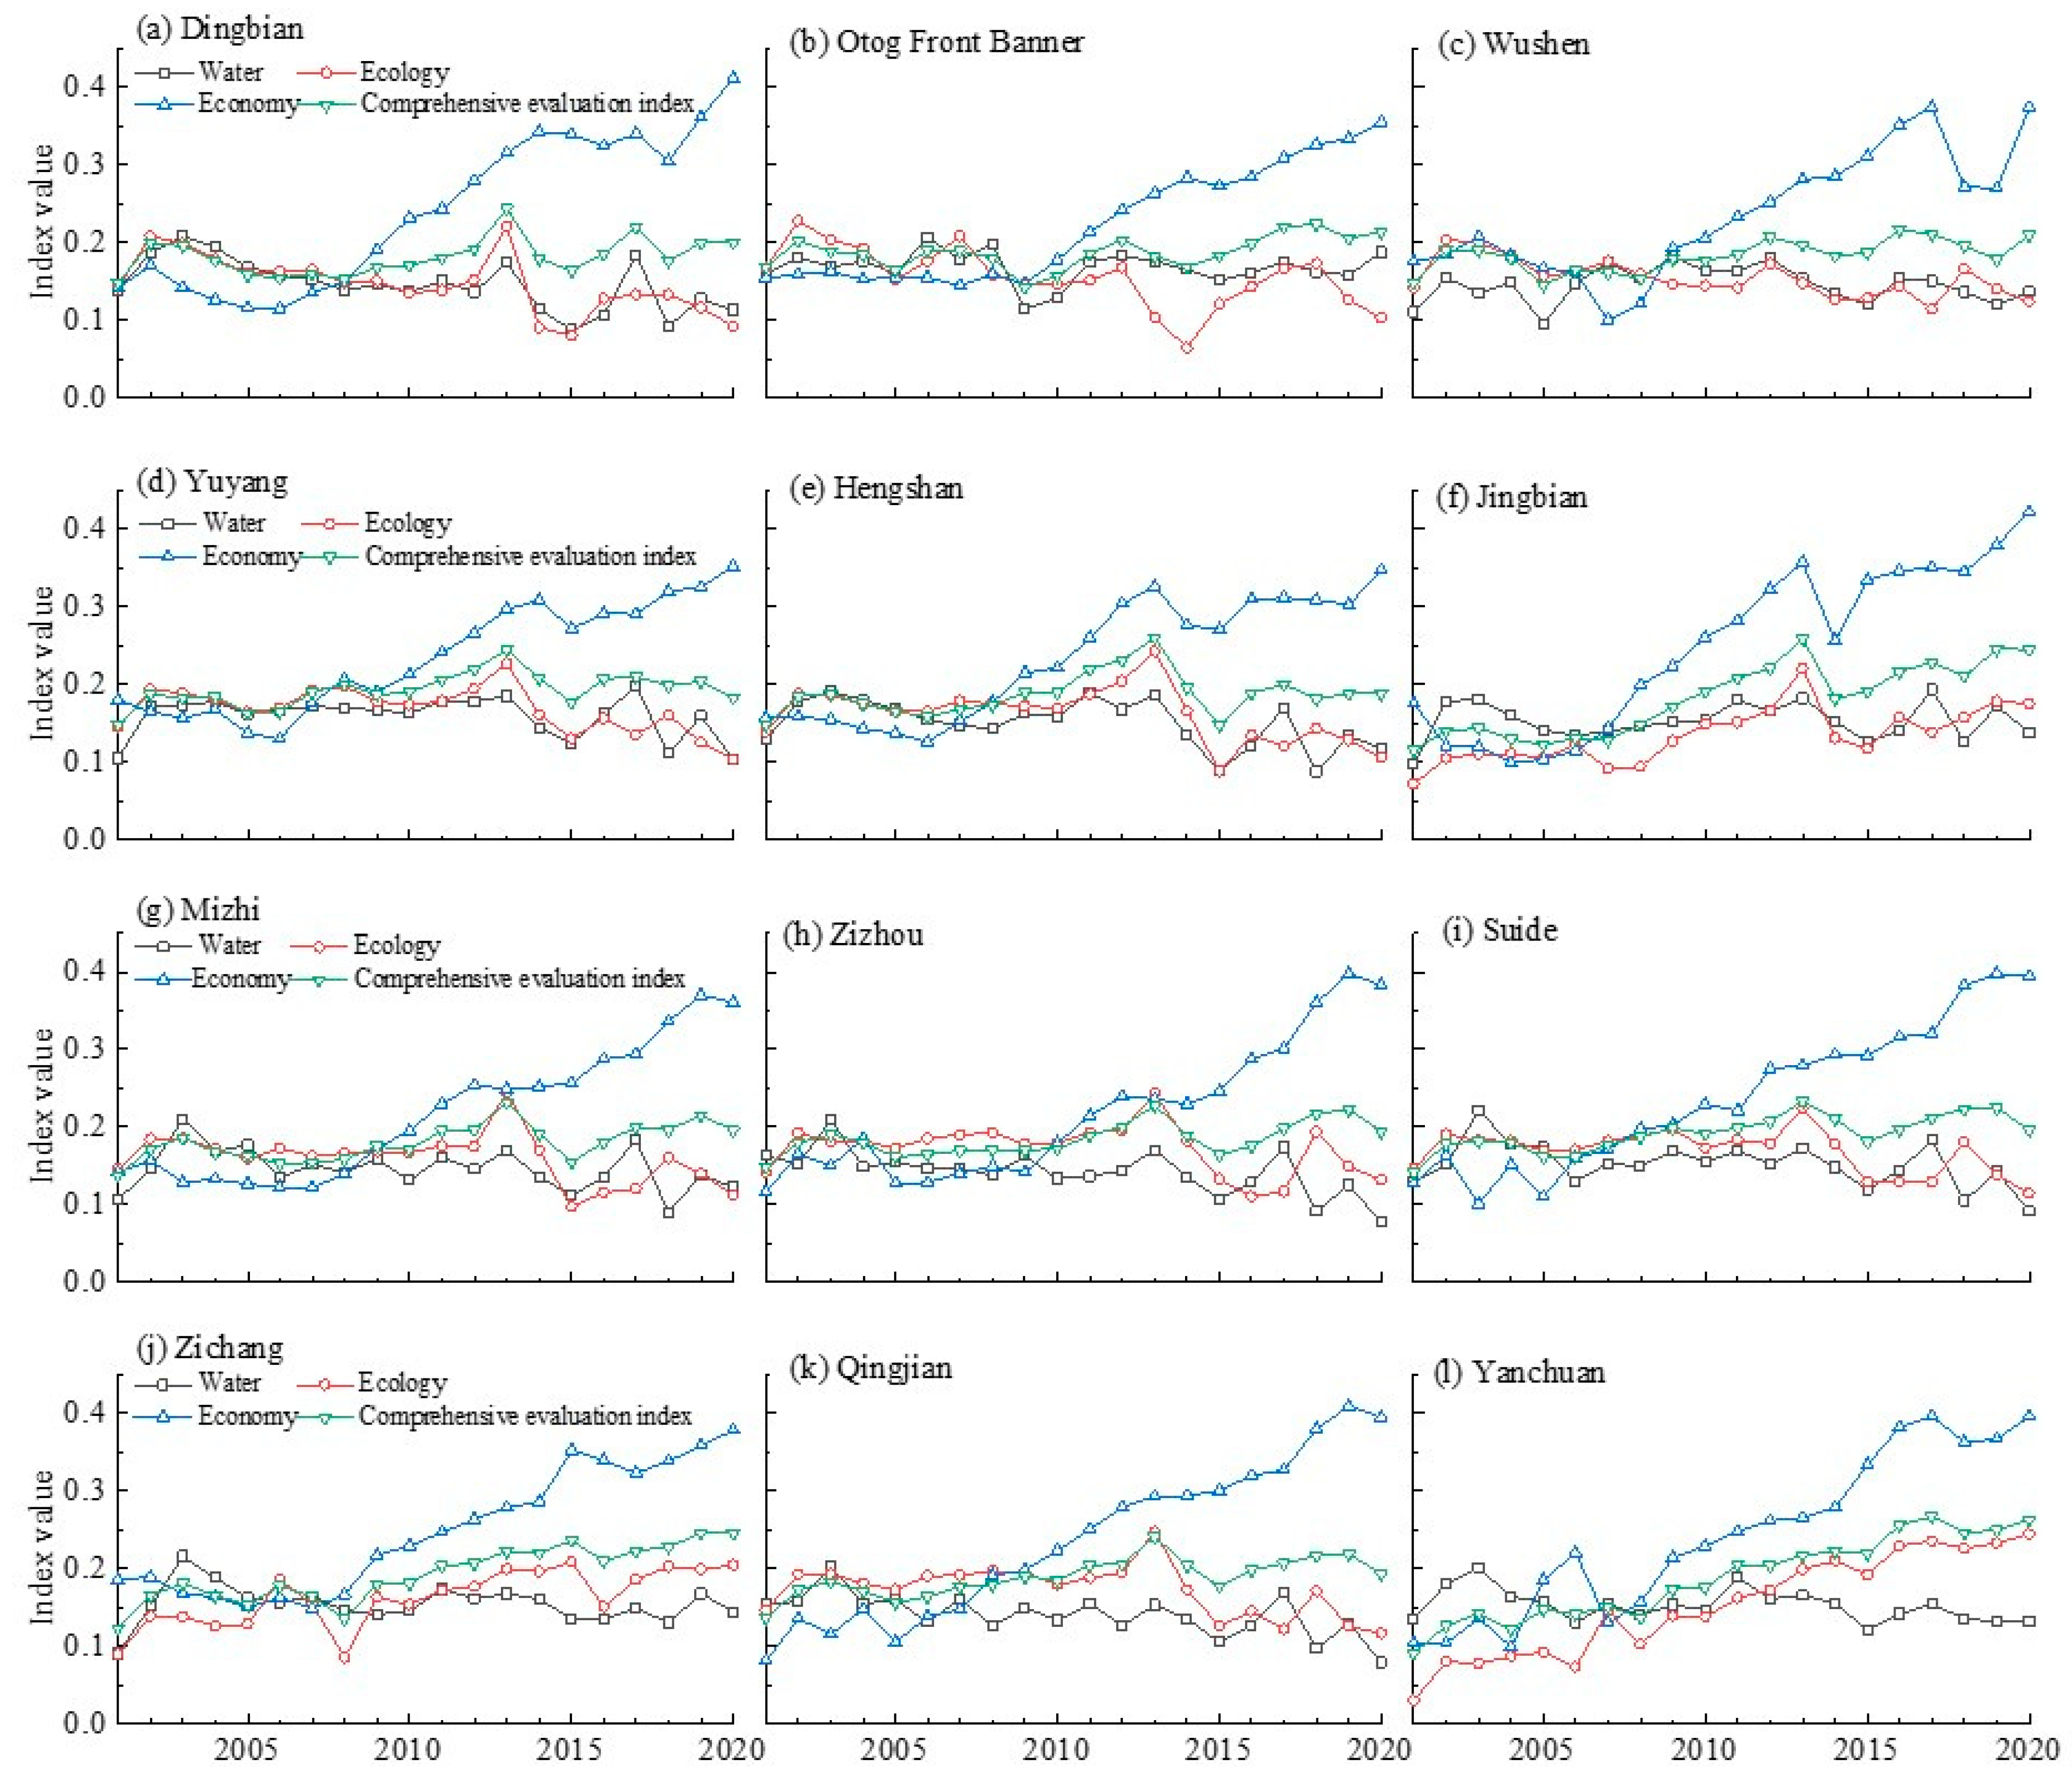
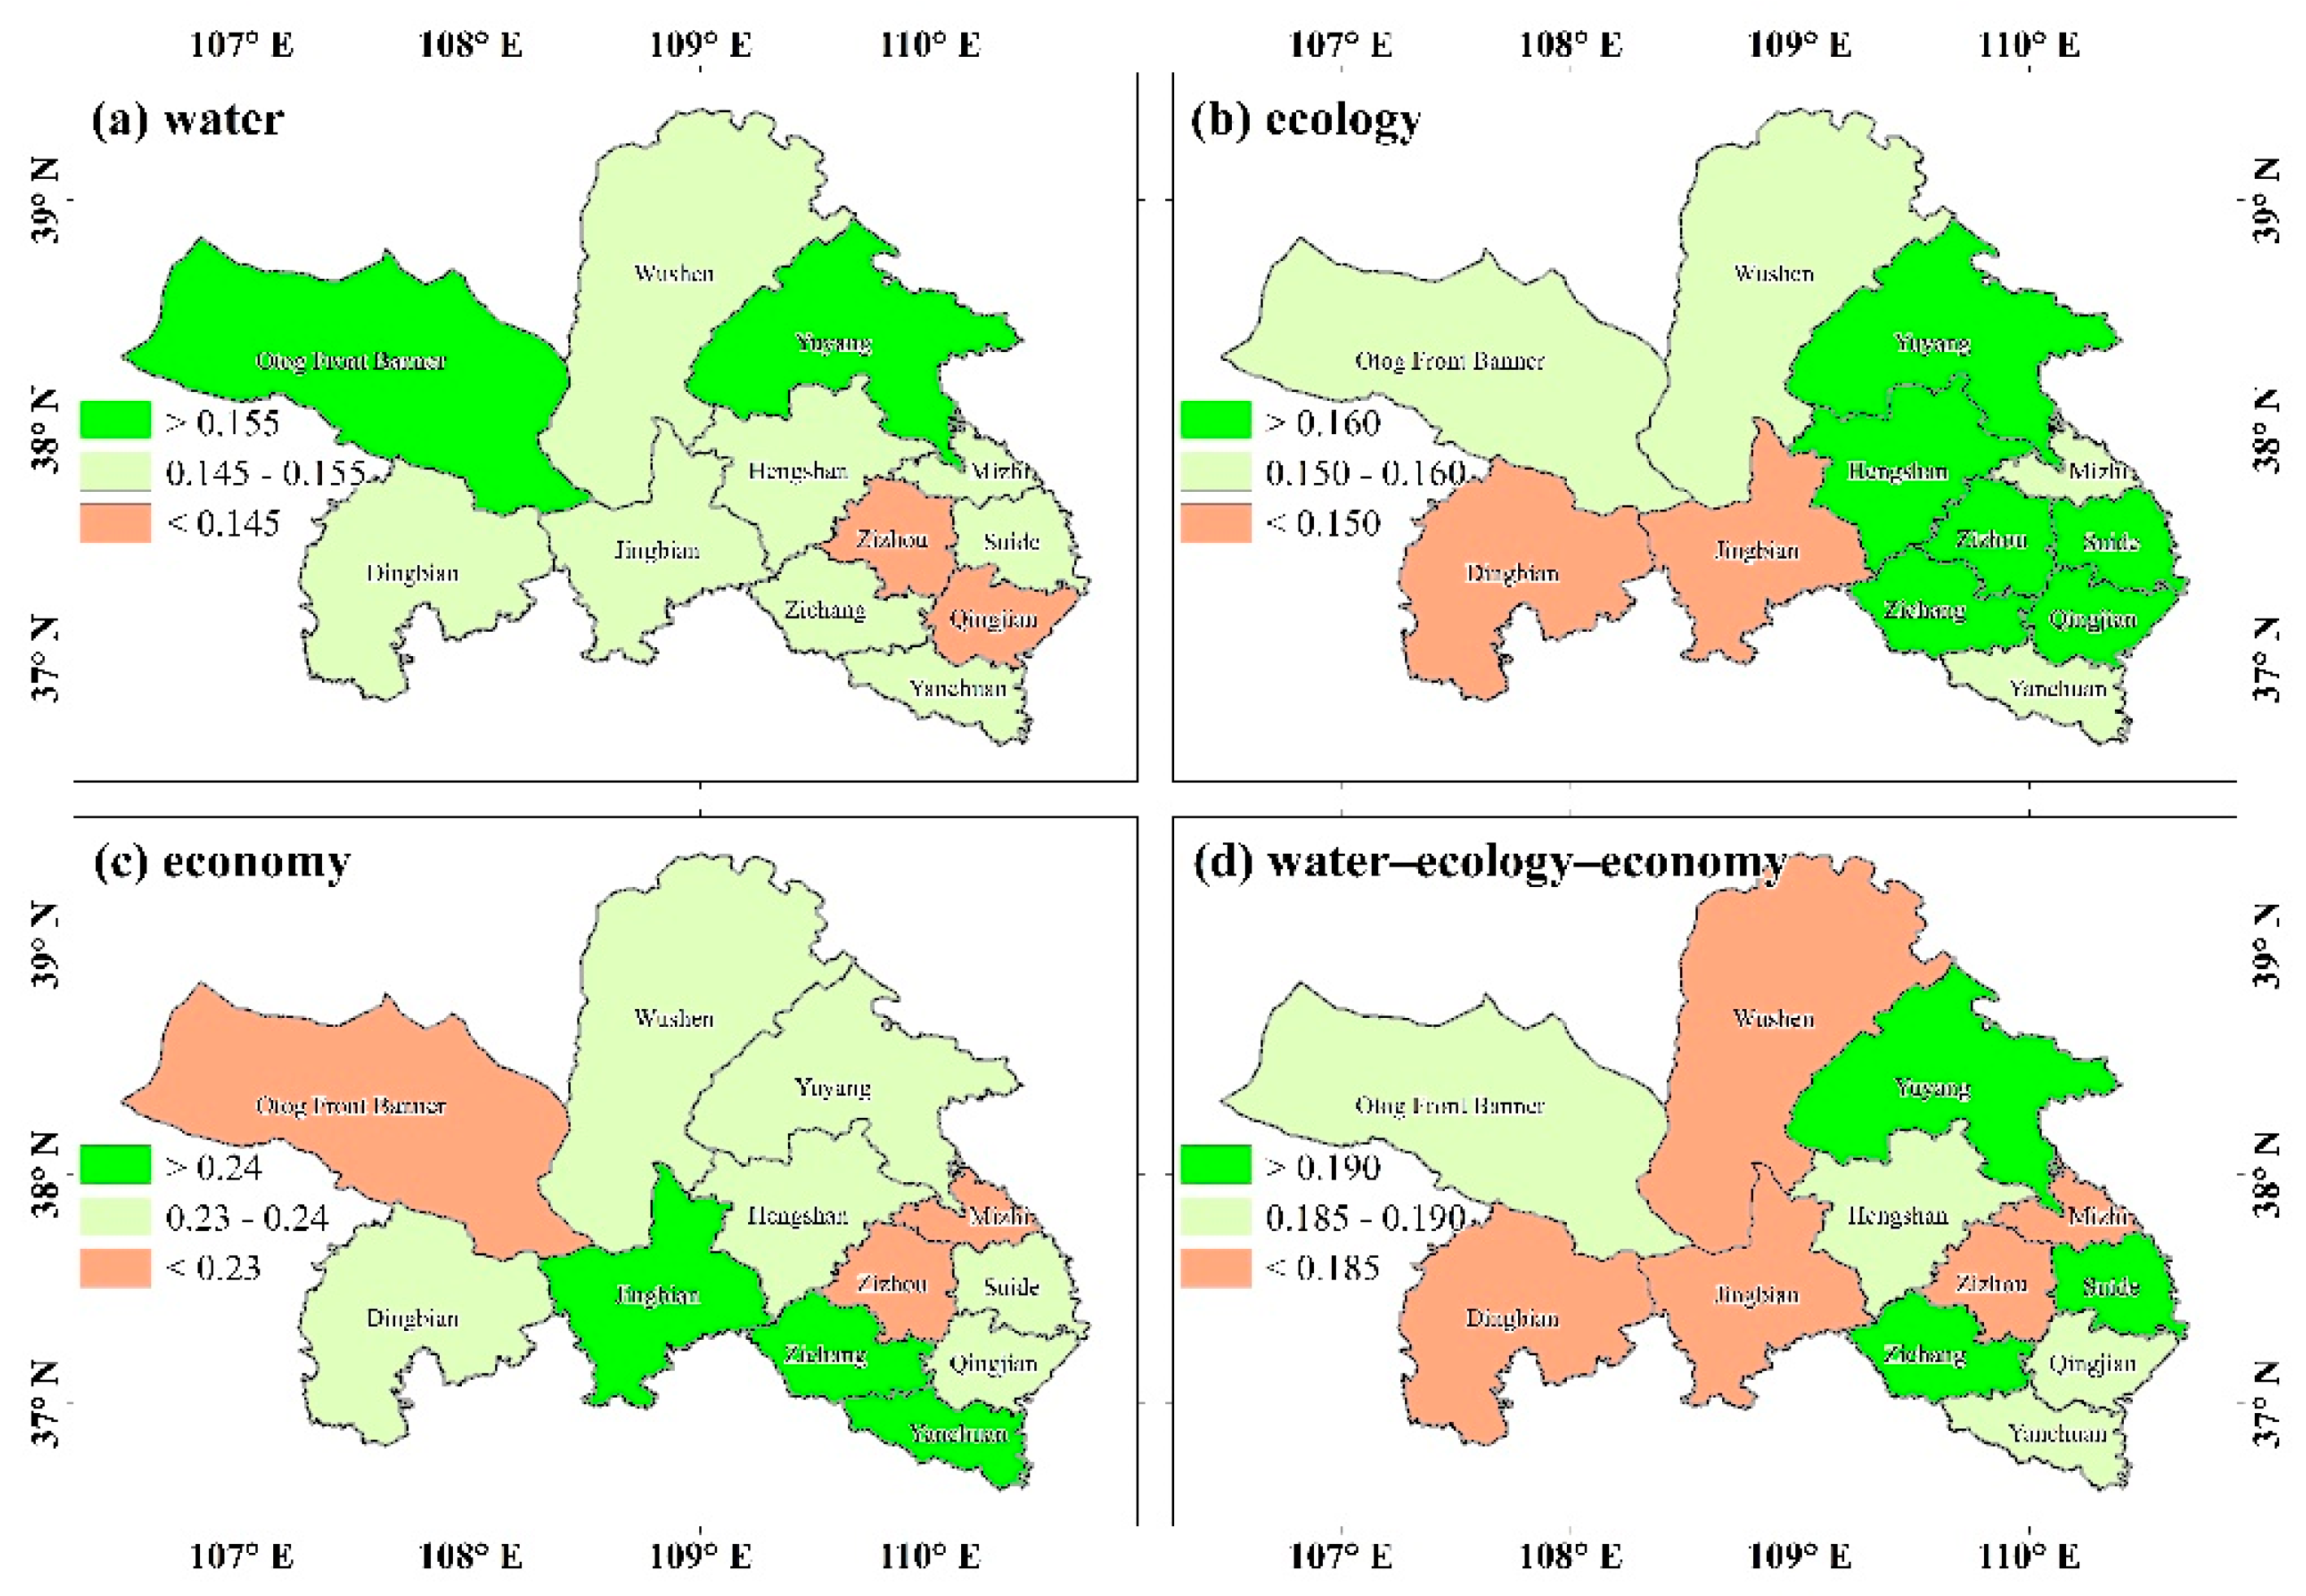
3.1. Spatio-Temporal Patterns of Evaluation Indices of Water Resource, Ecology and Economy Subsystems and Their Comprehensive Index

Figure 2 shows interannual change trends in evaluation indices of water, ecology and economy subsystems and their comprehensive index from 2001 to 2020. The water evaluation index was stable during the period of 2001–2020. From 2001 to 2007, evaluation indices of the ecology and economy subsystems were stable between 0.1 and 0.2. After 2007, the economy evaluation index rose rapidly with a percentage increase rate of 7.88% (R2 = 0.97, p < 0.01), showing an increasing gap with other subsystems. The ecology evaluation index experienced a short increase from 2007 to 2013, and then decreased non-significantly. The comprehensive index was stable before 2007, then increased between 2007 and 2013 with a percentage increase rate of 5.58% (R2 = 0.92, p < 0.01), and changed non-significantly after 2013.
Figure 3 shows the interannual change trends in the evaluation indices of the water resource, ecology and economy subsystems and their comprehensive index in each county from 2001 to 2020. During the period of 2001–2007, the evaluation indices of the water, ecology and economy subsystems in all counties experienced non-significant changes. From 2007, the economy evaluation indices increased significantly in all counties. The ecology evaluation index increased significantly in Yanchuan, but decreased significantly in Dingbian and Yuyang.
Figure 4 shows the spatial patterns of the mean value of the water, ecology and economy subsystem evaluation indices and their comprehensive index, respectively, during the period of 2001–2020. The water subsystem evaluation indices were higher in Otog Front Banner and Yuyang, but were lower in Zizhou and Qingjian counties in downstream areas than in other counties. The ecology subsystem evaluation indices were higher in middle and downstream counties, but were lower in Dingbian and Jingbian than in other counties. The economy subsystem evaluation indices were higher in Jingbian, Zichang and Yanchuan, but lower in Mizhi, Zizhou and Otog Front Banner than in other counties. The water–ecological–economic comprehensive indices were higher in Yuyang, Zichang and Yuyang, but were lower in Mizhi, Dingbian, Jingbian and Wushen than in other counties.

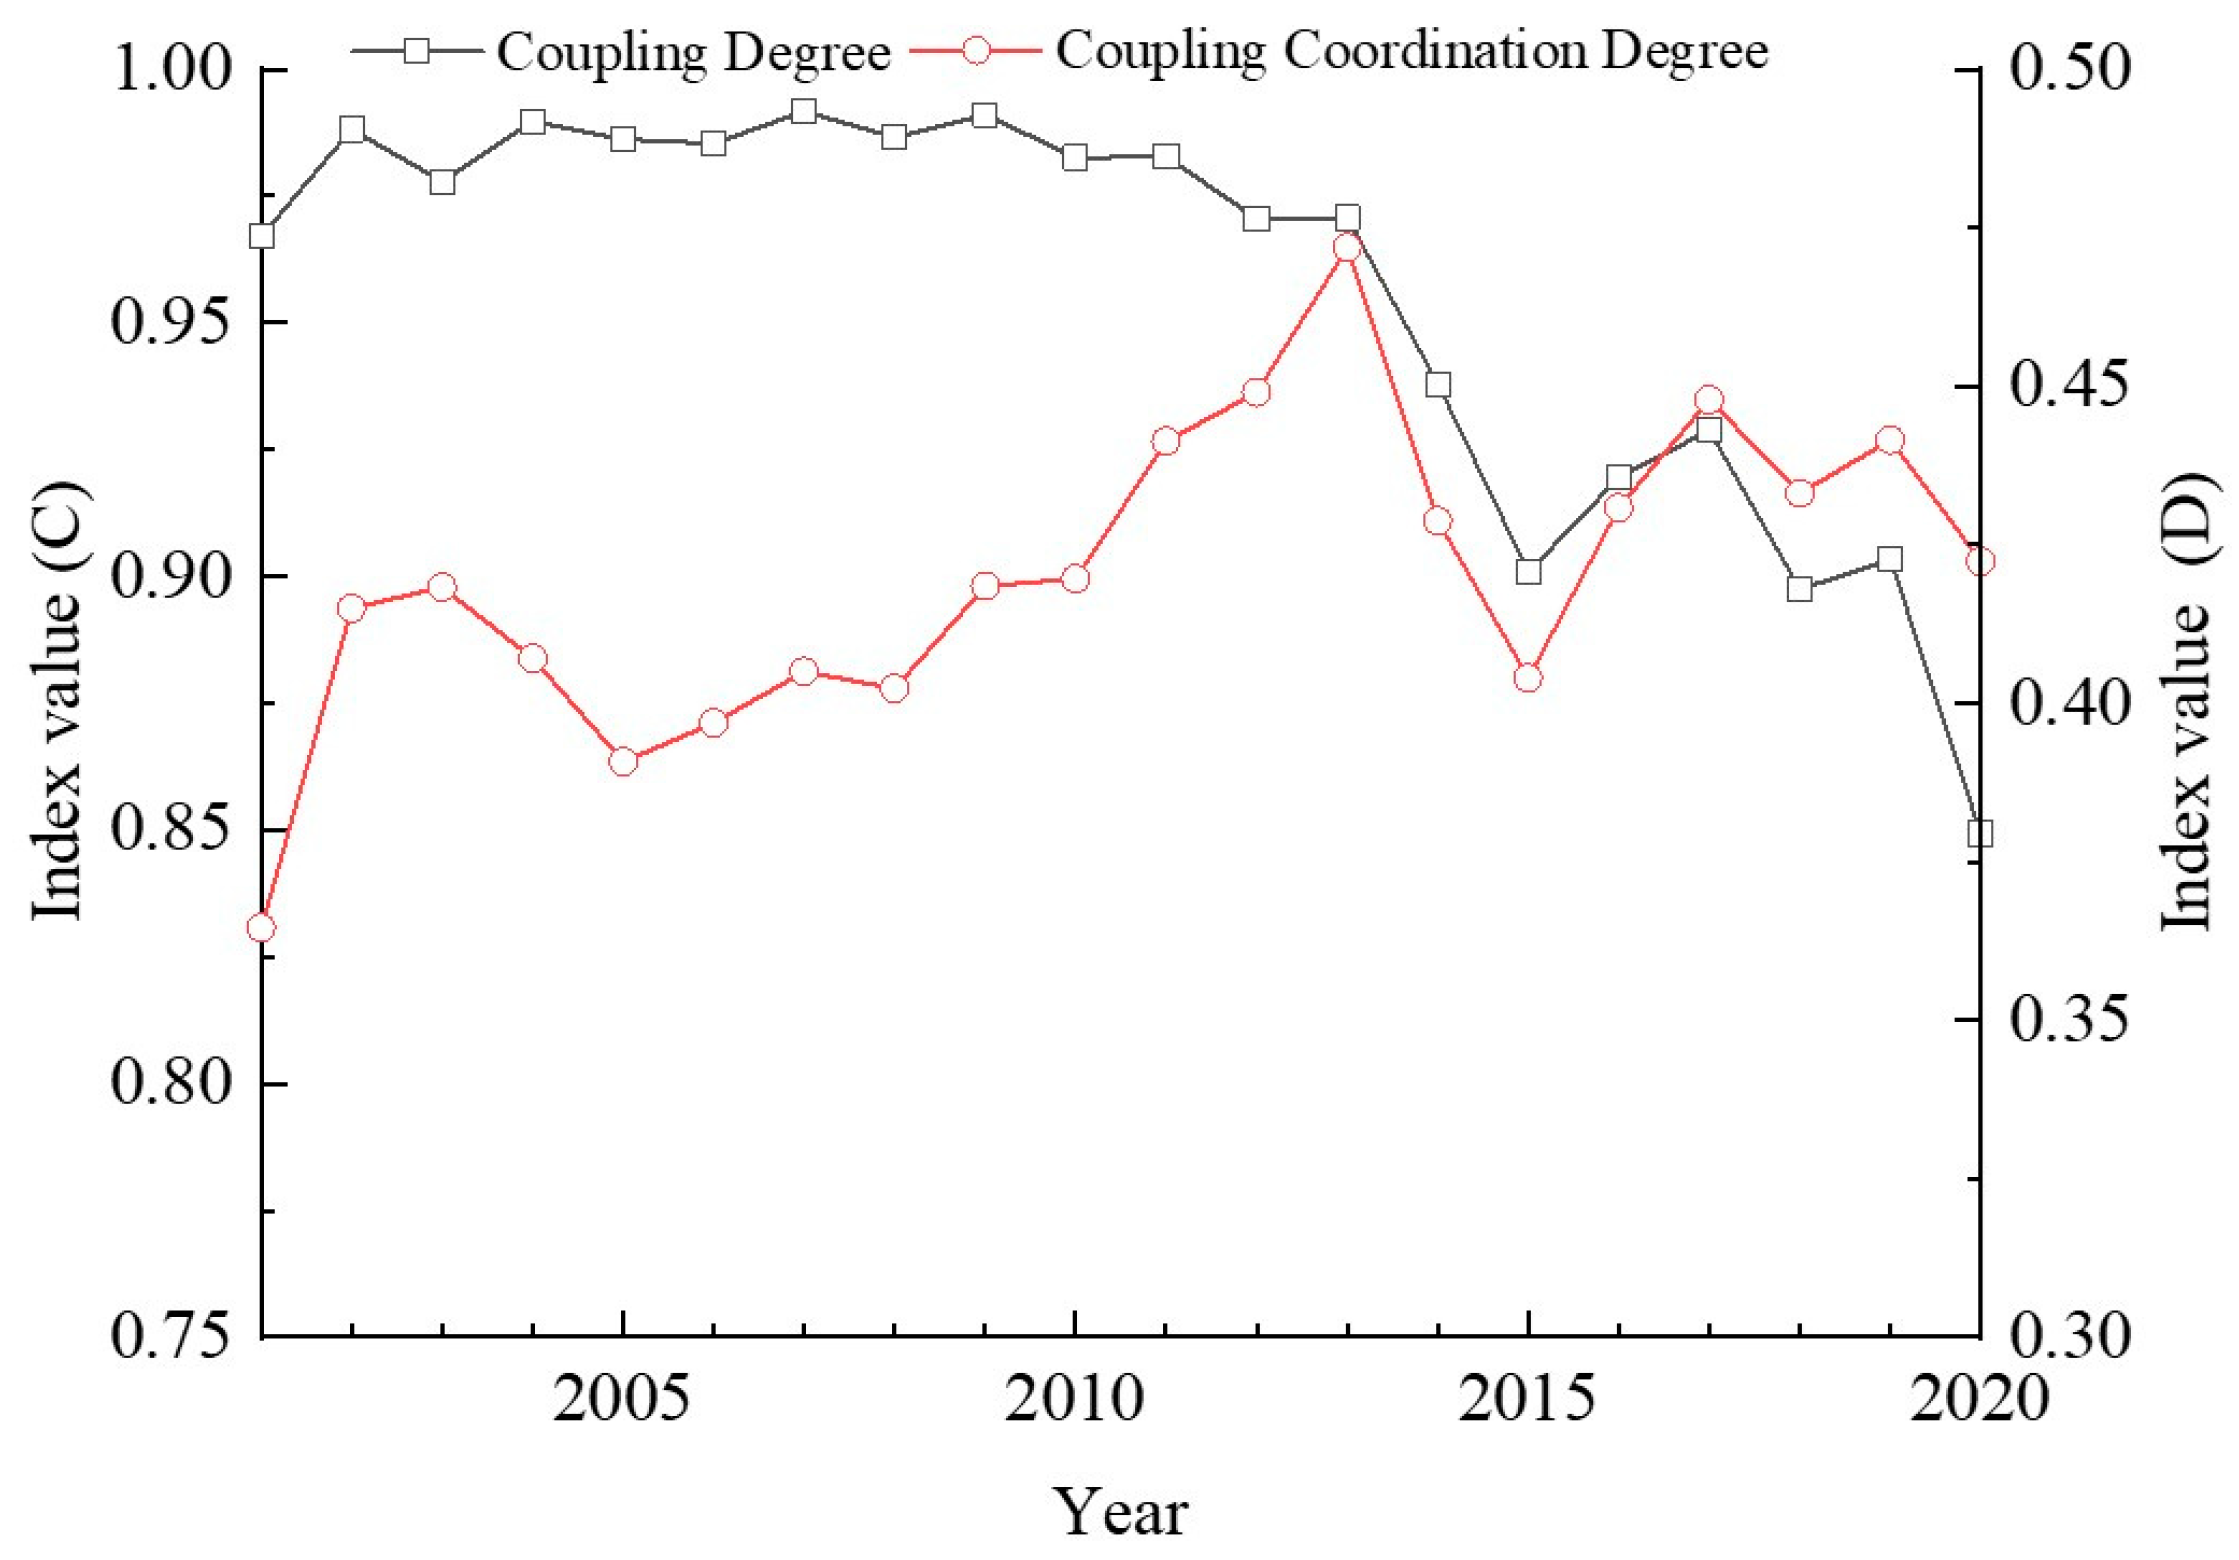
3.2. Spatio-Temporal Patterns of the Coupling Degree and Coupling Coordination Degree of the Water–Ecology–Economic System

Figure 5 shows the interannual change trends in the water–ecology–economy coupling degree and coupling coordination degree from 2001 to 2020. The coupling degree was stable (mean: 0.84; STD: 0.13) during the period of 2001–2013, and then decreased significantly (R2 = 0.40, p < 0.01). Generally, the coupling coordination degree was on the verge of dysfunctional decline during the period of 2001–2020 (mean: 0.42; STD: 0.02). The interannual change trend in the coupling coordination degree, however, showed different trends between the period before 2013 and the period after 2013. The coupling coordination degree increased significantly by a percentage increase rate of 2.12% (R2 = 0.62, p < 0.01) from 2001 to 2013, then decreased significantly (R2 = 0.10, p < 0.01).
Figure 6 shows interannual change trends in the water–ecology–economy coupling degree and coupling coordination degree in each county from 2001 to 2020. The water–ecology–economy coupling coordination degrees of all counties were on the verge of unbalanced development. From 2001 to 2020, the coupling coordination degree of Zichang and Jingbian increased significantly, but the coupling coordination degrees of Dingbian, Hengshan, Mizhi, Qingjian and Suide reached the highest value in 2013 and then decreased significantly.

3.3. Contributions of Water, Ecology, Economy Subsystems on Their Coupling Coordination Degree

Figure 7 shows the spatial patterns of grey correlation degree between the water resource (U1), ecological (U2), and economic (U3) subsystem evaluation indices and their coupling coordination degree, respectively. The grey correlation degrees of the water resource, ecology and economy subsystems were ranked as U1 > U2 > U3 in Dingbian, Otog Front Banner, Wushen, Yuyang, Hengshan, Jingbian, Mizhi, Suide and Zichang, indicating that the water resource subsystem was the main influencing subsystem on their coupling coordination degree. The grey correlation degrees of the water resource, ecology and economy subsystems were ranked as U2 > U1 > U3 in Zizhou and Qingjian, indicating that ecology was the main influencing subsystem on their coupling coordination degree.

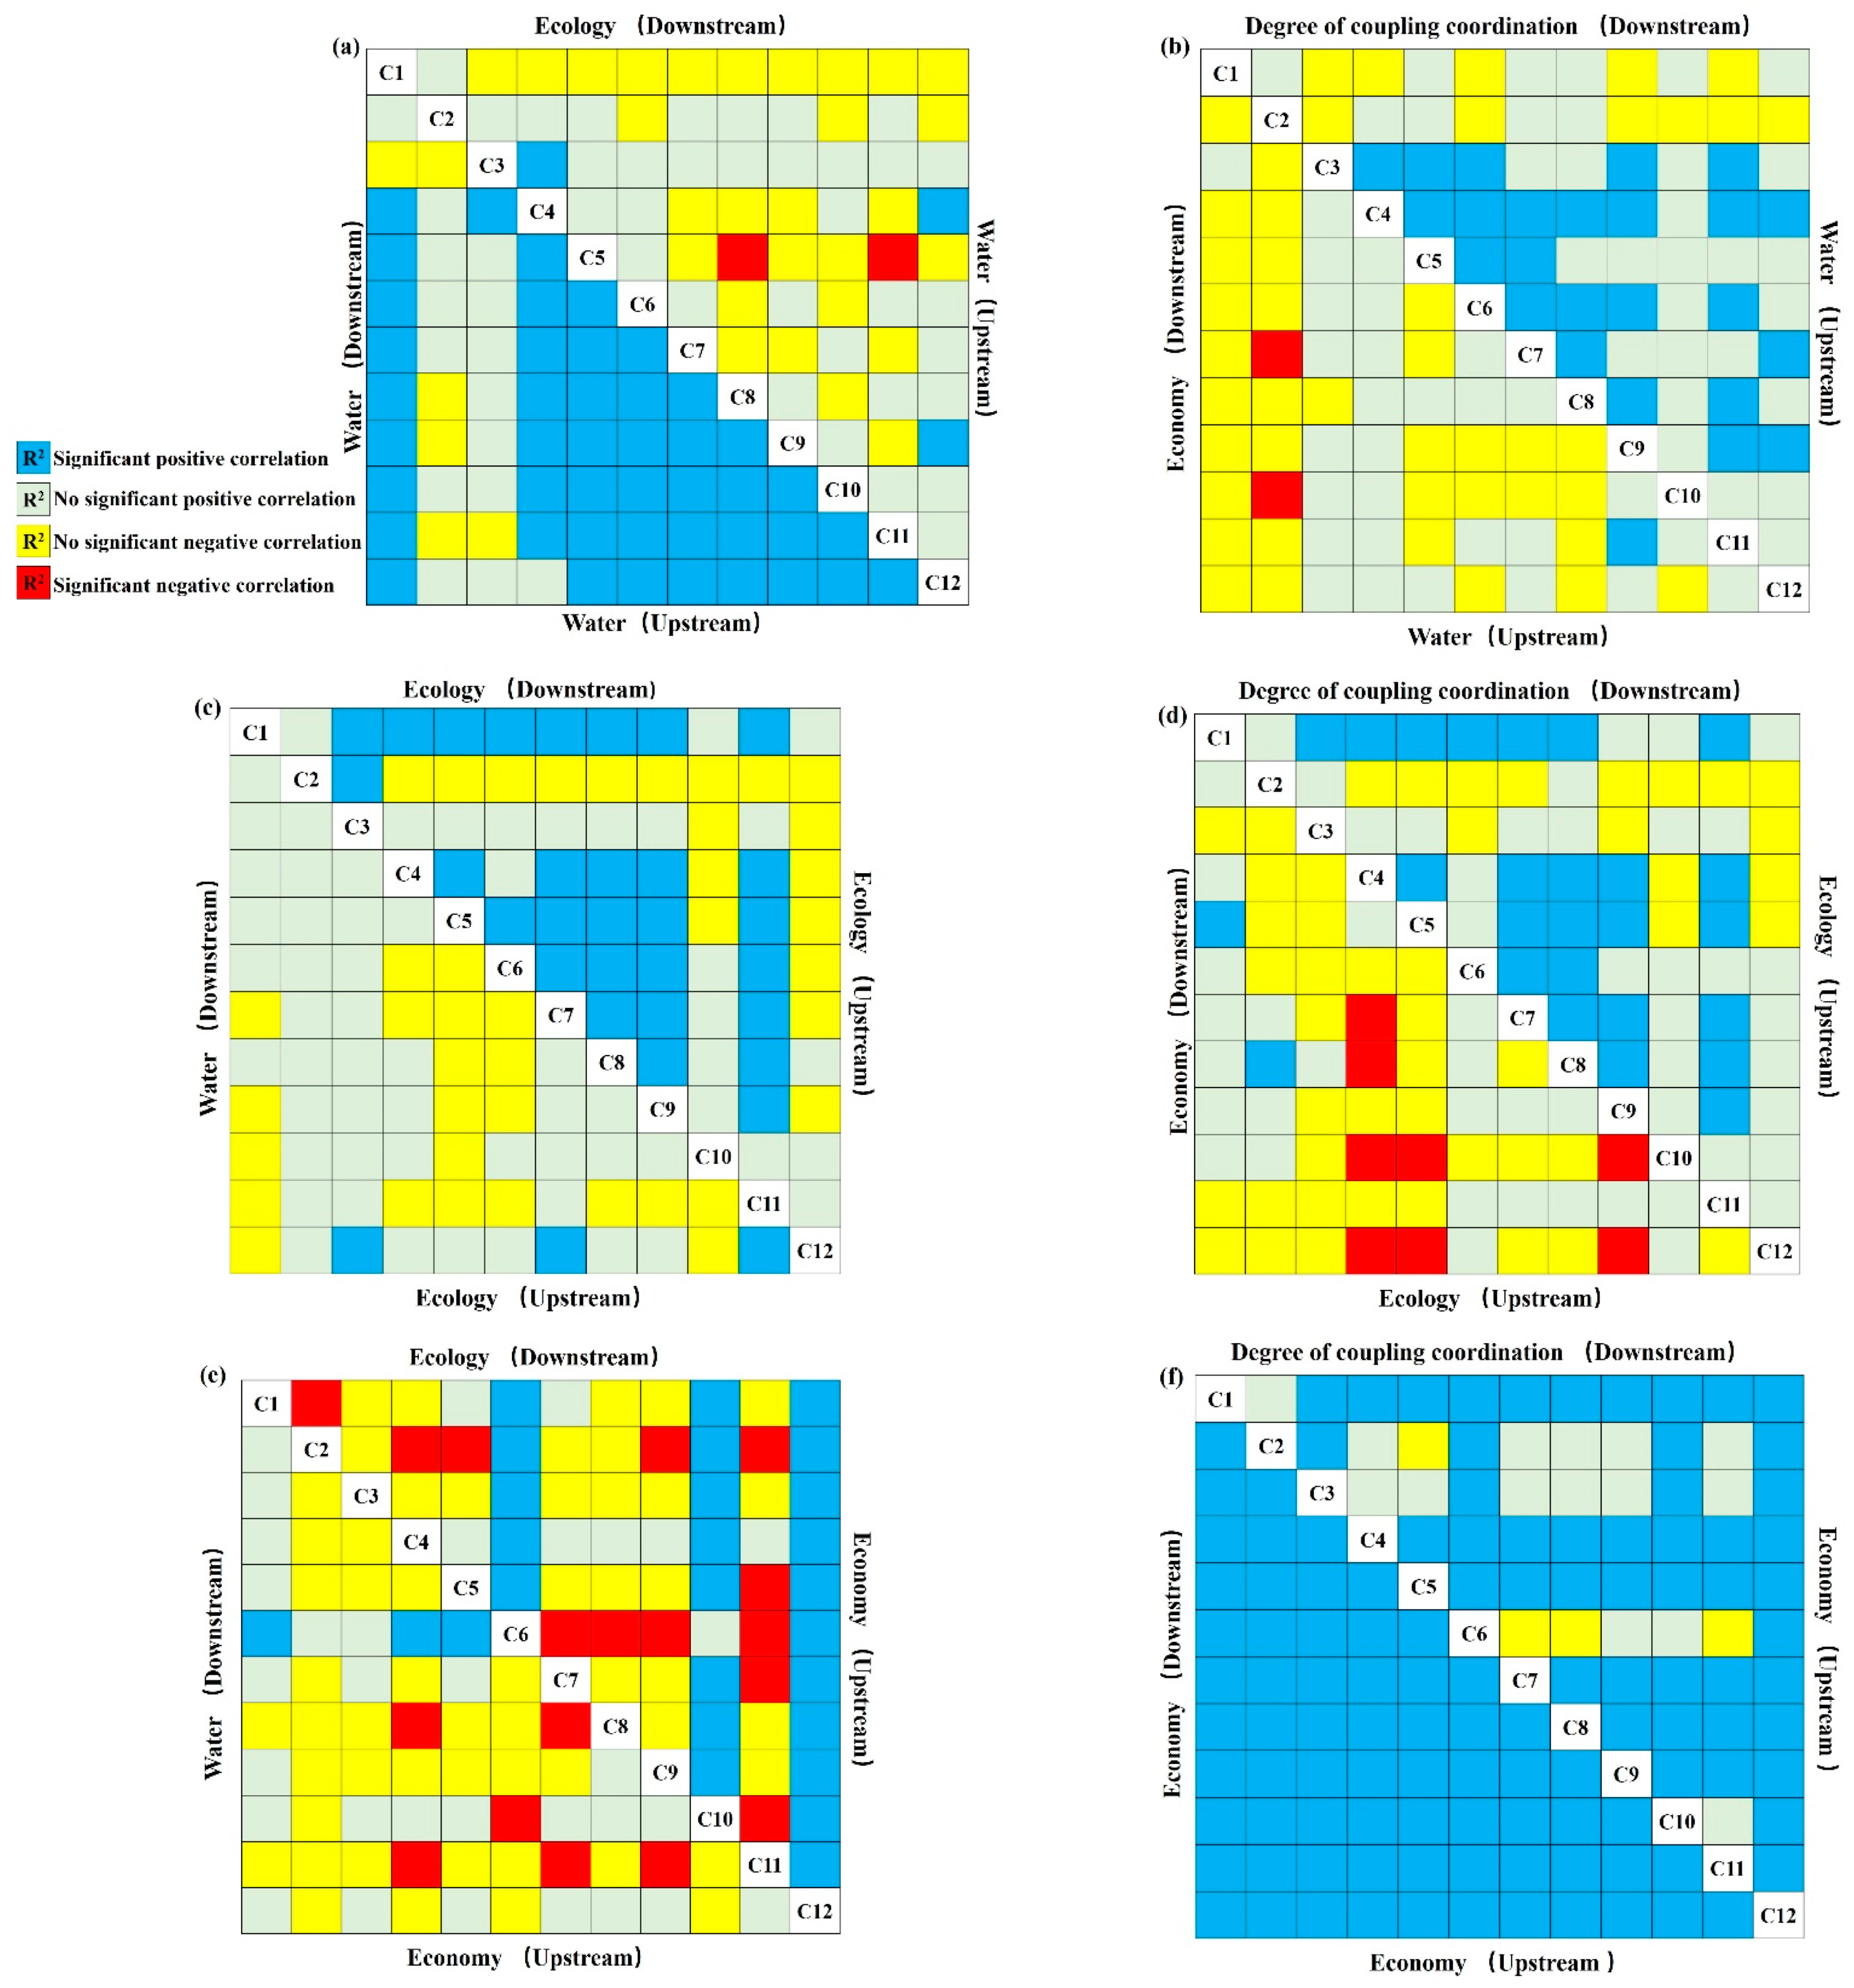
3.4. Cross-County Characteristic between Upstream and Downstream

Figure 8 shows cross-county patterns of partial correlation between the water, ecology, economy subsystem evaluation indices and their coupling coordination degree. Water resources in upstream counties had a significant positive correlation with water resources in downstream counties, but the water resources in Hengshan in the upstream area were negatively correlated with the ecology of Zizhou and Qingjian in downstream areas (Figure 8a). The water resources of Otog Front Banner in the upstream area were negatively correlated with the economy of Mizhi and Zichang in downstream areas (Figure 8b). The ecology of Wushen in the upstream area was positively correlated with the water resources of Yanchuan in the downstream area (Figure 8c). The ecology of Yuyang in the upstream area was negatively correlated with the economy of Mizhi, Zizhou, Zichang and Yanchuan in downstream areas. The ecology of Hengshan in the upstream area was negatively correlated with the economy of Zichang and Yanchuan in downstream areas. The ecology of Yuyang, Hengshan and Jingbian in upstream areas was positive correlated with the coupling coordination degree of Mizhi, Zizhou and Suide in downstream area (Figure 8d). The economy of Yuyang in the upstream area was negatively correlated with the water resources of Zizhou and Qingjian in downstream areas. The economy of Jingbian in the upstream area was negatively correlated with the water resources of Zichang and the ecology of Mizhi in downstream areas (Figure 8e). The economy in upstream counties had a significant positive correlation with the economy in downstream counties, but the economy of Jingbian in the upstream area was negatively correlated with the coupling coordination degree of Mizhi (Figure 8f).

4. Discussion

Different change trends in the evaluation indices of water resources, ecology, and the economy and their comprehensive index indicated a conflict between water resources, ecology and the economy after 2007 in the Wuding River watershed. From 2007 to 2013, urbanization and economic development needed a greater supply of water resources than before 2007 [55], which resulted in non-significant changes in the water evaluation index under an increasing ecology evaluation index. From 2013 to 2020, rapid urban expansion, a population surge and economic development consumed large quantities of water resources and impacted ecosystem health [55], which caused a large variability in the water evaluation index and a decreasing ecology evaluation index. Ecological degradation has become the major challenge for the sustainable development of the Wuding River watershed [56]. The increasing gap between the economy evaluation index and the water resource and ecology evaluation indices indicated increasing conflicts between economic development and water resource utilization and ecological protection [57,58]. This phenomenon could result in a water resource crisis in the watershed in future [59]. Spatial differences in water resources and ecology were related to land cover and ecosystem condition in the watershed. Counties with a higher ecology evaluation index were located in the middle and downstream of the watershed, where were covered by more forest and grassland than other counties [60]. Counties located in the western part of the watershed had lower ecology evaluation indices, which was due to soil erosion and desertification in these counties [61].
The coupling coordination relationship of the water–ecology–economy system is on the verge of dysfunctional decline, mainly influenced by water resources and the ecology condition [62]. The water demands of industry, agriculture and residents squeeze ecological water, resulting in a lack of ecological restoration capacity in the watershed [25,63]. Industrial wastewater, solid waste and waste gas emissions in the Wuding River watershed increased from 42.90 × 10⁶ t, 4.83 × 10⁶ t and 111.07 × 10⁸ m3 in 2001 to 68.45 × 10⁶ t, 36.97 × 10⁶ t and 455.88 × 10⁸ m3 in 2020, respectively. The industrial wastewater, solid waste and waste gas emissions in upstream counties were 12.78, 24.29 and 13.4 times those in downstream counties, respectively. However, the water conservation capacity of the upstream counties was 2.05 times that in the downstream counties. Industrial and agricultural pollutants not only damaged ecological and environmental health, but also caused spillover effects on the surrounding areas, which strengthens the negative externality of ecology degradation and environmental pollution and constrains economic and social development [64]. The overuse of water resources in the upstream counties leads to the degradation of the ecosystem function in the downstream counties, which seriously affects the sustainable development of the whole watershed [24]. Improvements in water resource and ecological protection exerted a crucial role in driving the coordinated development of the water–ecology–economy system in the watershed [62]. However, most counties paid more attention to economic development rather than water resource and ecological protection in the watershed, leading to an uncoordinated relationship between water, ecology and the economy [65].
The coupling coordination relationship of the water–ecology–economy system showed cross-county characteristics in the Wuding River watershed. The water–ecology–economy system has complex multiple relationships between upstream and downstream counties. Upstream counties are located in the water source area and pay more attention and investments to water source conservation and ecological protection, but downstream counties pay little to secure water resources to develop the economy [66]. To eliminate the unilateral economic imbalance, upstream counties have begun to focus on urban expansion and economic development, bringing about large quantities of water resource consumption, pollutant emissions and ecological degradation, which limit water yield and water usability in downstream counties and consequently hinder their economic developments [67]. This can be demonstrated by the significant negative correlations of water resources in Hengshan with ecology in Zizhou and Qingjian. Hengshan is located upstream of Zizhou and Qingjian. In 2020, the population of Hengshan was 2.04 and 2.44 times that of Zizhou and Qingjian, respectively, while the gross domestic product (GDP) of Hengshan was 2.93 and 3.16 times that of Zizhou and Qingjian, respectively. The industrial wastewater emissions of Hengshan were 8.79 × 10⁶ t, which is 7.95 times and 16.4 times those in Zizhou and Qingjian, respectively. Water resource consumption and industrial effluent emissions induced by economic development lead to a higher concentration of pollutants in upstream areas [68], which flow to Zizhou and Qingjian and finally result in ecological degradation in these two counties [57].
Benefit maldistribution triggered by the unilateral imbalance between water resource conservation and ecological protection in upstream areas and economic development in downstream areas is the intrinsic source of the failure of cross-border governance of water resources in the watershed [69]. To solve this public problem, balancing the relationships of economy–water resources and economy–ecology between upstream and downstream areas has become a common choice for watersheds around the world [70,71]. Watershed collaborative governance is an effective and efficient way to achieve this balance. This method incorporates various direct or indirect stakeholders including governmental and non-governmental bodies to participate in watershed governance to deal with the imbalance between water resources, ecology and economic development [72]. The cooperation between governments, the private sector and society can transfer the responsibility of environmental governance to multiple subjects and relieve the pressure on a single government subject in environmental governance [73]. At present, there are various attempts at coordinated governance in the Wuding River watershed and the Yellow River watershed. For example, the macro-ecological governance emphasizes unified management of the central government, and the central government coordinates the benefit relationship between upstream and downstream areas [74]. Ecological compensation, water rights trading and cross-region coordination policies [75,76] have been explored to improve benefit distribution between upstream and downstream areas in the Yellow River watershed. Moreover, integrating enterprise operation in government-led governance in water resource conservation and ecology protection in a watershed is an advocated measure in practice [69].
Through the above analysis, it can be found that the water–ecology–economy systems have different characteristics between upstream and downstream counties in the Wuding River watershed, affecting the coordinated development of the whole watershed. Water resources in the watershed flow freely, and the natural ecological factors are closely interrelated across the whole watershed [21]. The water resources in the watershed not only provide a basic supply of freshwater directly, but also act as a carrier of pollutants and sediment to trigger conflict between upstream and downstream areas or between two sides of the river [28]. However, the river watershed is divided into different administrative regions. Establishing how to resolve the barrier between different administrative regions is the key process in constructing a transregional coordination mode. Our findings could provide decision-making support for policy makers in the Wuding River watershed.

5. Conclusions

In this study, we take the Wuding River watershed, one of the largest tributaries of the Yellow River, as an example to investigate the coupling coordination relationship of the water–ecology–economy system and its cross-county characteristics between the upstream and downstream counties. The conclusions are as follows:
The interannual change trends in the water resource, ecology and economy evaluation indices and their comprehensive indexes showed different trends. During the period of 2001–2007, all indices were stable. From 2007, however, the economy subsystem developed rapidly and showed an increasing gap with the water resource and ecology subsystems.
The coupling coordination relationship of the water–ecology–economy system was on the verge of dysfunctional decline. This relationship was mainly influenced by the water resource consumption of industry, agriculture and residents, as well as ecological degradation.
The coupling coordination of the water–ecology–economy system showed cross-county characteristics between upstream and downstream counties. The water–ecology–economy coupling coordination in downstream areas was positively correlated with water resources and ecology in upstream areas. Water resources and ecology in downstream counties, however, were negatively impacted by the economy in upstream areas.
The results not only remind us to coordinate water resources, ecology and economic development, but also clarified the cross-county characteristics of the water–ecology–economy coupling coordination between upstream and downstream areas to provide decision-making support for constructing trans-domain coordination governance in the Wuding River watershed.

Author Contributions

Conceptualization, J.T. and G.Z.; methodology, J.T. and G.Z.; formal analysis, J.T. and H.Z.; data curation, Y.X. (Yujie Xie) and Y.X. (Yuqian Xu); writing—original draft preparation, Y.X. (Yujie Xie); writing—review and editing, H.Z.; visualization, J.T. and Y.X. (Yujie Xie); supervision, J.T.; project administration, G.Z.; funding acquisition, G.Z. All authors have read and agreed to the published version of the manuscript.

Funding

This research was funded by the Humanities and Social Sciences Found of Ministry of Education of China (grant number 21YJAZH080), the Development Research Center of National Forestry and Grassland Administration of China (grant number JYC-2022-0052).

Institutional Review Board Statement

Not applicable.

Informed Consent Statement

Not applicable.

Data Availability Statement

The data presented in this study are available upon request from the first author.

Conflicts of Interest

The authors declare no conflict of interest.

References

  1. Yang, G.; Wang, J.; Shao, W.; Wang, H. The Relationship Between China’s Coal Resource Development and Water Resource. Energy Procedia 2015, 75, 2548–2555. [Google Scholar] [CrossRef] [Green Version]
  2. Zhao, G.; Li, E.; Mu, X.; Wen, Z.; Rayburg, S.; Tian, P. Changing trends and regime shift of streamflow in the Yellow River basin. Stoch. Environ. Res. Risk Assess. 2015, 29, 1331–1343. [Google Scholar] [CrossRef]
  3. Vörösmarty, C.J.; McIntyre, P.B.; Gessner, M.O.; Dudgeon, D.; Prusevich, A.; Green, P.; Glidden, S.; Bunn, S.E.; Sullivan, C.A.; Liermann, C.R.; et al. Global threats to human water security and river biodiversity. Nature 2010, 467, 555–561. [Google Scholar] [CrossRef] [PubMed] [Green Version]
  4. McDonald, R.I.; Weber, K.; Padowski, J.; Flörke, M.; Schneider, C.; Green, P.A.; Gleeson, T.; Eckman, S.; Lehner, B.; Balk, D.; et al. Water on an urban planet: Urbanization and the reach of urban water infrastructure. Glob. Environ. Chang. 2014, 27, 96–105. [Google Scholar] [CrossRef] [Green Version]
  5. McDonald, R.I.; Weber, K.F.; Padowski, J.; Boucher, T.; Shemie, D. Estimating watershed degradation over the last century and its impact on water-treatment costs for the world’s large cities. Proc. Natl. Acad. Sci. USA 2016, 113, 9117–9122. [Google Scholar] [CrossRef] [PubMed] [Green Version]
  6. Wada, Y.; Flörke, M.; Hanasaki, N.; Eisner, S.; Fischer, G.; Tramberend, S.; Satoh, Y.; van Vliet, M.T.H.; Yillia, P.; Ringler, C.; et al. Modeling global water use for the 21st century: The Water Futures and Solutions (WFaS) initiative and its approaches. Geosci. Model Dev. 2016, 9, 175–222. [Google Scholar] [CrossRef] [Green Version]
  7. Gosling, S.N.; Arnell, N.W. A global assessment of the impact of climate change on water scarcity. Clim. Chang. 2016, 134, 371–385. [Google Scholar] [CrossRef] [Green Version]
  8. Liu, J.; Yang, H.; Gosling, S.N.; Kummu, M.; Flörke, M.; Pfister, S.; Hanasaki, N.; Wada, Y.; Zhang, X.; Zheng, C.; et al. Water scarcity assessments in the past, present, and future. Earth’s Future 2017, 5, 545–559. [Google Scholar] [CrossRef]
  9. Pradhan, P.; Costa, L.; Rybski, D.; Lucht, W.; Kropp, J. A Systematic Study of Sustainable Development Goal (SDG) Interactions. Earth’s Future 2017, 5, 1169–1179. [Google Scholar] [CrossRef] [Green Version]
  10. Best, J. Anthropogenic stresses on the world’s big rivers. Nat. Geosci. 2019, 12, 7–21. [Google Scholar] [CrossRef]
  11. Veldkamp, T.; Wada, Y.; Aerts, J.; Döll, P.; Gosling, S.N.; Liu, J.; Masaki, Y.; Oki, T.; Ostberg, S.; Pokhrel, Y.; et al. Water scarcity hotspots travel downstream due to human interventions in the 20th and 21st century. Nat. Commun. 2017, 8, 15697. [Google Scholar] [CrossRef] [PubMed]
  12. Bakker, K. Water Security: Research Challenges and Opportunities. Science 2012, 337, 914–915. [Google Scholar] [CrossRef] [PubMed]
  13. Ma, T.; Sun, S.; Fu, G.; Hall, J.W.; Ni, Y.; He, L.; Yi, J.; Zhao, N.; Du, Y.; Pei, T.; et al. Pollution exacerbates China’s water scarcity and its regional inequality. Nat. Commun. 2020, 11, 650. [Google Scholar] [CrossRef] [PubMed] [Green Version]
  14. Levin, W.E.; Unsworth, S.J. Do humans belong with nature? The influence of personal vs. abstract contexts on human–nature categorization at different stages of development. J. Environ. Psychol. 2013, 33, 9–13. [Google Scholar] [CrossRef]
  15. Luo, Z.; Zuo, Q.; Shao, Q.; Ding, X. The impact of socioeconomic system on the river system in a heavily disturbed basin. Sci. Total Environ. 2019, 660, 851–864. [Google Scholar] [CrossRef] [PubMed]
  16. Turner, S.W.D.; Rice, J.S.; Nelson, K.D.; Vernon, C.R.; McManamay, R.; Dickson, K.; Marston, L. Comparison of potential drinking water source contamination across one hundred U.S. cities. Nat. Commun. 2021, 12, 7254. [Google Scholar] [CrossRef] [PubMed]
  17. Chung, M.G.; Frank, K.A.; Pokhrel, Y.; Dietz, T.; Liu, J. Natural infrastructure in sustaining global urban freshwater ecosystem services. Nat. Sustain. 2021, 4, 1068–1075. [Google Scholar] [CrossRef]
  18. Wickham, J.D.; Wade, T.G.; Riitters, K.H. An environmental assessment of United States drinking water watersheds. Landsc. Ecol. 2011, 26, 605–616. [Google Scholar] [CrossRef] [Green Version]
  19. Liu, N.; Caldwell, P.V.; Dobbs, G.R.; Miniat, C.F.; Bolstad, P.V.; Nelson, S.A.C.; Sun, G. Forested lands dominate drinking water supply in the conterminous United States. Environ. Res. Lett. 2021, 16, 084008. [Google Scholar] [CrossRef]
  20. Carvalho, L.; Mackay, E.B.; Cardoso, A.C.; Baattrup-Pedersen, A.; Birk, S.; Blackstock, K.L.; Borics, G.; Borja, A.; Feld, C.K.; Ferreira, M.T.; et al. Protecting and restoring Europe’s waters: An analysis of the future development needs of the Water Framework Directive. Sci. Total Environ. 2019, 658, 1228–1238. [Google Scholar] [CrossRef]
  21. Grizzetti, B.; Liquete, C.; Pistocchi, A.; Vigiak, O.; Zulian, G.; Bouraoui, F.; De Roo, A.; Cardoso, A.C. Relationship between ecological condition and ecosystem services in European rivers, lakes and coastal waters. Sci. Total Environ. 2019, 671, 452–465. [Google Scholar] [CrossRef] [PubMed]
  22. Tao, S.; Fang, J.; Ma, S.; Cai, Q.; Xiong, X.; Tian, D.; Zhao, X.; Fang, L.; Zhang, H.; Zhu, J.; et al. Changes in China’s lakes: Climate and human impacts. Natl. Sci. Rev. 2019, 7, 132–140. [Google Scholar] [CrossRef] [PubMed] [Green Version]
  23. Lu, Z.; Wei, Y.; Xiao, H.; Zou, S.; Ren, J.; Lyle, C. Trade-offs between midstream agricultural production and downstream ecological sustainability in the Heihe River basin in the past half century. Agric. Water Manag. 2015, 152, 233–242. [Google Scholar] [CrossRef]
  24. Zhang, M.; Wang, S.; Fu, B.; Gao, G.; Shen, Q. Ecological effects and potential risks of the water diversion project in the Heihe River Basin. Sci. Total Environ. 2018, 619–620, 794–803. [Google Scholar] [CrossRef]
  25. Li, Z.; Liu, W.; Zhang, J.; Zheng, F.-L. Impacts of land use change and climate variability on hydrology in an agricultural catchment on the Loess Plateau of China. J. Hydrol. 2009, 377, 35–42. [Google Scholar] [CrossRef]
  26. Lu, Z.; Feng, Q.; Xiao, S.; Xie, J.; Zou, S.; Yang, Q.; Si, J. The impacts of the ecological water diversion project on the ecology-hydrology-economy nexus in the lower reaches in an inland river basin. Resour. Conserv. Recycl. 2021, 164, 105154. [Google Scholar] [CrossRef]
  27. Chen, Y.; Syvitski, J.P.M.; Gao, S.; Overeem, I.; Kettner, A.J. Socio-economic Impacts on Flooding: A 4000-Year History of the Yellow River, China. AMBIO 2012, 41, 682–698. [Google Scholar] [CrossRef] [Green Version]
  28. Li, X.; Zhong, D.; Zhang, Y.J.; Wang, Y.; Wang, Y.; Zhang, H. Wide river or narrow river: Future river training strategy for Lower Yellow River under global change. Int. J. Sediment Res. 2018, 33, 271–284. [Google Scholar] [CrossRef]
  29. Zhu, J.; Song, C.; Wang, J.; Ke, L. China’s inland water dynamics: The significance of water body types. Proc. Natl. Acad. Sci. USA 2020, 117, 13876–13878. [Google Scholar] [CrossRef]
  30. Wu, X.; Wei, Y.; Fu, B.; Wang, S.; Zhao, Y.; Moran, E.F. Evolution and effects of the social-ecological system over a millennium in China’s Loess Plateau. Sci. Adv. 2020, 6, eabc0276. [Google Scholar]
  31. Han, J.; Gao, J.; Luo, H. Changes and implications of the relationship between rainfall, runoff and sediment load in the Wuding River basin on the Chinese Loess Plateau. CATENA 2019, 175, 228–235. [Google Scholar] [CrossRef]
  32. Xu, J.-X.; Ji, S. Effect of erosion control measures on sediment delivery ratio. Adv. Water Sci. 2004, 15, 29. [Google Scholar]
  33. Dang, C.; Zhang, H.; Singh, V.P.; Yu, Y.; Shao, S. Investigating Hydrological Variability in the Wuding River Basin: Implications for Water Resources Management under the Water–Human-Coupled Environment. Water 2021, 13, 184. [Google Scholar] [CrossRef]
  34. Fu, B.J.; Wu, B.F.; Lue, Y.H.; Xu, Z.H.; Cao, J.H.; Niu, D.; Yang, G.S.; Zhou, Y.M. Three Gorges Project: Efforts and challenges for the environment. Prog. Phys. Geogr. Earth Environ. 2010, 34, 741–754. [Google Scholar] [CrossRef]
  35. Tang, Y.; Liu, S.; Li, X.; Fan, Y.; Deng, Y.; Liu, Y.; Yin, L. Earthquakes spatio–temporal distribution and fractal analysis in the Eurasian seismic belt. Rend. Lincei. Sci. Fis. E Naturali. 2020, 31, 203–209. [Google Scholar] [CrossRef]
  36. Chen, Z.; Liu, Z.; Yin, L.; Zheng, W. Statistical analysis of regional air temperature characteristics before and after dam construction. Urban Clim. 2022, 41, 101085. [Google Scholar] [CrossRef]
  37. Jiongxin, X.U. Sediment Flux to the Sea as Influenced by Changing Human Activities and Precipitation: Example of the Yellow River, China. Environ. Manag. 2003, 31, 0328–0341. [Google Scholar] [CrossRef]
  38. Huang, M.; Zhang, L. Hydrological responses to conservation practices in a catchment of the Loess Plateau, China. Hydrol. Process. 2004, 18, 1885–1898. [Google Scholar] [CrossRef]
  39. Mu, X.; Zhang, L.; McVicar, T.R.; Chille, B.; Gau, P. Analysis of the impact of conservation measures on stream flow regime in catchments of the Loess Plateau, China. Hydrol. Process. 2007, 21, 2124–2134. [Google Scholar] [CrossRef]
  40. Zhou, Y.; Shi, C.; Du, J.; Fan, X. Characteristics and causes of changes in annual runoff of the Wuding River in 1956–2009. Environ. Earth Sci. 2013, 69, 225–234. [Google Scholar] [CrossRef]
  41. Liang, W.; Bai, D.; Jin, Z.; You, Y.; Li, J.; Yang, Y. A Study on the Streamflow Change and its Relationship with Climate Change and Ecological Restoration Measures in a Sediment Concentrated Region in the Loess Plateau, China. Water Resour. Manag. 2015, 29, 4045–4060. [Google Scholar] [CrossRef]
  42. Zhang, K.; Ali, A.; Antonarakis, A.; Moghaddam, M.; Saatchi, S.; Tabatabaeenejad, A.; Chen, R.; Jaruwatanadilok, S.; Cuenca, R.; Crow, W.T.; et al. The Sensitivity of North American Terrestrial Carbon Fluxes to Spatial and Temporal Variation in Soil Moisture: An Analysis Using Radar-Derived Estimates of Root-Zone Soil Moisture. J. Geophys. Res. Biogeosci. 2019, 124, 3208–3231. [Google Scholar] [CrossRef]
  43. Longo, M.; Knox, R.G.; Medvigy, D.M.; Levine, N.M.; Dietze, M.C.; Kim, Y.; Swann, A.L.S.; Zhang, K.; Rollinson, C.R.; Bras, R.L.; et al. The biophysics, ecology, and biogeochemistry of functionally diverse, vertically and horizontally heterogeneous ecosystems: The Ecosystem Demography model, version 2.2–Part 1: Model description. Geosci. Model Dev. 2019, 12, 4309–4346. [Google Scholar] [CrossRef] [Green Version]
  44. Li, E.; Mu, X.; Zhao, G.; Gao, P.; Sun, W. Effects of check dams on runoff and sediment load in a semi-arid river basin of the Yellow River. Stoch. Environ. Res. Risk Assess. 2017, 31, 1791–1803. [Google Scholar] [CrossRef]
  45. Liu, Y.; Zhang, K.; Li, Z.; Liu, Z.; Wang, J.; Huang, P. A hybrid runoff generation modelling framework based on spatial combination of three runoff generation schemes for semi-humid and semi-arid watersheds. J. Hydrol. 2020, 590, 125440. [Google Scholar] [CrossRef]
  46. Hutchinson, M.F. Interpolating mean rainfall using thin plate smoothing splines. Int. J. Geogr. Inf. Syst. 1995, 9, 385–403. [Google Scholar] [CrossRef]
  47. Save, H.; Bettadpur, S.; Tapley, B.D. High-resolution CSR GRACE RL05 mascons. J. Geophys. Res. Solid Earth 2016, 121, 7547–7569. [Google Scholar] [CrossRef]
  48. Zhao, M.; Heinsch, F.A.; Nemani, R.R.; Running, S.W. Improvements of the MODIS terrestrial gross and net primary production global data set. Remote Sens. Environ. 2005, 95, 164–176. [Google Scholar] [CrossRef]
  49. Yan, K.; Park, T.; Yan, G.; Liu, Z.; Yang, B.; Chen, C.; Nemani, R.R.; Knyazikhin, Y.; Myneni, R.B. Evaluation of MODIS LAI/FPAR Product Collection 6. Part 1: Consistency and Improvements. Remote Sens. 2016, 8, 359. [Google Scholar] [CrossRef] [Green Version]
  50. Mu, Q.; Zhao, M.; Running, S.W. Improvements to a MODIS global terrestrial evapotranspiration algorithm. Remote Sens. Environ. 2011, 115, 1781–1800. [Google Scholar] [CrossRef]
  51. Liu, Y.; Yao, C.; Wang, G.; Bao, S. An integrated sustainable development approach to modeling the eco-environmental effects from urbanization. Ecol. Indic. 2011, 11, 1599–1608. [Google Scholar] [CrossRef]
  52. Li, Y.; Li, Y.; Zhou, Y.; Shi, Y.; Zhu, X. Investigation of a coupling model of coordination between urbanization and the environment. J. Environ. Manag. 2012, 98, 127–133. [Google Scholar] [CrossRef] [PubMed]
  53. Zhang, H.; Gu, C.-L.; Gu, L.-W.; Zhang, Y. The evaluation of tourism destination competitiveness by TOPSIS & information entropy—A case in the Yangtze River Delta of China. Tour. Manag. 2011, 32, 443–451. [Google Scholar]
  54. Xie, N.; Liu, S. Research on evaluations of several grey relational models adapt to grey relational axioms. J. Syst. Eng. Electron. 2009, 20, 304–309. [Google Scholar]
  55. Liao, S.; Wu, Y.; Wong, S.W.; Shen, L. Provincial perspective analysis on the coordination between urbanization growth and resource environment carrying capacity (RECC) in China. Sci. Total Environ. 2020, 730, 138964. [Google Scholar] [CrossRef]
  56. Fan, Y.; Fang, C.; Zhang, Q. Coupling coordinated development between social economy and ecological environment in Chinese provincial capital cities-assessment and policy implications. J. Clean. Prod. 2019, 229, 289–298. [Google Scholar] [CrossRef]
  57. Wang, S.; Li, R. Toward the Coordinated Sustainable Development of Urban Water Resource Use and Economic Growth: An Empirical Analysis of Tianjin City, China. Sustainability 2018, 10, 1323. [Google Scholar] [CrossRef] [Green Version]
  58. Bao, C.; He, D. The Causal Relationship between Urbanization, Economic Growth and Water Use Change in Provincial China. Sustainability 2015, 7, 16076–16085. [Google Scholar] [CrossRef] [Green Version]
  59. Di Baldassarre, G.; Sivapalan, M.; Rusca, M.; Cudennec, C.; Garcia, M.; Kreibich, H.; Konar, M.; Mondino, E.; Mård, J.; Pande, S.; et al. Sociohydrology: Scientific Challenges in Addressing the Sustainable Development Goals. Water Resour. Res. 2019, 55, 6327–6355. [Google Scholar] [CrossRef] [Green Version]
  60. Zheng, M. Scale Independence and Spatial Uniformity of Specific Sediment Yield in Loess Areas of the Wuding River Basin, Northwest China. Land Degrad. Dev. 2017, 28, 1450–1462. [Google Scholar] [CrossRef]
  61. Liu, S.; Mo, X.; Zhao, W.; Naeimi, V.; Dai, D.; Shu, C.; Mao, L. Temporal variation of soil moisture over the Wuding River basin assessed with an eco-hydrological model, in-situ observations and remote sensing. Hydrol. Earth Syst. Sci. 2009, 13, 1375–1398. [Google Scholar] [CrossRef] [Green Version]
  62. Feng, Y.; Chiu, Y.-H.; Liu, F.-P. Measuring the Performance of Wastewater Treatment in China. Appl. Sci. 2019, 9, 153. [Google Scholar] [CrossRef] [Green Version]
  63. Li, P.; Mu, X.; Holden, J.; Wu, Y.; Irvine, B.; Wang, F.; Gao, P.; Zhao, G.; Sun, W. Comparison of soil erosion models used to study the Chinese Loess Plateau. Earth-Sci. Rev. 2017, 170, 17–30. [Google Scholar] [CrossRef] [Green Version]
  64. Wang, Y.; Geng, Q.; Si, X.; Kan, L. Coupling and coordination analysis of urbanization, economy and environment of Shandong Province, China. Environ. Dev. Sustain. 2021, 23, 10397–10415. [Google Scholar] [CrossRef]
  65. Yao, L.; Li, X.; Li, Q.; Wang, J. Temporal and Spatial Changes in Coupling and Coordinating Degree of New Urbanization and Ecological-Environmental Stress in China. Sustainability 2019, 11, 1171. [Google Scholar] [CrossRef] [Green Version]
  66. Merz, L.; Yang, D.; Hull, V. A Metacoupling Framework for Exploring Transboundary Watershed Management. Sustainability 2020, 12, 1879. [Google Scholar] [CrossRef] [Green Version]
  67. Jenerette, G.D.; Larsen, L. A global perspective on changing sustainable urban water supplies. Glob. Planet. Chang. 2006, 50, 202–211. [Google Scholar] [CrossRef]
  68. Jia, R.; Jiang, X.; Shang, X.; Wei, C. Study on the Water Resource Carrying Capacity in the Middle Reaches of the Heihe River Based on Water Resource Allocation. Water 2018, 10, 1203. [Google Scholar] [CrossRef] [Green Version]
  69. Weidner, H. Capacity-Building for Ecological Modernization: Lessons From Cross-National Research. Am. Behav. Sci. 2002, 45, 1340–1368. [Google Scholar] [CrossRef]
  70. Chakraborty, K. Integrated Water Resources Management: Global Theory, Emerging Practice, and Local Needs. Am. J. Agric. Econ. 2008, 90, 856–857. [Google Scholar] [CrossRef]
  71. Underdal, A. Complexity and challenges of long-term environmental governance. Globl Environ. Chang. Guildf. 2010, 20, 386–393. [Google Scholar] [CrossRef]
  72. Tsang, S.; Burnett, M.; Hills, P.; Welford, R. Trust, public participation and environmental governance in Hong Kong. Environ. Policy Gov. 2009, 19, 99–114. [Google Scholar] [CrossRef]
  73. Eckerberg, K.; Joas, M. Multi-level Environmental Governance: A concept under stress? Local Environ. 2004, 9, 405–412. [Google Scholar] [CrossRef]
  74. Prokopy, L.S.; Mullendore, N.; Brasier, K.; Floress, K. A Typology of Catalyst Events for Collaborative Watershed Management in the United States. Soc. Nat. Resour. 2014, 27, 1177–1191. [Google Scholar] [CrossRef]
  75. Guan, X.; Liu, W.; Chen, M. Study on the ecological compensation standard for river basin water environment based on total pollutants control. Ecol. Indic. 2016, 69, 446–452. [Google Scholar] [CrossRef]
  76. Guo, H.; Chen, X.; Liu, J.; Zhang, H.; Svensson, J. Joint analysis of water rights trading and water-saving management contracts in China. Int. J. Water Resour. Dev. 2020, 36, 716–737. [Google Scholar] [CrossRef]
Figure 1. Spatial patterns of elevation (a), vegetation leaf area index (b), annual mean temperature (c) and annual total precipitation (d) in the Wuding River watershed.
Land 11 02283 g001
Figure 2. Interannual change trends in water, ecology and economy subsystem evaluation indices and their comprehensive index, respectively, in the Wuding River watershed from 2001 to 2020.
Land 11 02283 g002
Figure 3. Interannual change trends in water, ecology and economy subsystem evaluation indices and their comprehensive index, respectively, in (al) in the Wuding River watershed from 2001 to 2020.
Land 11 02283 g003
Figure 4. Spatial patterns of mean value of (a) water, (b) ecology and (c) economy subsystem evaluation indices and (d) their comprehensive indices, respectively in the Wuding River watershed between 2001 and 2020.
Land 11 02283 g004
Figure 5. Interannual change trends in the water–ecology–economy coupling degree and coupling coordination degree in the Wuding River watershed from 2001 to 2020.
Land 11 02283 g005
Figure 6. Interannual change trends in the water–ecology–economy coupling degree and coordinated degree, respectively, in (al) in the Wuding River watershed from 2001 to 2020.
Land 11 02283 g006
Figure 7. Histogram showing grey correlation of the water, ecology and economy subsystem evaluation indices with the water–ecology–economy coordinated degree. The background color of each county is the same as in Figure 4d.
Land 11 02283 g007
Figure 8. The cross-county patterns of the partial correlation between water, ecology, economy subsystem evaluation indices and water–ecology–economy coordinated degree in the Wuding River watershed. Subfigures show partial correlation coefficient between (a) upstream water and downstream water as well as upstream water and downstream ecology, (b) upstream water and downstream economy as well as upstream water and downstream coordinated degree, (c) upstream ecology and downstream water as well as upstream ecology and downstream ecology, (d) upstream ecology and downstream economy as well as upstream ecology and downstream coordinated degree, (e) upstream economy and downstream water as well as upstream economy and downstream ecology, (f) upstream economy and downstream economy as well as upstream economy and downstream coordinated degree. C1: Dingbian; C2: Otog Front Banner; C3: Wushen; C4: Yuyang; C5: Hengshan; C6: Jingbian; C7: Mizhi; C8: Zizhou; C9: Suide; C10: Zichang; C11: Qingjian; C12: Yanchuan.
Land 11 02283 g008
Table 1. Evaluation index system of the water–ecology–economy coupling coordination relationship in the Wuding River watershed.
Target LayerGuideline LayerIndex LayerUnitData SourcesProperty 1Weight
WaterWater resource situationAnnual total precipitationmmChina Meteorological Data Network+0.033
Surface water storage108 m3Statistical yearbook
NASA CSR GRACE data
+0.043
Groundwater storagecm+0.065
Water resource utilizationWater consumption per capitam3Statistical yearbook-0.051
Water consumption per million yuanm3-0.030
Domestic water108 m3-0.046
EcologyEcosystem functionNet primary productivitykgC m−2 year−1NASA MODIS data+0.045
Water conservation capacitym3 m−2 year−1+0.033
Vegetation leaf aream2 m−2+0.045
Pollutant emissionWastewater emission104 tStatistical yearbook-0.039
Solid waste emission104 t-0.051
Waste gas emission108 t-0.056
EconomyEconomic and social situationGross domestic product per capitaYuanStatistical yearbook+0.098
Fixed investment per capitaYuan+0.116
Disposable incomeYuan+0.079
Industrial structureProportion of primary industry%Statistical yearbook+0.117
Proportion of secondary industry%+0.055
Proportion of tertiary industry%+0.069
1 “+” is a positive indicator; “-” is a negative indicator.
Table 2. Classification of coupling coordination degree.
TypeCoupling Coordination DegreeCategory
Coordinated development0.90–1.00High-quality coordinated development
0.80–0.89Good coordinated development
0.70–0.79Intermediate coordinated development
0.60–0.69Primary coordinated development
Excessive status0.50–0.59Barely coordinated development
0.40–0.49On the verge of dysfunctional decline
Dysfunctional decline0.30–0.39Mild dysfunctional decline
0.20–0.29Moderate dysfunctional decline
0.10–0.19Severe dysfunctional decline
0–0.09Extremely dysfunctional decline
Publisher’s Note: MDPI stays neutral with regard to jurisdictional claims in published maps and institutional affiliations.

