Article

Effects of Understory Vegetation Heterogeneity on Soil Organic Carbon Components in Cunninghamia lanceolata Plantation

1
College of Forestry, Fujian Agriculture and Forestry University, Fuzhou 350002, China
2
Luoyang Institute of Science and Technology, Luoyang 471026, China
3
Lushan Botanical Garden, Chinese Academy of Sciences, Jiujiang 332900, China
*
Author to whom correspondence should be addressed.
Land 2022, 11(12), 2300; https://doi.org/10.3390/land11122300
Submission received: 27 November 2022 / Revised: 12 December 2022 / Accepted: 12 December 2022 / Published: 15 December 2022

Abstract

:
As one of the important factors affecting forest soil organic carbon stocks, the effect of understory vegetation types on soil organic carbon and its components was explored to provide a theoretical basis for understory vegetation management and sustainable management in plantation forests. In order to determine the characteristics of soil organic carbon and its components under different understory vegetation types in Subtropical Cunninghamia lanceolata plantation, Indocalamus tessellatus, Diplazium donianum and Oreocnide frutescenssp were taken as research objects. The mass fractions of total organic carbon, recalcitrant organic carbon, readily oxidizable organic carbon, microbial biomass carbon and dissolved organic carbon in each soil layer at 0–10, 10–20, 20–40 and 40–60 cm were measured, and the change characteristics of soil organic carbon components were also studied and compared. The results showed that: (1) The mass fractions of total organic carbon, recalcitrant organic carbon, readily oxidizable organic carbon and microbial biomass carbon in the soils of the three understory vegetation types showed significant decreasing trends along the profile, while the mass fraction of dissolved organic carbon in 0–40 cm soil layer was significantly higher than those in 40–60 cm soil layer. (2) The mass fraction of total organic carbon (5.98–20.66 g·kg−1) had no significant difference among understory vegetation types. The mass fraction and proportion of microbial biomass carbon were higher in the 0–60 cm soil layer under cover of Indocalamus tessellatus, and the mass fractions of recalcitrant organic carbon in the 20–40 cm soil layer under Indocalamus tessellatus cover (8.57 g·kg−1) was significantly higher than that of Oreocnide frutescenssp (5.73 g·kg−1). The soil layer of 0–20 cm under the Diplazium donianum community has a higher mass fraction and proportion of readily oxidizable organic carbon. (3) Correlation analysis showed that soil organic carbon and its components were positively correlated with total nitrogen, dissolved total nitrogen, dissolved organic nitrogen and microbial biomass nitrogen. There is a significant positive correlation among the components of soil organic carbon. (4) Redundancy analysis showed that soil bulk density (41.6%), microbial biomass nitrogen (41.2%), dissolved total nitrogen (43.7%), total nitrogen (9.9%), dissolved organic nitrogen (43.6%) and pH (6.6%) were the most significant environmental factors affecting organic carbon components in four soil layers. Understory vegetation type can influence the distribution characteristics of soil organic carbon components in Cunninghamia lanceolata plantation, and soil active organic carbon components are more susceptible to the influence of understory vegetation type than total organic carbon and recalcitrant organic carbon.

1. Introduction

Forest soils are one of the important organic carbon pools in terrestrial ecosystems, accounting for about 39% of the total soil organic carbon (SOC) reserves in the world [1], and small changes in its SOC pool can cause significant fluctuations in atmospheric CO2 concentration, which in turn affect global climate change and carbon balance [2]. Generally, SOC is composed of different carbon components, which can be divided into three components: active, slow-acting and recalcitrant, according to their stability differences in soil [3]. Compared with slow-acting and recalcitrant organic carbon (ROC), active organic carbon (AOC) components are easy to be decomposed and transformed and can quickly respond to external environmental changes, so it has become a hot spot in soil carbon pool research [4,5,6]. However, under the combined effect of external environmental factors, the various soil carbon pool components are able to transform into each and jointly regulate the stability of the forest soil carbon pool [7]. Therefore, clarifying the characteristics of the carbon pool of forest soil components plays an important role in deeply understanding the carbon cycle of forest ecosystems and can provide scientific data to support the realization of the goal of “Carbon neutrality and Carbon emissions peak” in China.
As an important component of the plantation forest ecosystem, understory vegetation is an important factor affecting the distribution of SOC stocks and the distribution of its components, which can influence and regulate the soil carbon cycle through many aspects [8,9,10]. Relevant studies have shown that maintaining the richness and diversity of understory vegetation has a positive role in promoting the improvement of soil structure and nutrient increase [11,12], and the difference in understory vegetation species composition may cause changes in litter input and rhizosphere resources [13,14], changing the metabolic characteristics of soil microorganisms [15,16], which caused variation of community habitat and soil physical and chemical properties [11,17], and then regulate the formation and transformation of various carbon components and affect the stability of SOC pool. At present, studies on the impact of understory vegetation on soil carbon pool mainly focus on the removal of understory [18], litter input [19] and other aspects, and most of the studies are focused on TOC, AOC and so on [12,20]. It is still unclear whether the distribution characteristics of each organic carbon component in the understory vegetation types and soil layers are consistent. Therefore, it is important to study the distribution differences of SOC components among understory vegetation types to clarify the internal mechanism of soil carbon pool change in plantation forests and to assess the carbon sequestration potential of plantation forest ecosystems accurately.
Cunninghamia lanceolata (Lamb.) Hook. plantation forests are the main fast-growing timber forests in the southern region of China, accounting for about 25% of the plantation forest area in China [21], which plays an important role in regulating regional climate change and the carbon and nitrogen cycle. Because of the long-term planting of Cunninghamia lanceolata (C. lanceolata) monoculture and continuous planting, C. lanceolata plantations have shown a trend of declining soil nutrients [22] while retaining understory vegetation can improve stand yield and increase soil nutrient effectiveness [23], but the undergrowth species composition changes affect how SOC components needed further research. Therefore, three dominant understory vegetation of C. lanceolata plantation were selected in this paper: The soil covered by Oreocnide frutescens (Thunb.) Miq., Diplazium donianum (Mett.) Tard. Blet. and Indocalamus tessellatus (Munro) Keng f. as the research objects. By analyzing the distribution of total organic carbon (TOC), readily oxidizable organic carbon (ROOC), microbial biomass carbon (MBC), dissolved organic carbon (DOC) and recalcitrant organic carbon (ROC) in 0–60 cm soil layer, and combining with the physicochemical properties of soil, the influence mechanism of understory vegetation types on SOC pool was discussed in order to provide a theoretical basis for understory vegetation management and sustainable management of C. lanceolata plantations.

2. Materials and Methods

2.1. Study Site

The study area is located in Xiqin Teaching Forest Farm of Fujian Agriculture and Forestry University (26°40′ N; 118°10′ E) in Xiqin Town, Nanping City, Fujian Province, with an altitude of 100–300 m above sea level and a slope of 25–35°, the soil depth of this sample site is about 1 m, and the main soil type is Ferric Acrisol (WRB, 2015) [24]. The region has a mid-subtropical monsoon climate, with an average sunshine time of 1710.0 h, an average annual temperature of 17.9 °C and an average annual precipitation of 1817 mm. The experimental sample is located in the 34-year-old monoculture-planted C. lanceolata plantation on the forest farm. The sample plot was planted as Pinus massoniana Lamb. plantation before transformation, and then was cut down and planted with C. lanceolata monoculture-planted forest, and the stand tending lasted for 2 years (1987–1989). The average tree height and diameter at breast height of C. lanceolata in the sample plot were 16.2 m and 23.2 cm, respectively, with a canopy density of 0.7–0.8%, a stand density of 2762 plants·ha−1, and the average slope was 30°. Due to the artificial tending before canopy closure, three different dominant plant communities were finally formed in the understory of the stand: Oreocnide frutescens (O. frutescens), Diplazium donianum (D. donianum) and Indocalamus tessellatu (I. tessellatus) (Figure 1).

2.2. Plot Establishment

In October 2020, four 5 m × 10 m, four 5 m × 10 m and three 3 m × 5 m plots were set up in the communities of O. frutescens, D. donianum and I. tessellatu, respectively, according to the growth situation (Community composition, distribution and area) of the three undergrowth vegetation communities in the experimental site, with a spacing of 5–10 m between the plots. Before the beginning of the experiment, the stand characteristics and forest land conditions of the sample plot were investigated, and the results are shown in Table 1.

2.3. Soil Sample Collection and Measurement

In October 2020, four soil samples of 0–10, 10–20, 20–40, and 40–60 cm were collected with stainless steel drills (inner diameter 5.5 cm and length 1 m) in the above quadrat, and five tubes of soil samples were randomly collected from each soil layer in each sample plot and mixed into one soil sample. Soil bulk density samples of 4 soil layers were collected in each quadrat with ring knife (inner diameter 7.00 cm, length 5.20 cm). After the visible plant residues and gravels were removed, the soil sample was passed through a 2 mm sieve and finally divided into two parts as follows: one part was dried naturally and used to determine pH, total nitrogen (TN), total phosphorus (TP), TOC, ROOC and ROC of soil; and the other part was stored at 4 °C and used to determine MBC, Microbial biomass nitrogen, Dissolved organic carbon (DOC), Dissolved total carbon (DTN), ammonium nitrogen (NH4+-N), nitrate nitrogen (NO3-N) and soil moisture (SWC).
The mass fraction of TOC and TN in soil was determined by element analyzer (Vario isotope cube, GER). The mass fraction of MBC and MBN in soil was measured by the chloroform fumigation—potassium sulfate extraction method [25,26]. After extraction, MBC and MBN were measured with a TOC-L analyzer (TOC–VCPH/CPN, JPN). The TOC-L analyzer was also used for measurement of DOC after extraction with deionized water (10 g soil with 40 mL of 0.5 mol·L−1 K2SO4 solution, shaking at 25 °C for 15 min) and filtration using 0.45 μm polytetrafluoroethylene filters [27]. DON was obtained by calculating the difference between total soluble N and inorganic N. Soil ROOC mass fraction was determined by 333 mmol·L−1 potassium permanganate oxidation method. Soil ROC mass fraction was digested with 6 mol·L−1 hydrochloric acid, filtered and dried, and then measured on an elemental analyzer. Soil NH4+-N and NO3-N were extracted by 2 mol·L−1 potassium chloride solution produced by deionized water and determined by Auto Discrete Analyzers (Smart Chem 200, ITA) for analysis. The mass fraction of TP was determined by molybdenum antimony scandium colorimetric method [28]. Soil bulk density (ρb) was determined by the ring knife method, and soil pH and water content were determined by potential method and drying method, respectively.

2.4. Statistical Analyses

SPSS 16 software was used for ANOVA and correlation analysis, and one-way ANOVA (One-way ANOVA) and Duncan’s difference significance test (α = 0.05) were used to detect whether there were significant differences in soil organic carbon and its components between vegetation types and soil layers. The Canoco 5.0 software redundancy analysis (RDA) method was used to evaluate the correlation between carbon components and soil environmental factors. Plots (histograms, correlation coefficient matrix) were made using OriginPro 2021 software and correlations between SOC components and physical and chemical properties of the soil were examined using the Pearson method. Data in the graphs are mean ± standard deviation.

3. Results

3.1. Mass Fraction Characteristics of Soil TOC

The mass fraction of soil TOC under O. frutescens, D. donianum and I. tessellatu cover ranged from 6.68–20.66, 5.98–19.76 and 6.74–20.09 g·kg−1, respectively, and all three showed a decreasing distribution trend layer by layer throughout the soil profile. None of the differences in soil TOC mass fraction between understory vegetation types in the same soil layer were significant (Figure 2).

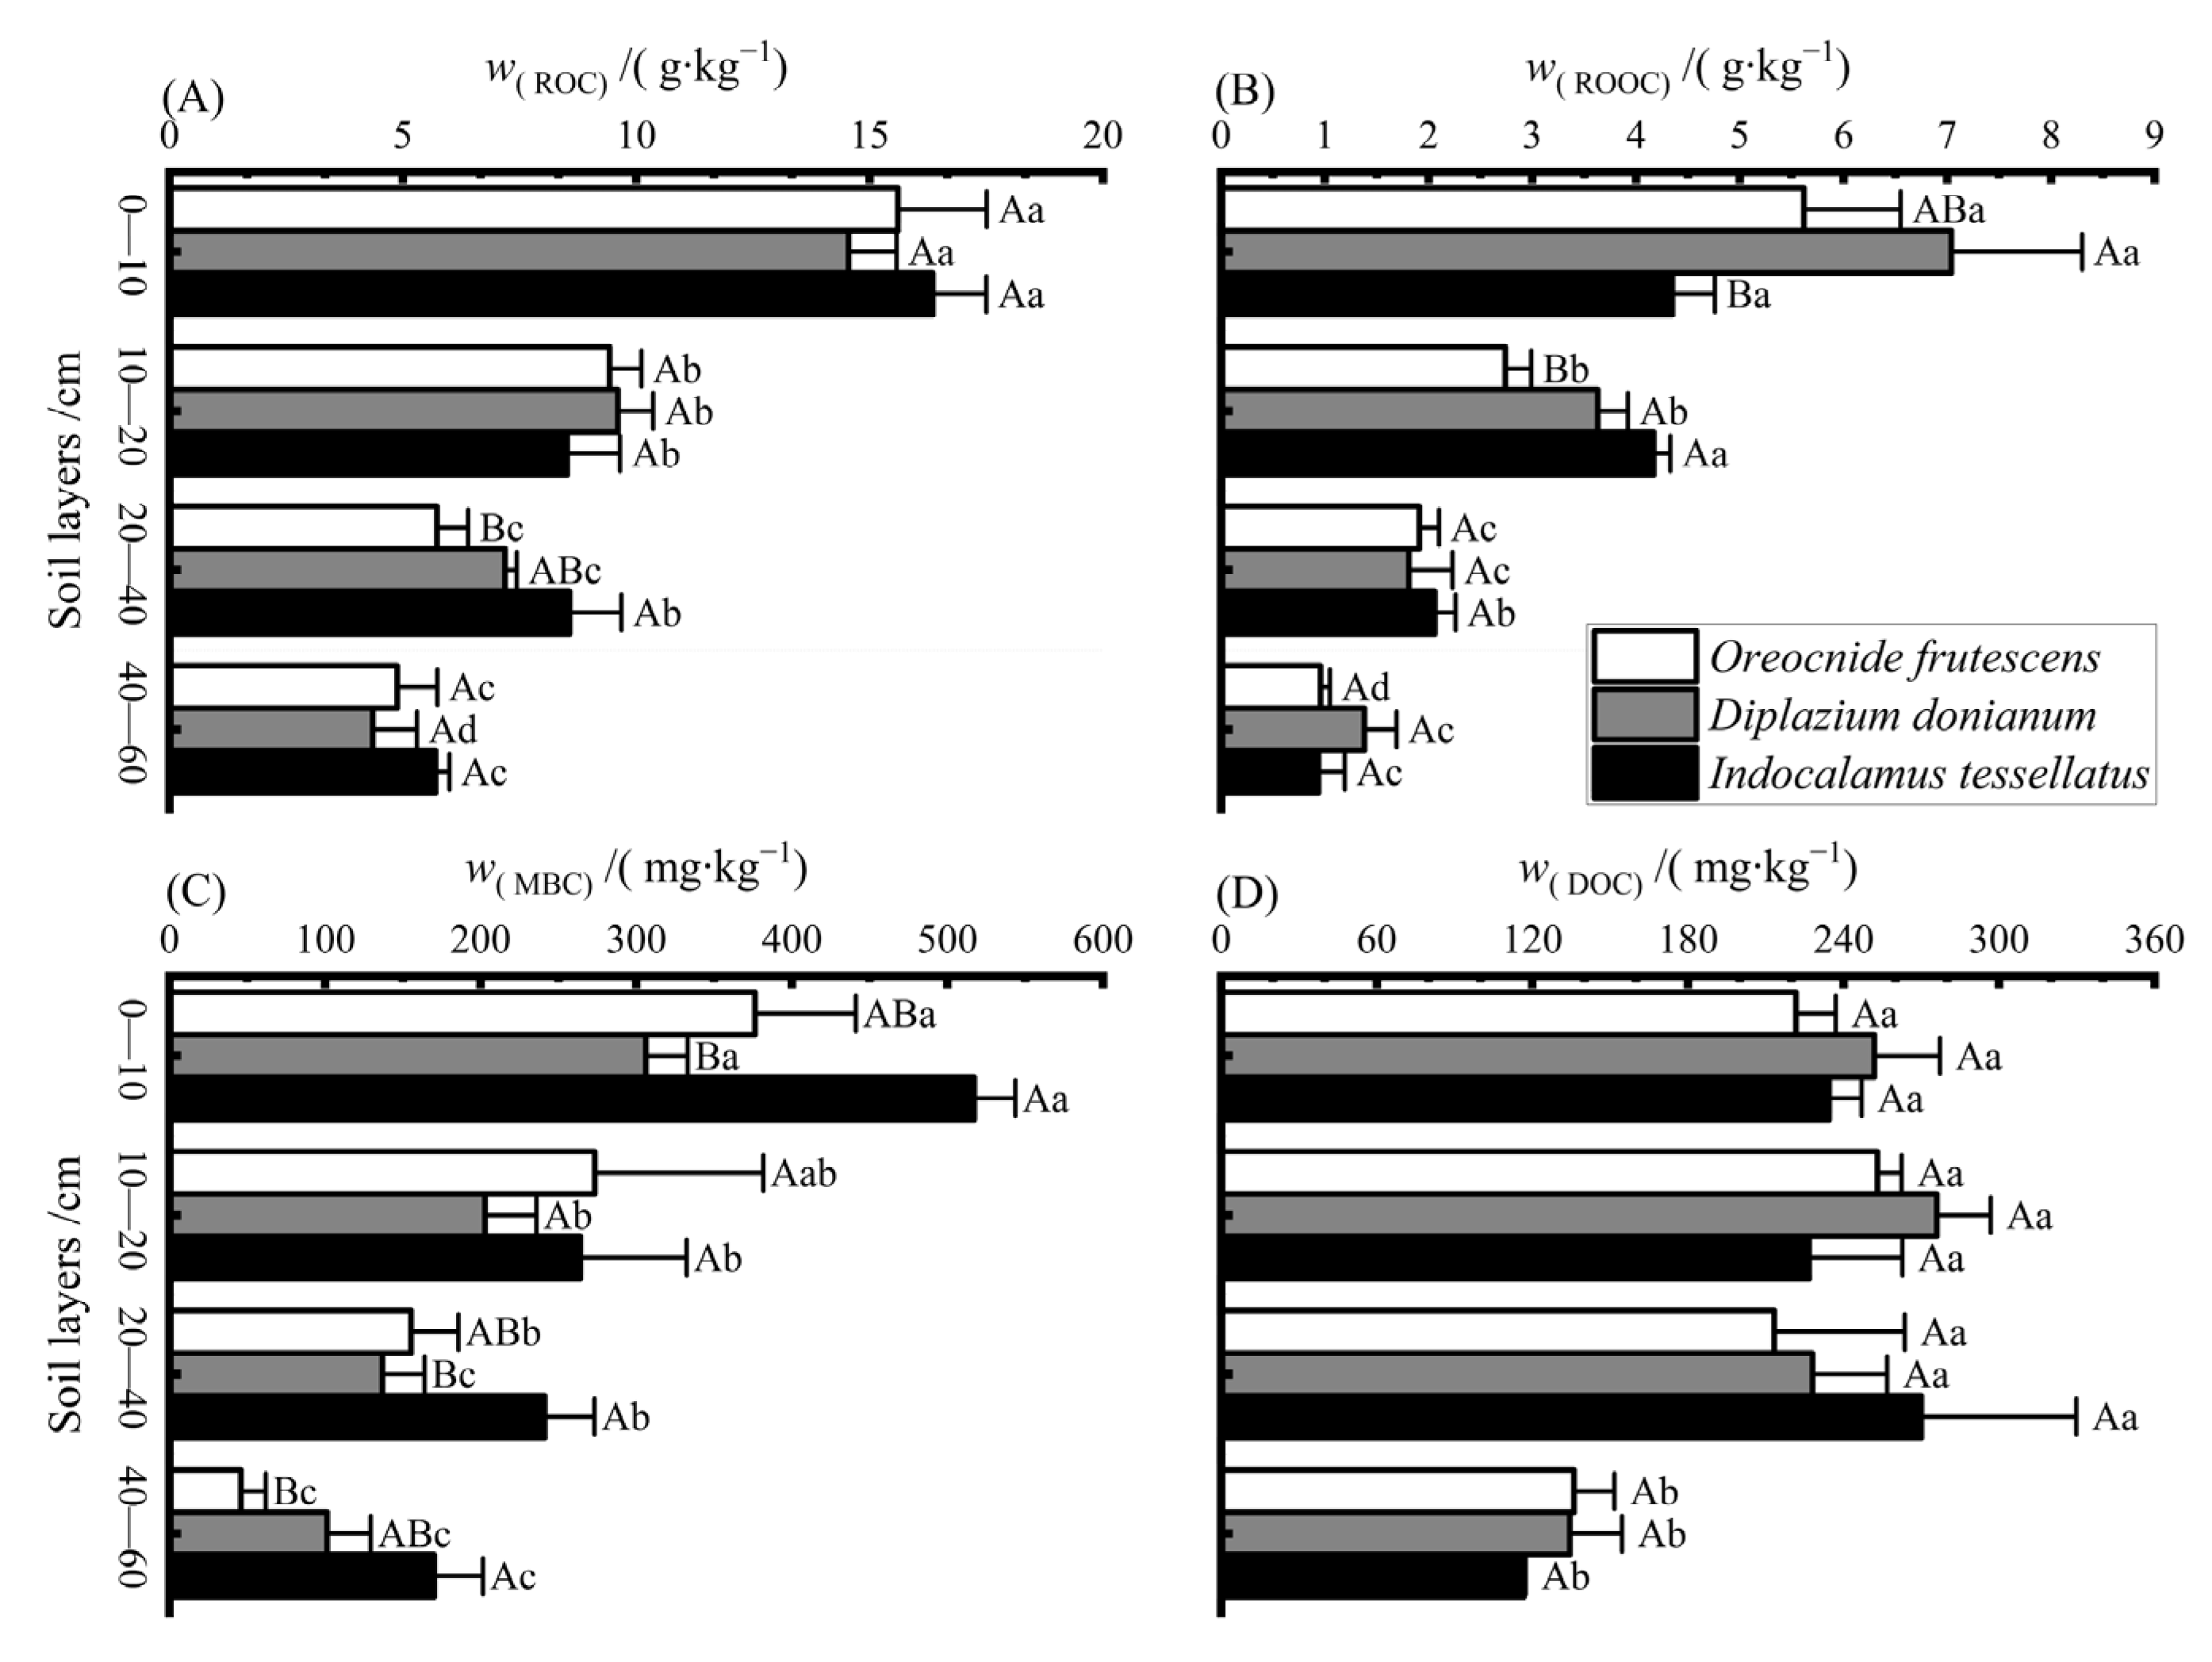
3.2. Mass Fraction Characteristics of Soil Organic Carbon Components

The soil ROC ROOC and MBC mass fractions of the three understory vegetation types showed a similar distribution pattern that decreased with the increase of soil depth (Figure 3A–C), while the soil DOC mass fraction showed two gradients of difference; namely, the soil layers of 0–40 cm and 40–60 cm were significantly different (Figure 3D). The mass fraction of each soil organic carbon component in the whole soil profile showed that ROC (4.36–16.35 g·kg−1) > ROOC (0.94–7.04 g·kg−1) > MBC (46.04–517.14 g·kg−1) > DOC (116.77–276.03 g·kg−1). The mass fractions of soil ROC, ROOC and MBC were significantly different among the three understory vegetation types. The soil ROC mass fraction in the 20–40 cm soil layer was significantly different, showing that I. tessellatu > D. donianum > O. frutescens. Soi ROOC mass fraction differed significantly only in the top soil layer, which showed in the 0–10 cm soil layer as D. donianum > O. frutescens > I. tessellatu, and in the 10–20 cm soil layer, O. frutescens was significantly smaller than D. donianum and I. tessellatu. In the 0–40 cm soil layer, the mean value of soil MBC mass fraction under cover of D. donianum was the smallest and was significantly slower than that of I. tessellatu in 0–10 and 20–40 cm soil layers. In the 40–60 cm soil layer, the soil MBC mass fraction of O. frutescens was significantly lower than that of I. tessellatu, but the difference between both and D. donianum was not significant.

3.3. The Percentage of Soil Organic Carbon Composition to TOC

It can be seen from Table 2 that the percentage of soil ROC to TOC has no significant difference among understory vegetation types and soil layers. The percentage of soil DOC to TOC was significantly different only among soil layers, namely that the percentage of DOC in the 0–10 cm soil layer was significantly lower than that in the 10–60 cm soil layer under all three vegetation communities. Soils under D. donianum cover had a lower MBC percentage, which was significantly lower than that of I. tessellatus in both the 0–10 and 20–40 cm soil layers. The mean value of the proportion of ROOC in the surface soil under O. frutescens vegetation was the smallest, which is significantly different from that of D. donianum and I. tessellatus in 0–10 and 10–20 cm soil layers, respectively.

3.4. Correlation Analysis of Soil Organic Carbon Components with Physicochemical Factors

By analyzing the correlation between soil physicochemical factors and SOC components, it was found that SOC and its components were positively correlated with TN, MBN, DTN and DON, SWC was negatively correlated with TOC, ROC and MBC, pH was positively correlated with TOC, ROC, ROOC and MBC, and NO3-N was positively correlated with TOC and ROOC. All pairwise SOC components showed highly significant positive correlations (Figure 4).
Redundancy analysis (RDA) was carried out with the mass fraction of SOC components in different soil layers as response variables and soil physicochemical factors as environmental explanatory variables, and the results are shown in Figure 5. The cumulative explanatory amounts of the first and second principal axes in the four soil layers to soil physicochemical properties and organic carbon components were 92.67%, 75.81%, 99.96% and 98.60%, respectively. In the 0–10 cm soil layer, the interpretation rate of soil ρb for SOC components reached a significant level (41.6%). Soil MBN had the highest explanation rate (41.2%) for organic carbon components in the 10–20 cm soil layer. In the 20–40 cm soil layer, the explanatory rates of DTN and TN to organic carbon components reached a significant level, with explanatory rates of 43.7% and 9.9%, respectively. In the 40–60 cm soil layer, the physicochemical factors with the highest interpretation of the SOC components were DON (43.6%) and pH (6.6%).

4. Discussion

4.1. Characteristics of Changes in Soil TOC in Different Understory Vegetation

SOC mass fraction reflects the dynamic balance between soil organic matter input and output under the action of microorganisms [29]. In this study, the soil TOC mass fraction of all three understory vegetation communities in C. lanceolata plantations showed a decreasing trend with increasing soil depth, which was similar to the results of previous studies on the variation of organic carbon with soil layer [7,30]. The input of external carbon sources in surface soil is high and stable, and the suitable temperature and humidity conditions are conducive to the formation and transformation of SOC [6]; on the other hand, as the soil depth increases, factors such as organic matter input, soil physicochemical properties and microbial activity change, which in turn affect the distribution of organic carbon in the middle and deep soil layers [31,32]. Therefore, the soil TOC mass fraction in the 0–10 cm soil layer of the three understory vegetation types was the largest in the whole profile. SOC is mainly derived from plant litter inputs and root secretion processes, and different understory vegetation communities have different biomass, root exudates, litter, and decomposition rates [16,33], whose contribution to soil organic matter input is different [19], which easily leads to a different distribution of SOC [34]. In this study, soil TOC quality fraction of different undergrowth vegetation types had no significant difference in the 0–60 cm soil layer, which is different from the findings of Zhao [20]. That is, understory vegetation types significantly affect the mass fraction of TOC in the surface layer. Different from the stand types selected by the latter (aerial seeding Pinus massoniana plantations) and understory vegetation types (Dicranopteris linearis (Burm.) Underw., Paspalum thunbergii Kunth ex steud. and Arundinella anomala Steud.), there is no significant difference in matrix C content between an aboveground and underground litter of the three understory vegetation types in this study, which makes it have little influence on factors such as soil nutrient absorption intensity and transfer rate. On the other hand, the spatial distance of the three understory vegetation communities was found to be relatively close to each other during the sample site survey, and the external environmental differences were not obvious, and the forest floor litter was mainly C. lanceolata, so the SOC was more significantly affected by C. lanceolata. Therefore, it was presumed that the different forest structure types and understory vegetation types could also cause differences in the research results.

4.2. Characteristics of Changes in Soil Organic Carbon Components in Different Understory Vegetation

Soil ROC responds slowly to external environmental changes, which can be an important indicator of soil carbon pool accumulation and carbon stability [7,30]. Soil ROC mass fractions in this study showed significant differences among understory vegetation types or soil layers, and the soil ROC mass fraction and its percentage of TOC were significantly higher than the AOC components in all three understory vegetation types (Figure 3, Table 2), which generally reflected the high stability of SOC in this C. lanceolata plantation forest, which was not easily decomposed [35]. The mass fraction of soil ROC of the three understory vegetation types differed significantly only in the 20–40 cm soil layer (Figure 3A), indicating that the root development status of understory vegetation affected the ROC storage of the middle layer. This study found that the ROC mass fraction of soil in the 20–40 cm soil layer under the I. tessellatus community was higher. On the one hand, this is because soil ROC is difficult to be decomposed and utilized by microorganisms, and the amount of its storage is the result of the long-term accumulation of SOC [7], which is closely related to the total SOC storage (Figure 4) [30,36]; on the other hand, the C/N value of I. tessellatus root litters (59.8) was significantly higher than that of D. donianum (25.8) and O. frutescens (40.9), and its root litters had more difficult-to-decompose compounds (such as lignin, cellulose, and phenols), which were less decomposed and utilized by microorganisms and to a certain extent to promote the accumulation of ROC [19,34]. In addition, this study also found that the distribution characteristics of soil ROC mass fractions along the profile of different understory vegetation were not consistent with their proportions (Figure 3A, Table 2), which was different from the results of studies in other forest-type soils [30]. This may be because the canopy species in this study was only a monoculture of C. lanceolata. Compared with the diverse tree species in other studies, the soil carbon pool in this stand may be less affected by the shrub layer than the single forest canopy [37].
Compared with ROC, soil AOC is easy to be oxidized and decomposed and can directly participate in the biochemical process of soil. The higher the content and proportion of AOC to SOC, the greater the activity of the soil carbon pool [7]. In this study, we found that the three AOC components differed significantly among understory vegetation types or soil layers (Figure 3B–D), and the differences among different AOC components were not the same among understory vegetation or soil layers, indicating that there were differences in the responses of different AOC components of soil to understory vegetation types. This was similar to the findings of Pan [19], indicating that changes in understory vegetation type can influence the distribution of AOC components in soil [12]. The stability of the soil carbon pool decreases with the increase of AOC [7]. In this study, the total AOC mass fraction and its proportion were 2.67 g·kg−1 and 25.84%, which were significantly lower than ROC (Figure 3, Table 2), indicating that the soil carbon pool was not very active and relatively stable. The present study found that soil ROOC mass fraction and its percentage were significantly higher than the other two AOC components throughout the profile, exhibiting the highest in the 0–10 cm soil layer (Figure 3A), which was similar to previous findings in other forests [6], indicating that ROOC can be used to indicate the active level of SOC. Soil AOC components are significantly correlated with TOC (Figure 4) [30]. With the deepening of the soil layer, factors such as soil environment, exogenous carbon input and microbial activity gradually weaken [38], and the effectiveness of SOC gradually decreases [32], which is not conducive to the storage of AOC. Therefore, soil AOC components of the three understory vegetation types were enriched in the surface layer (Figure 3B–D). In this study, we found that the mass fraction and percentage of soil ROOC and DOC were higher in the 0–20 cm soil layer under D. donianum vegetation (Figure 3B–D; Table 2); this is because the higher the nitrogen content of organic matter, the easier it is to be decomposed by microorganisms, and its migration and transformation rate in the soil will also be higher [39]. Further analysis revealed that the 0–60 cm soil layer under the I. tessellatus community has a high MBC mass fraction and percentage, indicating that the soil under the I. tessellatus cover had high microbial activity [40]. In addition, the soil under I. tessellatus cover has a high nitrogen content and low C/N value, which can not only improve the decomposition and utilization of organic matter by soil microorganisms but also trigger the demand of microorganisms to utilize the original AOC components of the soil, rapidly absorb and utilize DOC, increase their own organic carbon storage, and further enhance the decomposition and conversion of AOC components [18,40]. Therefore, it was seen that soil ROC and MBC mass fractions under I. tessellatus community showed significant differences from the other two types of understory vegetation types. In addition, because this study only investigated the distribution of SOC components in autumn, without considering the changes of SOC components in other seasons or rhizosphere, it was not possible to reveal the characteristics of SOC components in different understory vegetation in depth. In the future, it is necessary to pay close attention to the dynamic study of understory vegetation types on SOC components, which is important for the effective management of understory vegetation and the promotion of carbon sequestration in plantation forest ecosystems during plantation.

4.3. Relationship between Soil Organic Carbon Components and Soil Physicochemical Factors

The correlation analysis of soil organic carbon components showed that there was a significant positive correlation between the four organic carbon components, and all of them were highly significantly positively correlated with TOC, which is similar to the results of most studies, indicating that each organic carbon component is mainly derived from TOC, and the AOC components and ROC are closely linked to each other, often in dynamic equilibrium, and can be transformed into each other under certain conditions [18,41]. RDA of soil physical and chemical factors and organic carbon components revealed that important factors affecting SOC components differed among soil layers. Except for the 0–10 cm soil layer, soil nitrogen content (such as TN, MBN, DTN, and DON) is an important physical and chemical factor affecting the SOC components, and correlation analysis also found that soil TN, MBN, DTN, and DON are all highly significantly and positively correlated with the SOC components, this is similar to the results of most studies [18,38]. This is because soil nitrogen content can affect the species, quantity and activity of soil microorganisms, regulate the rate of decomposition and utilization rate of soil microorganisms to organic matter [12,20] and then affect the decomposition and transformation process of soil organic carbon. Therefore, this study infers that, in addition to litter inputs, microbial activity can be influenced by changes in effective soil nitrogen, which affects the formation and transformation of soil organic carbon.

5. Conclusions

In this study, the distribution characteristics of SOC and its components (TOC, ROC, ROOC, MBC and DOC) under three different understory vegetation types (O. frutescens, D. donianum and I. tessellatus) in subtropical C. lanceolata plantation forests were analyzed to investigate the effects of changes in understory vegetation types on soil SOC and its components. The study showed that each organic carbon component had different distribution characteristics in the profile, with soil TOC, ROC, ROOC and MBC mass fractions decreasing along the soil layer, while DOC showed a significantly lower distribution in the 40–60 cm than in the 0–40 cm soil layer. Compared with TOC and ROC, ROOC and MBC in AOC components had more significant differences among understory vegetation types. External carbon input and soil nitrogen are important factors influencing the differences in the distribution characteristics of organic carbon components. The results show that understory vegetation type can influence the distribution characteristics of soil organic carbon and its components by regulating organic litter input (quantity, quality) and soil physicochemical properties (nitrogen content). Therefore, during the management of plantation forests, proper regulation of the community structure composition of understory vegetation and maintenance of the richness and diversity of understory vegetation is conducive to improving soil quality and the C and N cycle and supply of forest soils.

Author Contributions

R.S.: Conceptualization, methodology, software, formal analysis, data curation, writing—original draft, writing—review and editing, visualization. D.X.: methodology, resources, writing—review and editing, supervision, funding acquisition. X.H.: writing—review and editing. Q.Y.: sample collection, measurement. Z.Z.: software, formal analysis. All authors have read and agreed to the published version of the manuscript.

Funding

1. The Project of Forestry Peak Discipline at Fujian Agriculture and Forestry University, China (Grant No. 118—71201800724); 2. The National Natural Science Foundation of China (Grant Nos. 41703068).

Data Availability Statement

Not applicable.

Acknowledgments

We gratefully acknowledge the assistance and the in-kind support of Forest Ecology Stable Isotope Center for Applied, College of Forestry, Fujian Agriculture and Forestry University, Fujian Province, Fuzhou.

Conflicts of Interest

The authors declare no conflict of interest.

References

  1. Liu, S.R.; Wang, H.; Luan, J.W. A review of research progress and future prospective of forest soil carbon stock and soil carbon process in China. Acta Ecol. Sin. 2011, 31, 5437–5448. [Google Scholar]
  2. Lai, R. Soil carbon sequestration impacts on global climate change and food security. Science 2004, 304, 1623–1627. [Google Scholar]
  3. Parton, W.J.; Schimel, D.S.; Cole, C.V. Analysis of factors controlling soil organic matter levels in Great Plains grasslands. Soil Sci. Soc. Am. J. 1987, 51, 1173–1179. [Google Scholar] [CrossRef]
  4. Li, Y.C.; Li, Y.F.; Chang, S.X. Linking soil fungal community structure and function to soil organic carbon chemical composition in intensively managed subtropical bamboo forests. Soil Biol. Biochem. 2017, 107, 19–31. [Google Scholar] [CrossRef]
  5. Zhao, S.X.; Ta, N.; Li, Z.H. Varying pyrolysis temperature impacts application effects of biochar on soil labile organic carbon and humic fractions. Appl. Soil Ecol. 2018, 123, 484–493. [Google Scholar] [CrossRef]
  6. Zhu, H.Y.; Wang, Z.F.; Lu, C. Characteristics of changes in soil reactive organic carbon and carbon pool under five planting covers in Jinyun Mountain. Soils 2021, 53, 354–360. [Google Scholar]
  7. Xi, D.; Kuang, Y.W. Characteristics of soil organic carbon and its components in subtropical broadleaf evergreen forests on an urbanization gradient. Chin. J. Appl. Ecol. 2018, 29, 2149–2155. [Google Scholar]
  8. Du, X.; Wang, H.Y. Organic carbon activity fraction in Chinese forest soils and its influencing factors. World For. Res. 2022, 35, 76–81. [Google Scholar]
  9. Ravindran, A.; Yang, S. Effect of vegetation type on microbial biomass carbon and nitrogen in subalpine mountain forest soils. J. Microbiol. Immunol. Infect. 2015, 45, 362–369. [Google Scholar] [CrossRef]
  10. Wang, D.; Wang, B.; Niu, X. Effects of natural forest types on soil carbon fractions in North-East China. J. Trop. For. Sci. 2014, 26, 362–370. [Google Scholar]
  11. Inoue, T.; Fukuzawa, K.; Watanabe, T. Spatial pattern of soil nitrogen availability and its relationship to stand structure in a coniferous-broadleaved mixed forest with a dense dwarf bamboo understory in northern Japan. Ecol. Res. 2017, 32, 227–241. [Google Scholar] [CrossRef]
  12. Zhang, J.Y.; Yu, T.; E, X.W. Effects of understory vegetation management on soil microbial biomass carbon and nitrogen and extracellular enzyme activities in the early stages of plantation. Acta Ecol. Sin. 2021, 41, 9898–9909. [Google Scholar]
  13. Dai, X.Q.; Fu, X.L.; Kou, L. C: N: P stoichiometry of rhizosphere soils differed significantly among overstory trees and understory shrubs in plantations in subtropical China. Can. J. For. Res. 2018, 48, 1398–1405. [Google Scholar] [CrossRef]
  14. Mo, X.L.; Dai, X.Q.; Wang, H.M. Rhizosphere effects of overstory tree and understory shrub species in central subtropical plantations—A case study at Qianyanzhou, Taihe, Jiangxi, China. Chin. J. Plant Ecol. 2018, 42, 723–733. [Google Scholar]
  15. Wang, X.P.; Yang, X.; Yang, N. Effects of litter diversity and composition on litter decomposition characteristics and soil microbial community. Acta Ecol. Sin. 2019, 39, 6264–6272. [Google Scholar]
  16. Gao, Y.Q.; Dai, X.Q.; Wang, J.L. Characteristics of soil enzymes stoichiometry in rhizosphere of understory vegetation in subtropical forest plantations. Chin. J. Plant Ecol. 2019, 43, 258–272. [Google Scholar] [CrossRef]
  17. Wang, T.; Xu, Q.; Gao, D. Effects of thinning and understory removal on the soil water-holding capacity in Pinus massoniana plantations. Sci. Rep. 2021, 11, 13029. [Google Scholar] [CrossRef]
  18. Xi, D.; Weng, H.D.; Hu, Y.L. Effect of canopy nitrogen addition and understory vegetation removal on soil organic carbon fractions in a Chinese fir plantation. Acta Ecol. Sin. 2021, 41, 8525–8534. [Google Scholar]
  19. Pan, P.; Zhao, F.; Ouyang, X.Z.; Zang, H.; Ning, J.K.; Guo, R. Characteristics of soil carbon and nitrogen and relationship with litter quality under different understory vegetation in Pinus massoniana plantations. Acta Ecol. Sin. 2018, 38, 3988–3997. [Google Scholar]
  20. Zhao, F.; Ouyang, X.Z. Assessing relative contributions of various influencing factors to soil organic carbon in aerially—Seeded Pinus massoniana plantations. Acta Ecol. Sin. 2016, 36, 2637–2645. [Google Scholar]
  21. Xu, H.T.; Sun, Y.J.; Liu, S.Z. Stand biomass and carbon storage distribution of Chinese fir plantation in Subtropical China: A case study of China Lanceolata plantation in Jiangle County, Fujian Province. J. Cent. South Univ. For. Technol. 2015, 35, 94–99. [Google Scholar]
  22. Xia, L.D.; Yu, J.D.; Deng, L.L. Researches on soil decline of Chinese fir plantation. World For. Res. 2012, 31, 37–42. [Google Scholar]
  23. Fei, Y.C.; Wu, Q.Z.; Zhang, X. Effects of different undergrowth vegetation management measures on soil characteristics and timber outturn of a large-diameter, timber plantation of Cunninghamia lanceolata. Chin. J. Appl. Environ. Biol. 2020, 26, 626–634. [Google Scholar]
  24. Wang, Y.Z.; Zheng, J.Q.; Liu, X.; Yan, Q.; Hu, Y.L. Short-term impact of fire-deposited charcoal on soil microbial community abundance and composition in a subtropical plantation in China—ScienceDirect. Geoderma 2020, 359, 113992. [Google Scholar] [CrossRef]
  25. Brookes, P.C.; Landman, A.; Pruden, G.; Jenkinson, D.S. Chloroform fumigation and the release of soil nitro-gen: A rapid direct extraction method to measure microbial biomass nitrogen in soil. Soil Biol. Biochem. 1985, 17, 837–842. [Google Scholar] [CrossRef]
  26. Jenkinson, D.S.; Powlson, D.S. The effects of biocidal treatments on metabolism in soil. Soil Biol. Biochem. 1976, 8, 209–213. [Google Scholar] [CrossRef]
  27. Fang, H.; Cheng, S.; Yu, G.; Xu, M.; Wang, Y.; Li, L. Experimental nitrogen deposition alters the quantity and quality of soil dissolved organic carbon in an alpine meadow on the Qinghai-Tibetan Plateau. Appl. Soil Ecol. 2014, 81, 1–11. [Google Scholar] [CrossRef]
  28. Lu, R.K. Methods for Agricultural Chemical Analysis of Soil; China Agricultural Science and Technology Press: Beijing, China, 1999. (In Chinese) [Google Scholar]
  29. Ma, H.Y.; Li, X.Z.; Ma, X.Y.; Gong, L. Soil organic carbon components and their influencing factors under different vegetation types in the middle part of northern Tianshan Mountains, Xinjiang. Ecol. Environ. Sci. 2022, 31, 1124–1131. [Google Scholar]
  30. Xiang, H.M.; Wen, D.Z.; Zhang, L.L. Changes in soil active and inert carbon along an elevation gradient in Dinghu Mountain forests. Acta Ecol. Sin. 2015, 35, 6089–6099. [Google Scholar]
  31. Jobbagy, E.G.; Jackson, R.B. The vertical distribution of soil organic carbon and its relation to climate and vegetation. Ecol. Appl. 2000, 10, 423–436. [Google Scholar] [CrossRef]
  32. Wang, D.; Geng, Z.C.; Yu, D. Soil organic carbon stocks and vertical distribution of carbon and nitrogen in typical forest stands in the Qinling Mountains. Acta Ecol. Sin. 2015, 35, 5421–5429. [Google Scholar]
  33. Sauheitl, L.; Glaser, B.; Dippold, M. Amino acid fingerprint of a grassland soil reflects changes in plant species richness. Plant Soil 2010, 334, 353–363. [Google Scholar] [CrossRef]
  34. Yang, L.W.; Luo, T.X.; Wu, S.T. Comparison of belowground biomass and carbon and nitrogen stocks in different successional stages of primitive broadleaf red pine forests in Changbai Mountain. Chin. J. Appl. Ecol. 2005, 7, 1195–1199. [Google Scholar]
  35. Knorr, W.; Prentice, I.C.; House, J.I. Long-term sensitivity of soil carbon turnover to warming. Nature 2005, 433, 298–301. [Google Scholar] [CrossRef] [PubMed]
  36. Sylvain, T.; Miguel, A. Changes in soil organic carbon pools along a chronosequence of land abandonment in southern Spain. Geoderma 2016, 268, 14–21. [Google Scholar]
  37. Zhang, X.Y.; Chen, X.M.; Wei, H. Effects of urbanization on soil organic carbon components and carbon pool management index of persistent evergreen broad-leaved forest in the Pearl River Delta. J. Soil Water Conserv. 2017, 31, 184–190. [Google Scholar]
  38. Wu, Y.C.; Li, Z.C.; Cheng, C.F. Effects of understory removal on soil labile organic carbon pool in a Cinnamomum camphora plantation. Chin. J. Appl. Ecol. 2013, 24, 3341–3346. [Google Scholar]
  39. Ma, Y.D.; Jiang, H.; Yu, S.Q.; Dou, R.P.; Guo, P.P.; W, B. Decomposition characteristics of plant leaf litter of different origin times in the central subtropics. Acta Ecol. Sin. 2009, 29, 5237–5245. [Google Scholar]
  40. Cui, D.; Yan, J.J.; Liu, H.J. Differences in soil labile organic carbon fractions and their contents in different types of wetlands in the Ili River Valley. Chin. J. Ecol. 2019, 38, 2087–2093. [Google Scholar]
  41. Li, P.Q.; Fang, X.M.; Chen, F.S. Variability of soil water soluble organic carbon content and its response to temperature change in green spaces along urban-to-rural gradient of Nanchang, China. Chin. J. Appl. Ecol. 2015, 26, 3398–3404. [Google Scholar]
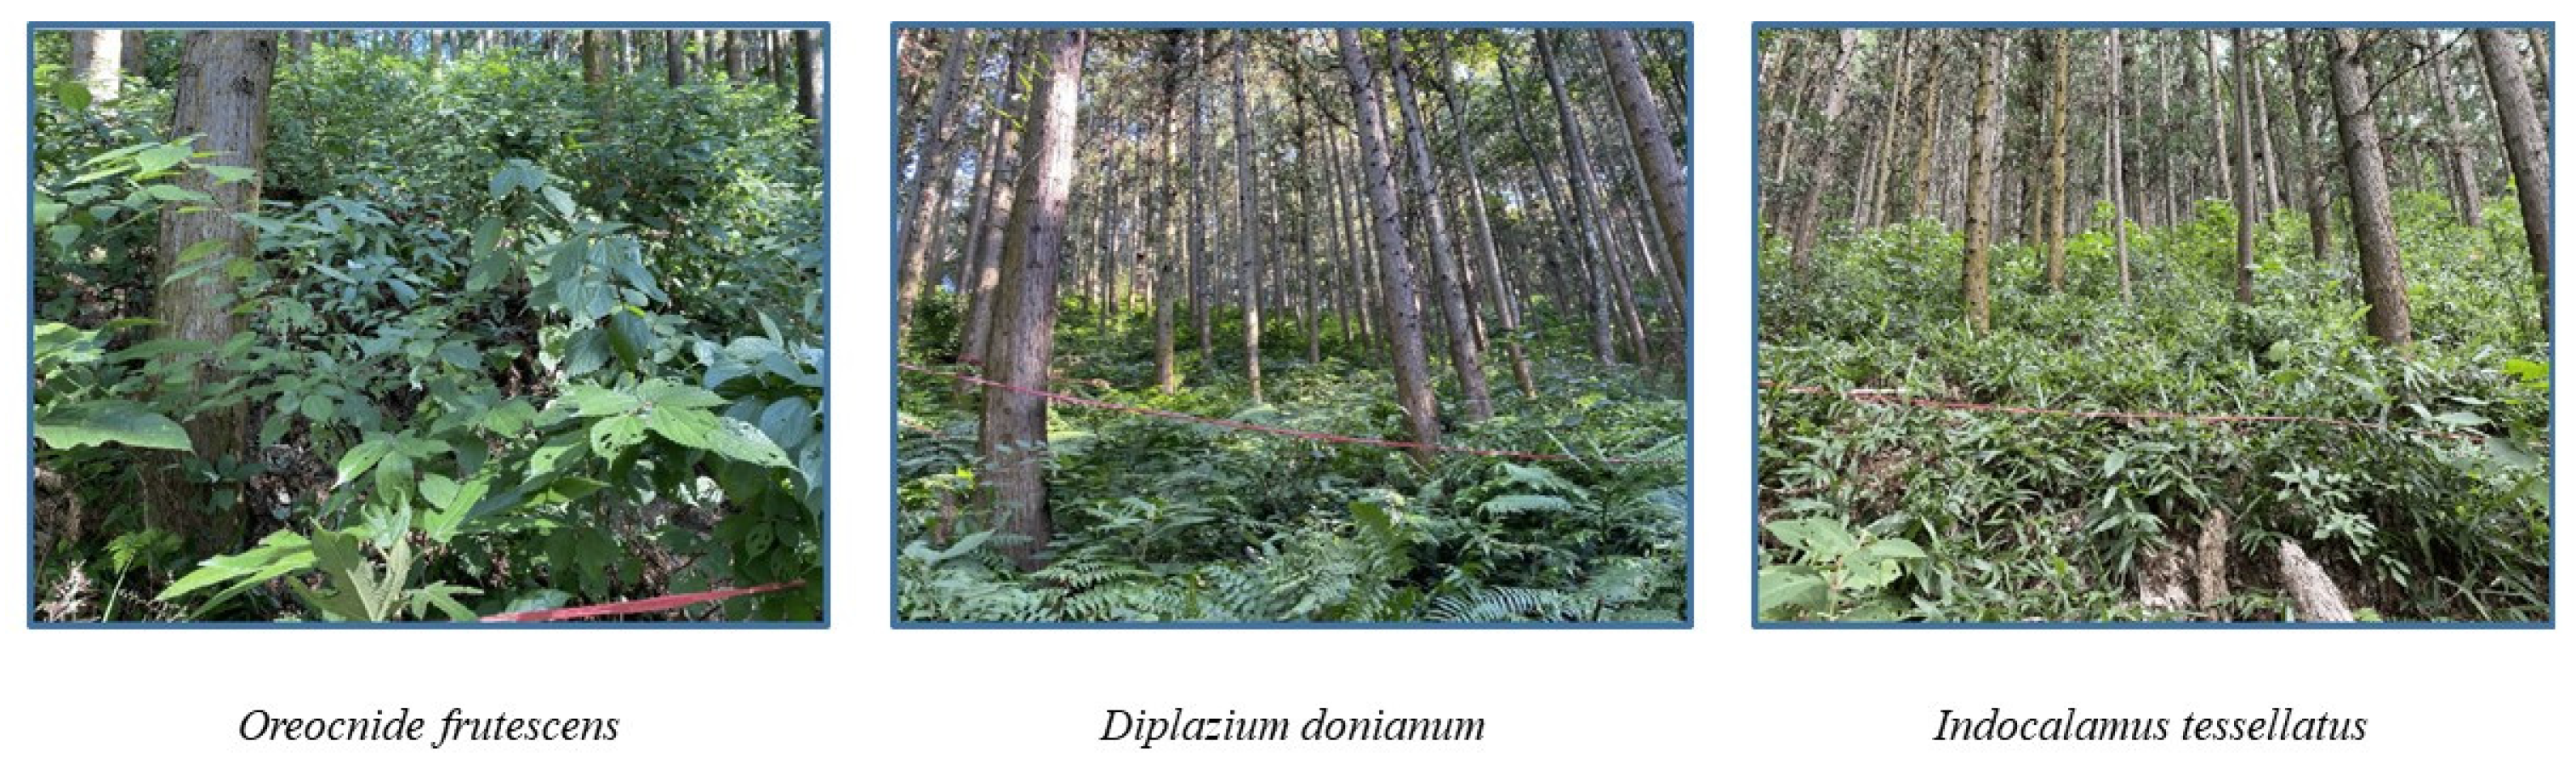
Figure 1. Three undergrowth dominant planting communities.
Land 11 02300 g001
Figure 2. Soil total organic carbon mass fraction. TOC (Total organic carbon). Different uppercase letters indicate significant differences between understory vegetation types, and different lowercase letters indicate significant differences between soil layers. (p < 0.05).
Land 11 02300 g002
Figure 3. Mass fraction of each soil organic carbon component. (A): the mass fraction of ROC; (B): the mass fraction of ROOC; (C): the mass fraction of MBC; (D): the mass fraction of DOC. ROC (Recalcitrant organic carbon), ROOC (Readily oxidizable organic carbon), MBC (Microbial biomass carbon), DOC (Dissolved organic carbon). Different uppercase letters indicate significant differences between understory vegetation types, and different lowercase letters indicate significant differences between soil layers. (p < 0.05).
Land 11 02300 g003
Figure 4. Correlation coefficients between soil carbon components with soil physicochemical factors. SWC (Soil moisture content); ρb (Bulk density); pH (pH); TN (Total nitrogen); TP (Total phosphorus); NH4+-N (Ammonium); NO3-N (Nitrate); DTN (Dissolved total nitrogen); DON (Dissolved organic nitrogen); MBN (Microbial biomass nitrogen); TOC (Total organic carbon); ROC (Recalcitrant organic carbon), ROOC (Readily oxidizable organic carbon); MBC (Microbial biomass carbon); DOC (Dissolved organic carbon). The numbers in the graph represent the correlation coefficient r; red indicates positive correlation; blue indicates negative correlation; * indicates significant correlation at 0.05 level; ** indicates significant correlation at 0.01 level.
Land 11 02300 g004
Figure 5. Redundancy analysis of soil organic carbon and its components with physicochemical properties. SWC (Soil moisture content); ρb (Bulk density); pH (pH); TN (Total nitrogen); TP (Total phosphorus); NH4+-N (Ammonium); NO3-N (Nitrate); DTN (Dissolved total nitrogen); DON (Dissolved organic nitrogen); MBN (Microbial biomass nitrogen); TOC (Total organic carbon); ROC (Recalcitrant organic carbon), ROOC (Readily oxidizable organic carbon); MBC (Microbial biomass carbon); DOC (Dissolved organic carbon).
Land 11 02300 g005
Table 1. Sample Site Information Sheet.
Undergrowth VegetationIndocalamus tessellatusDiplazium donianumOreocnide frutescens
Height (cm)44.2 ± 1.4108.3 ± 13.0130.8 ± 4.6
Ground diameter (cm)0.53 ± 0.15.80 ± 1.11.7 ± 0.68
Slope aspectSouthwestSouthwestSouthwest
Slope positionDownslopeMid-slopeUpslope
Temperature (°C)18.9619.0518.91
Altitude (masl)110 ± 3125 ± 3130 ± 3
Abundance (%)90.3 ± 0.783.1 ± 2.579.0 ± 5.7
Associated understory vegetationPhoebe bournei (Hemsl.) Yang, Lophatherum gracile Brongn., Diplazium donianum.Callicarpa kochiana Makino, Phoebe bournei, Indocalamus tessellatus, Oreocnide frutescens, Dicranopteris linearis (Burm.) Underw.Phoebe bournei, Indocalamus tessellatus, Diplazium donianum, Embelia rudis Hand.-Mazz., Callicarpa kochiana, Dicranopteris linearis, Melastoma dodecandrum Lour.
Table 2. Proportions of mass fraction of each soil organic carbon component to TOC (%).
IndexSoil Layers (cm)Indocalamus tessellatusDiplazium donianumOreocnide frutescens
PROC/TOC0–1081.46 ± 7.79 Aa74.39 ± 14.69 Aa74.89 ± 12.29 Aa
10–2064.548 ± 9.56 Aa72.07 ± 9.02 Aa74.13 ± 7.25 Aa
20–4083.53 ± 8.48 Aa70.35 ± 11.95 Aa68.65 ± 19.40 Aa
40–6086.04 ± 15.02 Aa72.72 ± 10.62 Aa76.42 ± 25.85 Aa
PROOC/TOC0–1021.66 ± 1.03 Ba35.46 ± 4.13 Aa27.35 ± 5.46 Ba
10–2031.96 ± 2.53 Aa27.35 ± 4.72 ABab21.76 ± 4.72 Ba
20–4020.27 ± 2.20 Aa17.19 ± 6.74 Ab22.84 ± 5.77 Aa
40–6013.58 ± 4.85 Aa23.47 ± 11.38 Aa14.50 ± 2.17 Ab
PMBC/TOC0–102.59 ± 0.35 Aa1.54 ± 0.20 Ba1.84 ± 0.71 ABa
10–202.02 ± 0.84 Aa1.54 ± 0.56 Aa2.08 ± 1.48 Aa
20–402.35 ± 0.29 Aa1.31 ± 0.48 Ba1.82 ± 0.50 ABa
40–601.90 ± 0.90 Aa1.75 ± 0.98 Aa0.69 ± 0.46 Aa
PDOC/TOC0–101.17 ± 0.03 Ab1.29 ± 0.34 Ab1.08 ± 0.21 Ab
10–201.74 ± 0.43 Aa2.08 ± 0.35 Aa2.00 ± 0.20 Aa
20–402.63 ± 0.81 Aa2.19 ± 0.42 Aa2.50 ± 0.93 Aa
40–603.21 ± 2.27 Aa2.23 ± 0.46 Aa2.13 ± 0.79 Aa
Different uppercase letters indicate significant differences between understory vegetation types, and different lowercase letters indicate significant differences between soil layers. (p < 0.05).
Publisher’s Note: MDPI stays neutral with regard to jurisdictional claims in published maps and institutional affiliations.

