1. Introduction
Countries with an agrarian character (i.e., a high share of arable land and good quality of agricultural land), such as Slovakia, have been solving problems related to the commodity structure of plant production in recent decades, as they grow low value-added crops, such as cereals and oilseeds. For the production of these crops, only simple technologies are necessary coupled with low labor costs. Their production often has historical roots and contexts linked to a certain structure of production relationships and further processing infrastructure [
1].
From the data on the magnitude of structural changes in plant production in the period before and after Slovakia’s accession to the European Union (EU), we can deduce that the expansion of grain maize, oilseed rape, and sunflower was not affected by changes in agricultural policy (support for agriculture) [
2]. The most significant structural change recorded for crops on arable land is the decline in the production of bulk fodder, pulses, and potatoes in favor of crops with higher market demand, in particular oilseeds and grain maize.
Crop diversity plays an important role in sustainable agro-ecosystems. EU Common Agricultural Policy (CAP) payments affect crop diversity in agricultural enterprises. There are regional differences in crop diversity in Slovakia. The highest crop diversity is common in the regions with the best soil quality [
3].
Through its instruments, the EU’s Common Agricultural Policy has motivated Slovak farmers since 2004 to reduce livestock production and increase plant production aimed at growing large-scale crops and especially crops focused on renewable energy sources, which ultimately led to other specific impacts and contexts. While gross animal production prevailed in Slovakia until 2007, the situation changed and gross plant production started to prevail in 2008, which was also reflected in the income structure and plant production revenues that began to exceed those from animal production [
4]. According to Chrastinová and Uhrinčaťová [
5], plant production in Slovakia achieves better long-term results than animal production, which is declining due to its low competitiveness related to the economic conditions of production and the lower capital and technological equipment of Slovak farms. This trend of agricultural activities leading to the development of plant production at the expense of animal production has a negative impact on the development and competitiveness of agriculture and food self-sufficiency in Slovakia in meat production. It also negatively influences the insurance of a sufficient base in the form of food sources of plant origin [
6].
Many farmers in Europe currently have difficulty making sufficient income to cover their living expenses, mainly due to the difficult economic context, the declining prices for major agricultural crops, and their high volatility in the agricultural market. Thus, for many, diversification into other non-agricultural activities is a way to stabilize or increase their income. This is also one of the objectives of the European agricultural policy, and its task is to keep farmers in the rural environment [
7].
The aim of this study was to analyze the development of harvested areas, the production and hectare yields of selected crops—cereals, oilseeds and perennial forages— and their food and non-food use in the period from 2004 to 2020. At the level of the districts of Slovakia, we identified spatial differences in selected crop harvesting areas using spatial autocorrelation.
2. Materials and Methods
The initial statistical set consisted of official data from the Statistical Office of the Slovak Republic concerning the basic indicators of plant production for the years from 2004 to 2020. Analytical tools (data analysis module) in the Excel program were applied for statistical evaluation. ArcView was used as a tool for the display, basic spatial analysis, and creation of map outputs when editing geometric elements and attributes, and for the cartographic visualization of results. The data were analyzed at the level of the NUTS 3 (regions) and LAU 1 (districts) of Slovakia.
One of the monitored indicators of plant production was the development of the sales of agricultural products in the period from 2001 to 2020. In the periods 2004–2008, 2009–2013, and 2014–2020, we characterized three indicators using the example of the selected crops (cereals, oilseeds, and perennial forages). These included the size of the harvested area, expressed in hectares; the intensity of plant production, which was expressed using the size of the hectare harvest (tonnes produced from 1 hectare, t/ha); and the total achieved crop production (in tonnes). Cartograms were used for the graphical expressions of the intensity of the studied phenomena at the level of the monitored territorial units. These were intended for the cartographic expression of relative quantitative indicators [
8].
The statistical data set for the mentioned indicators was arranged in regular increasing intervals and the same interval scales were used to express the indicators in the monitored periods of 2004–2008, 2009–2013, and 2014–2020. This effect is important in terms of the cartographic comparison of indicators in the evaluated time intervals. The color gradation in the interval scale corresponded in intensity with the visualized numerical values.
In accordance with the work of Pravda and Kusendová [
9], the diagram method (circular diagrams located in the districts of the Slovak Republic) was used to express the size of the harvested areas. The proportionality rule was observed, which applies to each gradation from the sequence of diagram characters. The approximation approach for finding the most suitable size (scale) of the diagram characters was respected. For the comparative analysis of the examined indicator from a cartographic point of view, the same interval scales were compiled for the monitored years. These indicators were evaluated at the LAU 1 level.
We also applied spatial autocorrelation to identify spatial differences. The identification of clusters of districts with statistically higher or lower levels of collection areas provides an opportunity to focus the research on these areas. At present, spatial analyses of selected agricultural indicators are very often used on a global scale and in application practice [
10,
11,
12,
13,
14].
According to Anselin et. al. [
15], if similar phenomena or attributes are in close vicinity, there is a positive spatial autocorrelation. If there is a grouping of significantly different values, there is a negative spatial autocorrelation. If the data in an area are located such that close values are not related, the analyzed values are statistically insignificant. In our paper, we analyzed the variable using Moran’s index. The following applies to Moran’s Index (1):
The values of Moran’s index (I) range from −1 (perfect variance) to +1 (absolute correlation). The closer the value of I is to 1, the greater the indication of positive spatial autocorrelation. The closer the value of I is to −1, the greater the indication of negative spatial autocorrelation. Different degrees of spatial autocorrelation may be present within the same set. At the same time, both positive and negative autocorrelation can occur in the same data set.
Anselin [
16] divided the aforementioned global spatial autocorrelation test into a series of local indicators called LISA (local indicators of spatial association) for detecting local clusters of positive and negative autocorrelation. Within LISA, five different scenarios can be recorded (high-high, low-low, high-low, low-high, non-significant).
A local version of the Moran’s I criterion was used for the analysis of the detection of specific spatial clusters, evaluating the level of autocorrelation of the spatial statistical quantity between a given point in space and its surroundings. The relevant indicator is suitable for locating units with relevantly high (i.e., above average) or low (i.e., below average) values—so-called positive spatial autocorrelation. A different case, characterized by sudden level breaks in the spatial distribution of the phenomenon, can also occur, called negative spatial autocorrelation. The statistical interference of all three applied indicators (general G-statistics, Moran’s I criterion, and the local Moran’s I) (2)–(4) was based on the calculation of the concept of Z-statistics [
17].
The following analytical tools were used in this study: the basic processing of the statistical data set and its subsequent analysis, methods of thematic cartography, comparative data analysis focused on a year-on-year comparison, the comparison of indicators at the level of Slovak regions (LAU 1 and NUTS 3), spatial autocorrelation, and the deduction and synthesis of the acquired knowledge.
3. Results
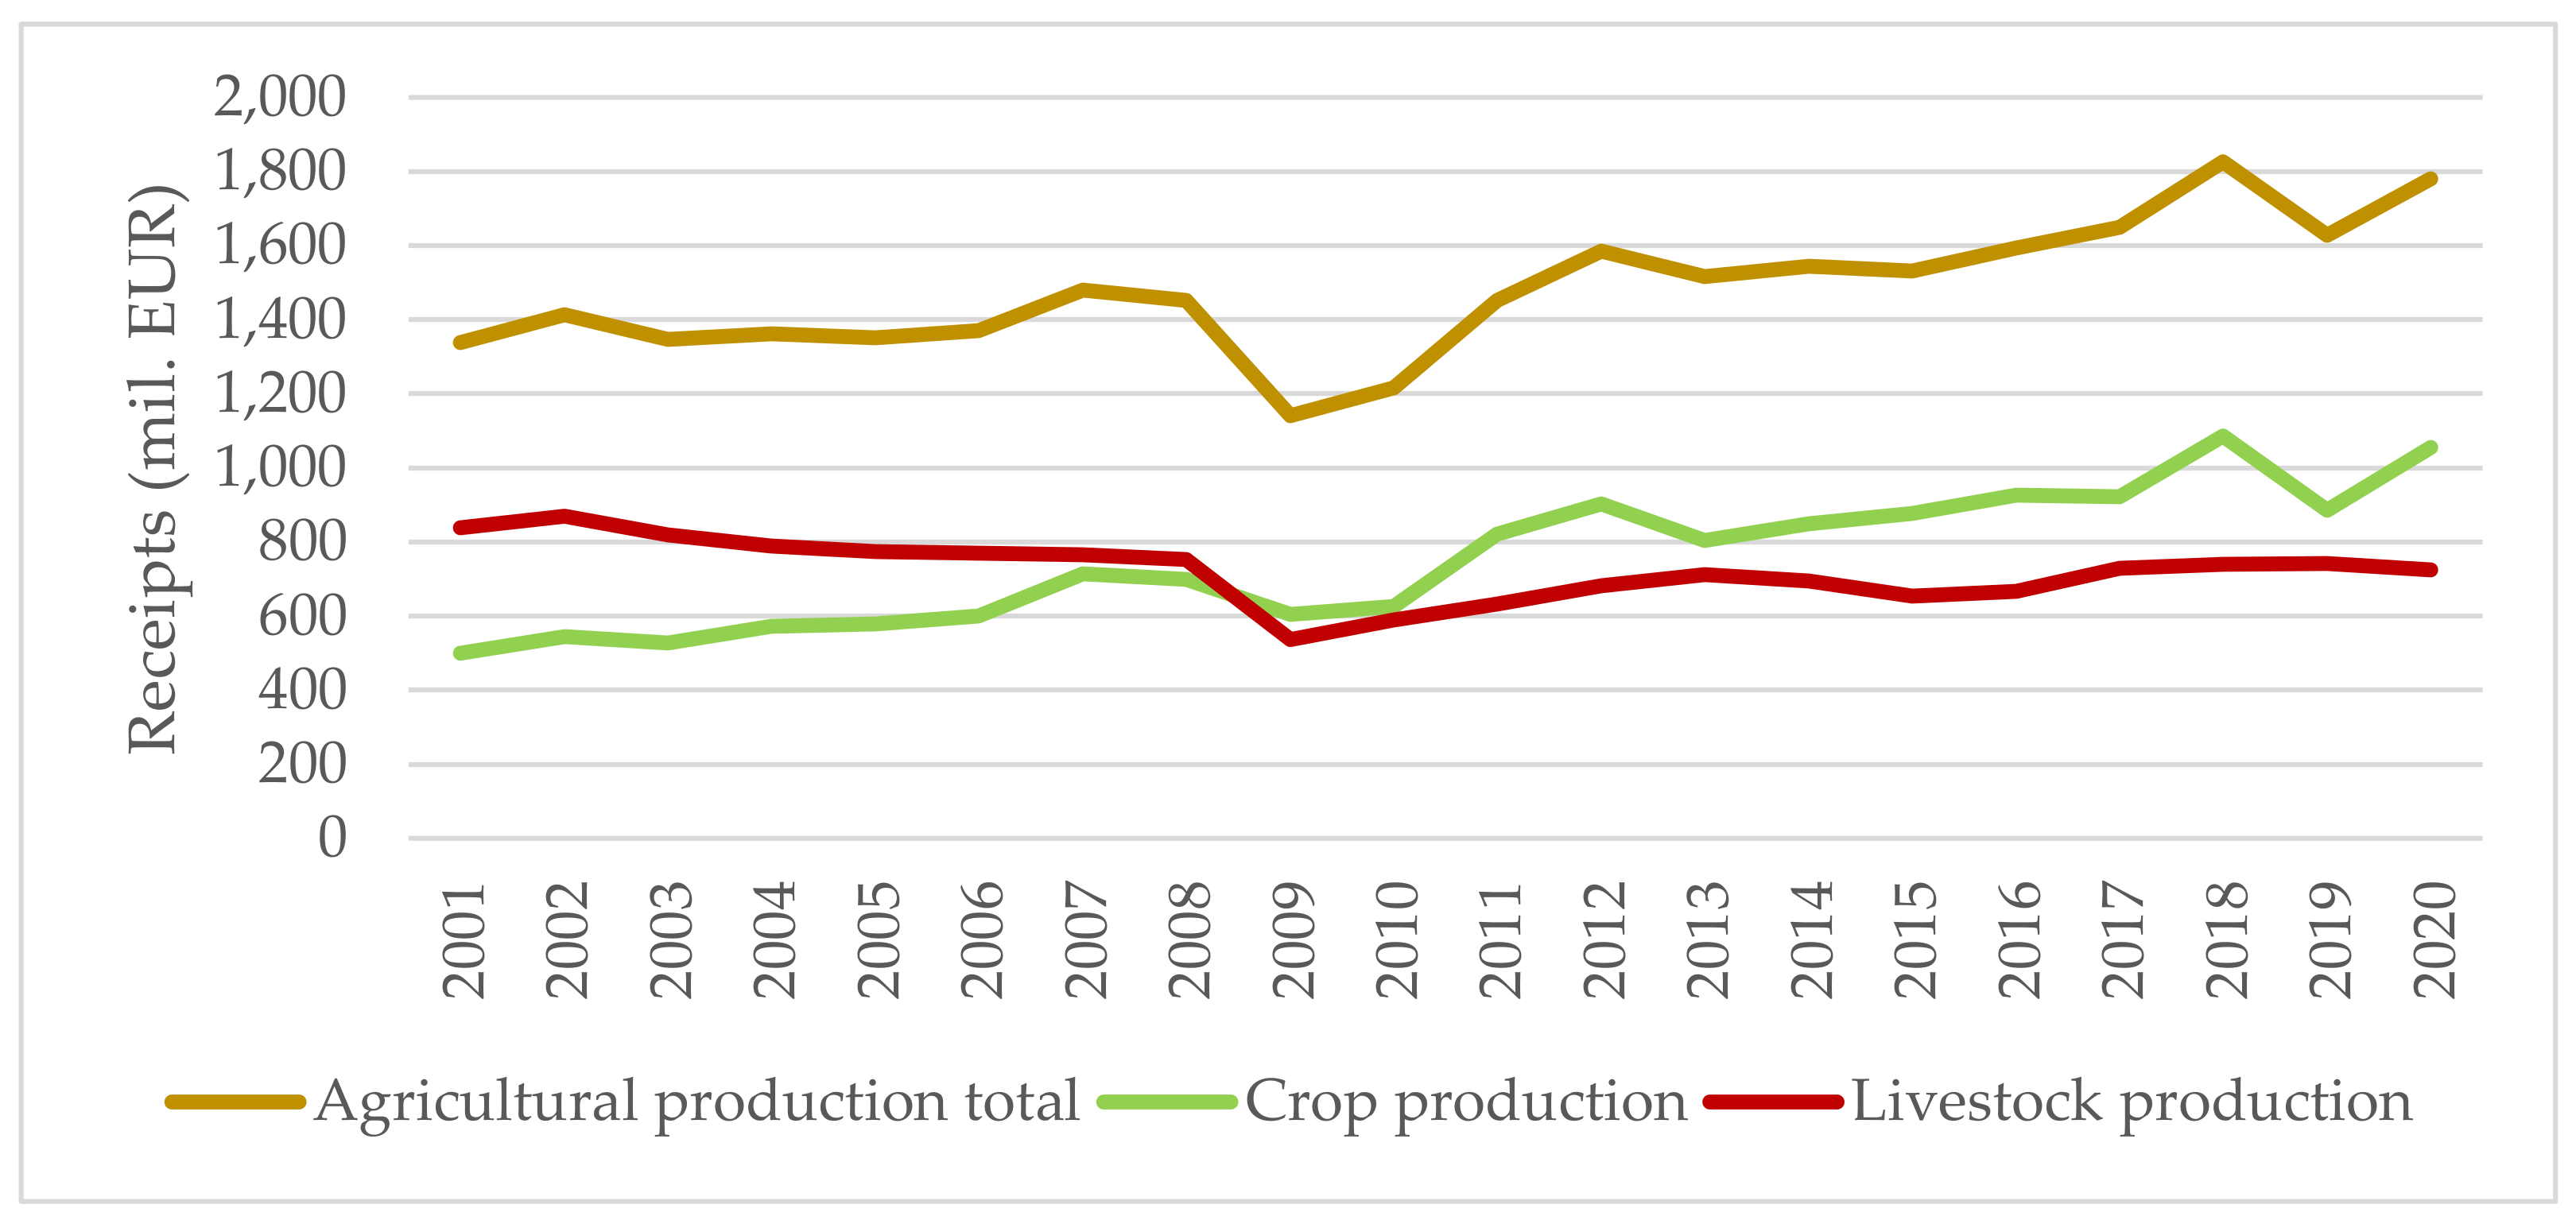
Since 2009, plant production has started to slightly dominate over animal production in Slovakia. Based on the processing and analysis of the input data, in 2004, the share of sales from plant production in the total sales was 42%. As shown in
Figure 1, revenues from animal production prevailed until 2008; however, since 2009, revenues from plant production slightly exceeded those from animal production (53%). The decline in animal production sales has been accompanied by a continuing decline in livestock numbers, especially pigs and cattle, as a result of the sector’s financial under sizing and unprofitability.
In 2020, the indicator expressing the share of sales from plant production in total sales in the Slovak Republic reached a value higher than 55%. Sales from agricultural production reached an average year-on-year increase of 22.1 million EUR. Sales from plant production recorded an average year-on-year increase of 28.7 million EUR and sales from animal production saw an average year-on-year decrease of about 6.6 million EUR [
18]. The highest sales from plant production were achieved by the regions in Podunajská nížina, the regions of Nitra and Trnava, and the Košice Region in the Východoslovenská nížina. These are the regions with the most suitable soil and climatic conditions for growing most of Slovakia’s agricultural crops.
3.1. Growing of Cereals at the Regional Level of Slovakia in the Period of 2004–2020
The important position of the structure of agricultural crop sowing in Slovakia is confirmed by the highest (approximately 60%) share of cereals grown on arable land. Wheat is the most widely grown cereal (more than 50%), with up to 96% of this being winter wheat. Barley accounts for about 17% of total cereals, of which 61% is spring barley. Grain maize together makes up more than 25% of cereals. A total of 5.1% of the share is accounted for by rye, oats, triticale, and other cereals. The acreage of cereals in the Slovak Republic fluctuated during the observed period and was unstable. For the last 17 years, the average harvested area of cereals was 762,800 ha. From 2004 to 2020, the acreage of cereals decreased by 5.6%. The area of cereals has decreased in districts that are not typical for the cultivation of cereals, characterized by smaller areas. These include areas located within higher altitude basins, e.g., Popradská kotlina, or medium-altitude basins, e.g., Zvolenská kotlina. The increase in hectare yields was positive, especially in areas with the largest areas of cereal cultivation and with the most suitable soil and climatic conditions for crop cultivation, including Podunajská nížina, Košická kotlina, Východoslovenská nížina, and Juhoslovenská kotlina. At the level of Slovakia, the average cereal yield per hectare was 4.78 t/ha (2004: 4.65 t/ha; 2020: 5.34 t/ha). The spatial differences in cereal cultivation at the regional level of Slovakia in the monitored periods of the years 2004–2008, 2009–2013, 2014–2020, and 2004–2020 are shown in
Figure 2.
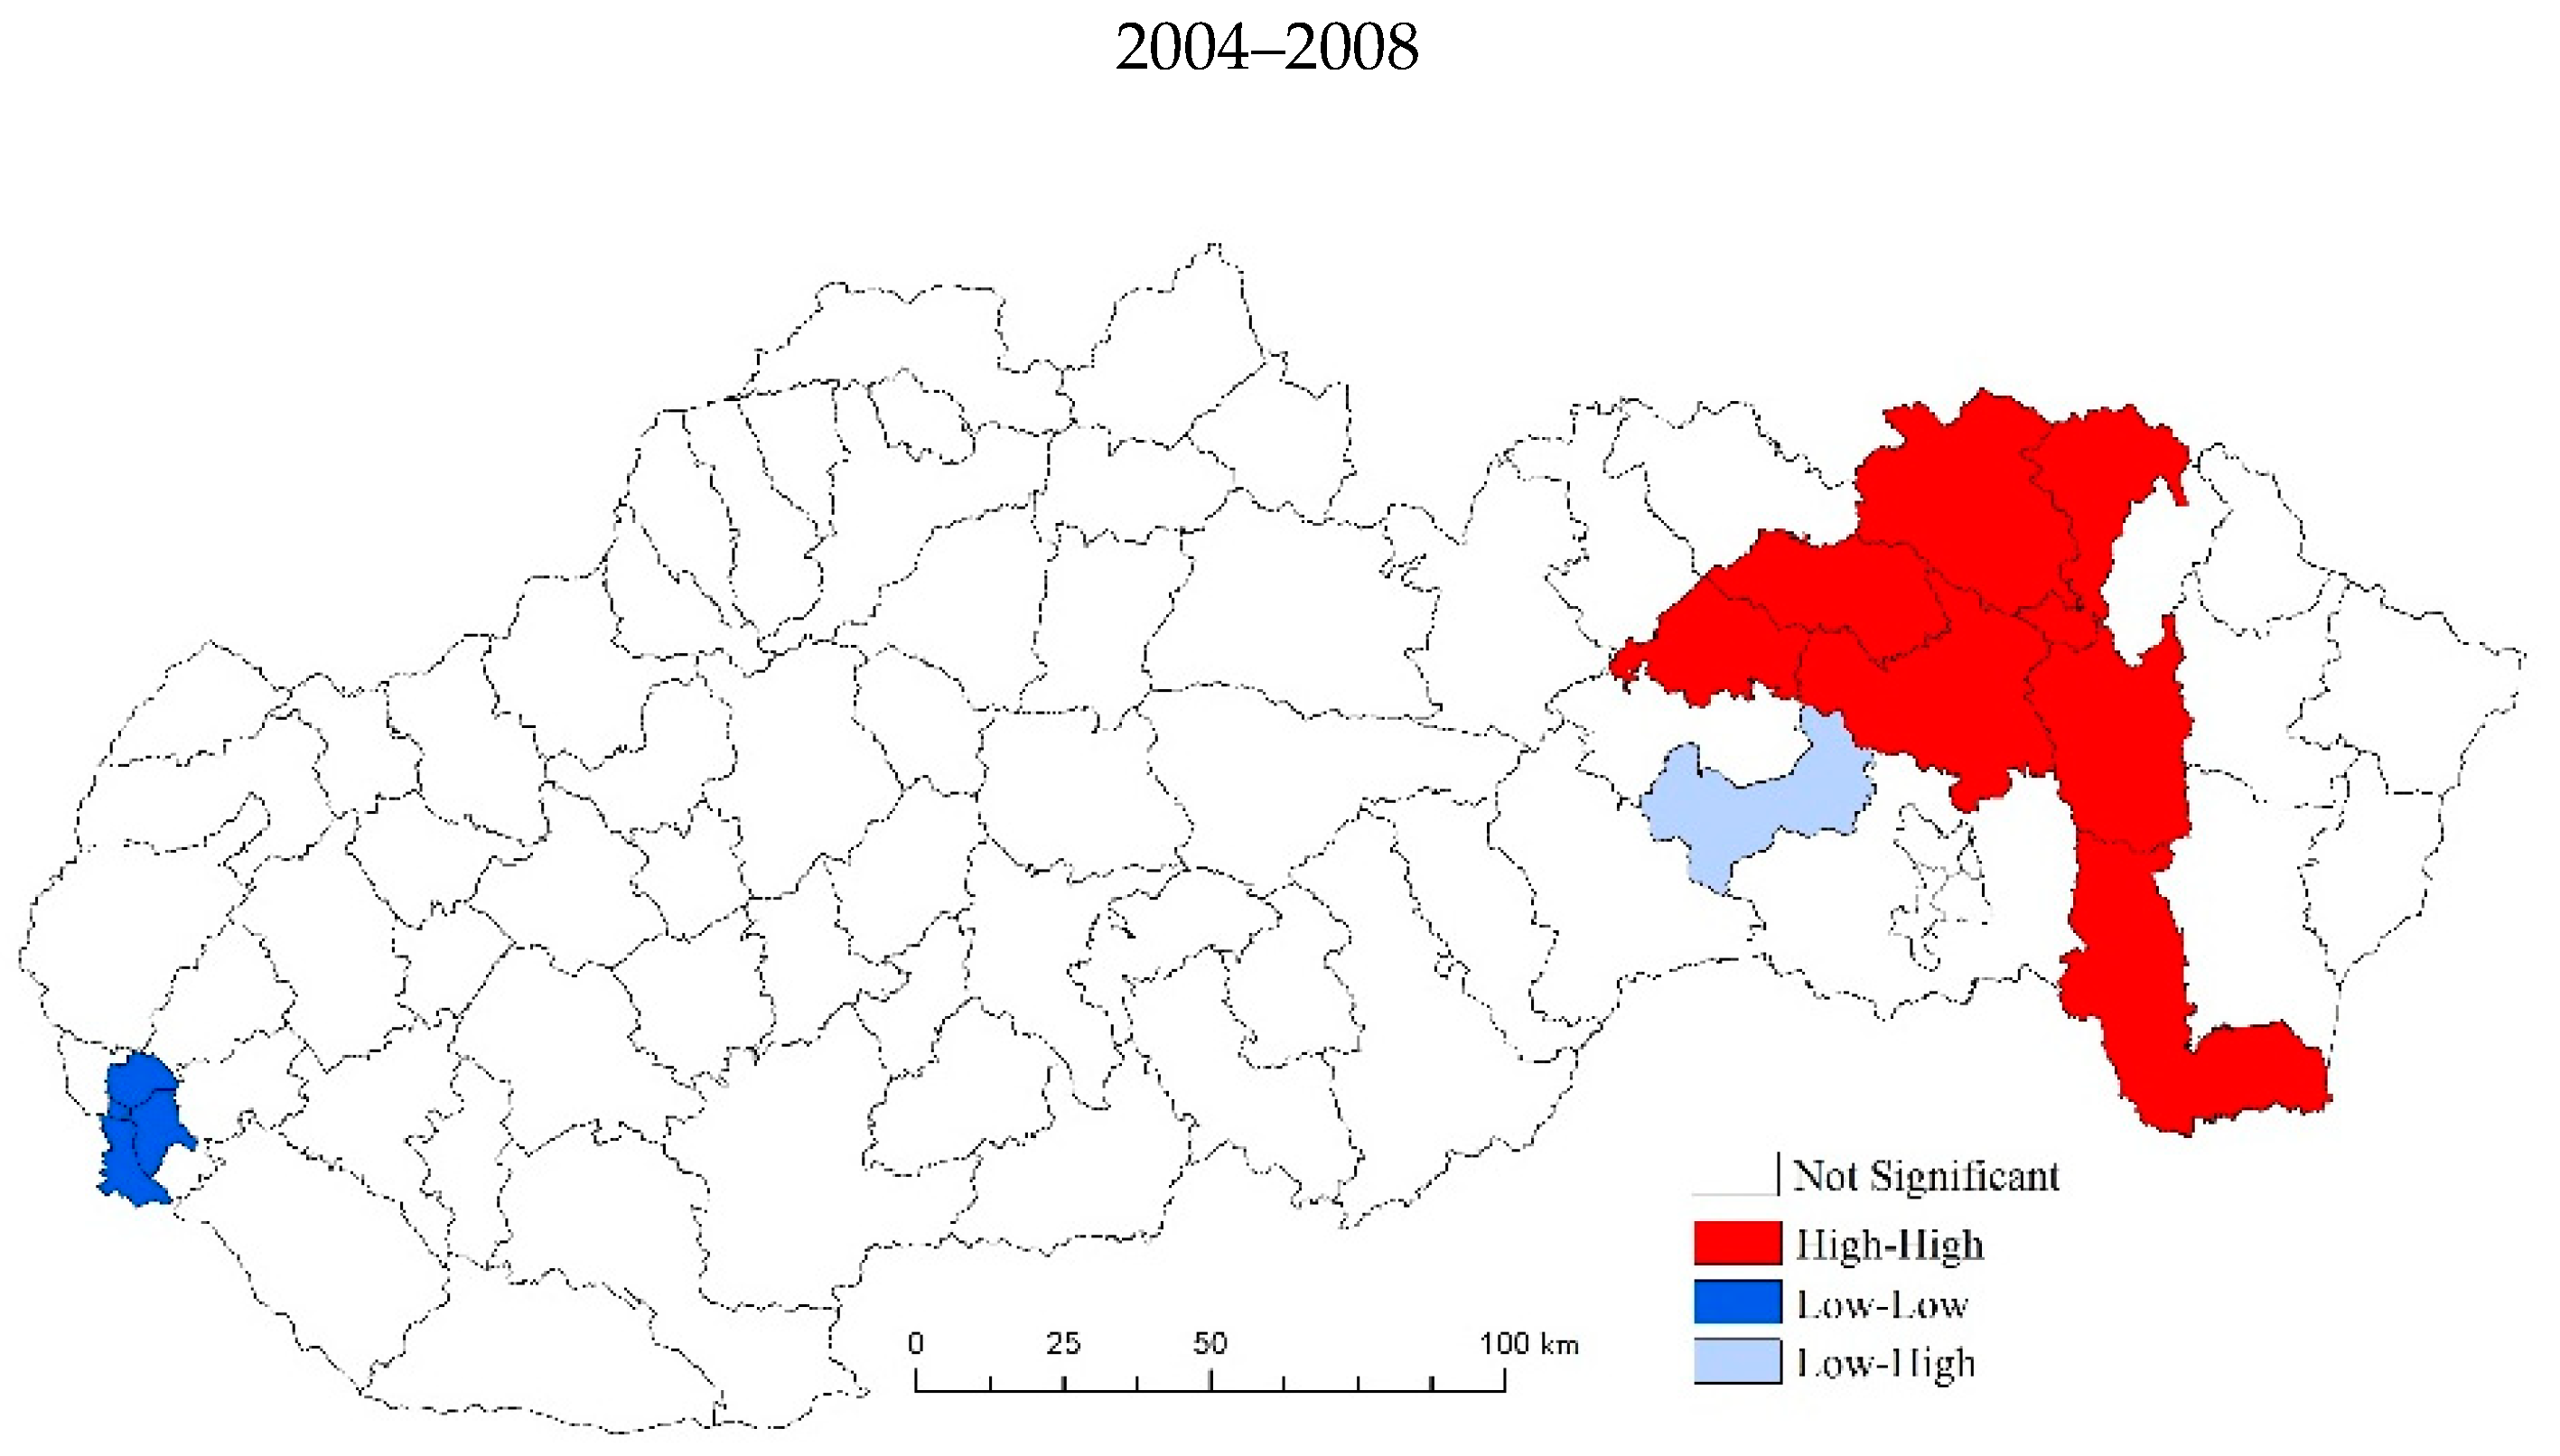
The use of spatial reference data on cereal harvesting areas in the districts of Slovakia offers an understanding of spatial–analytical links in this area of interest. The method of spatial autocorrelation allows us to define clusters of regions from the monitored indicator point of view. When evaluating the spatial autocorrelation of the monitored indicator in the period of 2004–2020, we identified localities with different intensity. When evaluating the developmental changes in the acreage of cereal harvesting areas by spatial autocorrelation in the monitored years (2004–2008, 2009–2013, 2014–2020, and 2004–2020), we observed only minimal differences. The highest values of harvesting areas were achieved in the given periods in the regions of the Podunajská nížina Nitra and Trnava. These were the areas of the largest cereal cultivation. In the regions in the north of Slovakia, low acreage areas were achieved due to less suitable natural conditions for cultivation. In our research, this manifested itself in the form of positive spatial autocorrelation. The analysis identified nine districts mainly in the southwestern part of Slovakia (Dunajská Streda, Komárno, Nové Zámky, Levice, Nitra, Šaľa, Trnava, and Hlohovec), which we included in the high-high quadrant (
Figure 3). The Moran’s diagram for the period of 2004–2020 for the monitored indicator showed a value of 0.528025, which indicated a slightly positive spatial autocorrelation (
Figure 4). The given value indicated the clustering of similar values of the indicator (high with high and low with low). The second region that showed positive spatial autocorrelation (low-low) was identified in the northern part of Slovakia. As with the previous cluster, nine districts belonged to the given cluster (Liptovský Mikuláš, Ružomberok, Dolný Kubín, Námestovo, Čadca, Žilina, Martin, Bytča, and Považská Bystrica). The district of Bratislava I also joined this group of districts. As mentioned, the global Moran’s index does not in itself reveal the different degrees of spatial relations within one set.
In addition to the yield per hectare, an important indicator of crop productivity is the total yield or crop production in a given year. The average value of cereal production in the years 2004–2020 reached a value of 3641,900 tonnes; between 2004 and 2020, the production increased by 8.2%, despite the decrease in harvest areas. The highest cereal production was achieved in the Nitra and Trnava regions located in western Slovakia in Podunajská nížina, with thriving cereal production also in the southeast of Slovakia in the Košice Region of Východoslovenská nížina. Due to deteriorating natural and market conditions, Slovakia’s agricultural enterprises are beginning to diversify their production in order to improve their income. The long-term intention of the CAP is to support the diversification of agricultural production. Farmers are starting to focus more on non-agricultural activities, such as investments in production and sales facilities, investments in recreational and accommodation facilities, and investments in renewable resources. Data from the situation and prospective reports show that in recent years, there has been an increasing interest among crop growers to use crops in the bio energy sector. In the agricultural year of 2003/2004, a total of 2757,100 tonnes of cereals were consumed in Slovakia (food consumption accounted for 42.8%, seeds for 7.0%, fodder for 44.6%, and others for 5.6%) [
19]. The ‘other’ consumption of cereals increased every year, mainly in connection with the production of biofuels (e.g., bio ethanol, especially from grain maize). Therefore, the situation in the cereal records for the agricultural year of 2019/2020 is different from that in 2003/2004. In 2019/2020, the domestic consumption of cereals amounted to 2687,300 tonnes (food consumption: 40.1%; seeds: 6.1%; fodder: 35.5%; others: 18.4%) [
20].
3.2. Growing of Oilseed at the Regional Level of Slovakia in the Period of 2004–2020
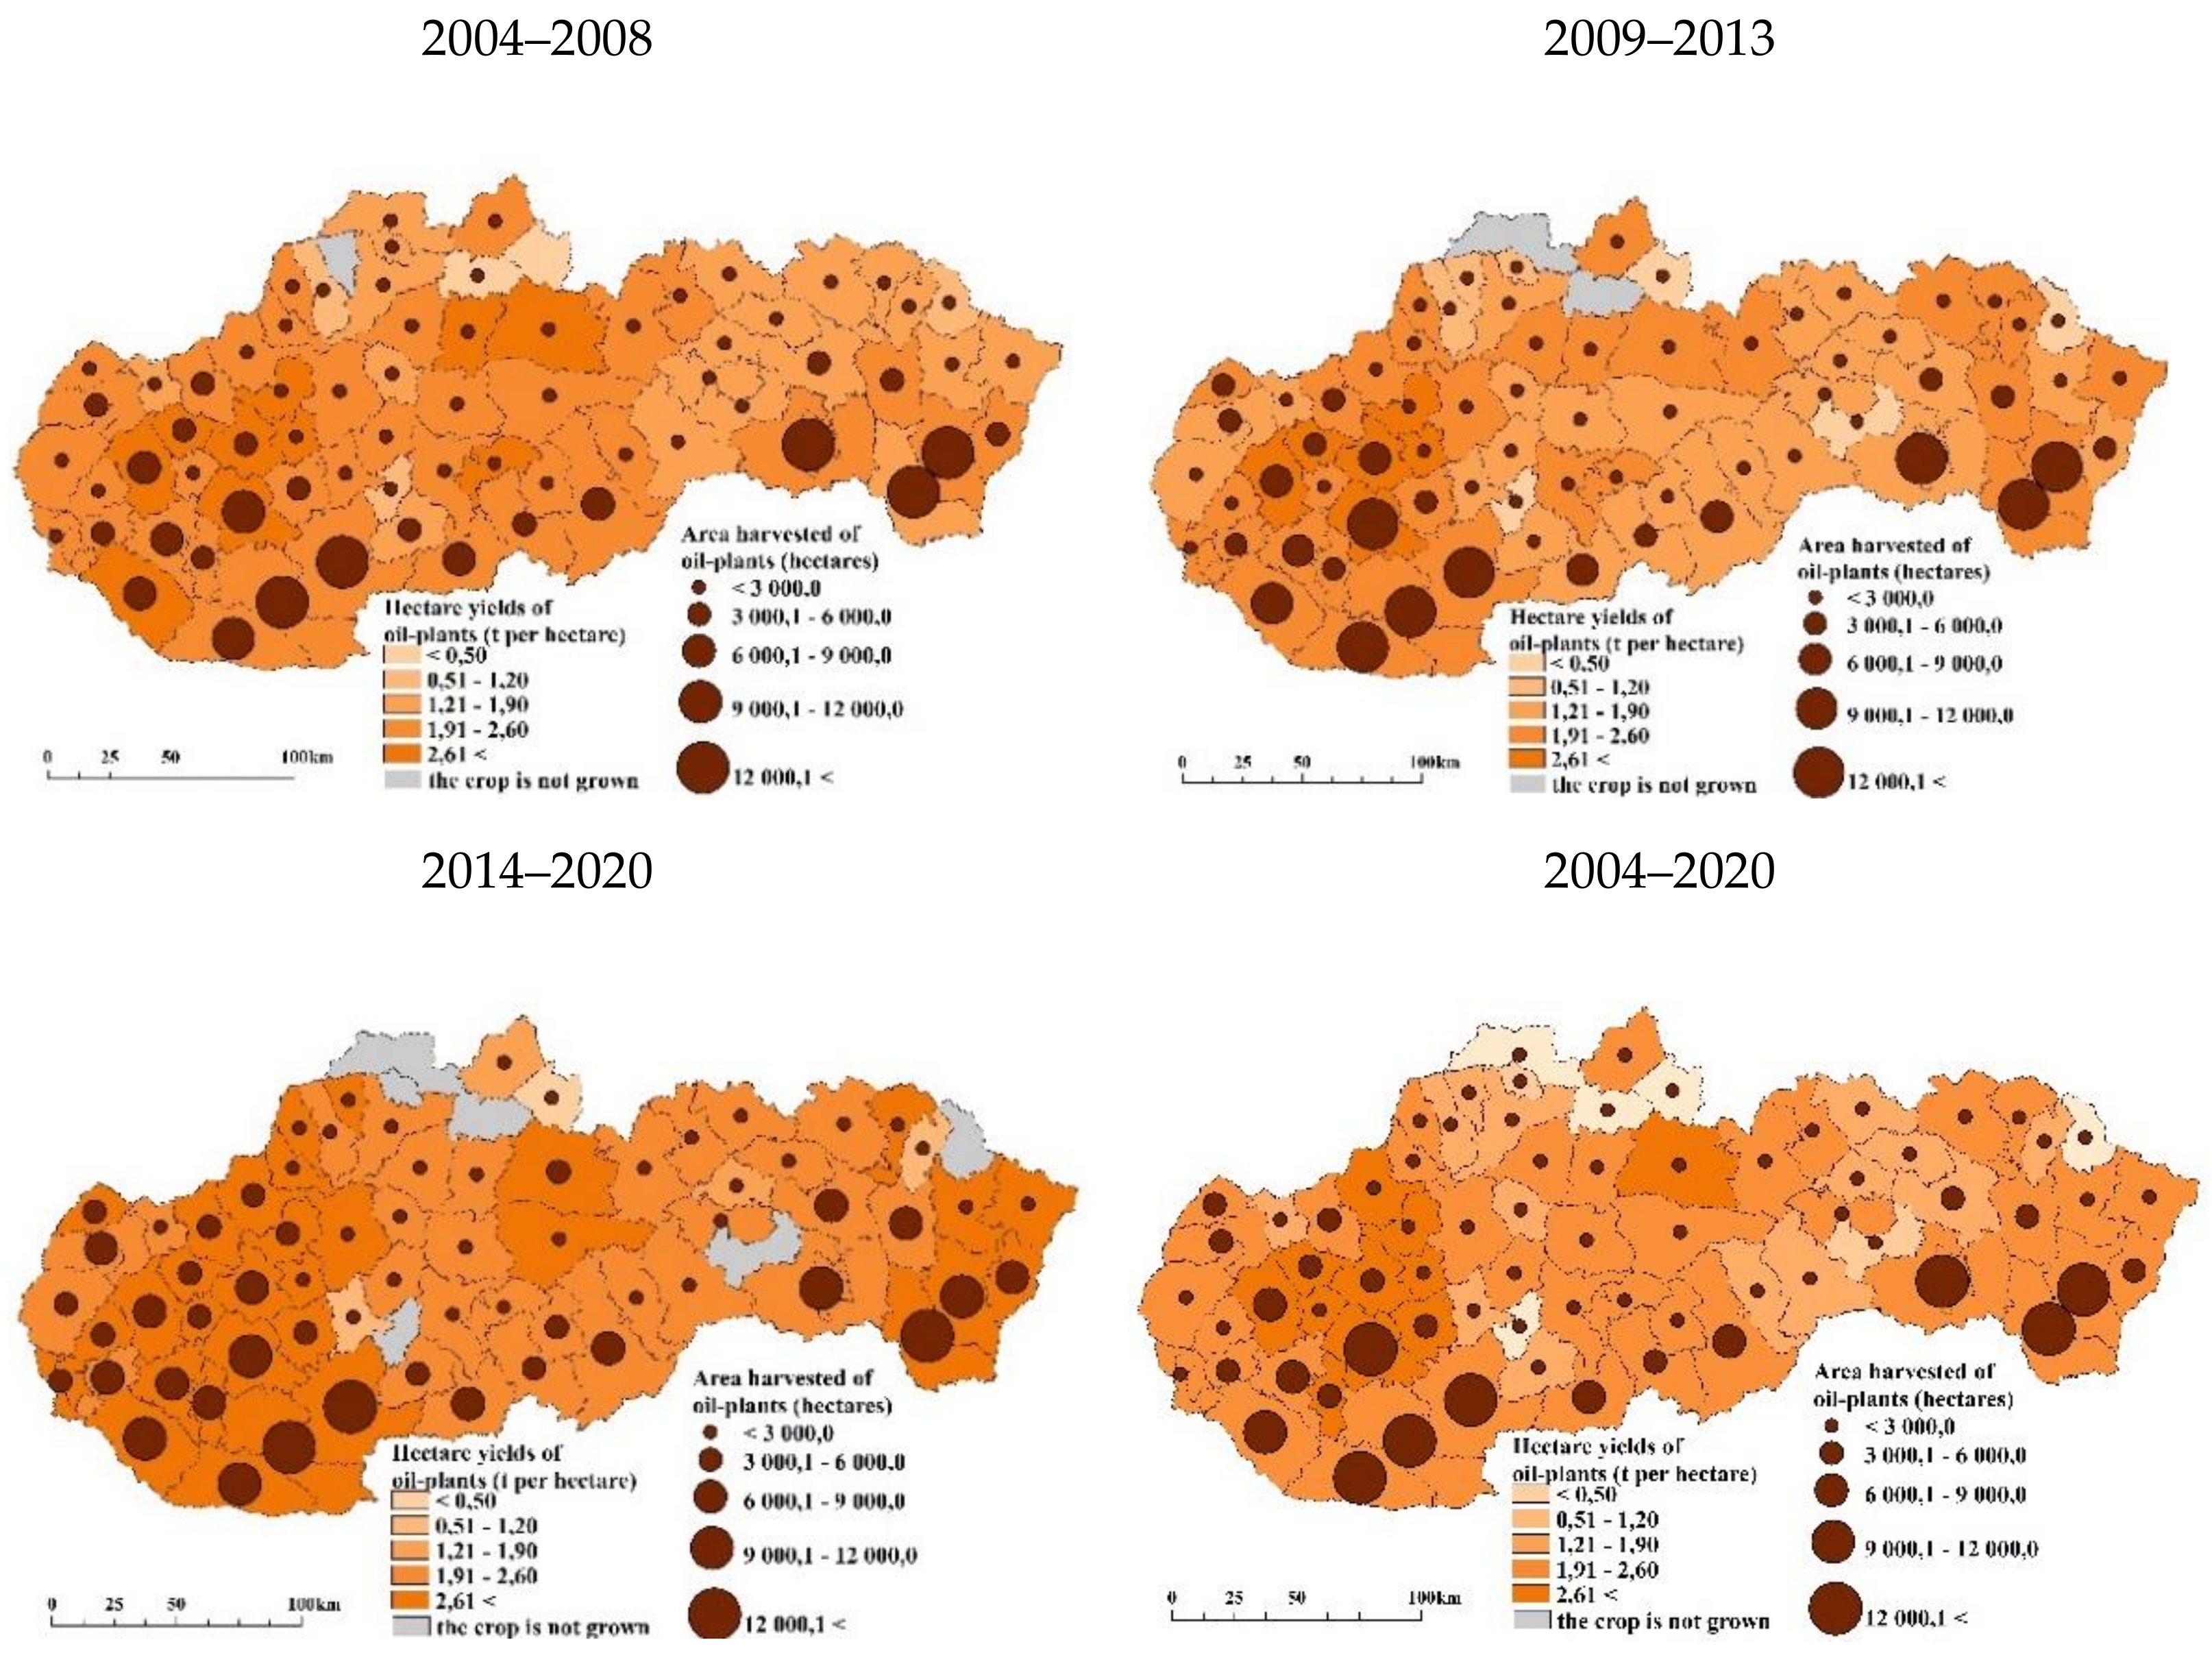
Oilseed is the crop with the second most important share in the sowing structure of agricultural crops in Slovakia (a roughly 20% share). The area of oilseeds in the Slovak Republic has stabilized in recent years and is increasing slightly. Oilseeds have become the fastest growing crop (i.e., growth of harvested areas and production) in Slovakia. Compared to 2004, in 2020 the harvesting areas increased by more than 30%. The harvesting areas increased the most in the districts with the largest oilseed cultivation in Podunajská nížina. The cultivation of oilseeds is gradually moving to the basins in higher altitudes, especially Liptovská kotlina and to lower altitudes, such as Považské podolie (
Figure 5). There are districts in which oilseed cultivation has decreased in recent years due to the colder climate—this includes the regions of Orava (northern Slovakia) Dolný Kubín, Čadca, and Kysucké Nové Mesto, or in eastern Slovakia in the districts of Gelnica and Medzilaborce. For the period of 2004–2020, the average area under cultivation was 248,600 ha. Hectare oilseed yields had a fluctuating course in the years 2004–2020. They ranged from the lowest value of 1.88 t/ha in 2010 to the highest of 3.07 t/ha in 2016. The hectare yields showed a growing trend, as evidenced by their increase of 10% in 2020 compared to 2004. The average hectare yield of oilseeds in the period 2004–2020 reached a value of 2.61 t/ha (2004: 2.43 t/ha; 2020: 2.64 t/ha). Hectare yields increased the most in the southwestern part of Slovakia in Podunajská nížina, in Hornonitrianska kotlina, in Považské podolie, and in the southeast of Slovakia in Východoslovenská nížina. Hectare yields also increased in the areas of colder basins, such as Liptovská kotlina and Horehronské podolie.
In the study of the dependence of the spatial occurrence of the harvesting area indicator, using local Moran’s statistics, at the level of the districts of Slovakia in the monitored area and the period of 2004–2020, only positive spatial autocorrelation was recorded in some areas. According to Anselina et al. [
15], positive spatial autocorrelation means that geographically close values of the variable (harvesting areas) tend to cluster with similar values of the variable on the map. This means that high values are usually located near high values, medium values near medium values, and low values near low values. For oilseeds, the spatial autocorrelation showed minimal changes in the observed periods of 2004–2008, 2009–2013, 2014–2020, and 2004–2020. This is related to the fact that the cultivation of oilseeds was concentrated in the southern regions of Slovakia with favorable natural conditions for cultivation (higher crop areas were achieved there). In the north of Slovakia, due to less suitable natural conditions, the crop is grown less or ceases to be cultivated. The first high-high cluster in this period (2004–2020) was located in the south-western part of Slovakia in a region consisting of nine districts. The districts of Vranov nad Topľou and Trebišov were added to this group of districts in the east (
Figure 6). Another indication of positive spatial autocorrelation was the cluster of districts in the northern part of Slovakia. In addition to these districts, this indication was observed in the districts of Žiar nad Hronom and Bratislava I. The index of the indicator from the Moran’s diagram for these years reached a value in the range of 0.423177–0.449083 (
Figure 7).
The increase in oilseed harvesting areas was also related to an increase in production, which increased by up to 40% between 2004 and 2020. Since 2016, the volume of oilseed production has reached more than 770,000 tonnes and is still increasing. From the point of view of species representation, oilseed rape has the largest share of more than 60%, and it suppresses the cultivation of other oilseeds. A share of about 30% is attributed to sunflower production and 10% to soybean and poppy production. The average production of oilseeds for the period 2004–2020 reached a value of 600,400 tonnes (an increase of more than 40%). From the regional point of view, the warm lowlands of Podunajská nížina with the Nitra and Trnava regions and Východoslovenská nížina with the Košice Region are important for the production of oilseeds. The main oilseed crop grown in Slovakia is therefore oilseed rape, with its average share on arable land in 2004–2020 accounting for 10–12%. In Slovakia, however, there is a lack of processing capacity for oilseeds; therefore, part of the production of oilseeds is exported for processing abroad. A significant part of rapeseed production has shifted from food use in recent years to industrial use—the production of rapeseed oil methyl ester (RME). In the agricultural year of 2002/2003, the domestic consumption of oilseed rape amounted to 175,000 tonnes (food consumption: 93.1%; other consumption (RME production, pharmaceutical, and fodder consumption): 6.9%) [
21]. In the agricultural year of 2019/2020, 239,100 tonnes of rapeseed were consumed in the Slovak Republic. Of this, 6.3% were used for food consumption and 93.7% for other consumption (RME production, pharmaceutical, and fodder) [
22].
3.3. Growing of Perennial Forages at the Regional Level of Slovakia in the Period of 2004–2020
The share of perennial forages in the sowing structure is not high (about 10%) and is slightly decreasing, because the sowing structure in Slovakia has long been influenced by the preference of crops for industrial use, and less for food and fodder. The decline of the harvesting areas of perennial forages is caused not only by the decrease in arable land areas (in the period of 2004–2020, arable land decreased by more than 25,000 ha and agricultural land decreased by about 60,000 ha), but especially the overall decline in animal production in Slovakia, which began in the first half of the 1990s and persists to this day. The number of pigs decreased by almost 50% and that of cattle by 20%. Perennial forages are important not only when considering livestock fodder, but they also act as an important crop for increasing soil fertility and quality. In recent years, they have been used to produce biogas in biogas plants. Farming without animal production is becoming a specific feature of Slovakia. This management system is not optimal for agricultural production because it creates greater demands for maintaining soil fertility. It is therefore necessary to supply organic matter to the soil, e.g., by sowing catch crops, which are plowed-in when in their green state. A lack of organic matter in the soil causes lower crop yields. Despite a slight 7.1% increase in perennial forage harvesting areas in 2020 compared to 2004, their area has not stabilized. Lanterns and clover are mainly grown. The largest growing areas are in the eastern part of Slovakia, in Východoslovenská nížina, in Košická kotlina, in the southern part of Slovakia in Rimavská and Rožňavská kotlina, in the western part in Záhorská nížina and in the northern part of Slovakia, e.g., Oravská kotlina. The area of perennial fodder cultivation decreased especially in the districts in Podunajská nížina, due to the reduction in the number of livestock in these districts (
Figure 8). On average, perennial forages are grown in Slovakia on an area of 144,200 ha. With the current number of about 440,000 cattle, the fodder base is sufficient. Perennial forage can also be used in the so-called greening of a landscape, the creation of buffer zones, and the cultivation of catch crops, and may also have an anti-erosion function. Hectare yields of perennial forages in 2020 decreased by about 70% compared to 2004. Higher hectare yields were achieved in the western part of Slovakia; however, in recent years (2014–2020), hectare yields have declined there as well. In other parts of Slovakia, lower yields per 1 hectare were recorded. The highest hectare yield was achieved in 2004 (5.92 t/ha) and the lowest in the interval of 3–4 t/ha in 2011, 2012, and 2017. On average, over the observed period, the hectare yields of perennial forages reached a value of 4.48 t/ha, with the same value recorded in 2020.
As our previous analyses have shown, in the case of perennial forages in the period of 2004–2020, we observed an indication of a positive spatial autocorrelation. The majority of the districts in the established clusters were located in the eastern part of Slovakia. The high-high cluster with the Trebišov, Vranov nad Topľou, Prešov, Stará Ľubovňa, Bardejov, Svidník, Sabinov, Levoča, and Gelnica districts was characterized by positive spatial autocorrelation (
Figure 9). A region characterized by a low-low quadrant was identified in the districts of Bratislava I-V. The Moran’s index values reached a range of 0.189207–0.19804 (
Figure 10). The data were randomly distributed.
The production of perennial forages fell by around 19% between 2004 and 2020, despite the slight increase in harvest areas. The decline in production was mainly related to the regions of western Slovakia (Nitra and Trnava). The average production of perennial forages in the analyzed years was 640.2 tonnes. Its volume fluctuated in individual years depending on the achieved average yield of 1 hectare and the area available for cultivation. Higher production was achieved mainly by mountainous regions in the eastern part (Prešov Region), the central part (Banská Bystrica Region), and the northern part (Žilina Region) of Slovakia.
The planned increase in the number of cattle may have a significant impact on the overall structure of plant production in Slovakia. In the case of bulk fodder, their higher consumption would be saturated by increasing the acreage of perennial forage grown on arable land. Increasing the acreage of permanent grassland as an additional bulk fodder is quite expensive and unprofitable. Permanent grasslands represent a certain reserve of bulk fodder while further raising livestock numbers. In Slovakia, permanent grasslands represent about 36% of agricultural land. With the current low number of cattle, permanent grassland can also be used for energy purposes. The alternative use of phytomass from permanent grasslands for bioenergetic purposes positively contributes to the sustainable condition of the permanent grassland, which contributes to the conservation of biodiversity in the country and to the support of non-productive functions of agriculture. The EU CAP includes greening measures to protect permanent grassland, as these crops are severely affected by agricultural intensification [
23].
4. Discussion
With a growing world population, the chances of the further intensification of agriculture increase, while the size of agricultural land on which such activities are possible decreases. Diversification is one of the possibilities for agricultural and rural development [
24]. According to Hadelan et al. [
25], diversification is more widespread in countries with more advanced agriculture. Agricultural enterprises in Slovakia are beginning to focus more on non-agricultural activities, such as the production of biofuels. The European Union aims to increase the share of renewable energy sources in total energy production in the EU. All these circumstances are incentives to develop energy production from biomass. Several experts, including Krasuska et al. [
26], fear that EU countries will not be able to generate the biomass needed to meet EU targets without compromising national food security.
Renewable energy sources have less of a negative effect on the environment when compared to nuclear and fossil resources. Thus, they represent an ecological benefit for the country [
27,
28,
29,
30,
31]. On the other hand, there is a hidden risk factor in the form of changes in the commodity structure of plant production within the agro sector. These changes may appear positive externally, but they essentially pose a threat to the production base for the food industry or the saturation of the country’s food security requirements and needs. This also sets a dangerous precedent of dependence on the availability of basic food in society [
6]. The main disadvantage of first-generation biofuels (maize, sugar beet cereals, oilseeds, etc.) is that the raw materials used to produce these biofuels use quality agricultural land; thus, they compete with food and fodder [
32]. An important source of biomass also comes from fodder obtained extensively from permanent grassland or intensively from perennial forages on arable land. Jezierska-Thole et al. [
33] emphasized the importance of fast-growing annual and perennial energy plants in the production of biomass for energy purposes. Less productive land is used to grow these crops; however, their potential is used to a smaller extent.
Lignocellulosic biomass (a second-generation fuel) has attracted great interest in energy production in recent years due to its renewable and carbon-neutral nature [
34]. Lignocellulosic resources include wood, leaves, bark, straw, grass, and especially material that has no other commercial use; thus, it does not compete with food production, unlike the first-generation biofuels, which is a great advantage. However, similar to first-generation biofuels, they can compete with food production if crops intended for the production of biofuels are grown on soils suitable for food purposes [
35]. The most productive lands are primarily used for crop production for food purposes. Other authors have investigated whether biomass can be used as an energy source in a sustainable way. Growing energy crops as a source of biomass is thought to increase biodiversity and the sources of income for farmers [
36]. The importance of energy crops in Poland, spatial diversification, and support from EU CAP funds have been analyzed by Kołodziejczak and Rudnicki [
37]. Biomass has considerable potential in Slovakia and can create the right path towards the future economic diversification of regions and lower energy dependence, which would support the socio-economic development of rural areas [
38].
Slovakia, as well as other EU countries, has adopted new rules for the use of fertilizers that meet the requirements and standards of high quality and safety across the EU. Since different contaminants in products intended for fertilization may pose a risk to human, animal, and plant health, and also to food safety or the environment, the content of such pollutants has been limited according to the new rules in Slovakia. Agricultural production uses safer fertilizers and farmers are more environmentally friendly. According to Vanoppen et al. [
39], the growing interest of farmers in the environment is a key factor in climate change and the reduction in biodiversity in the agricultural country. Aligning agricultural production with environmental protection and biodiversity protection is one of humanity’s greatest challenges and will only increase as global environmental changes accelerate and the growing human population requires more food [
40,
41,
42,
43].
In recent years, crops such as oilseed, especially oilseed rape and grain maize, have been grown on arable land in Slovakia. These crops are characterized by an increased demand from processors. They are not demanding on human labor and are grown in large areas. These crops are an important source of biomass for biogas plants. Therefore, their share in the sowing structure of plant production in Slovakia is growing. In addition, according to Wozniak et al. [
44], oilseed rape is one of the most popular cultivated oilseeds in Europe, reaching more than 60% of European production.
Based on analyses and officially presented documents that focus on the further course of the agricultural sector in Slovakia, in addition to the preferred crops (especially oilseeds and grain maize), the production of special plants should also be supported in the coming years, i.e., fruit production, grapes, vegetables, potatoes, and legumes. Such state support would not only increase biodiversity in the country, but it would also contribute to an increase in employment in rural regions of Slovakia, the state would be more self-sufficient in the food economy, and it would increase the share of Slovak food in retail chains. Crop diversity has a significant impact on crop production [
45]. EU CAP has a positive impact on crop growers’ decisions regarding crop diversity [
46].
In Slovakia, there are two trends present. First is the trend of the continuing increase in the share of plant production over animal production. The second trend is the growth of food imports. This is due to the fact that support for the domestic agricultural and food sectors has long lagged behind the support in most EU countries. The level of co-financing of food production is not the same in all EU countries. It is higher in the old EU member states and reaches less than 50% in the new member states. At present, Slovakia is about 40% food self-sufficient. It is necessary to increase the level of self-sufficiency in Slovakia through the cultivation of crops and the production of products in which Slovakia has already been self-sufficient in the past, e.g., in the cultivation of potatoes or fruit [
6]. Compared to other EU countries, Slovakia’s food self-sufficiency is at a very low level and is still declining. Slovakia ranks as the sixth worst in the EU in terms of food self-sufficiency. Of the EU-13 countries, only Polish agriculture has achieved a volume of agricultural production comparable to that of the EU-15 countries [
47].
The cause of this problem is found in the mechanism for financial support for direct payments under the EU CAP, the main instrument for promoting the convergence of member states’ agricultural sectors and rural sustainability. Volkov et al. [
48] saw a problem in the system of direct payments, where more financial resources are allocated to the already developed agricultural sectors of the older member states than to the less developed sectors in the new member states, thus widening the gap between member states.
5. Conclusions
Although Slovakia has sufficient natural potential to produce materials for the food industry and to ensure the food self-sufficiency of its population, it is becoming a producer of only basic agricultural raw materials, such as cereals, oilseeds, and bulk fodder. In the monitored period from 2004 to 2020, cereal production increased slightly by 8.2%. In the case of oilseeds, production increased by up to 40% and perennial forage production fell by 19%. It is positive that the hectare yields of cereals and oilseeds have increased; however, the yield per hectare of perennial forage has fallen. Due to a lack of processing capacity in Slovakia (the existing processors are used insufficiently and inefficiently), the materials of plant production must be exported for processing abroad and the finished products with higher added value are imported, the price of which is significantly more. Slovakia’s membership in the EU provides an open market, freedom of movement, and the import of food and other products. However, during the COVID-19 pandemic, each member state was trying to take care of its own people first. It is for this reason that Slovakia’s strategic interest as an EU member state should be food self-sufficiency and food security. The pandemic has shown that it is necessary to increase the cultivation of several crops in the structure of crop production in which Slovakia is no longer self-sufficient, mainly the cultivation of crops with higher added value. It is necessary to ensure sufficient food production, so as not to endanger the food security of the state in crisis situations in the Slovak Republic. Thus, it has been proven necessary to provide more financial support to this sector.
The results of our study showed an increased interest of farmers in using cultivated crops for industrial purposes. This was influenced by increased market demand. In the observed period of 2004–2020, the consumption of cereals for fodder purposes decreased by about 10%, which was related to the overall decline in animal production. Other consumption of cereals increased from 5.6% to 18.4%, as a result of their usage for bio ethanol production. A similar situation occurred for the consumption of oilseeds, where the food consumption of oilseed rape decreased between 2004 and 2020 and its consumption for the production of rapeseed oil methyl ester increased. This accounts for more than 90% of the total oilseed consumption.
Bioenergy development and climate change are the main factors that may affect crop/plant production in the future. The share of oil and maze cultivation on arable land will increase, bringing several benefits, including stable sources of income for farmers, but also risks, such as endangering the food self-sufficiency of the population and endangering the production base for the food industry. Another factor is the state’s increased financial support for the production of special crops, which can increase the food self-sufficiency of the state, ensure the greater diversification of crop production, increase biodiversity in the country, and promote employment. The future development of crop production may also be affected by an increased consumer demand for organic products and local production. Slovakia should also export more finished products in crop production, not just raw materials (there is an economic profit from the processing of raw materials), and produce more products with higher added value, finalizing crop production. It is necessary to ensure an effective link between agriculture and food. These are the main factors that may affect the future of crop production in Slovakia.
As our study showed, plant production is dominant compared to animal production in Slovakia. Such a course of agriculture has a negative impact on the development and competitiveness of agriculture and the food self-sufficiency of Slovakia. These changes in the sectoral structure of agriculture in Slovakia should be followed and the further development of agriculture needs to be monitored. It is also necessary to monitor the share and impact of plant production on total agricultural production, the landscape, the quality of the environment, and the sustainable development of agriculture. We also need to systematically monitor the share of plant production for food and non-food purposes in the context of the saturation of the food security requirements of the state. This is a global problem that affects several countries of the European Union, and diversification is a possible solution to this problem; therefore, its importance in the agricultural sector is currently growing.


