Article

Regional Disparities and Influencing Factors of Eco-Efficiency of Arable Land Utilization in China

1
College of Public Administration, Huazhong University of Science and Technology, Wuhan 430074, China
2
School of Public Administration, China University of Geosciences, Wuhan 430074, China
3
School of Public Administration, Central China Normal University, Wuhan 430079, China
*
Author to whom correspondence should be addressed.
Land 2022, 11(2), 257; https://doi.org/10.3390/land11020257
Submission received: 13 December 2021 / Revised: 2 February 2022 / Accepted: 5 February 2022 / Published: 8 February 2022

Abstract

:
Eco-efficiency of arable land utilization (EALU) emphasizes efficient coordination between land use systems and ecosystems. It is therefore of great significance for agricultural sustainability based on the systematic assessment of EALU. This study took carbon emissions and non-point source pollution resulting from arable land utilization into the measurement system of EALU, and a super-SBM model, kernel density estimation and Tobit regression model were used to analyze regional differences and influencing factors of EALU for 31 provinces in China from 2000 to 2019. The results showed that there was an upward trend in EALU in China from 0.4393 in 2000 to 0.8929 in 2019, with an average annual growth rate of 4.01%. At the regional level, the EALU of three categories of grain functional areas generally maintains an increasing trend, with the highest average value of EALU in main grain marketing areas (MGMAs), followed by grain producing and marketing balance areas (GPMBAs) and main grain producing areas (MGPAs). There are obvious differences in EALU among provinces, and the number of provinces with high eco-efficiency has increased significantly, showing a spatial distribution pattern of “block” clustering. In terms of dynamic evolution, kernel density curves reflect the evolution of EALU in China and grain functional areas with different degrees of polarization characteristics. The results of Tobit regression show that natural conditions, financial support for agriculture, science and technology inputs, level of industrialization, agricultural mechanization, and the living standards of farmers are significant factors resulting in regional disparities of EALU. Therefore, this study proposes the implementation of differentiated arable land use/agricultural management strategies to improve the sustainable utilization of arable land.

1. Introduction

Arable land, as the collective term for paddy fields, irrigated land, and dryland that are used for growing agricultural crops, is an indispensable key factor to ensure food security and ecological sustainability [1,2]. Many countries and regions around the world have enacted a series of policies and regulations to achieve the efficient utilization and comprehensive protection of arable land [3,4,5]. However, due to rapid urbanization, burgeoning population and overexploitation of land resources [6,7,8], arable land is shrinking dramatically, the food crisis is worsening increasingly and the agricultural ecological environment is deteriorating starkly in many parts of the world [9,10,11]. In particular, with the COVID-19 pandemic raging around the world, the food crisis is becoming a globally important issue. Therefore, the need to increase food production for food security while maintaining a healthy arable land ecosystem has become a common challenge for the sustainable development of all human beings [12].
Since Brown [13] published the report entitled “Who will feed China?” in 1995, China’s food security has been of great concern to the world. In fact, as the world’s largest developing country, the efficient utilization of arable land to ensure national food security has always been the top priority for the Chinese government [5,14]. China feeds nearly 20% of the world’s population with only 7% of global arable land [7,15], however heavy environmental and ecological costs have also been paid [16]. With the rapid development of urbanization and the social economy, the scale of cities continues to expand and the demand for construction land grows rapidly, resulting in increasingly serious depletion of arable land resources [8,9]. According to statistics from the China Rural Statistical Yearbook (2015–2018) (CRSY), the total area of arable land in China was 134.8812 million hectares at the end of 2017, 0.2828 million hectares reduction compared to 2014, which was approximately twice the built-up area of Beijing in 2017. In addition, the 2014 National General Survey of Soil Contamination showed that 19.4% of arable land in China has been contaminated to varying degrees [17]. The excessive use of agrochemicals such as chemical fertilizers, pesticides and agricultural film in the process of arable land utilization has made the ecological problems around arable land increasingly serious [16,18,19], which can also affect the quality of arable land and food security [20,21]. Currently, as China enters the new period of arable land protection and ecological civilization construction, in order to improve arable land ecosystem, the Chinese government has formulated a “three-in-one” arable land protection system integrating the quantity, quality and ecology. Therefore, re-examining the utilization pattern and management strategy of arable land from the perspective of eco-efficiency is of great value and practical significance for the sustainable utilization of arable land and national food security.
Eco-efficiency was originally proposed by German scholars Schaltegger and Sturn (1990) [22], and its core idea is to introduce the dual dimension of economy and ecology in production evaluation, emphasizing the balanced relationship between economic and ecological benefits [23,24]. According to this core idea, Eco-efficiency of arable land utilization (EALU) can be defined as the dynamic process of maximizing socio-economic outputs and minimizing ecological pollution outputs given certain production factor inputs during arable land utilization, and achieving efficient coordination between arable land use systems and ecosystems [25,26]. With the increased intensity of arable land use, the agricultural ecological problems caused by the excessive use of agricultural chemicals such as pesticides, fertilizers, and agricultural films in the process of arable land utilization have gradually attracted widespread attention [27,28,29]. Some scholars have explored agricultural eco-efficiency in many research cases, providing references for formulating sustainable agricultural management policies [30,31,32,33]. Specific to arable land utilization system, scholars usually directly explore arable land utilization efficiency, however the direct research on EALU still needs to be further explored. In fact, arable land use efficiency, as an important indicator to reveal the rationality of various production factors in the process of arable land utilization [34], is a key issue for researchers and policymakers. Scholars have considered arable land utilization as a systematic process of “input + output”, and have systematically analyzed the measurement system of arable land use efficiency [35,36], the change characteristics of arable land use efficiency at different spatial scales and its influencing factors [19,37]. Moreover, arable land utilization has a two-way output effect of producing food products and emitting agricultural pollution [17]. If the negative effects cannot be systematically considered when constructing the evaluation system of arable land use efficiency, it will inevitably cause deviations between the measurement results and the actual situation [38]. To address this problem, scholars have attempted to comprehensively consider the impact of carbon emissions and other environmental pollutants when assessing arable land use efficiency [17,39,40,41,42]. Considering the negative effect of carbon emission in the process of arable land utilization, scholars have included carbon emission as undesirable output into the evaluation system of arable land utilization efficiency, and systematically measured the actual level of arable land utilization in different regions [16,25,42]. In the process of high-intensity arable land utilization, the ecological and environmental issues of arable land have gradually emerged [19,43], and the non-point source pollution in the process of arable land utilization has gradually attracted the attention of scholars [17,38,41].
There is no doubt that the above research results are of great significance for improving the evaluation system of arable land utilization efficiency and enriching the related research work of EALU. However, the common characteristic of the above-mentioned literature is that they rarely integrate carbon emissions and non-point source pollution into the measurement framework of arable land utilization efficiency. In order to examine arable land utilization efficiency more comprehensively, it is urgent to explore the realistic level of arable land utilization from the perspective of eco-efficiency. Actually, arable land is an important component of agricultural systems, and improving the level of EALU is an effective way to promote sustainable utilization of arable land [25]. Systematic analysis of regional differences of China’s EALU and its influencing factors have important practical significance for promoting the efficient of arable land utilization and sustainable agricultural development.
Therefore, the contribution of this study is mainly to construct a measurement system of EALU by comprehensively considering the impact of carbon emissions and non-point source pollution in the process of arable land utilization, and explores its regional difference and influencing factors to expand the research depth of EALU. The research path of this study mainly concentrates on the following three aspects. Firstly, this study uses the super-slack-based measure (Super-SBM) model to measure China’s EALU from 2000 to 2019. Secondly, using kernel density estimation reveals the dynamic evolution of regional differences of EALU. Finally, the Tobit regression model is used to explore the influencing factors of EALU. Through this paper, we can comprehensively understand the actual situation of EALU in China, which is beneficial to the efficient and ecological utilization of arable land resources. Moreover, China’s experience in enhancing EALU can provide useful references for other developing countries to promote sustainable utilization of arable land resources while urbanization is developing rapidly. The remaining chapters of this paper are arranged as follows. Section 2 presents research methods and data. Section 3 shows the results of empirical analysis. Section 4 summarizes conclusions and proposes policy implications.

2. Materials and Methods
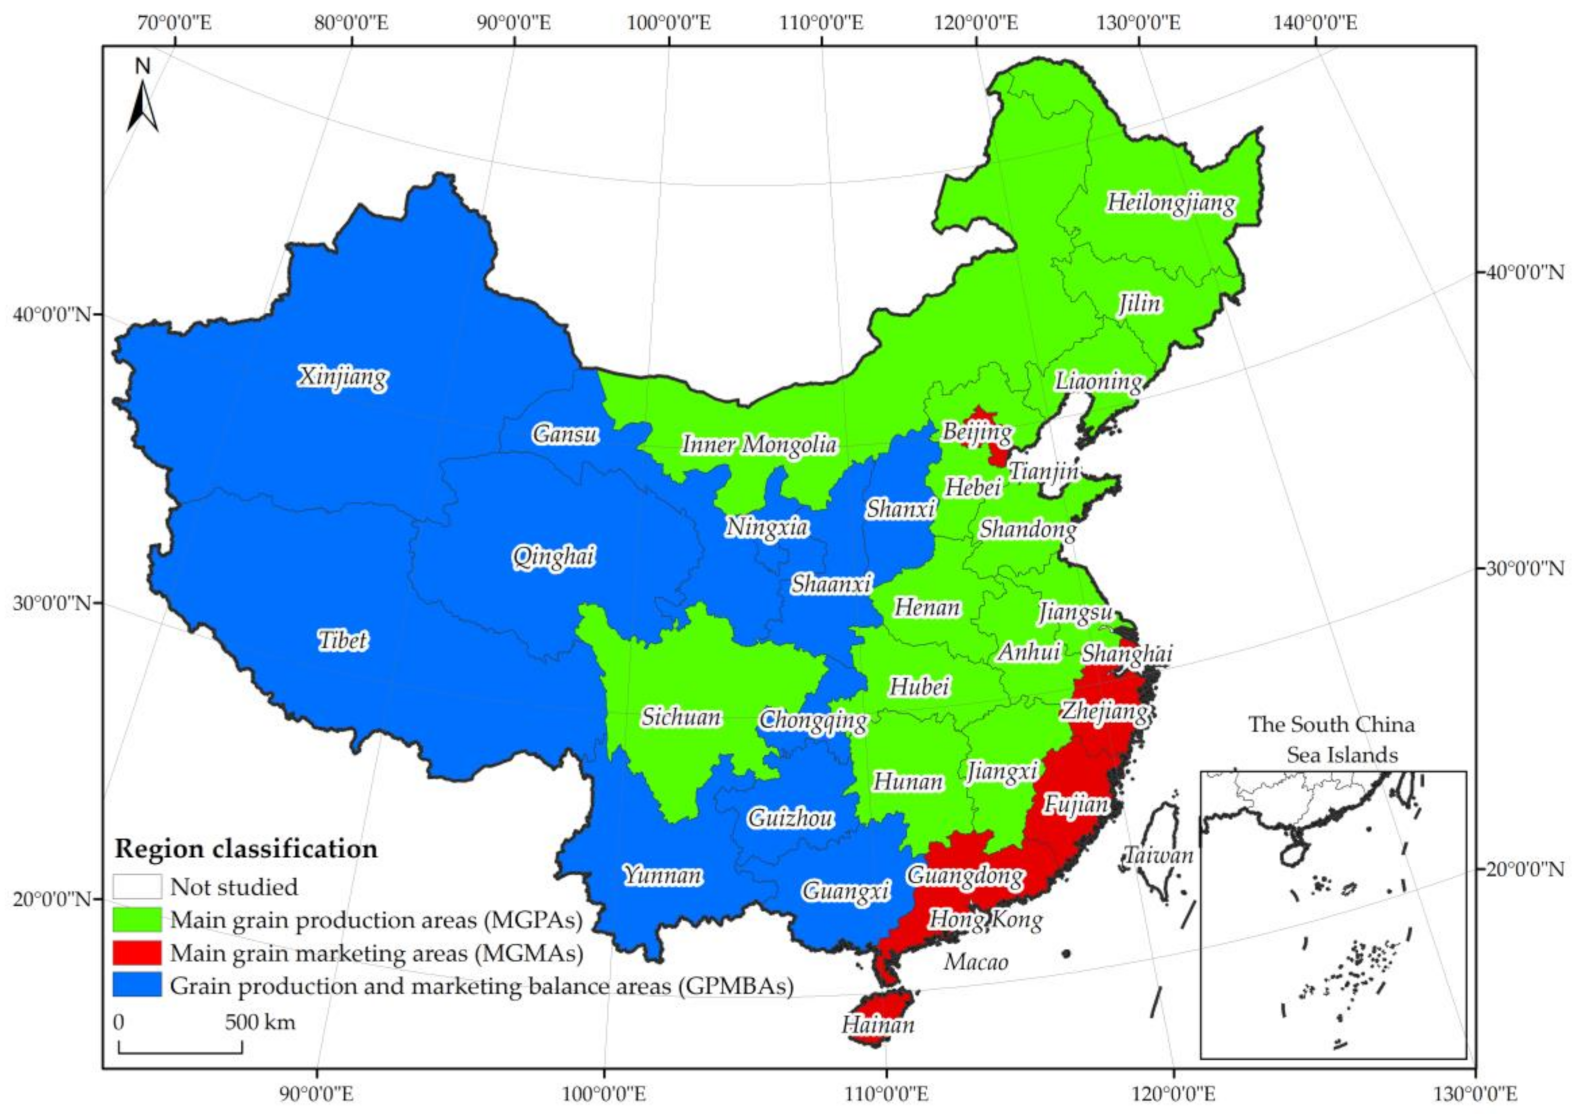
2.1. Research Area

China is composed of 34 provincial administrative units, with marked differences in arable land resources, grain production and agricultural development levels among the provinces [44]. Considering the lack of relevant data for Hong Kong, Macau and Taiwan, this study focuses on 31 provinces in the Chinese mainland from 2000 to 2019, excluding Hong Kong, Macao and Taiwan. The National Food Security Mid-and Long-Term Plan Outline (2008–2020) has divided the 31 provinces of the Chinese mainland into three categories of grain functional areas (Figure 1), namely main grain producing areas (MGPAs), main grain marketing areas (MGMAs), and grain producing and marketing balance areas (GPMBAs). Among them, MGPAs are the key food production areas with certain resource advantages in terms of geography, soil, climate and technology, which are suitable for growing agricultural crops. MGMAs refer to the grain consumption areas with small per capita arable land and low grain self-sufficiency rate. GPMBAs refer to the western region that not only needs to ensure basic self-sufficiency of grain, but also faces the needs of economic development. The regional division of grain functional areas has been used by some scholars to analyze regional differences in arable land use, food security and agricultural development in China [45]. Compared with traditional regional divisions, this regional classification approach has a unique advantage in objectively reflecting the level of regional arable land utilization, which helps to accurately grasp the state of arable land utilization in various regions, and is of great significance for revealing the regional differences of EALU. Therefore, this study explores regional differences and influencing factors of China’s EALU by using grain functional areas as the research area. As shown in Figure 1, green, red, and blue colors identify the MGPAs, MGMAs, and GPMBAs, respectively.

2.2. Empirical Methods

Research methods applied in this paper mainly contain the super-SBM model, Kernel density estimation and Tobit regression model. First, the super-SBM model by incorporating carbon emissions and non-point source pollution resulting from arable land use as an undesirable output was proposed for measuring China’s EALU from 2000 to 2019. Then, Kernel density estimation, a nonparametric method, was used to explore the dynamic evolution of regional disparities of EALU. Moreover, the Tobit regression model was finally used to analyze the influencing factors of the regional disparities of EALU.

2.2.1. The Super-SBM Model

As a nonparametric technique efficiency analysis method, the super-SBM model combines the advantages of both the SBM model and the super-efficiency Data Envelopment Analysis (DEA) model. It can not only incorporate undesirable outputs into the model, but also differentiate and compare effective decision-making units (DMUs), thereby avoiding the loss of effective DMU information [46,47]). In fact, the super-SBM model has been widely used to measure sustainable development efficiency [48], eco-efficiency [49], and green economic efficiency [50]. Therefore, this study adopted the super-SBM model based on undesirable outputs to measure the value of EALU in China from 2000 to 2019 by using MaxEDA software. The basic principle of super-SBM model with undesirable outputs is as follows: assuming that there is a production system with n DMUs, each DMU uses m inputs factors to produce s 1 desirable outputs and s 2 undesirable outputs [50]. Each DMU has three vectors: The input vector X = x 1 , , x n R m × n , the desirable output vector Y g = y 1 g , , y n g R s 1 × n , and the undesirable output vector Y b = y 1 b , , y n b R s 2 × n . The basic formula of the super-SBM model is as follows:
ρ = min 1 + 1 m i = 1 m D i x i h 1 1 s 1 + s 2 ( r = 1 s 1 D r g y r h g + k = 1 s 2 D k b y k h b )
s . t . x i k j = 1 , j h n λ j x i j D i , i = 1 , , m y r h g j = 1 , j h n λ j y r j g + D r g , r = 1 , , s 1 y k h b j = 1 , j h n λ j y k j b D k b , k = 1 , , s 2 1 1 s 1 + s 2 ( r = 1 s 1 D r g y r h g + k = 1 s 2 D k b y k h b ) > 0 D 0 , D g 0 , D b 0
where the vectors D , D g , and D b correspond to the redundancy of inputs, desirable outputs, and undesirable outputs, respectively; λ is the weight vector; ρ is the value of EALU.

2.2.2. Kernel Density Estimation

Kernel density estimation (KDE) is one of the most popular non-parametric estimation methods used to describe the dynamic distribution of data [51]. It emphasizes the use of the kernel density curve to capture the distribution characteristics of the data, which can effectively avoid the subjectivity of function settings in parameter estimation, thereby improving the authenticity of the estimation results [52]. This advantage has made KDE a typical method of measuring regional differences [19]. The principle of KDE is as follows: Assuming that the density function of random variable X is f x , and the probability density at point x can be expressed by Equation (3):
f ( x ) = 1 N h i = 1 N K ( X i x ¯ h )
where K is the kernel function; N is the number of observations; h is the bandwidth; X i is the independent and identically distributed random variable, and x ¯ is the mean value. The kernel function is required to satisfy K x 0 , K x = K x , + + K x d x = 1 , sup K x < + , + K 2 x d x < + . Generally speaking, h is determined by its relationship with N , and they should satisfy Equation (4):
K x = 1 2 π exp x 2 2
Based on the EALU results, the nuclear density distribution graph of EALU during the study period was plotted by Eviews 10.0 software. This study can describe the dynamic evolution characteristics of the regional differences of EALU by observing the position, shape, and ductility of the density function in the graph (Table 1).

2.2.3. Tobit Regression Model

The values of EALU calculated by the super-SBM model are all greater than zero, with non-negative truncation characteristics. When EALU is used as the dependent variable in Tobit regression model to test for its influence, traditional Ordinary Least Square (OLS) can lead to biased estimation results [53]. Compared with traditional OLS, Tobit regression model proposed by American economist Tobin [54] can avoid the bias of results when estimating unknown parameters [55]. Therefore, this paper uses Tobit regression model to analyze the influencing factors of EALU by using Stata10.0 software. The model can be explained as:
y i t = β T x i t + ε i t β T x i t + ε i t > 0 0 o t h e r w i s e
In Equation (5), y i t is the explained variable; x i t is the explanatory variable; β T is the vector of the regression coefficient of the explanatory variable; ε i t is the random error term which assumed to follow the distribution of N 0 , σ 2 .

2.3. Selection of Indicators and Data Description

2.3.1. Indicators Used to Measure EALU

The connotation of EALU can be regarded as a systematic process of steadily increasing desirable outputs such as grain production and agricultural production, reasonably controlling inputs of production factors, and minimizing undesirable outputs such as carbon emissions and non-point source pollution in the process of arable land utilization (ALU) based on the constraints of food security and ecological sustainability. This study has incorporated the concept of ecology into the system of ALU, and constructed the index system of EALU based on the existing literature and the basic requirements of reasonable control of inputs, reduction of resource consumption, improvement of food output and reduction in pollution emission (Table 2).
This paper selects 11 variables to construct the evaluation index system of EALU (Table 2), which contains three categories of input indicators, desirable output indicators and undesirable output indicators. Among them, the input indicators mainly contain land (I1), labor (I2), agricultural irrigation (I3), agricultural machinery (I4), chemical fertilizers (I5), pesticides (I6), and agricultural film (I7). The desirable output variables consist of gross agricultural product (D1) and total grain production (D2). The undesirable output variables mainly refer to carbon emissions (U1) and non-point source pollution (U2) in the process of ALU.
Carbon emissions (U1) mainly refer to the amount of carbon emissions generated by tillage, agricultural machinery, chemical fertilizers, pesticides, agricultural film, and irrigation during the process of ALU [42]. The formula E = E i = G i × δ i was used to measure the carbon emissions resulting from ALU. Where E is the total amount of carbon emissions from ALU, E i is the carbon emissions of the i th carbon source, and G i , δ i are the consumption and coefficient of the i th carbon source, respectively. According to existing research, the coefficients of each carbon sources are shown in Table 3.
Non-point source pollution is the environmental pollution formed by pollutants through surface runoff and underground infiltration, with the characteristics of dispersion and concealment. Non-point source pollution (U2) of ALU mainly refers to the discharge of agricultural pollution caused by the excessive use and residues of agricultural chemicals such as chemical fertilizers, pesticides, and agricultural film in the process of ALU [57]. Therefore, this paper uses the total loss of fertilizer, nitrogen (phosphorus), pesticides and agricultural film to characterize the non-point source pollution of ALU, and the relevant loss coefficients are obtained from the “manual of agricultural pollution source coefficients” issued by the National Pollution Source Census and the related literature [17,57].

2.3.2. Indicators of Influence Factors of EALU

Combining the existing relevant studies, this study selects influencing factors from different perspectives, and believes that natural conditions, financial support for agriculture, science and technology inputs, level of industrialization, agricultural mechanization, and living standard of farmers will have impact on the regional differences of China’s EALU, and the descriptions of variables are described in Table 4.
The Tobit regression model was used to test the impact of influencing factors on the regional differences of EALU and their formation mechanism can be expressed as follows:
y i t = c + α 1 M C I i t + α 2 R A F i t + α 3 R S F i t + α 4 R I G i t + α 5 ln A M P i t + α 6 ln P I R i t + ε i t
where i indicates different provinces of China, t is the year from 2000 to 2019. c is the constant term, y stands for the EALU, α i is the coefficient, and ε i t is the stochastic error.

2.3.3. Data Sources and Description

The data on the calculation of EALU were collected from the CRSY (2001–2020). The data on the influencing factors of EALU were acquired from the China Statistical Yearbook (NBSC) (2001–2020) and CRSY (2001–2020). The descriptive statistics of these variables are shown in Table 5.

3. Results and Discussion

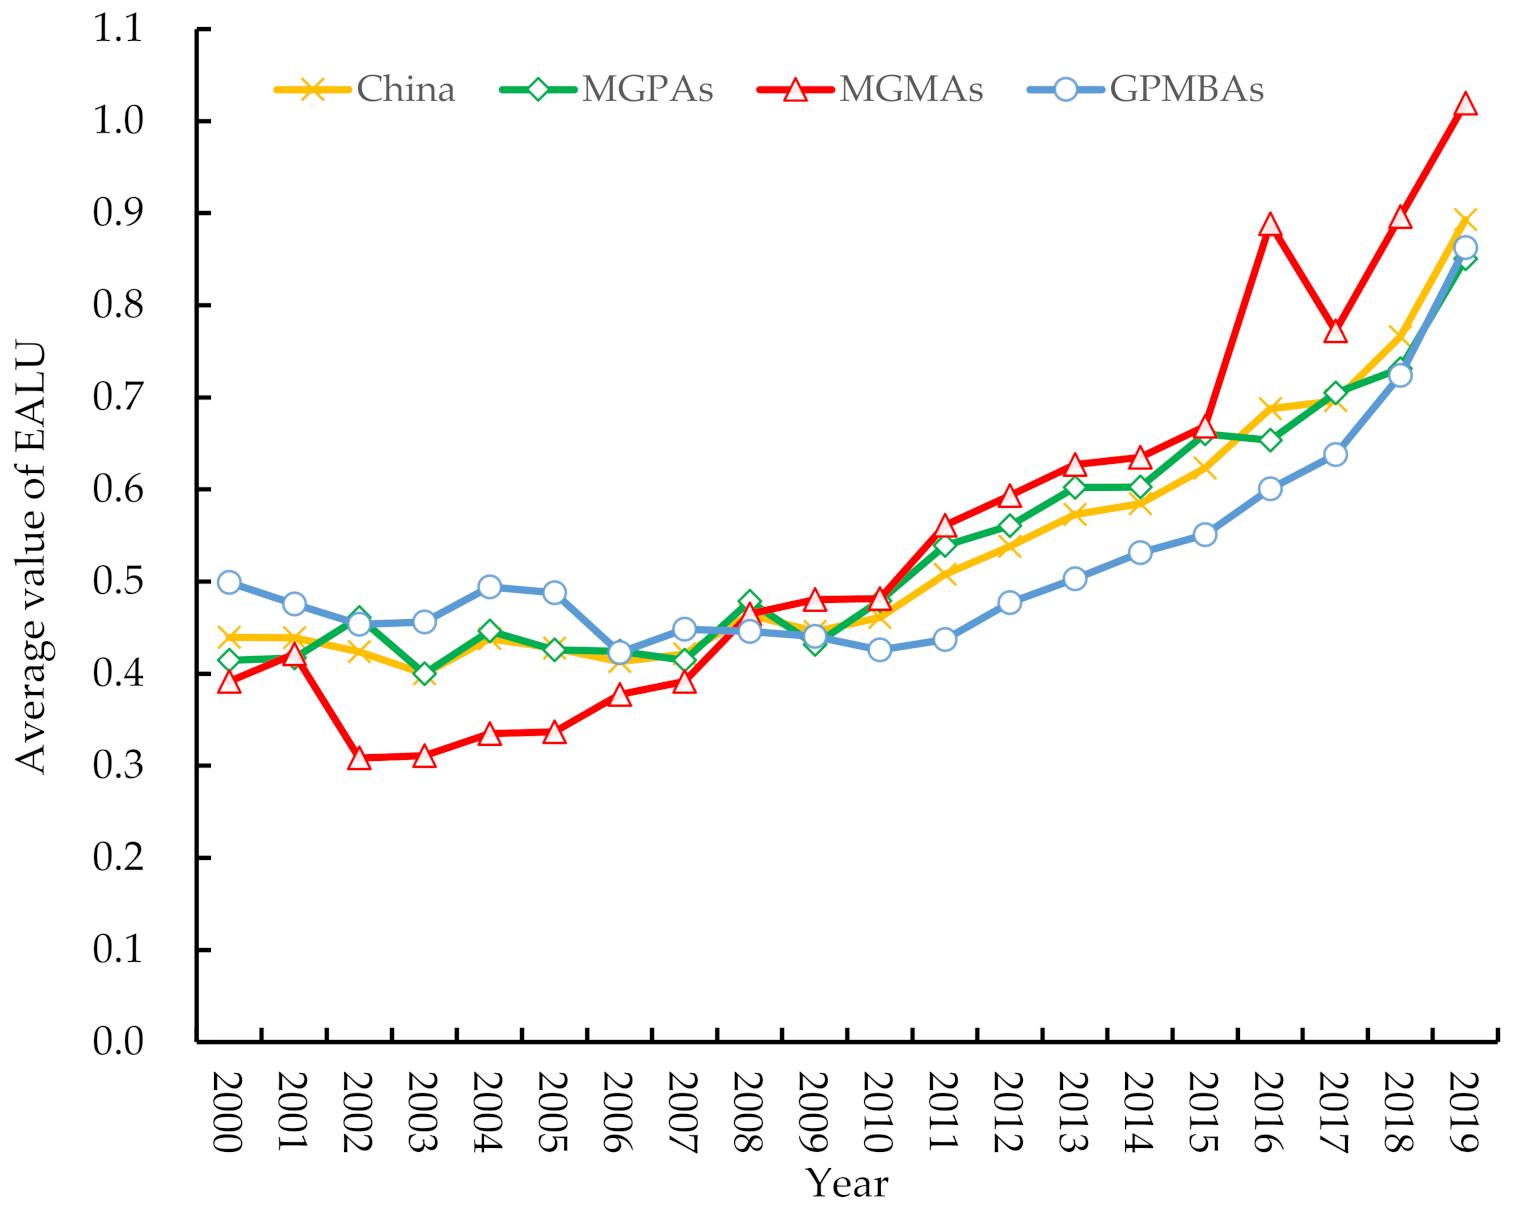
3.1. Measurement and Comparison of EALU

Based on the consideration of carbon emissions and non-point source pollution resulting from arable land utilization, this study incorporated inputs, desirable outputs and undesirable outputs of DMUs into the super-SBM model, and measured the value of EALU in China from 2000 to 2019.
Figure 2 showed the general trend of the average of EALU in China and grain functional areas from 2000 to 2019. Specifically, China’s EALU showed an upward trend, increasing from 0.4393 in 2000 to 0.8929 in 2019, with an average annual growth rate of 4.01% (Table 6). The EALU of grain functional areas also showed increasing trend, however there were obvious regional differences. On the one hand, in terms of the growth rate of EALU, the average annual growth rate of the mean value of EALU from high to low is 5.34% in MGMAs, 4.07% in MGPAs, and 3.16% in GPMBAs, respectively (Table 6). On the other hand, in terms of dispersion of EALU, the standard deviation of the mean value of EALU from high to low is 0.2120 in MGMAs, 0.1302 in MGPAs, and 0.1117 in in GPMBAs, respectively. On the whole, the average value of EALU in China and grain functional areas entered a period of rapid increase after 2016. This changing trend is closely related to China’s implementation of a strict land management system and sound arable land protection system, such as arable land rotation and fallow [64], comprehensive land consolidation [65]. Under these strong policy constraints, ecological compensation for arable land utilization has been strengthened, farmers’ willingness to treat arable land ecologically has been enhanced, and the EALU has been continuously improved.

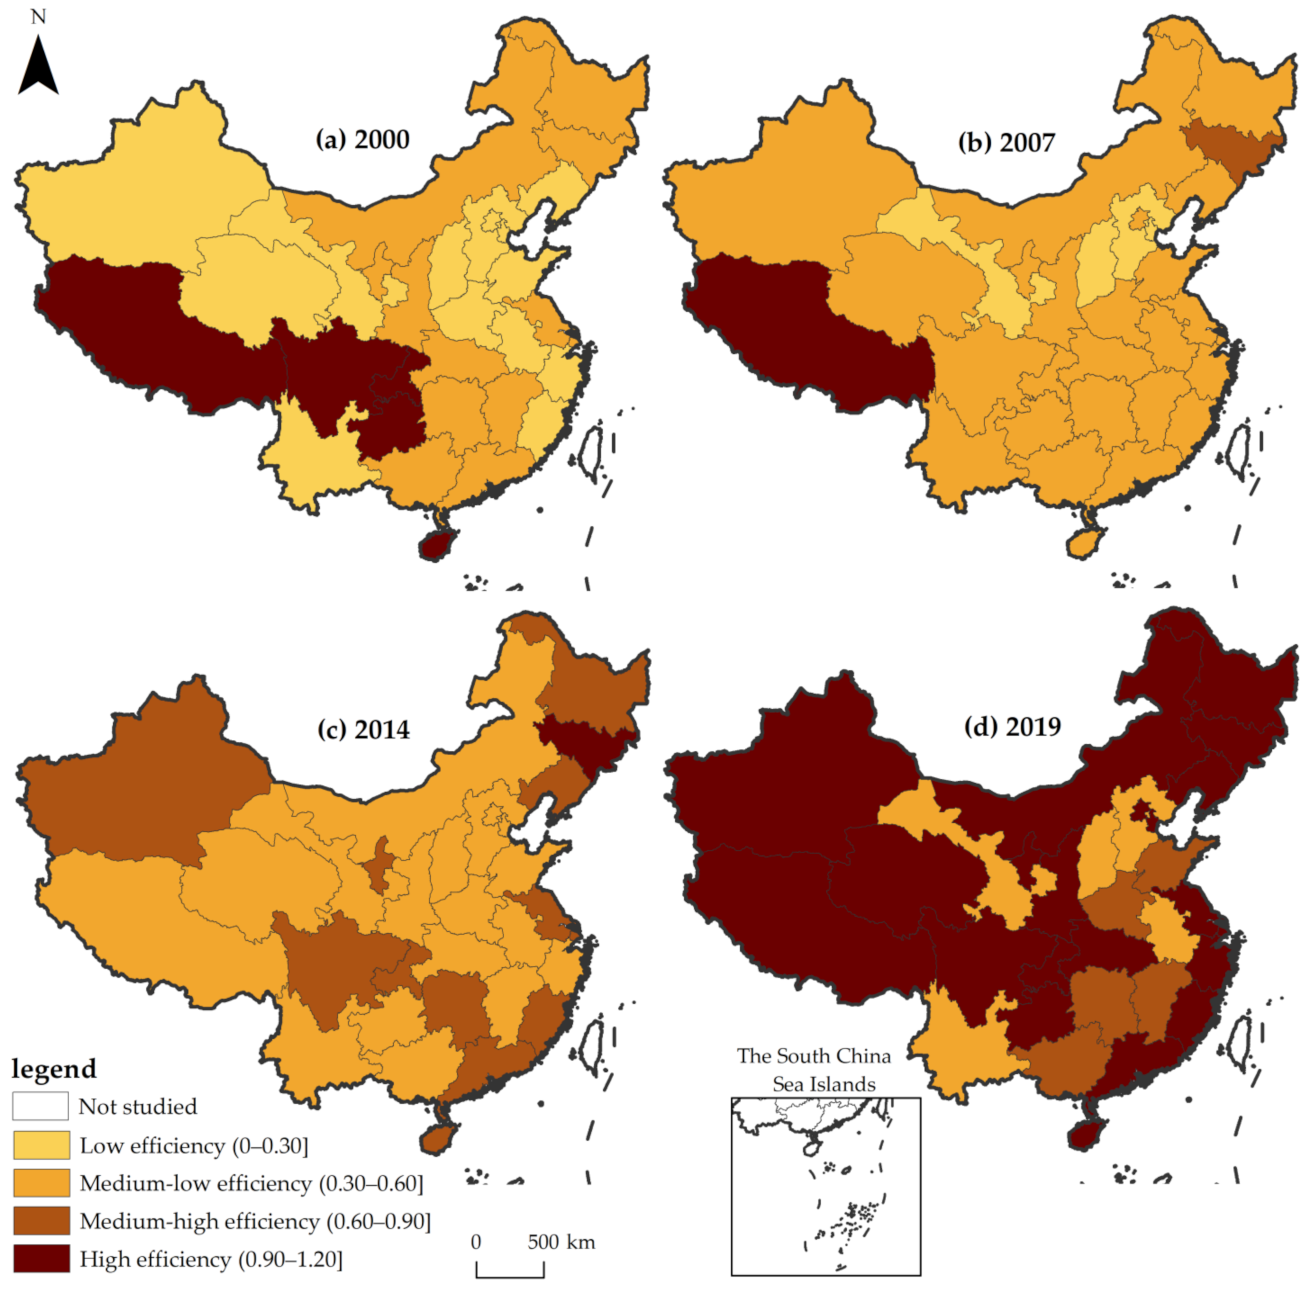
3.2. Spatial-Temporal Disparity of EALU

To visually present the spatial-temporal disparities of EALU in China from 2000 to 2019, this study took seven years as the interval period and selected 2000, 2007, 2014 and 2019 as the years of investigation. According to the calculation results of EALU, the EALU value of each province is distributed between 0 and 1.20, grading similar EALU values into the same group is conducive to comparison [42]. Therefore, this study used the equal interval classification method of ArcGIS, with 0.30 as the equal interval, and divided the EALU into four grade groups, namely Low efficiency (0–0.30], Medium-low efficiency (0.30–0.60], Medium-high efficiency (0.60–0.90], and High efficiency (0.90–1.20], which can more concisely and intuitively reflect the spatial–temporal disparity characteristics of EALU.
Figure 3 depicted the spatial–temporal evolution trend of EALU in 31 provinces in China. From 2000 to 2019, China’s EALU showed a significant improvement, with the number of high-efficiency provinces increasing more than threefold from five in 2000 to 21 in 2019. In terms of spatial pattern, China’s EALU showed obvious characteristics of agglomeration distribution. In 2000, the provinces with high efficiency and medium-low efficiency were mainly distributed in GPMBAs and MGPAs. During the period from 2000 to 2019, the spatial distribution characteristics of EALU in China have changed significantly, with medium-high efficiency and high-efficiency provinces mostly distributed in MGMAs and GPMBAs, while low efficiency and medium-low efficiency provinces were mainly distributed in MGPAs. In general, China’s EALU showed a spatial distribution pattern of “block” clustering.

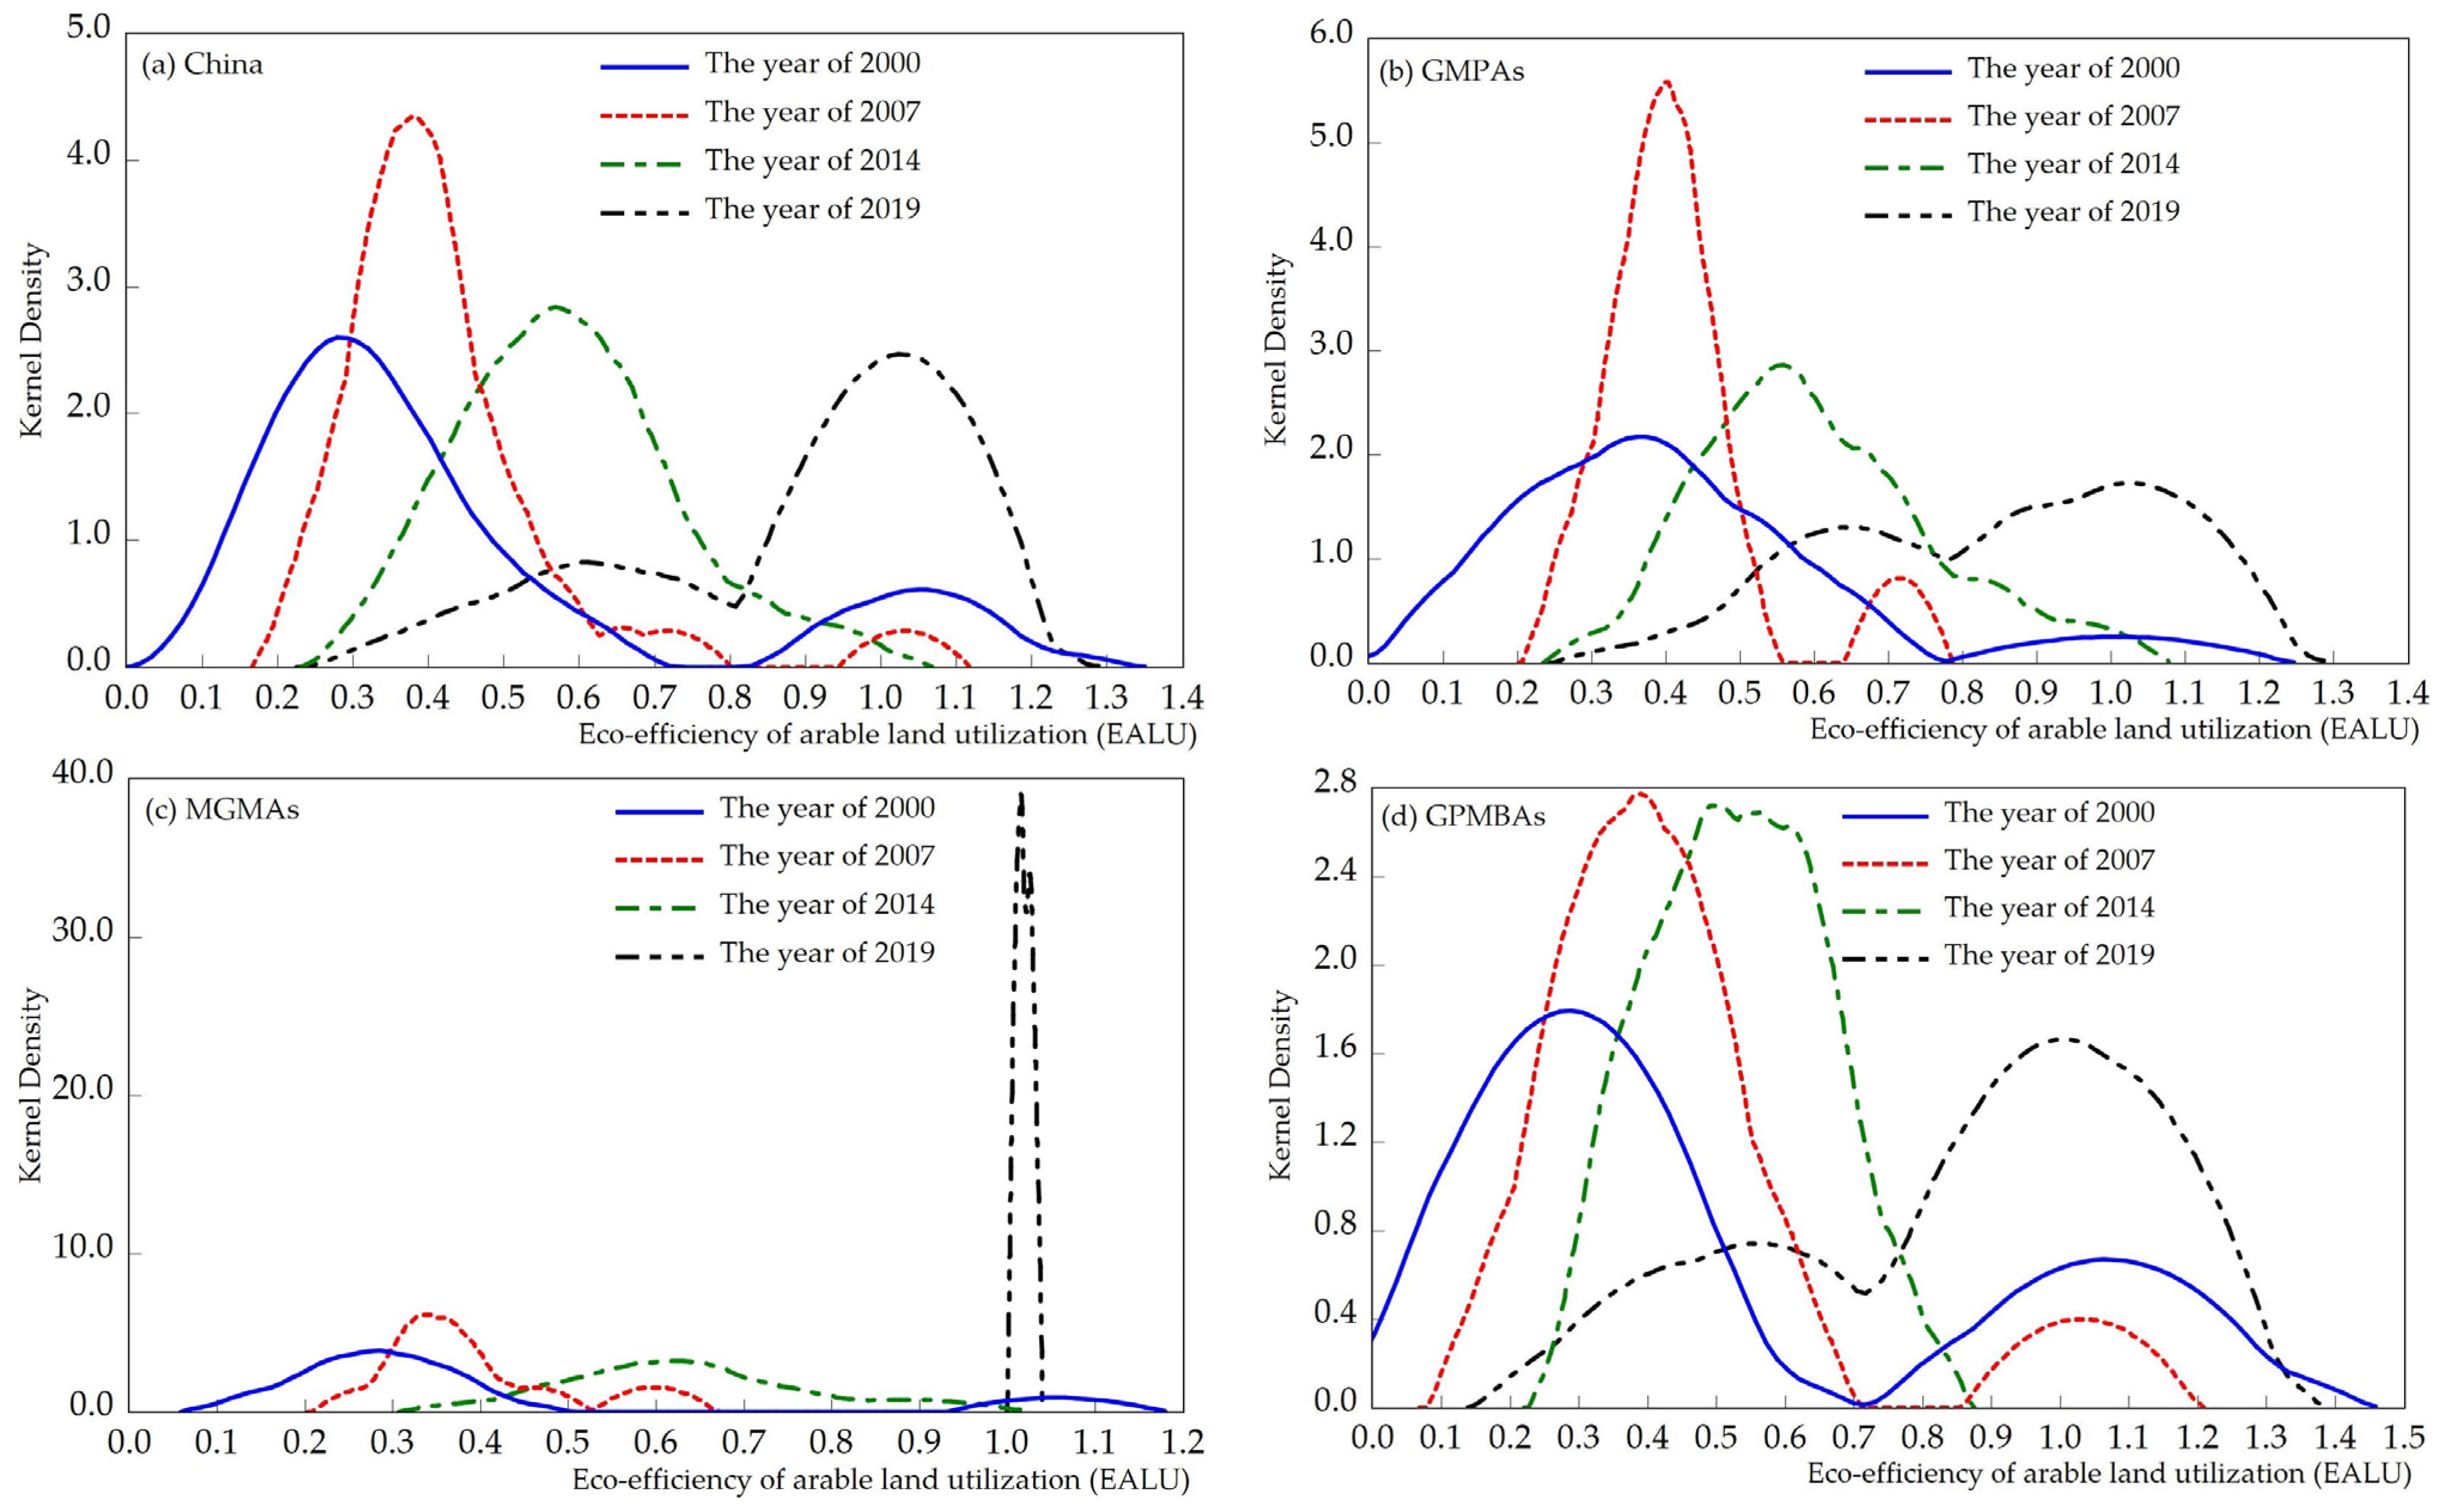
3.3. Dynamic Evolution of EALU

To further reveal the dynamic evolution characteristics of regional differences of EALU, this study selected the results of EALU in each province of China from 2000 to 2019 as the original data and used the method of KDE to plot kernel density curves of EALU in China, MGPAs, MGMAs and GPMBAs (Figure 4).
Figure 4a showed the density curve of EALU in China. From 2000 to 2019, the peak of curve shifted to the right, the two-tails expanded, and the peak showed a “high-low” double-peak shape, which indicated that China’s EALU continued to grow and there was polarization among regions. Figure 4b showed the density curve of EALU in MGPAs, and its curve shape and changing trend were similar to the China’s curve. Figure 4c presented the density curves of MGMAs. From 2000 to 2019, the peak position shifted to the right, and the value of peak rose sharply in 2019, and the peak dominated by a single peak, which signified that the EALU of MGMAs continued to increase and showed a polarization trend. Figure 4d demonstrated the density curve of GPMBAs. From 2000 to 2019, the peak position shifted to the right, and the peaks dominated by “one main and one secondary” double peaks, which indicated that the EALU of GPMBAs maintained an upward trend and showed a dual-polarization trend.
In general, the density curves of China and grain function areas reflect the evolutionary process of EALU with different degrees of polarization characteristic. The possible reason is that the differences in agricultural resource endowment, technical level and management level between regions have increased the regional gap of China’s EALU. In addition, under the background of rapid urbanization, urban space is spreading to the suburbs and occupying high-quality arable land resources [7,8]. To meet the increasing demand for food, the intensity of arable land is rising and agricultural chemicals are overused, resulting in relatively low EALU. However, some provinces have adopted ecological arable land use patterns and moderately controlled agricultural input intensity, resulting in higher EALU, which inevitably leads to the polarization of EALU in China.

3.4. Influencing Factors of EALU

The Tobit regression model was used to explore the influencing factors of EALU. The results of Tobit regression are presented in Table 7. Model 1 to Model 4 are the results of Tobit regressions with China, MGPAs, MGMAs and GPMBAs as the study samples, respectively (Table 7). The regression results for the sample in China (Model 1) show that all explanatory variables are significant at the 1% and 5% levels, indicating that MCI (Multiple cropping index), RAF (Ratio of agricultural expenditure to financial expenditure), RSF (Ratio of science and technology expenditure in fiscal expenditure), RIG (Ratio of Industrial added value to GDP), AMP (Agricultural machinery power per unit area) and PIR (Per capita disposable income of rural residents) all have strong explanatory powers on regional disparities of EALU. According to Table 7, RSF and PIR have significant positive effects on EALU, 1% increase in RSF and PIR will lead to 2.4757% and 0.2248% increase in China’s EALU, respectively. MCI, RAF, RIG, and AMP have a significant negative effect on EALU, a 1% increase in MCI, RAF, RIG, and AMP will result in a 0.1398%, 0.6121%, 0.7173%, and 0.1998% decrease in China’s EALU, respectively.
As the regression results for grain functional areas show (Model 2 to Model 4), there are significant differences in the direction and degree of influence of different factors on EALU. MCI is one of the important indicators reflecting the intensity of arable land use [66], which can affect the efficiency of arable land use. According to Table 7, it can be found that MCI has significant negative effect on EALU in MGPAs and MGMAs, but a significant positive effect on EALU in GPMBAs. Due to regional differences in resource endowment, thermal conditions, and precipitation conditions, the MCI of MGPAs and MGMAs is relatively higher and the intensity of arable land use is correspondingly stronger compared to GPMBAs [18,66]. While high-intensity arable land utilization can improve desirable outputs such as grain production and agricultural output, it also enhances the use of pesticides, chemical fertilizers, and agricultural machinery, which increases undesirable outputs such as carbon emissions and non-point source pollution, thereby damaging arable land ecosystems.
RAF is an important indicator reflecting agriculture-related policies and also guides the regional allocation of agricultural production factors [62]. According to Table 7, RAF has significant negative effect on EALU in MGPAs and GPMBAs, 1% increase in RAF will lead to 1.803% and 0.3851% decrease in the EALU, respectively. This is due to the fact that China’s financial support policies for agriculture largely tend to subsidize petroleum agricultural factors such as chemical fertilizers, pesticides, and agricultural film, and the excessive use of agrochemicals can cause non-point source pollution, which have a negative effect on the EALU [57].
RSF is one of the important indicators of the regional technology development level, and it has positive effect on EALU in MGPAs, MGMAs, and GPMBAs, however only passes the significance test in MGPAs. It can be seen from Table 7 that each 1% increase in RSF will result in a 1.7679% increase in the EALU, indicating that RSF plays a crucial role in improving the EALU. The application of advanced agricultural technology can fully exploit the potential of arable land use, avoid disorderly inputs of production factors of arable land, and enhance the efficiency of arable land resource utilization [36].
RIG is an important indicator of the regional industrial structure. According to Table 7, RIG has a significant negative effect on EALU in MGPAs, MGMAs and GPMBAs, 1% increase in RIG will lead to 0.6631%, 0.5800% and 0.7025% decrease in the EALU, respectively. This is due to RIG having a radiating effect on agricultural development, and while this provides technical and factor support for agricultural production, it also promotes the development of petroleum agriculture [57]. With the rapid development of petroleum agriculture, the use of agrochemicals has been increasing, which in turn generates a large amount of carbon emissions and non-point source pollution, creating a strong negative effect on EALU.
AMP is an important indicator reflecting the degree of agricultural mechanization, which will affect EALU. As shown in Table 7, AMP has significant negative effect on EALU in MGPAs, MGMAs and GPMBAs, every 1% increase in AMP, EALU decreases by 0.1384%, 0.2488%, and 0.2358%, respectively. The improvement of agricultural mechanization can increase the productivity of arable land, yet also increase carbon emissions and agricultural non-point source pollution, which consequently aggravates arable land ecological problems such as soil erosion, soil acidification and pollution [18,67].
PIR is an important indicator of farmers’ living standards and can have an impact on EALU. As shown in Table 7, PIR has significant positive effect on EALU in MGPAs, MGMAs and GPMBAs, with each 1% increase in PIR improving EALU by 0.2323%, 0.3379% and 0.1929%, respectively. With the improvement of farmers’ living standards, farmers are relatively more willing to use arable land in a low-carbon way, which in turn improves the level of sustainable utilization of arable land [63,68].

4. Conclusions and Policy Implications

4.1. Conclusions

This paper used the super-SBM model to measure the EALU of China’s 31 provinces by taking carbon emissions and non-point source pollution as undesirable outputs, in addition, kernel density estimation and Tobit regression model were used to analyze the regional differences and influencing factors of EALU in China. The main conclusions of this study are as follows: (1) During the study period, China’s EALU has been improving, and the EALU in grain functional areas has also maintained increasing trend. This is due to the fact that the Chinese government attaches great importance to arable land protection and implements a series of strict arable land protection systems [5], and arable land use conditions have been significantly improved; (2) There are obvious differences in EALU among Chinese provinces, showing a spatial distribution pattern of “block” clustering, and its evolution process has obvious polarization characteristics; (3) The regression results show that at the national level, RSF and PIR had significant positive impact on EALU, and MCI, RAF, RIG, and AMP have a significant negative impact on EALU. From the perspective of grain functional areas, there are obvious differences in the direction and degree of influence of different factors on EALU.

4.2. Policy Implications

EALU is an important indicator to measure the rationality and sustainability of regional arable land use [25], and it can also reflect the reality of China’s agricultural and rural development [16]. Several policy implications can be drawn from the above conclusions. First and foremost, Chinese relevant government departments should formulate a green and low-carbon strategy for the ecological utilization of arable land resources. Currently, the Chinese government has clearly proposed the strategic goal of striving to achieve carbon peaks by 2030 and carbon neutrality by 2060. Green and low-carbon concepts are important directions for China’s future development [69], China’s arable land management system is facing profound reforms. In this context, the Chinese government should incorporate “carbon emissions and agricultural non-point source pollution” into the top-level design framework when formulating strategies for arable land utilization and agricultural development, and establish a policy system and action plan for the ecological use of arable land that is adapted to the goal of carbon neutrality. Secondly, combining the characteristics of regional differences in EALU in China, and formulating a differentiated system of ecological use of arable land. Based on the actual situation of natural resource endowment, agricultural pollution and agricultural production capacity of grain functional areas, agricultural authorities should guide the efficient allocation of production factors such as labor, technology and capital among grain functional areas, and explore differentiated paths to enhance the ecological utilization of arable land according to local conditions. MGPAs should take advantage of large-scale production to cultivate new agricultural business entities and achieve sustainable improvement of EALU. MGMAs should take advantage of technology and the economy to promote technologically advanced and capital-intensive arable land utilization models to increase the desirable outputs of arable land utilization. GPMBAs should enhance the construction of agricultural infrastructure, increase the input of agricultural production factors, and gradually improve the EALU. Third, under the guidance of green and low-carbon development concept, the government should reform the traditional financial support policy for agriculture, and reduce carbon emissions and non-point surface pollution resulting from arable land utilization. On the one hand, agricultural authorities should improve the incentive mechanism of ecological compensation for arable land utilization, link environmentally friendly arable land utilization patterns to ecological compensation policies, increase subsidies for environmentally friendly agricultural machinery, organic fertilizers and low-carbon pesticides, and enhance farmers’ willingness to use arable land ecologically. On the other hand, agricultural technology enterprises should strengthen technological innovation of carbon sequestration and emission reduction in the utilization of arable land, explore new technologies for the treatment of agricultural non-point source pollution, repair the ecosystem of arable land, and provide technological support to realize the ecological utilization of arable land. Last, China’s agricultural authorities have taken measures (since 2016) such as special ecological subsidies and the reduction in chemical fertilizers and pesticides to alleviate undesirable outputs of arable land utilization. These policy measures have effectively enhanced the level of China’s EALU and improved the coordination between arable land use systems and ecosystems. China’s policies and measures may be able to provide some references for other countries, especially developing countries.

Author Contributions

Conceptualization, X.Z. and X.L.; methodology, N.K.; software, B.J.; validation, N.K., X.Z. and B.K.; formal analysis, N.K.; investigation, B.J.; resources, X.Z. and X.L.; data curation, N.K.; writing—original draft preparation, N.K.; writing—review and editing, X.Z. and N.K.; visualization, B.K.; supervision, X.L.; project administration, X.L.; funding acquisition, X.Z. and X.L. All authors have read and agreed to the published version of the manuscript.

Funding

This research was funded by the National Natural Science Foundation of China (42101263), the National Social Science Foundation of China (21FGLA003), the Humanity and Social Science Research Funds of Ministry of Education (MOE) of China (19YJC790054), the Postdoctoral Science Foundation of China (2020T130234), and National 985 Project of Non-traditional Security at Huazhong University of Science and Technology.

Institutional Review Board Statement

Not applicable.

Informed Consent Statement

Not applicable.

Data Availability Statement

The data presented in this study are available on request from the first author.

Conflicts of Interest

The authors declare no conflict of interest.

References

  1. Bommarco, R.; Vico, G.; Hallin, S. Exploiting ecosystem services in agriculture for increased food security. Glob. Food Secur. 2018, 17, 57–63. [Google Scholar] [CrossRef]
  2. Lu, H.; Xie, H.L.; Lv, T.G.; Yao, G.R. Determinants of cultivated land recuperation in ecologically damaged areas in China. Land Use Policy 2019, 81, 160–166. [Google Scholar] [CrossRef]
  3. Ward, R.M. The US farmland protection policy act: Another case of benign neglect. Land Use Policy 1991, 8, 63–68. [Google Scholar] [CrossRef]
  4. Lichtenberg, E.; Ding, C.R. Assessing farmland protection policy in China. Land Use Policy 2008, 25, 59–68. [Google Scholar] [CrossRef]
  5. Liu, X.W.; Zhao, C.L.; Song, W. Review of the evolution of cultivated land protection policies in the period following China’s reform and liberalization. Land Use Policy 2017, 67, 660–669. [Google Scholar] [CrossRef]
  6. Abass, K.; Adanu, S.K.; Agyemang, S. Peri-urbanisation and loss of arable land in Kumasi Metropolis in three decades: Evidence from remote sensing image analysis. Land Use Policy 2018, 72, 470–479. [Google Scholar] [CrossRef]
  7. Huang, Z.H.; Du, X.J.; Castillo, C.S.Z. How does urbanization affect farmland protection? Evidence from China. Resour. Conserv. Recycl. 2019, 145, 139–147. [Google Scholar] [CrossRef] [Green Version]
  8. Deng, X.Z.; Huang, J.K.; Rozelle, S.; Zhang, J.P.; Li, Z.H. Impact of urbanization on cultivated land changes in China. Land Use Policy 2015, 45, 1–7. [Google Scholar] [CrossRef]
  9. Liu, Y.S.; Wang, J.Y.; Long, H.L. Analysis of arable land loss and its impact on rural sustainability in Southern Jiangsu Province of China. J. Environ. Manag. 2010, 91, 646–653. [Google Scholar] [CrossRef]
  10. Si, Z.Z.; Li, Y.Y.; Fang, P.; Zhou, L. “One family, two systems”: Food safety crisis as a catalyst for agrarian changes in rural China. J. Rural Stud. 2019, 69, 87–96. [Google Scholar] [CrossRef]
  11. Berihun, M.L.; Tsunekawa, A.; Haregeweyn, N.; Meshesha, D.T.; Adgo, E.; Tsubo, M.; Masunaga, T.; Fenta, A.A.; Sultan, D.; Yibeltal, M. Exploring land use/land cover changes, drivers and their implications in contrasting agro-ecological environments of Ethiopia. Land Use Policy 2019, 87, 104052. [Google Scholar] [CrossRef]
  12. Paudel, B.; Zhang, Y.L.; Yan, J.Z.; Rai, R.J.; Li, L.H. Farmers’ perceptions of agricultural land use changes in Nepal and their major drivers. J. Environ. Manag. 2019, 235, 432–441. [Google Scholar] [CrossRef]
  13. Brown, L.R. Who Will Feed China?: Wake-Up Call for a Small Planet; W.W. Norton & Company: New York, NY, USA, 1995. [Google Scholar]
  14. Wang, J.; Lin, Y.; Glendinning, A.; Xu, Y.Q. Land-use changes and land policies evolution in China’s urbanization processes. Land Use Policy 2018, 75, 375–387. [Google Scholar] [CrossRef]
  15. Ma, L.; Long, H.L.; Tu, S.S.; Zhang, Y.N.; Zheng, Y.H. Farmland transition in China and its policy implications. Land Use Policy 2020, 92, 104470. [Google Scholar] [CrossRef]
  16. Han, H.B.; Zhang, X.Y. Static and dynamic cultivated land use efficiency in China: A minimum distance to strong efficient frontier approach. J. Clean. Prod. 2020, 246, 119002. [Google Scholar] [CrossRef]
  17. Xie, H.L.; Chen, Q.R.; Wang, W.; He, Y.F. Analyzing the green efficiency of arable land use in China. Technol. Forecast. Soc. 2018, 133, 15–28. [Google Scholar] [CrossRef]
  18. Ye, S.J.; Song, C.Q.; Shen, S.; Gao, P.C.; Cheng, C.X.; Cheng, F.; Wan, C.J.; Zhu, D.H. Spatial pattern of arable land-use intensity in China. Land Use Policy 2020, 99, 104845. [Google Scholar] [CrossRef]
  19. Kuang, B.; Lu, X.H.; Zhou, M.; Chen, D.L. Provincial cultivated land use efficiency in China: Empirical analysis based on the SBM-DEA model with carbon emissions considered. Technol. Forecast. Soc. 2020, 151, 119874. [Google Scholar] [CrossRef]
  20. Skevas, T.; Stefanou, S.E.; Lansink, A.O. Pesticide use, environmental spillovers and efficiency: A DEA risk-adjusted efficiency approach applied on Dutch arable farming. Eur. J. Oper. Res. 2014, 237, 658–664. [Google Scholar] [CrossRef]
  21. Mukuve, F.M.; Fenner, R.A. Scale variability of water, land, and energy resource interactions and their influence on the food system in Uganda. Sustain. Prod. Consumpt. 2015, 2, 79–95. [Google Scholar] [CrossRef]
  22. Schaltegger, S.; Sturm, A. Ökologische Rationalität: Ansatzpunkte zur Ausgestaltung von Ökologieorientierten Managementinstrumenten. Unternehmung 1990, 4, 117–131. (In German) [Google Scholar]
  23. Bai, Y.P.; Deng, X.Z.; Jiang, S.J.; Zhang, Q.; Wang, Z. Exploring the relationship between urbanization and urban eco-efficiency: Evidence from prefecture-level cities in China. J. Clean. Prod. 2018, 195, 1487–1496. [Google Scholar] [CrossRef]
  24. Wang, Q.W.; Tang, J.X.; Choi, G. A two-stage eco-efficiency evaluation of China’s industrial sectors: A dynamic network data envelopment analysis (DNDEA) approach. Process Saf. Environ. Prot. 2021, 148, 879–892. [Google Scholar] [CrossRef]
  25. Yang, B.; Wang, Z.Q.; Zou, L.; Zou, L.L.; Zhang, H.W. Exploring the eco-efficiency of cultivated land utilization and its influencing factors in China’s Yangtze River Economic Belt, 2001–2018. J. Environ. Manag. 2021, 294, 112939. [Google Scholar] [CrossRef] [PubMed]
  26. Coluccia, B.; Valente, D.; Fusco, G.; Leo, F.D.; Porrini, D. Assessing agricultural eco-efficiency in Italian Regions. Ecol. Ind. 2020, 116, 106483. [Google Scholar] [CrossRef]
  27. Mózner, Z.; Tabi, A.; Csutora, M. Modifying the yield factor based on more efficient use of fertilizer—The environmental impacts of intensive and extensive agricultural practices. Ecol. Ind. 2012, 16, 58–66. [Google Scholar] [CrossRef] [Green Version]
  28. Sabiha, N.-E.; Salim, R.; Rahman, S.; Rola-Rubzen, M.F. Measuring environmental sustainability in agriculture: A composite environmental impact index approach. J. Environ. Manag. 2016, 166, 84–93. [Google Scholar] [CrossRef] [Green Version]
  29. Englund, O.; Börjesson, P.; Berndes, G.; Scarlat, N.; Dallemand, J.-F.; Grizzetti, B.; Dimitriou, I.; Mola-Yudego, B.; Fahl, F. Beneficial land use change: Strategic expansion of new biomass plantations can reduce environmental impacts from EU agriculture. Glob. Environ. Chang. 2020, 60, 101990. [Google Scholar] [CrossRef]
  30. Reith, C.C.; Guidry, M.J. Eco-efficiency analysis of an agricultural research complex. J. Environ. Manag. 2003, 68, 219–229. [Google Scholar] [CrossRef]
  31. Heidenreich, A.; Grovermann, C.; Kadzere, I.; Egyir, I.S.; Muriuki, A.; Bandanaa, J.; Clottey, J.; Ndungu, J.; Blockeel, J.; Muller, A.; et al. Sustainable intensification pathways in Sub-Saharan Africa: Assessing eco-efficiency of smallholder perennial cash crop production. Agric. Syst. 2022, 195, 103304. [Google Scholar] [CrossRef]
  32. Gancone, A.; Pubule, J.; Rosa, M.; Blumberga, D. Evaluation of agriculture eco-efficiency in Latvia. Energy Procedia 2017, 128, 309–315. [Google Scholar] [CrossRef]
  33. Grassauer, F.; Herndl, M.; Nemecek, T.; Guggenberger, T.; Fritz, C.; Steinwidder, A.; Zollitsch, W. Eco-efficiency of farms considering multiple functions of agriculture: Concept and results from Austrian farms. J. Clean. Prod. 2021, 297, 126662. [Google Scholar] [CrossRef]
  34. Li, H.; Zhang, X.L.; Zhang, X.; Wu, Y.Z. Utilization benefit of cultivated land and land institution reforms: Economy, society and ecology. Habitat Int. 2018, 77, 64–70. [Google Scholar] [CrossRef]
  35. Yang, C.H.; Wu, L.; Lin, H.L. Analysis of total-factor cultivated land efficiency in China’s agriculture. Agric. Econ. 2010, 56, 231–242. [Google Scholar] [CrossRef]
  36. Zhang, L.X.; Zhu, D.L.; Xie, B.P.; Du, T.; Wang, X. Spatiotemporal pattern evolvement and driving factors of cultivated land utilization efficiency of the major grain producing area in China. Resour. Sci. 2017, 39, 608–619. (In Chinese) [Google Scholar]
  37. Luo, X.; Ao, X.H.; Zhang, Z.; Wan, Q.; Liu, X. Spatiotemporal variations of cultivated land use efficiency in the Yangtze River Economic Belt based on carbon emission constraints. J. Geogr. Sci. 2020, 30, 535–552. [Google Scholar] [CrossRef]
  38. Chen, Y.; Li, S.R.; Cheng, L. Evaluation of cultivated land use efficiency with environmental constraints in the Dongting Lake Eco-Economic Zone of Hunan province, China. Land 2020, 9, 440. [Google Scholar] [CrossRef]
  39. Lam, W.Y.; Chatterton, J.; Sim, S.; Kulak, M.; Beltran, A.M.; Huijbregts, M.A.J. Estimating greenhouse gas emissions from direct land use change due to crop production in multiple countries. Sci. Total. Environ. 2021, 755, 143338. [Google Scholar] [CrossRef]
  40. Ajwang’Ondiek, R.; Hayes, D.S.; Kinyua, D.N.; Kitaka, N.; Lautsch, E.; Mutuo, P.; Hein, T. Influence of land-use change and season on soil greenhouse gas emissions from a tropical wetland: A stepwise explorative assessment. Sci. Total Environ. 2021, 787, 147701. [Google Scholar] [CrossRef]
  41. Babin, N.; Mullendore, N.D.; Prokopy, L.S. Using social criteria to select watersheds for non-point source agricultural pollution abatement projects. Land Use Policy 2016, 55, 327–333. [Google Scholar] [CrossRef]
  42. Zhang, C.Z.; Su, Y.Y.; Yang, G.Q.; Chen, D.L.; Yang, R.X. Spatial-temporal characteristics of cultivated land use efficiency in major function-oriented zones: A case study of Zhejiang province, China. Land 2020, 9, 114. [Google Scholar] [CrossRef]
  43. Zhao, C.; Zhou, Y.; Jiang, J.H.; Xiao, P.N.; Wu, H. Spatial characteristics of cultivated land quality accounting for ecological environmental condition: A case study in hilly area of northern Hubei province, China. Sci. Total. Environ. 2021, 774, 145765. [Google Scholar] [CrossRef]
  44. Tian, X.; Geng, Y.; Viglia, S.; Bleischwitz, R.; Buonocore, E.; Ulgiati, S. Regional disparities in the Chinese economy: An emergy evaluation of provincial international trade. Resour. Conserv. Recycl. 2017, 126, 1–11. [Google Scholar] [CrossRef]
  45. Zhang, L.; Peng, J.; Chen, X.; Lu, Z. Carbon emissions, energy consumption and economic growth: Evidence from the agricultural sector of China’s main grain-producing areas. Sci. Total. Environ. 2019, 665, 1017–1025. [Google Scholar] [CrossRef]
  46. Tone, K. A slacks-based measure of efficiency in data envelopment analysis. Eur. J. Oper. Res. 2001, 130, 498–509. [Google Scholar] [CrossRef] [Green Version]
  47. Tone, K. A slacks-based measure of super-efficiency in data envelopment analysis. Eur. J. Oper. Res. 2002, 143, 32–41. [Google Scholar] [CrossRef] [Green Version]
  48. Khan, S.U.; Cui, Y.; Khan, A.A.; Ali, M.A.S.; Khan, A.; Xia, X.L.; Liu, G.B.; Zhao, M.J. Tracking sustainable development efficiency with human-environmental system relationship: An application of DPSIR and super efficiency SBM model. Sci. Total. Environ. 2021, 783, 146959. [Google Scholar] [CrossRef]
  49. Du, Y.W.; Jiang, J.; Li, C.H. Ecological efficiency evaluation of marine ranching based on the Super-SBM model: A case study of Shandong. Ecol. Ind. 2021, 131, 108174. [Google Scholar] [CrossRef]
  50. Zhao, P.J.; Zeng, L.E.; Lu, H.Y.; Zhou, Y.; Hu, H.Y.; Wei, X.Y. Green economic efficiency and its influencing factors in China from 2008 to 2017: Based on the super-SBM model with undesirable outputs and spatial Dubin model. Sci. Total. Environ. 2020, 741, 140026. [Google Scholar] [CrossRef]
  51. Katkovnik, V.; Shmulevich, I. Kernel density estimation with adaptive varying window size. Pattern Recogn. Lett. 2002, 23, 1641–1648. [Google Scholar] [CrossRef]
  52. Qin, Z.L.; Li, W.Y.; Xiong, X.F. Estimating wind speed probability distribution using kernel density method. Electr. Power Syst. Res. 2011, 81, 2139–2146. [Google Scholar] [CrossRef]
  53. Liang, X.D.; Li, J.C.; Guo, G.X.; Li, S.P.; Gong, Q.X. Evaluation for water resource system efficiency and influencing factors in western China: A two-stage network DEA-Tobit model. J. Clean. Prod. 2021, 328, 129674. [Google Scholar] [CrossRef]
  54. Tobin, J. Estimation of relationships for limited dependent variables. Econometrica 1958, 26, 24–36. [Google Scholar] [CrossRef] [Green Version]
  55. Zhang, J.R.; Zeng, W.H.; Shi, H. Regional environment efficiency in China: Analysis based on a regional slack-based measure with environmental undesirable outputs. Ecol. Ind. 2016, 71, 218–228. [Google Scholar] [CrossRef]
  56. Madu, I.A. Spatial impacts of rural population pressure on agricultural land use in Nigeria. Appl. Spat. Anal. Policy 2012, 5, 123–135. [Google Scholar] [CrossRef]
  57. Wang, B.Y.; Zhang, W.G. Cross-provincial differences in determinants of agricultural eco-efficiency in China: An analysis based on panel data from 31 provinces in 1996-2015. Chin. Rural Econ. 2018, 1, 46–62. (In Chinese) [Google Scholar]
  58. Li, B.; Fu, S.Y.; Zhang, J.B.; Yu, H.S. Carbon functions of agricultural land use and economy across China: A correlation analysis. Energy Procedia 2011, 5, 1949–1956. [Google Scholar] [CrossRef] [Green Version]
  59. West, T.O.; Marland, G. A synthesis of carbon sequestration, carbon emissions, and net carbon flux in agriculture: Comparing tillage practices in the United States. Agric. Ecosyst. Environ. 2002, 91, 217–232. [Google Scholar] [CrossRef]
  60. Post, W.M.; Kwon, K.C. Soil carbon sequestration and land-use change: Processes and potential. Glob. Chang. Biol. 2000, 6, 317–327. [Google Scholar] [CrossRef] [Green Version]
  61. Dubey, A.; Lal, R. Carbon footprint and sustainability of agricultural production systems in Punjab, India and Ohio, USA. J. Crop Improv. 2009, 23, 332–350. [Google Scholar] [CrossRef]
  62. Jiang, H.; Yang, H.R.; Wu, Q. The spatial and temporal differentiation of the farmland utilization efficiency in the Eastern Coastal Economic Zone. Res. Agric. Modern. 2020, 41, 321–330. (In Chinese) [Google Scholar]
  63. Ji, Z.X.; Wang, X.L.; Li, L.; Guan, X.K.; Yu, L.; Xu, Y.Q. The evolution of cultivated land utilization efficiency and its influencing factors in Nanyang Basin. J. Nat. Resour. 2021, 36, 688–701. (In Chinese) [Google Scholar] [CrossRef]
  64. Shi, K.F.; Yang, Q.Y.; Li, Y.Q.; Sun, X.F. Mapping and evaluating cultivated land fallow in Southwest China using multisource data. Sci. Total. Environ. 2019, 654, 987–999. [Google Scholar] [CrossRef]
  65. Xie, J.H.; Yang, G.Q.; Wang, G.; Song, Y.; Yang, F. How do different rural-land-consolidation modes shape farmers’ ecological production behaviors? Land Use Policy 2021, 109, 105592. [Google Scholar] [CrossRef]
  66. Xiang, M.T.; Yu, Q.Y.; Wu, W.B. From multiple cropping index to multiple cropping frequency: Observing cropland use intensity at a finer scale. Ecol. Ind. 2019, 101, 892–903. [Google Scholar] [CrossRef]
  67. Liu, G.S.; Wang, H.M.; Cheng, Y.X.; Zheng, B.; Lu, Z.L. The impact of rural out-migration on arable land use intensity: Evidence from mountain areas in Guangdong, China. Land Use Policy 2016, 59, 569–579. [Google Scholar] [CrossRef]
  68. Lu, X.H.; Kuang, B.; Li, J. Regional differences and its influencing factors of cultivated land use efficiency under carbon emission constraint. J. Nat. Resour. 2018, 33, 657–668. (In Chinese) [Google Scholar]
  69. Zhao, X.; Ma, X.W.; Chen, B.Y.; Shang, Y.P.; Song, M.L. Challenges toward carbon neutrality in China: Strategies and countermeasures. Resour. Conserv. Recycl. 2021, 176, 105959. [Google Scholar] [CrossRef]
Figure 1. Research scope and regional classification.
Land 11 00257 g001
Figure 2. Average value of EALU in China, main grain producing areas (MGPAs), main grain marketing areas (MGMAs), and grain producing and marketing balance areas (GPMBAs) from 2000 to 2019.
Land 11 00257 g002
Figure 3. Spatial distribution of EALU in China. (a) The year of 2000; (b) The year of 2007; (c) The year of 2014; (d) The year of 2019.
Land 11 00257 g003
Figure 4. The kernel density distribution of EALU: (a) China; (b) main grain producing areas (MGPAs); (c) main grain marketing areas (MGMAs); (d) grain producing and marketing balance areas (GPMBAs).
Land 11 00257 g004
Table 1. Correlation between density curve and degree of disparity.
Degree of DisparityHeight of the PeakWidth of the PeakPosition of the PeakNumber of Peaks
IncreaseFlatDistensibleMove leftIncrease
DecreaseSteepNarrowedMove rightReduce
Table 2. Measurement indexes of EALU.
IndicatorsVariablesUnitReferences
InputTotal sown area of farm crops (I1)103 hectaresKuang et al. [19]
Number of rural population (I2)104 peopleMadu [56]
Effective irrigation area (I3)103 hectaresChen et al. [38]
Total power of agricultural machinery (I4)104 kW·hLuo et al. [37]
Consumption of chemical fertilizers (I5)104 tZhang et al. [36]
Consumption of pesticides (I6)104 tKuang et al. [19]
Consumption of agricultural film (I7)104 tChen et al. [38]
Desirable outputGross agricultural production (D1)108 YuanKuang et al. [19]
Total grain production (D2)104 tZhang et al. [36]
Undesirable outputCarbon emissions (U1)104 tZhang et al. [42]
Non-point source pollution (U2)104 tWang and Zhang [57]
Table 3. Coefficients of major carbon sources during the process of ALU.
SourceCoefficientUnitReference
Tillage312.6kg/km2Zhang et al. [42]
Agricultural machinery0.18kg/kWLi et al. [58]
Chemical fertilizer0.8956kg/kgWest and Marland [59]
Pesticide4.9341kg/kgPost and Kwon [60]
Agricultural film5.18kg/kgWang and Zhang [57]
Irrigation25kg/hectaresDubey and Lal [61]
Table 4. Description of influencing factor variables.
Influencing FactorsVariables (Unit)AbbreviationReferences
Natural conditionsMultiple cropping index (%)MCIKuang et al. [19]
Financial support for agricultureRatio of agricultural expenditure to financial expenditure (%)RAFJiang et al. [62]
Science and technology inputsRatio of science and technology expenditure in fiscal expenditure (%)RSFZhang et al. [36]
Level of industrializationRatio of Industrial added value to GDP (%)RIGWang and Zhang [57]
Agricultural mechanizationAgricultural machinery power per unit area (kW·h/hectares)AMPWang and Zhang [57]
Living standard of farmersPer capita disposable income of rural residents (Yuan/people)PIRJi et al. [63]
Table 5. Descriptive statistics of all variables.
IndicatorsVariablesMeanMedianStd. Dev.MinimumMaximum
InputI13533.273122.052787.2246.5014,338.10
I21188.281073.24889.6948.274510.90
I31946.501516.891523.85109.206177.60
I42730.992017.902675.1194.0013,353.00
I5169.63133.30138.682.50716.10
I65.104.654.250.0617.35
I76.745.106.340.0134.35
Desirable outputD11169.71827.801108.7311.405223.40
D21766.441371.651488.0328.87506.80
Undesirable outputU3253.72225.31193.983.43870.64
U41.120.711.090.014.76
Influencing FactorsMCI125.83118.8637.5641.46230.90
RAF9.699.643.572.1320.34
RSF1.471.071.330.157.20
RIG45.0746.608.4516.1661.50
AMP5.775.013.331.3224.63
PIR7472.005775.555522.801330.8133,195.20
Table 6. Average annual growth rate of the mean of EALU in China, main grain producing areas (MGPAs), main grain marketing areas (MGMAs), and grain producing and marketing balance areas (GPMBAs) from 2000 to 2019.
Research ScaleThe Average of EALUAverage Annual Growth Rate
20002019
China0.43930.89294.01%
MGPAs0.41440.85044.07%
MGMAs0.39141.01955.34%
GPMBAs0.49910.86253.16%
Table 7. Tobit regression results for China, main grain producing areas (MGPAs), main grain marketing areas (MGMAs), and grain producing and marketing balance areas (GPMBAs).
VariablesChina (Model 1)MGPAs (Model 2)MGMAs (Model 3)GPMBAs (Model 4)
CoefficientStd. Err.CoefficientStd. Err.CoefficientStd. Err.CoefficientStd. Err.
MCI−0.1398 ***0.0376−0.1852 ***0.0556−0.1473 ***0.06560.1966 **0.0988
RAF−0.6121 **0.2965−1.0831 ***0.4012−0.90261.0041−0.3851 ***0.4793
RSF2.4757 ***0.66851.7679 *1.01720.17931.11512.10253.0921
RIG−0.7173 ***0.1068−0.6631 ***0.1156−0.5800 **0.2470−0.7025 ***0.2423
AMP−0.1998 ***0.0289−0.1384 ***0.0365−0.2488 ***0.0620−0.2358 ***0.0620
PIR0.2248 ***0.01690.2323 ***0.02240.3379 ***0.03820.1929 ***0.0328
_cons1.5020 ***0.07981.5364 ***0.10521.5238 ***0.16571.1830 ***0.1600
Obs.620260140220
Note: ***, **, * indicate significance at the level of 1%, 5% and 10%.
Publisher’s Note: MDPI stays neutral with regard to jurisdictional claims in published maps and institutional affiliations.

