Article

A New Way to Explore Volcanic Areas: QR-Code-Based Virtual Geotrail at Mt. Etna Volcano, Italy

1
Department of Human and Innovation Sciences, Insubria University, Via S. Abbondio 12, 22100 Como, Italy
2
Department of Earth and Environmental Sciences, University of Milan Bicocca, Piazza della Scienza 1-4, 20126 Milan, Italy
3
CRUST-Interuniversity Center for 3D Seismotectonics with Territorial Applications, 66100 Chieti, Italy
4
Istituto Nazionale di Geofisica e Vulcanologia-Osservatorio Etneo, Piazza Roma 2, 95125 Catania, Italy
*
Author to whom correspondence should be addressed.
Land 2022, 11(3), 377; https://doi.org/10.3390/land11030377
Submission received: 27 January 2022 / Revised: 28 February 2022 / Accepted: 1 March 2022 / Published: 3 March 2022

Abstract

:
In this body of work, we showcase a historic virtual geotrail on the eastern flank of the iconic Mt. Etna volcano (Italy), along a series of outstanding geological sites and features subsequent to an important eruption that took place in 1928. A geohistoric account of such a major eruption, is of great interest, since it is the only event since 1669 to have caused the destruction of a town (Mascali) in the Etna region. Volcanologists, educators, the lay public, tourists and volcano explorers can now access a series of “virtual geostops” belonging to this virtual geotrail, such that “visitors” can virtually fly above these sites by scanning a QR code on the printed or electronic version of the present manuscript, as well as on the poster provided as additional material for this manuscript. The virtual geostops that comprise the virtual geotrail were developed using the structure-from-motion (SfM) photogrammetry technique from images captured by using unmanned aerial vehicles (UAVs). The main result of our work is the virtual geotrail, subdivided in two parts and composed of eight geostops, each showing outstanding examples of geological features resulting from volcanic phenomena that took place also during 1979. Our approach is designed to support classical field trips, and it can undoubtedly become complementary to traditional field teaching in earth sciences, both now and in the future.

1. Introduction

In recent years, modern technologies have greatly contributed to making geological features more accessible and enticing to both students and the lay public. The main novel technological approach presented here is the possibility of using virtual reality (VR) for geo-education, as well as geoheritage communication purposes [1]. We point out that the concept and importance of geoheritage has been described thoroughly in several key papers [2,3,4,5,6,7,8,9]. Another main concept is geodiversity, which is the variety of minerals, rocks, landforms, fossils, sediments, as well as the natural phenomena that form and affect them. Geoheritage, which includes elements of geodiversity, can be promoted, popularized and protected through geoparks and geotourism. Awareness about the need to safeguard the local geoheritage can also be raised through museum exhibitions [10].
VR provides 3D visualization [11,12] using 3D models characterized by high-resolution photo-realistic texture. [13,14]
Such 3D models have first been proposed as virtual outcrops [11,15,16] and then as virtual geosites [13,17], which are a 3D representation of surface geology, available on the web and integrated with a detailed and interactive description. Virtual geosites are suitable for (i) popularizing geoheritage for the lay public by showcasing active geological phenomena and (ii) involving the younger generations (e.g., middle- and high-school students) who are particularly interested in innovative modes of communication [18]. This is also considered to be a key strategy for geo-educational purposes, as it is capable of overcoming common difficulties experienced by students, such as visualizing 3D features or processes on a 2D medium (typically, a book) or on an image-based virtual tour [19,20,21].
Other VR approaches have focused on creating so-called virtual tours, made of a succession of outcrops geolocated on a GIS platform, which can be browsed by looking at 2D images [19,20,21] or 3D digital outcrop models [22]. This approach has been proposed to support earth science teaching, reducing teaching costs, as well as enhancing the students’ learning efficiency and increasing their interest in the learning experience [20,21]. In addition, virtual tours can be useful at different stages, that is, before, during and after the virtual site visit; for example, as a digital review before field trips, excursions, or as a tutorial review, as well as a digital asset substitute for field site inspection [20]. A mixed approach is the exploration of a series of 3D models in the same way as in a virtual tour, using a PC, a tablet or a smartphone; for instance, McCaffrey et al. [23] used this approach in petroleum geoscience, whereas Pasquaré Mariotto et al. [17] integrated virtual geosites into a WebGIS platform (https://arcg.is/1e4erK0, accessed on 26 January 2022) for the purpose of improving geoheritage communication. A recent work focused on showing the use of field trips and virtual tours as resources for geotourism [24]. Moreover, an interesting description of a volcanic landscape trail has been provided by Beltrán-Yanes et al. [25].
In view of the above, firstly we designed a modern approach to share geological knowledge about volcanic areas in a novel and appealing way for younger generation of students and also for the lay public. Secondly, in doing this, we provided a series of outstanding geostops containing landforms and features left by an important eruption that took place in 1928, ravaging the eastern flank of the volcano. Such eruption is of great interest, since it is the only event, following that of 1669, to have caused the destruction of a town (Mascali) in the Etna region, sterilizing the eastern flank of the volcano.
The viewers can access each single virtual geostop and fly above it by scanning a QR code on the printed or electronic version of the manuscript, as well as on the poster provided as Supplementary Material. In this way, the geotrail becomes a virtual geotrail. It is worth noting that both the virtual and non-virtual geotrails presented in this work are presently used in teaching classes at Milan-Bicocca University, with a focus on geological mapping in volcanic areas, and they will be used as complementary material, not as a replacement, for field activity, which remains of primary importance.
The strategy outlined above can be considered key to teaching and learning geoscience even in difficult times (for instance, during the restrictions on travel imposed by COVID-19). In fact, our approach allows access to geological areas online, overcoming the impossibility to be in the field in person (this is the case in pandemic-affected times); the same advantage is shared by people suffering from motor disabilities, who would never have a chance to access a physical geotrail but now have a chance to do it, thanks to the innovative technique outlined in the present work.

2. Geological Background

The area we selected for our geotrail is located on the NE flank of Mt. Etna, one of the most active volcanoes on Earth. Mt. Etna is located in a compressional environment [26,27,28], at the border between the African and the European plates (Figure 1a). More in detail, the area of the geotrail was affected by a major lateral eruption in 1928 and by a minor one in 1979. It showcases several landforms that we consider to be extremely interesting for displaying the geology of volcanic areas. In fact, here it is possible to observe both the eruptions vents/fissures that fed the above-cited eruptions, as well as their products and deposits. Moreover, older morphological features and deposits can also be examined.
Mt. Etna volcano has a constantly open central conduit feeding four summit central craters (Figure 1b) named Voragine (formed in 1945), Northeast Crater (formed in 1911), Bocca Nuova (formed in 1968) and Southeast Crater (formed in 1971). Eruptions from these summit craters are classified as summit eruptions [29]. Differently, volcanic activity also occurs along the volcano’s flanks, and in particular, along radial fissures mostly at three main “rift zones”: the W Rift, the S Rift and the NE Rift (Figure 1b) [30]. These flank (or lateral) eruptions are usually fed by shallow (1–3 km in depth) dikes that propagate laterally from the central conduit [29].
The area selected for the present work was affected by a major lateral eruption in 1928, which involved the eastern flank with the formation of a system of dry and eruptive fissures, ENE-WSW trending and 7.7 km long as a whole (Figure 1b,c). According to Tibaldi et al. [31], who reconstructed the geometry, kinematics and origins of this system of faults and fissures through detailed fieldwork and numerical modeling, the geological evolution of the area from the west to the east can be defined through four different tectonic settings related to dike propagation: (1) a sequence of eight eruptive vents in the uppermost part (at an altitude from 2070 to 2350 m a.s.l.); (2) a 2.5 km long single eruptive fissure in the intermediate part; (3) an area of dry fractures (extension fractures, normal faults and graben structure); and (4) an alignment of vents along the pre-existing Ripe della Naca fault system. This eruption is of great interest, since it is the only event following that of 1669 to have caused the destruction of a town (Mascali) in the Etna region, located about 2500 m below the uppermost eruptive vent. The eruption began on 2 November along an eruptive fissure, which opened in the Valle del Leone area, at an altitude of 2600–2550 m a.s.l.; it was marked by Strombolian activity, accompanied by lava effusion from several vents, and it lasted less than 1 h [32]. On 3 November, a second segment of the fissure opened up in the Serra delle Concazze area, between 2300 m and 1560 m a.s.l., emitting a lava flow for about 18 h that destroyed part of the Cerrita and Cubania forests. During the night of 4 November, a third segment of the fissure opened along the Ripe della Naca fault system, at an elevation of about 1200 m a.s.l., about 1400 m below the uppermost eruptive vent. Lava effusion from the fissure produced separate lava flows that flowed downslope. The lava advanced rapidly (0.46 km/h) along the Pietrafucile-Vallonazzo stream gully and reached, in less than two days, the village of Mascali, disrupting both the Circumetnea railway and the road linking Nunziata to Piedimonte. Only the small neighborhood of Sant’Antonino remained unscathed from the impact of the lava. In the following days, the lava flow reached the edge of the coastal plain and destroyed the Messina-Catania railway and the bridge connecting Catania to Messina. After 17 days, on 19 November, when the effusion ended, the lava flow had reached 25 m a.s.l. with a length of 9.4 km and had covered an area of 4.38 × 10⁶ m2. The volume of the erupted lava was 52.91 ± 5.21 × 10⁶ m3 with an average effusion rate of 38.5 m3/s [32]. This eruption did not claim any lives, but it had a devastating impact on the entire eastern flank of Mt. Etna, causing the destruction of Mascali and of the small villages located close to the Pietrafucile-Vallonazzo stream gully, the disruption of major lines of communication and the sterilization of a vast expanse of agricultural land. The disruption of the communication line between Catania and Messina was overcome thanks to the maritime routes. Moreover, 15 counties were left without electricity due to the demolition of electricity poles. The 1928 eruption was the first example of emergency management by the Italian central government. Right after the eruption, the fascist regime ordered the reconstruction of Mascali further downhill, along the Messina-Catania motorway. This intervention was motivated by the Italian government’s desire to show foreign countries a strong ability to react to such a devastating natural event with readiness and efficiency.
In 1979, an eruption began in July with mild Strombolian activity at the Southeast Crater and lava lake activity in the Voragine; on 3 August, mild Strombolian activity preceded the opening of numerous fissures across the Valle del Bove to the E and ENE and on the ENE flank outside the Valle del Bove. Lava flows were emitted from three different effusive vents, and their overall extension was 2.5 km2 with a volume of 7.5 × 10⁶ m3 ([33] and references within). The highest effusive vent was located at the base of the Southeast Crater at about 3000 m a.s.l., the second one at 2250 m a.s.l. This vent gave birth to a lava flow that traveled 6 km down the E flank of Etna, threatening the village of Fornazzo ([33] and references within). The third effusive vent was located at about 2050 m a.s.l., in correspondence with the intermediate part of the segment of the 1928 fissures system, and emitted a narrow lava flow that moved downhill, totaling a length of about 1500 m, with a width of 65 m in its lowest part. The latter effusive vent is part of the proposed virtual geotrail (Figure 2a).
In summary, these two eruptions left a geoarchive of volcanic landforms, which represent a virtual open-air museum. In detail, the following morphologies can be observed: eruptive vents and fissures, spatter ramparts and cones, bombs, breccias, aa lava flows and few pahoehoe lava flows, in the proximity of the vents, and lava flow levees and ogives in aa lava flows.

3. Materials and Methods

As mentioned earlier, VR provides 3D visualization [11,12] using 3D models characterized by high-resolution photo-realistic texture. [13,14]. Such 3D models were first proposed for use as virtual outcrops [11,15,16] and then as virtual geosites [13,17], which are a 3D representation of surface geology, available on the web and integrated with a detailed and interactive description. The virtual geotrail was developed using the structure-from-motion (SfM) photogrammetry technique from images captured by using unmanned aerial vehicles (UAVs). The main result of our work is the virtual geotrail, subdivided in two parts and composed of eight geostops, each showing outstanding examples of geological features resulting from volcanic phenomena along the 1928 eruption area, where the minor 1979 eruption also took place, thereby making its eight geostops accessible worldwide on the web, both as UAV-captured videos and virtual geostops. Moreover, as our work is aimed at engaging the lay public and the students, each geostop is made accessible through static QR codes. In detail, for each geostop we provide a figure and its location on a map; to the right of each figure, two QR codes are available. Through the one above, the viewer can access a UAV-captured video, whereas through the one below, the virtual geostop; this can be visualized in both immersive and non-immersive VR. This approach allows the users to explore the area using a mobile phone or a table. In addition to the above, we provide, as additional files, a poster with all the figures and QR codes to be used as interactive teaching materials in schools of different levels. Hereunder, we provide details for each of the relevant components of our methods.

3.1. Designing the Geotrail

While designing the geotrail, we chose to follow the timeline of the 1928 eruption. In doing this, we divided the trail in two main parts: the upper and the lower one (Figure 2). Following this approach, the user can experience the geotrail following the chronicle of the eruption, for a 4D experience; all details are in Table 1.
The upper part of the geotrail starts at geostop 1, at an altitude of about 2300–2100 m a.s.l., immediately followed by geostop 2 at an altitude of 2050 m a.s.l. Geostops 3, 4 and 5 are in sequence; they start at an altitude of 1960 m and end at 1720 m a.s.l. (Figure 2a). Geostop 1 (Figure 3) focuses on the explosive, Strombolian phase of the eruption, and the eruption-related deposits can be viewed; at geostop 2 (Figure 4), the viewer can observe an eruptive fissure related to the 1979 eruption. Geostops 3 (Figure 5), 4 (Figure 6) and 5 (Figure 7) are aimed at showing spatter and lava flow deposits related to both the 1928 and 1979 eruptions. The last geostop belonging to the upper part of the geotrail is number 6 (Figure 8); here, an example of eruptive fissure related to the 1928 eruption can be observed. The geostops can be reached in the field following path 732A, which starts in the vicinity of Rifugio Citelli. It should be noted that adequate basic equipment for hiking on volcanic terrain is needed, because the geostops are both along and off trail, and it is necessary to walk on lava flows. More information about the available hiking paths in the Mount Etna Geopark area can be found at https://www.unescoparcoetna.it/en/sentieri/ (accessed on 26 January 2022), the official website of the Geopark.
The lower part of the geotrail is composed of two geostops, both aimed at showing the deposits left by the later phases of the 1928 eruption (Figure 2b). At geostop 7 (Figure 9), ENE-aligned eruptive vents can be seen, which opened up in the later stages of the eruption. At geostop 8 (Figure 10), part of the lava flows erupted by the vents observed at geostop 7 can be observed; these flows reached and annihilated the Mascali village.

3.2. UAV-Based Filming and Virtual Geostop Building

The videos provided in this work have been filmed using a UAV. The model we used is the DJI Phantom 4 PRO (UAV2), a 1.388 kg vehicle equipped with a 1-inch CMOS sensor, capable of capturing 20 megapixel pictures and 4K videos at 60 fps/100 Mbps. Flight time is approximately 30 min, and the drone can be remotely controlled. It can capture images, including exchangeable image file format (EXIF) information and GPS geographic coordinates (DATUM WGS84). This kind of UAV is distinguished by a very stable hovering and a stabilized camera. It is easily transportable in the field, and it can be flown at a very low altitude, thus allowing for a greater resolution and proving to be very helpful for capturing videos and pictures for building 3D models [36]. Moreover, it is also suitable for automatized flight missions, a feature that is especially useful for modeling wide areas (further details in Tibaldi et al. [37]).
Our 3D model building method is based on the application of the structure-from-motion (SfM) photogrammetry technique, widely employed in earth sciences (including volcanology) for both research and communication purposes [38,39,40]. This technique enables obtaining high-resolution photorealistic 3D models as final products by producing three-dimensional shapes from two-dimensional image sequences. Since a few of the 3D models showcased here result from our previous research, we, therefore, briefly summarized the overall methodology. Generally speaking, our methodology is made of three main steps: (i) drone-based image collection, (ii) photogrammetry processing and (iii) 3D model export for online sharing as virtual geostops. The drone-collected pictures need to have a high overlap ratio with the following pictures—usually greater than 75–80%—and have to be orthogonally oriented to the ground [41]. Oblique pictures can improve the reconstruction of vertical features. Due to the harsh weather conditions, we collected only nadir pictures in order to save time. It is very well known that photogrammetric processing firstly focuses on image alignment and sparse cloud generation on the successive creation of a dense cloud (from the sparse cloud), on which the mesh is created; further details on the entire workflow are in Bonali et al. [36].
We have created the 3D models using the following steps and settings. In step 1, we built the mesh, composed of several faces in high-quality settings (it is worth noting that the number of faces cannot exceed 2,100,000). Then, it was necessary to create a texture needed to cover the mesh with a photorealistic aspect; this was achieved by creating two different 4096 × 4096-pixel files for the texture. Subsequently, the 3D model needs to be exported, either into a Collada or Wavefront OBJ file format [42]; all exported files have to be uploaded on the Sketchfab platform. These settings were meant to obtain an overall file size within the 200 MB limit imposed by the Sketchfab educational license, at the same time guaranteeing top-notch quality, as shown in the Virtual Geotrail section of this work. Texture resolution in our models was always between 2 and 6 cm/pixel. The photogrammetry processing was performed using Agisoft Metashape (http://www.agisoft.com/, accessed on 26 January 2022), a commercial structure-from-motion software, which we chose owing to its intuitive workflow, user-friendly interface and high quality of point clouds [43].

3.3. Sharing and Accessibility of Digital Materials

In this section, we describe the strategy we have used to ensure the accessibility of the digital materials that are essential components of our virtual geotrail; these are mainly UAV-captured videos and VGs. They were both made available by enabling viewers to scan the QR codes in the figure corresponding to each geostop in the geotrail. All static QR codes were generated using the website https://www.the-qrcode-generator.com/ (accessed on 26 January 2022), where they are provided for free. As already mentioned, they are placed on the right-hand side of each figure, representing the geostop along the trail: the upper one is for accessing the UAV-captured video, the lower one is for accessing the corresponding VG.
With regard to UAV-captured videos, they were uploaded on the YouTube channel of the GeoVires Lab (https://geovires.unimib.it/, accessed on 26 January 2022) in full HD quality to guarantee an optimal streaming performance also when accessing them with mobile phones and tablets. The link to the videos is made accessible only through the corresponding static QR code, one for each geostop along the trail.
Each VG was shared online and is accessible both in the present paper and in the poster, by scanning the corresponding static QR code. By doing that, the user accesses the corresponding page on https://geovires.unimib.it (accessed on 26 January 2022); as a result, all VGs are accessible worldwide through the internet, also at https://geovires.unimib.it/geotrail/ (accessed on 26 January 2022). On the corresponding page we have made available the VG as an interactive 3D model, together with a full text explanation. Each VG can be visualized in 3D on a tablet or a smartphone in the non-immersive VR mode [44]; on the other hand, the immersive VR mode can be activated, which allows experiencing the VG using a Google Cardboard and more generic VR goggles for mobile phones (further details at https://sketchfab.com/virtual-reality, accessed on 26 January 2022). In the non-immersive mode, the model can be rotated and zoomed using the touch screen, and it is possible to select the annotations in the 3D model, also defined as augmented reality (AR), and interactively read details on specific parts shown in the model and to observe, where available, pictures derived from field activity. Furthermore, using the immersive VR mode, the viewer can observe the model personally and move across the scene by selecting the annotations to explore the most relevant features in each model, annotation by annotation. Further details are available in our previous papers, which we suggest reading [13,16].

4. Results: The Virtual Geotrail

4.1. Large, Aligned 1928 Eruptive Vents

Geostop 1, the first of the geotrail, encompasses an area of about 700 m × 350 m (Figure 2a). It shows the alignment of eruptive vents related to the 1928 eruption, characterized by a crater-like morphology (Figure 3). Their size decreases downhill, from about 130 m to about 45 m in diameter. Further downhill, the 1928 event occurred along outstanding eruptive fissures, as shown at geostop 3. Inside some of these eruptive vents, it is possible to recognize eruptive products derived from the Ellittico phase, covered by 1928 pyroclastic deposits that form two spatter ramparts aside the aligned eruptive vents. In the upward part, some normal faults are also recognizable, with a vertical offset of about 4 m and with the fault scarps facing to the NNW. The 1979 pyroclastic deposits partially cover the area.
As the video starts, it shows a large eruptive vent, where it is possible to recognize, on the left side, the 1928 pyroclastic deposit, mostly red, which covers the light gray eruptive products related to the Ellittico phase. Afterward, the video clearly shows the alignment of the eruptive vents in an ENE direction; then, it turns around looking downhill where the alignment of eruptive vents terminates. The video focuses especially on the lowest eruptive vent, showing in great detail the rim composed of reddish pyroclastic products.
By viewing VG 1, it is possible to observe with great detail the alignment of five eruptive vents with a crater-like morphology, as shown by a hypothetical line passing through annotations 1 and 2. They were surely related to the activity of an underlying feeder dike, and they have been partly eroded but, by observing them, it is possible to notice that their lateral rims are composed of reddish pyroclastic products, such as bombs, breccias and ash (from the 1928 eruption, annotations number 3, 4 and 5). Within the eruptive vent further to the south, it is possible to observe gray layers that most likely belong to the younger eruptive products of the Ellittico phase (annotation 6). The same observation can be made at annotation 7 and 8, in the middle of the vent’s alignment and upward, respectively. Annotation 9 highlights the presence of normal faults with the fault scarp facing mostly to the NNW. Annotation 10 shows a hiking path that passes through the 1928 eruptive vents, where the lower part is partially covered by recent pyroclastic deposits.

4.2. 1979 Eruptive Fissure

Geostop 2, which encompasses an area of about 330 m × 170 m (Figure 2a), shows three geological objects with their related contacts (Figure 4). The first feature of great interest, located in the southern part of the area, is the eruptive fissure striking ENE, which is related to the 1979 eruption. From this fracture, the 1979 lava flow started flowing downhill. The second feature, located in the central part, is the lowermost eruptive vent related to the 1928 eruption, which has a crater-like morphology, and is nowadays mainly filled by recent pyroclastic deposits. In the northern part of the area, two parallel spatter ramparts are shown, related to an eruptive vent older than 1928: both strike about ENE and are as high as 15 m from the ground; their direction mimics that of the underlying feeding fracture.
The video begins uphill by showing, on the left side, one of the two 15 m high spatter ramparts, the 1928 eruptive vent in the center and the 1979 eruptive fissure on the right. Then, the drone flies downhill, over the 1928 eruptive vent with the spatter rampart on the left, while the 1979 eruption fissure and related lava flow are still on the right. As it reaches the 1928 eruptive fissure, shown in geostop 3, it turns back uphill following the 1979 lava flow; at this point, it is possible to observe the 1979 eruptive fissure on the left and the 1928 eruptive vent in the central part.
VG 2 opens up in a SSE-NNW direction and should be observed from left to right, from the top of the slope downward. On the left-hand side of the model, the younger structures and products, related to the 1979 eruption, are located. The eruptive fissure can be observed both in section and in plan view, with an aperture of about 0.5–0.6 m (annotation 1); downhill, it is possible to observe the related lava flow, which widens to 8 m (annotation 2), forming a lava levee of about 20–30 cm (annotation 3). The 1979 eruptive fissure is also visible at two other (aligned) locations (annotations 4 and 5), where spatter deposits have been recognized. At the center of the 3D model, there is the lowest eruptive vent of the 1928 eruption, with a crater-like morphology (annotation 6). Moving to the far right, annotations 7 and 8 show two major spatter ramparts, older than the 1928 and 1979 eruptions, both striking ENE-WSW. Annotations 9 and 10 highlight the presence of two trails in recent pyroclastic products.

4.3. 1928 Euptive Fissure and 1979 Lava Flows

Geostop 3, which encompasses an area of about 330 m × 190 m, clearly shows the ENE-striking eruptive fissure related to the 1928 event, which is nowadays recognizable as two parallel spatter ramparts as long as 290 m and 4 m high (Figure 2a and Figure 5). The area is covered by recent pyroclastic deposits that have hidden the 1928 lava products; indeed, the 1979 lava flow, which is clearly recognizable to the south, enlarges downhill and covers the southern side of the 1928 eruption, partially filling it. The morphology of the 1979 lava flow is of the aa type; along the lava deposit, it is possible to observe an empty channel and lava levee structures.
The first part of the video, with the drone flying in an upslope direction, shows in extreme detail an enormous spatter rampart to the left, as well as the levee bordering the 1979 lava flow. Moreover, the site where the 1928 fracture is almost entirely covered by the deviation of a 1979 lava flow lobe is shown in great detail. The second part shows the two ENE-striking spatter ramparts, formed aside of the 1928 eruptive fissure, which is nowadays entirely covered by recent pyroclastic deposits.
VG3, which is shown oriented with respect to the north, enables observing, with breathtaking precision, the geometry of the eruptive fissure, striking ENE, parallel to the spatter rampart in annotations 1, 2 and 3, induced by the 1928 eruption. Then, following the 1928 eruptive fissure downhill, near a tree, we can notice a series of spatter products emitted by the fissure. Immediately downslope, a lava flow from the 1979 event can be seen advancing toward the fracture, partially filling it and covering the southern side of the 1928 eruptive fissure (annotation 4). Here, we can also observe the morphology of the aa lava flows belonging to the 1979 eruption. It is possible to notice two levees (annotations 5 and 6) that border one of the 1979 lava flows with the remaining empty channel (annotation 7), which widened downhill and gave rise to multiple and narrow lava flows (annotation 8). The whole northern portion of VG3 is a flat slope, composed of older products and disseminated with recent pyroclastic materials from explosive activity at the volcano (annotation 9). It is worth noting that the surface of the flows from the 1979 event is littered with pyroclastic debris. Annotation 10 shows the location of a hiking path.

4.4. The 1979 Lava Field Covering the 1928 Deposits and an Older Spatter Cone

Geostop 4, which encompasses an area of about 310 m × 150 m, shows the intermediate part of the 1979 lava flow, where it covers one side of the 1928 eruptive fissures and an older spatter rampart (Figure 2a and Figure 6). This lava flow, which here is as large as about 65 m uphill and as narrow as 45 m downhill, shows a clear aa morphology with ogives suggesting downward flowing. Furthermore, it is possible to observe the presence of smaller lava flows, highlighted by empty channels and levees, which cover the lower part of a spatter rampart to the SE, which reaches an elevation of 18 m from the ground. To the NE, these lava flows partially filled the eruptive fissure related to the 1928 event, and they also covered the related deposits.
The video starts with the drone flying to the SE, firstly showing the older 1928 lava flow covered by recent pyroclastic deposits, then the 1979 lava flow, which partially filled the 1928 eruptive fissure, as highlighted by spatter deposits in the left part of the video. In the central part, it is possible to recognize the 1979 lava flows that run downhill, while on the right, the same lava flow covers the lower part of an older spatter rampart; afterward, the video moves slightly downhill, thus showing the aa morphology of such lava deposits.
VG4 is dominated by a gentle slope, marked by the superimposition of the 1979 lava flows on the deposits of the 1928 eruption, emitted by the corresponding fracture. Annotations 1, 2 and 3 point to several spatter remnants, which were produced by the 1928 eruptive fissure. They are ENE aligned and represent the northern side of the fissure, whereas the southern side is covered by the 1979 lava flow. In the central part, several 1979 lava flows parallel to each other are clearly visible, with distinctive ogives that are formed by lava moving downward (annotations 4 and 5) and show the flow splitting in two parts (annotation 6). These lava flows are bordered by a minor 0.5–1 m high levee (annotation 7) along the SE side. Near such a border, it is possible to recognize the northern portion of a major, older spatter cone, as high as 18 m (annotation 8); at its base, it is possible to observe the 1979 lava flow overlapping it, confirming that the cone is older than the lava flow by geological contact (annotation 9). The final feature of VG4 is visible downslope, where a major, 3 m high levee bordering one of the lava flows emitted during the 1979 event can be observed (annotation 10).

4.5. End of the 1979 Lava Flow

Geostop 5, which is located at an altitude between 1720 and 1820 m a.s.l. (Figure 2a) and encompasses an area of about 400 m × 200 m, is focused on showing the further part of the 1979 lava flow, highlighting where it stopped entirely (Figure 7); the lava flow here is as high as 3 m and about 48 m wide. It still looks very fresh, as if it had been emitted a short while ago. In such places, spatter deposits related to the 1928 eruption are recognizable, suggesting the presence of the eruptive fissure below the 1979 lava flow. More upslope, it is possible to observe some textbook examples of lava levees related to the 1979 event, which clearly cover an empty lava channel, as large as 48 m, related to the 1928 eruption.
The video firstly shows the lava lobe of the 1979 lava flow toward WSW uphill, covering the older 1928 lava flow deposit, which is nowadays mostly covered by recent pyroclastic deposits. An empty lava channel related to the 1928 eruption is shown, now mostly covered by recent deposits, whereas a lava levee is recognizable on the left side of the video. Finally, the video shows the lava flow from uphill to downhill, where it is possible to recognize the aa morphology and the presence of several lava flows, highlighted by the presence of ogive structures. The end of the video features a textbook example of a lava levee in its central part. On the left side, the older and now empty 1928 lava flow is shown, with a 1928-related lava levee close to the vegetation/trees limit in the central/upper part of the video.
VG 5, which is shown oriented with respect to the north, shows, with outstanding clarity, the morphology of the 1979 lava flow, here covering the older 1928 lava flow and spatter deposits. Approaching the final portion of the slope, it is possible to notice (annotation 1) the site where the lava stopped, with a front as high as 3 m, and where a secondary flow (annotation 2) moved downward between two levees, one of which (annotation 3) is about 3 m high, its end highlighted by annotation 4. At annotation 5, we can appreciate the evidence of the eruptive activity dating back to 1928: a spatter rampart, about 1.5 m high. Moving on, we have a chance to observe a textbook example of a contact between two lava flows, both belonging to the 1979 eruption (annotation 6). Looking further uphill, a major levee (about as high as 3 m) borders the lava flow to its northern side (annotation 7). Moving to annotations 8, 9 and 10, we observe the remnants of the underlying 1928 lava flow: respectively, two 0.50 m high levees (8 and 9) bordering a now-empty lava channel as wide as 40 m.

4.6. 1928 Eruptive Fissure and Related Spatter Ramparts

Geostop 6, which represents the last one in the upper portion of the geotrail and encompasses an area of about 110 m × 50 m, is focused on a textbook example of an ENE-striking eruptive fissure related to the 1928 eruption event (Figure 2a), from which a series of spatter deposits were emitted, as well as minor lava flows, attested by isolated lava levees (Figure 8). The eruptive fissure is characterized by an aperture of 0.5 m; all along it, several spatter deposits are present, forming two parallel spatter ramparts, about 1 m high. The eruptive fissure continues toward the ENE and is clearly recognizable for about 120 m beyond the road, as highlighted in the UAV-based video.
The video firstly shows geostop 6, on the left part; in the central part, the 1928 lava flow is shown, which is nowadays covered by recent pyroclastic deposits. In the second part, the video shows the prolongation of the eruptive fissure toward the ENE, beyond the road. The fissure is characterized by very well-recognizable spatter deposits at its sides. The 1928 lava flow is hidden and covered by recent pyroclastic deposits.
VG 6 is shown oriented toward the north. To the west, it is possible to recognize a series of spatter deposits (annotation 1) related to the 1928 eruption. In the central part of the 3D model, the eruptive fissure is clearly visible as a gaping fracture (annotation 2), with which several spatter deposits are associated (annotations 3 and 4), all aligned along the same trend of the fissure. Downslope of annotation 4, a gaping crack in the lava floor is visible (annotation 5, as wide as 2 m), most likely related to the presence of the dike that fed the above-mentioned eruptive fissure. Outside of the main fissure direction, there are two isolated lava levees (annotations 6 and 7), as high as about 0.5–0.8 m. Downslope, in the easternmost part of VG6, we can clearly observe two lava levees (annotations 8 and 9), as high as 0.5–0.8 m, which confine an empty lava channel as large as 8 m (annotation 10).

4.7. Further 1928 Eruptive Centers

Geostop 7, which represents the first one in the lower portion of the virtual geotrail and encompasses an area of about 300 m × 200 m, is focused on further eruptive centers related to the 1928 eruption, from which the lava flow that reached the Mascali village was outpoured (Figure 2b). Here, it is possible to observe a spatter and scoria cone, ENE elongated, about 30 m × 20 m and 4.5 m high; the cone is clearly affected by a breaching of the edifice, from which the lava flow started moving toward the SE. In the same geostop, WSW of the main edifice, some minor small spatter cones are present, all aligned along the same ENE-striking eruptive fissure (Figure 9). Several lava flows were emitted by this eruptive fissure, as shown in the video and in the 3D model.
The video starts by showing geostop 7 from its eastern part; subsequently, the drone flies to the W, mostly parallel to the ENE-striking eruptive fissure where the main volcanic edifice and the minor ones grew up. Firstly, it is possible to observe a series of lava flows, which can be distinguished by a typically rugged aa morphology. Then, the drone flies over the 4.5 m high volcanic cone; afterward, the other minor vents are shown, aligned along the ENE-striking eruptive fissure. It is worth noting that a lava flow was issued from the first vent, whereas the others are recognizable, as they are marked by spatter ramparts.
By scanning the lower QR code, VG7 opens up, oriented with respect to the north. At the center of the 3D model, the above-cited spatter and scoria cone can be observed (annotation 1); downslope, in correspondence with the edifice breaching, a pahoehoe lava flow (annotation 2) moved down to the SE, with ogives that are as large as about 10–15 cm. Downslope of the lava flow, there is an empty lava channel (annotation 3) as large as about 5 m, bordered by levees as high as 2 m from the channel floor (annotation 4). East of the empty lava channel, there is a very well-developed aa lava flow, about 15 m wide, with distinctive ogives that suggest a flowing direction to the E (annotation 5). To the left side of VG7, more to the west, there is a major aa lava flow, about 20 m wide (annotation 6), whose point of emission is located further upslope, where a smaller vent is present, characterized by two 2 m high spatter ramparts (annotation 7) from which the lava flow was emitted. Near the vent, it is still possible to observe the corresponding 60 cm high lava levee (annotation 8). Downslope, the lava flow shows ogives, which are far more common in pahoehoe lava flows but can also occur in aa flows. In the eastern part of VG7, a 4.5 m wide empty lava channel is shown, bordered by two levees, as high as 20 cm (annotation 9); the lava flowed to the SE, as demonstrated by the enlargement of the empty channel. Finally, a trail is also highlighted (annotation 10).

4.8. Further 1928 Lava Flows

Geostop 8, which represents the second and last one in the lower portion of the virtual geotrail and encompasses an area of about 800 m × 600 m, is focused on enormous and impressive lava flows emitted along the eruptive fissures shown in geostop 7, which represent the further eruptive centers, close to each other, related to the 1928 eruption (Figure 2b). These lava flows reached and buried the Mascali village (Figure 1c). Furthermore, it is possible to observe a series of lava flows emitted along the eruptive fissure (cfr Section 4.7), which flowed toward E/ESE cascading from an altitude of 1120 m to 980 m, thus covering one scarp of the Ripe della Naca fault system (Figure 10). As they reached the bottom of the slope, they continued flowing toward the SE.
The video starts by showing geostop 8 from its upper part; subsequently, the drone flies to the ENE, parallel to the fault scarp, showing the lava flows cascading down the slope. The longitudinal length of the slope, measured from the point in which the terrain turns from horizontal to dipping, is about 170 m. Then, the view rotates, providing a panoramic and complete scenery of the lower horizontal swath of land, where a few roads, cars and houses are present as scale. Next, the drone flies back along a WNW direction, showing the lava flows that crop out in the upper part of the geostop. In the final part, the video clearly shows the surface of the lava flows, which is distinguished by a typically rugged aa morphology; in the very last part, it is possible to observe a lava lobe, road for scale.
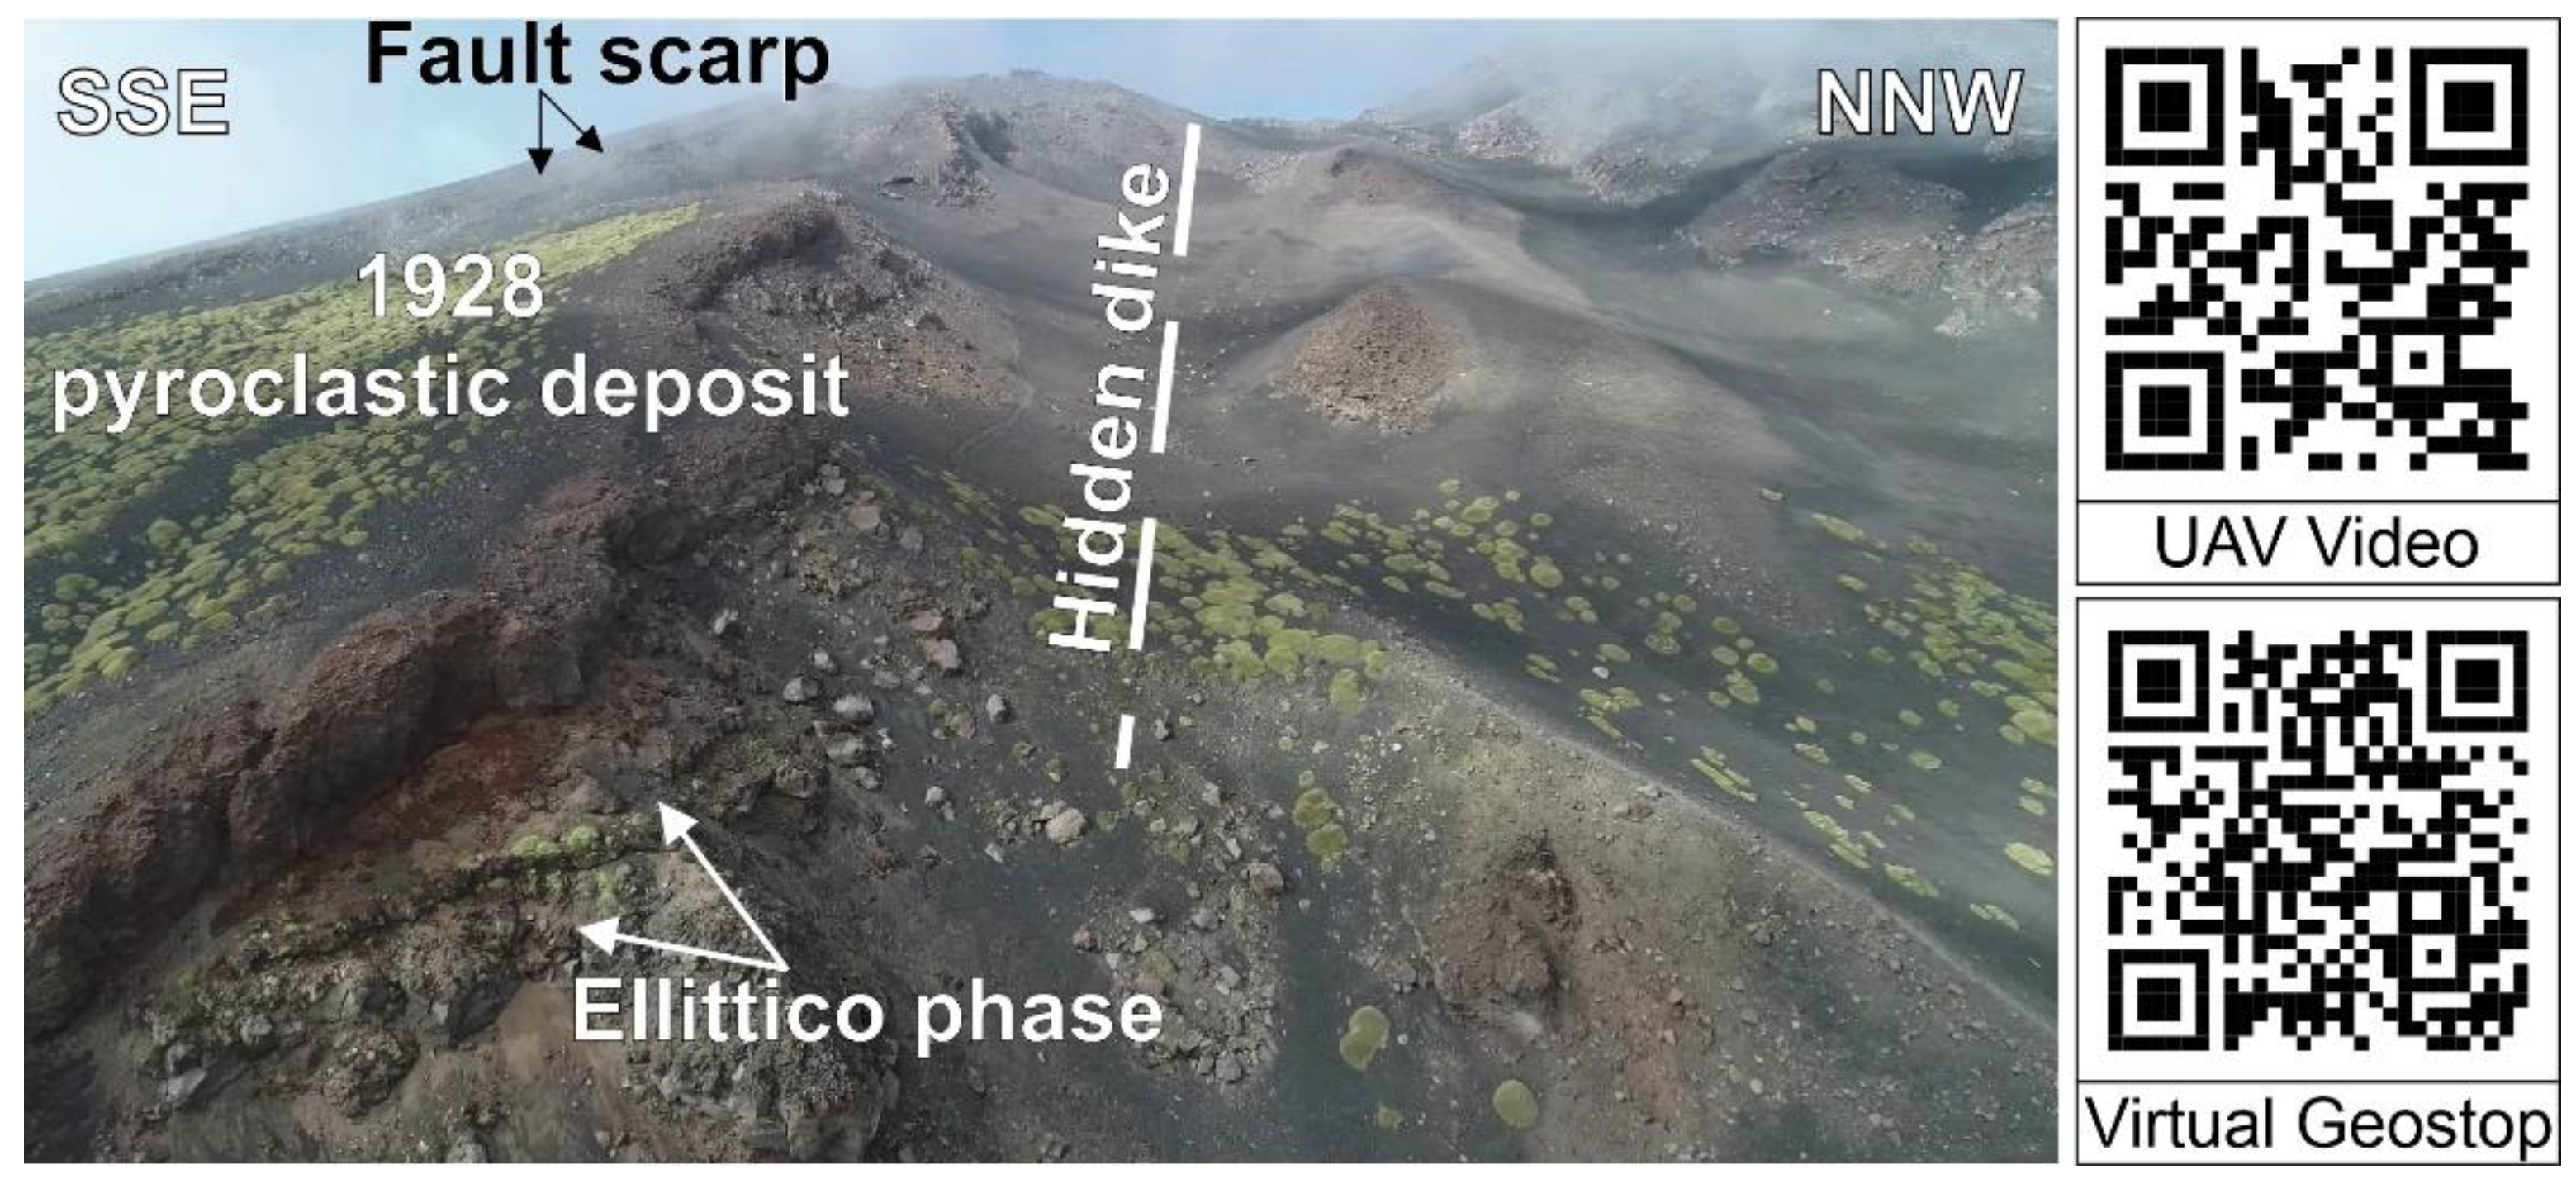
VG8 is the last virtual geostop of the trail, and it is oriented with respect to the north; it shows enormous lava flows, of the aa type, flowing down the slope and adapting their geometry to the morphology of the terrain on which they flow. The main volcanic center in the area is shown by annotation 1 (for further details, see geostop 7), from which a 15 m wide lava flow was emitted; nowadays, it is possible to observe the empty channel with two symmetrical lava levees as high as 2 m (annotation 2). A relevant, textbook example of a 22 m wide aa lava flow is shown at annotations 3, 4 and 5, displaying two symmetrical lava levees that rise 3.5 m from the ground, within which the lava flow is confined. The flow is distinguished by very well-developed ogives, whose convexity is oriented downslope, thus indicating the direction of movement of the lava flow. Another example is shown in annotation 7, where the lava flow cascades downhill, with the path providing the scale. Finally, an example that enables comparing the relative ages of different lava flows is given by a younger lava flow (annotation 8), belonging to the same 1928 eruptive event, superimposed on another and older lava flow (annotation 9), both cascading downhill. Annotation 10 shows cars and a road for scale.

5. Discussion

In the present work, we showcase a modern methodology, which we have developed with the purpose of engaging a broad audience (ranging from students to the lay public interested in volcanological features) in geological exploration. We have accomplished this goal through an interactive virtual geotrail focused on the most spectacular eruptive centers related to the 1928 and 1979 eruptions, which took place on the E flank of Mt. Etna, Italy. This area is particularly interesting because the 1928 eruption is a case of a lateral eruption that was capable of destroying a village located about 2500 m below the overall uppermost vent of this event. In addition, along its entire length, it is possible to observe and analyze a number of different volcanic morphologies, as well as the contact between the 1928 lava and the more recent 1979 lava flow.
Our virtual geotrail is defined as “interactive” because it provides the users with the possibility to actively navigate the surrounding environment using immersive and non-immersive VR; in doing so, the viewers will have a chance to understand outstanding geological features and processes through tailored notes and descriptions. This approach is markedly different from the so-called virtual tours, which do not provide such opportunity, though they focus on showing key outcrops, geo-located on a GIS platform, which can be studied by students through the visualization of 2D images [19,20,21] or 3D digital outcrop models [22,23,45], through the use of a computer or other mobile devices. It is worth noting that Pasquaré Mariotto et al. [17] used a mixed approach, consisting of 3D models that can be navigated using immersive or non-immersive VR, combined with a WebGIS platform (https://arcg.is/1e4erK0, accessed on 26 January 2022) to enhance geoheritage communication.
The usefulness of online-based applications, in terms of virtual tours for geological exploration, was documented by Allen [46], who developed one that can be used on a smartphone, tablet or computer, providing location-specific descriptions of the geology and geomorphology featured along the Perimeter Trail (Ouray, CO, USA). As the user is walking along the trail, a number of waypoints with related descriptions pop up on an interactive base map. Nevertheless, this methodology is still tightly linked with “in person” field trips.
Indeed, virtual tours have supported teaching activities in earth science by improving the students’ interest, as well as learning efficiency [20,21]. In fact, such tools can be employed at different stages, as digital reviews before field campaigns and as digital assets substitute for field surveys [20]. Furthermore, this method can also be proposed to younger students, as suggested by Magagna et al. [47], who came up with 20 virtual geological tours around Italy, using 2D images and maps, with the purpose of arousing curiosity and raising awareness of the younger generation about the stunning geological heritage characterizing the Italian peninsula. The approach we present in this work, which we have defined as “immersive virtual geotrail”, represents an important advancement if compared to the above-described methodologies, which were used in the development of virtual tours in extremely relevant areas in terms of their geoheritage (e.g., Sesia-Val Grande UNESCO Global Geopark in Perotti et al. [24]; Langhe and Monferrato areas in Giordano et al. [48]). Such tours are accessible through a website and a virtual application, but there is no possibility to actively navigate the environment in an immersive manner.
The virtual geotrail features eight geostops that follow the temporal evolution of the 1928 eruption. For each of them, we provide a UAV-based video and a 3D model in the form of VG, each explorable in both the immersive and non-immersive VR [44]. Geological knowledge is made available without time or space limitations, with positive implications for geo-education and geotourism.
These resources have been made easily available by scanning the corresponding QR code. This increases the accessibility of electronic material through smartphones and tablets, which are nowadays increasingly used for educational and dissemination purposes. Considering the latter point, we have made the geotrail available in the paper and in poster format (Supplementary Material), which can be printed for teaching. In the poster, all QR codes are provided as well.
Thanks to our technique, students, academics and non-academics can also explore each geostop by visualizing the 3D model on their smartphone or using a cardboard for VR. The latter is only one of the recent low-cost and user-friendly solutions that made VR more widely used in the fields of geo-education [49,50], research [15,41,51] and industry [52].
We believe that our approach represents a crucial advancement, which provides important and innovative benefits, for several reasons: (i) it has an enormous potential in helping users to learn geology in a more interactive way, thus enhancing their interest and improving learning efficiency; (ii) it increases accessibility by opening up to people affected by motor disabilities the possibility of studying the VG personally; (iii) it has the advantage of being cost effective, especially for earth science students, because geological outcrops can be brought in the lab, and there is no need to travel thousands of kilometers to reach them; (iv) it can also potentially reduce travel expenses and carbon emissions [53], and decrease unnecessary energy consumption; (v) it bridges the gap between the lay public and earth science, raising people’s awareness of the value of the territory and encouraging them to protect and preserve it; and (vi) it allows researchers to virtually travel to key geological areas even in difficult times, such as the COVID-19 pandemic, when travel restrictions and lockdown periods can severely affect earth science teaching and research activities. Indeed, teaching usually entails fieldwork with the involvement of numerous student groups, while research activities often require conducting field surveys in foreign countries.
Additionally, the pros and cons of organizing online-based alternatives to in-person scientific activities were analyzed in detail in the past, mainly over the past two years, since the COVID-19 outbreak. For example, Roos et al. [54] focused on virtual meetings and conferences as opportunities to reduce the environmental impact and accessibility barriers associated with in-person meetings.
In addition to the above, this technique can be used by students to examine the geological field route beforehand, so as to be better prepared for it. A virtual geotrail can be used as an alternative plan for field trip teaching, in case the actual field trip cannot be effectuated. It can provide a chance to visualize a potential study area before scheduling a field trip. We are aware that VR-based geological exploration cannot substitute classical field trips, which are crucial for a complete understanding of geological objects and processes. However, it can surely become a viable and helpful alternative to traditional fieldwork.

6. Conclusions

In the present work, we devised a virtual geotrail on the eastern flank of Mt. Etna volcano (Italy), composed of eight outstanding geostops, where features left by the famous 1928 and the minor 1979 historical eruptions can be visualized with stunning accuracy. Students, as well as the lay public, can access eight virtual geostops (VGs) and fly above them by scanning a QR code on the printed or electronic version of the manuscript, as well as on a poster, which we have provided as Supplementary Material. The VGs that compose the virtual geotrail were built based on the application of the structure-from-motion (SfM) photogrammetry technique, which enables obtaining high-resolution photorealistic 3D models as final products by producing three-dimensional shapes from two-dimensional image sequences. The images were captured by using unmanned aerial vehicles (UAVs) that also filmed a number of videos, which are also available by clicking on the appropriate QR codes on the paper or poster. Our approach can be considered key to teaching and learning geoscience even in difficult times (for instance, the restrictions imposed by the COVID-19 pandemic) and, at the same time, reducing carbon emissions. In fact, it enables accessing geological areas and landforms online, thus making it unnecessary for students and teachers to actually be in the field in person. The same advantage is shared by people affected by motor disabilities, who would never have a chance to access an actual geotrail but now have a chance to do it. Thanks to our technique, students, academics and non-academics can explore each geostop by visualizing the 3D model on their smartphone or using a cardboard for VR; furthermore, they can conduct the exploration personally through immersive and non-immersive virtual reality, improving their knowledge without temporal or spatial limitations. We acknowledge that geological exploration based on VR techniques is not going to make actual field trips a thing of the past; studying geological features directly in the field is, and always will be, the most suitable way to investigate geological phenomena and processes. However, our cutting-edge technique can become complementary to traditional field teaching. Finally, our geotrail can be considered suitable for raising awareness of the public about the need to foster, safeguard, protect and popularize volcanic geoheritage in an environmentally unique area. Moreover, geotourism could benefit from our field geotrail (not the virtual counterpart of it) because our eight geostops contain a summary of an extremely wide gamut of volcanic and geomorphological features and phenomena.

Supplementary Materials

The following supporting information can be downloaded at: https://www.mdpi.com/article/10.3390/land11030377/s1, The virtual geotrail is available in poster format for teaching purposes.

Author Contributions

F.P.M. and F.L.B. have organized the manuscript and contributed to all of its chapters. A.T., E.D.B., N.C., E.R. and M.N. contributed to the geological background, to the description of the eight geostops and to the discussion section. L.F. and M.C. contributed to the methodology and discussion sections. All authors have read and agreed to the published version of the manuscript.

Funding

This work has been carried out under the framework of the Task Force 2021-TF2 “Deformation and magmatic processes from the lithosphere to the surface: integrated multidisciplinary approaches”, Chair A. Tibaldi, of the International Lithosphere Program (https://ilp.nju.edu.cn/main.htm, accessed on 26 January 2022). It is also an outcome of the Virtual Reality lab for Earth Sciences-GeoVires lab (https://geovires.unimib.it/, accessed on 26 January 2022). Agisoft Metashape is acknowledged for photogrammetric data processing.

Institutional Review Board Statement

Not applicable.

Informed Consent Statement

Not applicable.

Data Availability Statement

No new data were created or analyzed in this study. Data sharing is not applicable to this article.

Acknowledgments

We wish to thank the Academic Editor and three anonymous reviewers, whose precious comments and suggestions enabled us to substantially improve the quality of our work. We kindly acknowledge the Parco dell’Etna (https://parcoetna.it/, accessed on 26 January 2022) geopark for enabling us to perform UAV surveys and to carry out teaching activities; we are also grateful for the logistic support provided by the staff at Rifugio Citelli (https://www.rifugiocitelli.it/, accessed on 26 January 2022).

Conflicts of Interest

The authors declare no conflict of interest.

References

  1. Bonali, F.L.; Russo, E.; Vitello, F.; Antoniou, V.; Marchese, F.; Fallati, L.; Bracchi, V.; Corti, N.; Savini, A.; Whitworth, M.; et al. How Academics and the Public Experienced Immersive Virtual Reality for Geo-Education. Geosciences 2022, 12, 9. [Google Scholar] [CrossRef]
  2. Eberhard, R. Pattern and Process: Towards a Regional Approach to National Estate Assessment of Geodiversity; Technical Series No. 2; Eberhard, R., Ed.; Australian Heritage Commission and Environment Forest Taskforce: Canberra, Australia, 1997. [Google Scholar]
  3. Brocx, M.; Semeniuk, V. Geoheritage and geoconservation history, definition, scope and scale. J. R. Soc. West. Aust. 2007, 90, 53–87. [Google Scholar]
  4. Asrat, A.; Demissie, M.; Mogessie, A. Geoheritage conservation in Ethiopia: The case of the Simien mountains. Quaest. Geogr. 2012, 31, 7–23. [Google Scholar] [CrossRef] [Green Version]
  5. Fassoulas, C.; Mouriki, D.; Dimitriou-Nikolakis, P.; Iliopoulos, G. Quantitative assessment of geotopes as an effective tool for geoheritage management. Geoheritage 2012, 4, 177–193. [Google Scholar] [CrossRef]
  6. Wimbledon, W.A.P.; Smith-Meyer, S. Geoheritage in Europe and Its Conservation; Wimbledon, W.A.P., Smith-Meyer, S., Eds.; ProGEO: Oslo, Norway, 2012; p. 405. [Google Scholar]
  7. Bruno, D.E.; Crowley, B.E.; Gutak, J.M.; Moroni, A.; Nazarenko, O.V.; Oheim, K.B.; Ruban, D.A.; Tiess, G.; Zorina, S.O. Paleogeography as geological heritage: Developing geosite classification. Earth Sci. Rev. 2014, 138, 300–312. [Google Scholar] [CrossRef]
  8. Brilha, J. Inventory and Quantitative Assessment of Geosites and Geodiversity Sites: A Review. Geoheritage 2016, 8, 119–134. [Google Scholar] [CrossRef] [Green Version]
  9. Coratza, P.; Bollati, I.M.; Panizza, V.; Brandolini, P.; Castaldini, D.; Cucchi, F.; Deiana, G.; Del Monte, M.; Faccini, F.; Finocchiaro, F.; et al. Advances in Geoheritage Mapping: Application to Iconic Geomorphological Examples from the Italian Landscape. Sustainability 2021, 13, 11538. [Google Scholar] [CrossRef]
  10. Venturini, C.; Pasquaré Mariotto, F. Geoheritage Promotion Through an Interactive Exhibition: A Case Study from the Carnic Alps, NE Italy. Geoheritage 2018, 11, 459–469. [Google Scholar] [CrossRef]
  11. Trinks, I.; Clegg, P.; McCaffrey, K.; Jones, R.; Hobbs, R.; Holdsworth, B.; Holliman, N.; Imber, J.; Waggott, S.; Wilson, R. Mapping and analysing virtual outcrops. Visual Geosci. 2005, 10, 13–19. [Google Scholar] [CrossRef]
  12. Edler, D.; Keil, J.; Wiedenlübbert, T.; Sossna, M.; Kühne, O.; Dickmann, F. Immersive VR Experience of Redeveloped Post-Industrial Sites: The Example of “Zeche Holland” in Bochum-Wattenscheid. J. Cartogr. Geogr. Inf. 2019, 69, 267–284. [Google Scholar] [CrossRef] [Green Version]
  13. Pasquaré Mariotto, F.; Bonali, F.L. Virtual Geosites as Innovative Tools for Geoheritage Popularization: A Case Study from Eastern Iceland. Geosciences 2021, 11, 149. [Google Scholar] [CrossRef]
  14. Krokos, M.; Bonali, F.L.; Vitello, F.; Varvara, A.; Becciani, U.; Russo, E.; Marchese, F.; Fallati, L.; Nomikou, P.; Kearl, M.; et al. Workflows for virtual reality visualisation and navigation scenarios in earth sciences. In Proceedings of the 5th International Conference on Geographical Information Systems Theory, Applications and Management, Heraklion, Crete, Greece, 3–5 May 2019; SciTePress: Setùbal, Portugal, 2019; pp. 297–304. [Google Scholar]
  15. Tibaldi, A.; Bonali, F.L.; Vitello, F.; Delage, E.; Nomikou, P.; Antoniou, V.; Becciani, U.; Van Wyk de Vries, B.; Krokos, M.; Whitworth, M. Real world-based immersive Virtual Reality for research, teaching and communication in volcanology. Bull. Volcanol. 2020, 82, 38. [Google Scholar] [CrossRef]
  16. Pasquaré Mariotto, F.; Bonali, F.L.; Venturini, C. Iceland, an open-air museum for geoheritage and Earth science communication purposes. Resources 2020, 9, 14. [Google Scholar] [CrossRef] [Green Version]
  17. Pasquaré Mariotto, F.; Antoniou, V.; Drymoni, K.; Bonali, F.L.; Nomikou, P.; Fallati, L.; Karatzaferis, O.; Vlasopoulos, O. Virtual Geosite Communication through a WebGIS Platform: A Case Study from Santorini Island (Greece). Appl. Sci. 2021, 11, 5466. [Google Scholar] [CrossRef]
  18. Chang, S.C.; Hsu, T.C.; Jong, M.S.Y. Integration of the peer assessment approach with a virtual reality design system for learning earth science. Comput. Educ. 2020, 146, 103758. [Google Scholar] [CrossRef]
  19. Hurst, S.D. Use of “virtual” field trips in teaching introductory geology. Comput. Geosci. 1998, 24, 653–658. [Google Scholar] [CrossRef] [Green Version]
  20. Warne, M.; Owies, D.; McNolty, G. Exploration of a first year university multimedia module on field geology. In Beyond the Comfort Zone, Proceedings of the 21st ASCILITE Conference, Perth, Australia, 5–8 December 2003; ASCILITE: Perth, Australia, 2004; pp. 924–933. [Google Scholar]
  21. Deng, C.; Zhou, Z.; Li, W.; Hou, B. A panoramic geology field trip system using image-based rendering. In Proceedings of the IEEE 40th Annual Computer Software and Applications Conference (COMPSAC), Atlanta, GA, USA, 10–14 June 2016; Volume 2, pp. 264–268. [Google Scholar]
  22. Martínez-Graña, A.M.; Goy, J.L.; Cimarra, C.A. A virtual tour of geological heritage: Valourising geodiversity using Google Earth and QR code. Comput. Geosci. 2013, 61, 83–93. [Google Scholar] [CrossRef]
  23. McCaffrey, K.J.W.; Hodgetts, D.; Howell, J.; Hunt, D.; Imber, J.; Jones, R.R.; Tomasso, M.; Thurmond, J.; Viseur, S. Virtual Fieldtrips for Petroleum Geoscientists; Petroleum Geology Conference Series; Geological Society: London, UK, 2010; Volume 7, No.1; pp. 19–26. [Google Scholar]
  24. Perotti, L.; Bollati, I.M.; Viani, C.; Zanoletti, E.; Caironi, V.; Pelfini, M.; Giardino, M. Fieldtrips and Virtual Tours as Geotourism Resources: Examples from the Sesia Val Grande UNESCO Global Geopark (NW Italy). Resources 2020, 9, 63. [Google Scholar] [CrossRef]
  25. Beltrán-Yanes, E.; Dóniz-Páez, J.; Esquivel-Sigut, I. Chinyero Volcanic Landscape Trail (Canary Islands, Spain): A Geotourism Proposal to Identify Natural and Cultural Heritage in Volcanic Areas. Geosciences 2020, 10, 453. [Google Scholar] [CrossRef]
  26. Lanzafame, G.; Neri, M.; Coltelli, M.; Lodato, L.; Rust, D. North-South compression in the Nit. Etna region (Sicily): Spatial and temporal distribution. Acta Vulcanol. 1997, 9, 121–134. [Google Scholar]
  27. Cocina, O.; Neri, G.; Privitera, E.; Spampinato, S. Stress tensor computations in the Mount Etna area (Southern Italy) and tectonic implications. J. Geodyn. 1997, 23, 109–127. [Google Scholar] [CrossRef]
  28. Cocina, O.; Neri, G.; Privitera, E.; Spampinato, S. Seismogenic stress field beneath Mt. Etna (South Italy) and possible relationships with volcano-tectonic features. J. Volcanol. Geoth. Res. 1998, 83, 335–348. [Google Scholar]
  29. Acocella, V.; Neri, M. Dike propagation in volcanic edifices: Overview and possible developments. Tectonophysics 2009, 471, 67–77. [Google Scholar] [CrossRef]
  30. Cappello, A.; Neri, M.; Acocella, V.; Gallo, G.; Vicari, A.; Del Negro, C. Spatial vent opening probability map of Mt. Etna volcano (Sicily, Italy). Bull. Volcanol. 2012, 74, 2083–2094. [Google Scholar] [CrossRef]
  31. Tibaldi, A.; Bonali, F.L.; Corti, N.; Russo, E.; Drymoni, K.; De Beni, E.; Branca, S.; Neri, M.; Cantarero, M.; Pasquarè Mariotto, F. Surface deformation during the 1928 fissure eruption of Mt Etna (Italy): Insights from field data and FEM numerical modelling. Tectonophysics 2022, in press. [Google Scholar]
  32. Branca, S.; De Beni, E.; Chester, D.; Duncan, A.; Lotteri, A. The 1928 eruption of Mount Etna (Italy): Reconstructing lava flow evolution and the destruction and recovery of the town of Mascali. J. Volcanol. Geoth. Res. 2017, 335, 54–70. [Google Scholar] [CrossRef]
  33. Branca, S.; Del Carlo, P. Eruption of Mt Etna during the past 3.200 years: A revised compilation integrating the historical and stratigraphic records. Geophys. Monogr. 2004, 143, 1–27. [Google Scholar]
  34. Villani, F.; Pucci, S.; Azzaro, R.; Civico, R.; Cinti, F.R.; Pizzimenti, L.; Tarabusi, G.; Branca, S.; Brunori, C.A.; Caciagli, M.; et al. Surface ruptures database related to the 26 December 2018, MW 4.9 Mt. Etna earthquake, southern Italy. Sci. Data 2020, 7, 42. [Google Scholar]
  35. Branca, S.; Coltelli, M.; Groppelli, G.; Lentini, F. Geological map of Etna volcano, 1: 50,000 scale. Ital. J. Geosci. 2011, 130, 265–291. [Google Scholar]
  36. Bonali, F.L.; Tibaldi, A.; Marchese, F.; Fallati, L.; Russo, E.; Corselli, C.; Savini, A. UAV-based surveying in volcano-tectonics: An example from the Iceland rift. J. Struct. Geol. 2019, 121, 46–64. [Google Scholar]
  37. Tibaldi, A.; Corti, N.; De Beni, E.; Bonali, F.L.; Falsaperla, S.; Langer, H.; Neri, M.; Cantarero, M.; Reitano, D.; Fallati, L. Mapping and evaluating kinematics and the stress and strain field at active faults and fissures: A comparison between field and drone data at the NE rift, Mt Etna (Italy). Solid Earth 2021, 12, 801–816. [Google Scholar] [CrossRef]
  38. Westoby, M.J.; Brasington, J.; Glasser, N.F.; Hambrey, M.J.; Reynolds, J.M. Structure-from-Motion’photogrammetry: A low-cost, effective tool for geoscience applications. Geomorphology 2012, 179, 300–314. [Google Scholar] [CrossRef] [Green Version]
  39. Stal, C.; Bourgeois, J.; De Maeyer, P.; De Mulder, G.; De Wulf, A.; Goossens, R.; Hendrickx, M.; Nuttens, T.; Stichelbaut, B. Test case on the quality analysis of structure from motion in airborne applications. In Proceedings of the 32nd EARSeL Symposium: Advances in Geosciences, Mykonos, Greece, 21–24 May 2012; p. 11. [Google Scholar]
  40. James, M.R.; Robson, S.; Smith, M.W. 3D uncertainty based topographic change detection with structure from motion photogrammetry: Precision maps for ground control and directly georeferenced surveys. Earth Surf. Process. Landf. 2017, 42, 1769–1788. [Google Scholar] [CrossRef]
  41. Antoniou, V.; Bonali, F.L.; Nomikou, P.; Tibaldi, A.; Melissinos, P.; Mariotto, F.P.; Vitello, F.R.; Krokos, M.; Whitworth, M. Integrating Virtual Reality and GIS Tools for Geological Mapping, Data Collection and Analysis: An Example from the Metaxa Mine, Santorini (Greece). Appl. Sci. 2020, 10, 8317. [Google Scholar] [CrossRef]
  42. Miyahara, K.; Okada, Y. COLLADA-based File Format Supporting Various Attributes of Realistic Objects for VR Applications. In Proceedings of the 2009 International Conference on Complex, Intelligent and Software Intensive Systems, Fukuoka, Japan, 16–19 March 2009; pp. 971–976. [Google Scholar]
  43. Burns, J.H.R.; Delparte, D. Comparison of commercial structure-from-motion photogrammety software used for underwater three-dimensional modeling of coral reef environments. Int. Arch. Photogramm. Remote Sens. Spat. Inf. Sci. 2017, 42, 127. [Google Scholar] [CrossRef] [Green Version]
  44. Choi, D.H.; Dailey-Hebert, A.; Estes, J.S. Emerging Tools and Applications of Virtual Reality in Education; Information Science Reference: Hershey, PA, USA, 2016. [Google Scholar]
  45. González-Delgado, J.A.; Martínez-Graña, A.M.; Civis, J.; Sierro, F.J.; Goy, J.L.; Dabrio, C.J.; Ruiz, F.; González-Regalado, M.L.; Abad, M. Virtual 3D tour of the Neogene palaeontological heritage of Huelva (Guadalquivir Basin, Spain). Environ. Earth Sci. 2015, 73, 4609–4618. [Google Scholar] [CrossRef]
  46. Allen, H.M. Geologic and Geomorphologic Interpretation of the Perimeter Trail, Ouray, Colorado: A Virtual Field Trip Application. Ph.D. Thesis, Texas A & M University, College Station, TX, USA, 2017. [Google Scholar]
  47. Magagna, A.; Ferrero, E.; Giardino, M.; Lozar, F.; Perotti, L. A selection of geological tours for promoting the Italian geological heritage in the secondary schools. Geoheritage 2013, 5, 265–273. [Google Scholar] [CrossRef]
  48. Giordano, E.; Magagna, A.; Ghiraldi, L.; Bertok, C.; Lozar, F.; D’Atri, A.; Dela Pierre, F.; Giardino, M.; Natalicchio, M.; Martire, L.; et al. Multimedia and virtual reality for imaging the climate and environment changes through Earth history: Examples from the Piemonte (NW Italy) geoheritage (PROGEO-Piemonte Project). In Engineering Geology for Society and Territory; Springer: Cham, Switzerland, 2015; Volume 8, pp. 257–260. [Google Scholar]
  49. Mat, R.C.; Shariff, A.R.M.; Zulkifli, A.N.; Rahim, M.S.M.; Mahayudin, M.H. Using game engine for 3D terrain visualization of GIS data: A review. In IOP Conference Series: Earth and Environmental Science; IOP Publishing: Bristol, UK, 2014; Volume 20, p. 012037. [Google Scholar]
  50. Murray, J.W. Building Virtual Reality with Unity and Steam VR; AK Peters/CRC Press: Boca Raton, FL, USA, 2017. [Google Scholar] [CrossRef]
  51. Caravaca, G.; Le Mouélic, S.; Mangold, N.; L’Haridon, J.; Le Deit, L.; Massé, M. 3D digital outcrop model reconstruction of the Kimberley outcrop (Gale crater, Mars) and its integration into Virtual Reality for simulated geological analysis. Planet. Space Sci. 2020, 182, 104808. [Google Scholar] [CrossRef]
  52. Kaiser, P.K.; Henning, J.G.; Cotesta, L.; Dasys, A. Innovations in mine planning and design utilizing collaborative immersive virtual reality (CIRV). In Proceedings of the 104th CIM Annual General Meeting, Vancouver, BC, Canada, 28 April–1 May 2002; pp. 1–7. [Google Scholar]
  53. Dolf, M.; Teehan, P. Reducing the carbon footprint of spectator and team travel at the University of British Columbia’s varsity sports events. Sport Manag. Rev. 2015, 18, 244–255. [Google Scholar] [CrossRef]
  54. Roos, G.; Oláh, J.; Ingle, R.; Kobayashi, R.; Feldt, M. Online conferences-Towards a new (virtual) reality. Comput. Theor. Chem. 2020, 1189, 112975. [Google Scholar] [CrossRef]
Figure 1. (a) Map showing the geodynamic setting. (b) Map showing the main structures of Mt. Etna, with the eastern flank characterized by instability (a,b modified after Villani et al. [34]). (c) The geological map of the eastern flank is shown here, modified from Branca et al. [35]; the deposits related to the 1928 eruption are indicated in blue, and the location of Mascali village is also shown; the most recent and older deposits and older volcanoes are also displayed.
Land 11 00377 g001
Figure 2. (a) Map displaying the location of the virtual geostops along the upper geotrail; the hiking paths that are available in the upper part of the geotrail are also shown (nos. 723 and 723A) and begin from the Rifugio Citelli. (b) Map showing geostops 7–8, located in the locality “Giarrita”, along trail no. 732. Map data © OpenStreetMap contributors, CC BY-SA, https://www.openstreetmap.org/ (accessed on 26 January 2022).
Land 11 00377 g002
Figure 3. The image on the left shows geostop 1 through a WSW-looking UAV-captured picture. The QR codes on the right enable opening the corresponding UAV-captured video and the related VG. By using a mobile phone or a tablet, open up the QR code reader. Hold your device over the QR code, so that it is clearly visible on your screen. Press the notification and wait a few seconds.
Land 11 00377 g003
Figure 4. The image on the left shows geostop 2 through a WSW-looking UAV-captured picture. The QR codes on the right enable opening the corresponding UAV-captured video and the related VG. By using a mobile phone or a tablet, open up the QR code reader. Hold your device over a QR code, so that it is clearly visible on your screen. Press the notification and wait a few seconds.
Land 11 00377 g004
Figure 5. The image on the left shows geostop 3 through a SW-looking UAV-captured picture. The QR codes on the right enable opening the corresponding UAV-captured video and the related VG. By using a mobile phone or a tablet, open up the QR code reader. Hold your device over a QR code, so that it is clearly visible on your screen. Press the notification and wait a few seconds.
Land 11 00377 g005
Figure 6. The image on the left shows geostop 4 through an E-looking UAV-captured picture. The QR codes on the right enable opening the corresponding UAV-captured video and the related VG. By using a mobile phone or a tablet, open up the QR code reader. Hold your device over a QR code, so that it is clearly visible on your screen. Press the notification and wait a few seconds.
Land 11 00377 g006
Figure 7. The image on the left shows geostop 5 through a WSW-looking UAV-captured picture. The QR codes on the right enable opening the corresponding UAV-captured video and the related VG. By using a mobile phone or a tablet, open up the QR code reader. Hold your device over a QR code, so that it is clearly visible on your screen. Press the notification and wait a few seconds.
Land 11 00377 g007
Figure 8. The image on the left shows geostop 6 through a SW-looking UAV-captured picture. The QR codes on the right enable opening the corresponding UAV-captured video and the related VG. By using a mobile phone or a tablet, open up the QR code reader. Hold your device over a QR code, so that it is clearly visible on your screen. Press the notification and wait a few seconds.
Land 11 00377 g008
Figure 9. The image on the left shows geostop 7 through a NW-looking UAV-captured picture, people for scale. The QR codes on the right enable opening the corresponding UAV-captured video and the related VG. By using a mobile phone or a tablet, open up the QR code reader. Hold your device over a QR code, so that it is clearly visible on your screen. Press the notification and wait a few seconds.
Land 11 00377 g009
Figure 10. The image on the left shows geostop 8 through a NE-looking UAV-captured picture. The QR codes on the right enable opening the corresponding UAV-captured video and the related VG. By using a mobile phone or a tablet, open up the QR code reader. Hold your device over a QR code, so that it is clearly visible on your screen. Press the notification and wait a few seconds.
Land 11 00377 g010
Table 1. List of the virtual geostops, together with the elevation range, the title and the corresponding section and figure.
Geostop.SectionTtileElevation (m a.s.l.)Figure
1Section 4.1Huge, aligned 1928 eruptive vents2100 ÷ 2300Figure 3
2Section 4.21979 eruptive fissure2025 ÷ 2090Figure 4
3Section 4.31928 eruptive fissure and 1979 lava flows1860 ÷ 1960Figure 5
4Section 4.4The 1979 lava field covering the 1928 deposits and an older spatter cone1810 ÷ 1885Figure 6
5Section 4.5End of the 1979 lava flow1720 ÷ 1820Figure 7
6Section 4.61928 eruptive fissure and related spatter ramparts1695 ÷ 1715Figure 8
7Section 4.7Further 1928 eruptive centres1160 ÷ 1225Figure 9
8Section 4.8Further 1928 lava flows985 ÷ 1225Figure 10
Publisher’s Note: MDPI stays neutral with regard to jurisdictional claims in published maps and institutional affiliations.

