Article

Seasonal Dynamics of Organic Carbon and Nitrogen in Biomasses of Microorganisms in Arable Mollisols Affected by Different Tillage Systems

1
Soil Science and Soil Conservation Department, National University of Life and Environmental Sciences of Ukraine, 15, Heroyiv Oborony Street, 03041 Kyiv, Ukraine
2
Northeast Institute of Geography and Agricultural Ecology, 138 Harping RD, Harbin 150081, China
3
Institute of Biology and Medicine, Taras Shevchenko National University of Kyiv, Volodymyrska St., 64/13, 01601 Kyiv, Ukraine
*
Author to whom correspondence should be addressed.
Land 2022, 11(4), 486; https://doi.org/10.3390/land11040486
Submission received: 18 February 2022 / Accepted: 22 March 2022 / Published: 27 March 2022
(This article belongs to the Special Issue New Insights in Mollisol Quality and Management)

Abstract

:
Tillage has been reported to induce seasonal changes of organic carbon (Cmicro) and nitrogen (Nmicro) in the biomass of microorganisms. Soil microorganisms execute such ecosystem functions as it is an immediate sink of labile biophil elements; it is an agent of a conversion, catalysis and synthesis of humus substances; it transforms soil contaminants into nonhazardous wastes and it participates in soil aggregation and pedogenesis as a whole. However, the seasonal turnover of microorganisms on arable lands in temperate ecosystems has not been studied at a relevant level. Hence, we are aimed at studying the dynamics of such soil microbial biomass patterns as Cmicro, Nmicro, microbial index (MI = (Cmicro/CTOC)·100%) and CO2-C emissions against the background of 9 years of tillage and 22 years of abandoned (Ab) and fallow (F) usage. Our study was conducted on a long-term experimental site on a Mollisol in Northeast China. The maximum Cmicro and Nmicro contents were recorded at the beginning of the growing season at the 0–10-cm layer and mid-July at the 20–40-cm layer, while the minimum content was during August–October. The Cmicro content ranged from 577.79 to 381.79 mg−1 kg−1 using Ab in the spring to 229.53 to 272.86 mg−1 kg−1 in the autumn using CT (conventional tillage) and F in the 0–10- and 10–20-cm layers, respectively. The amplitude of Nmicro content changes were several times lower as compared with the Cmicro. The smallest quartile range (IQR0.25–0.75) of such changes was shown when using the following treatments: no till (NT) and Ab in the 0–10-, NT and F in the 10–20- and CT in the 20–40-cm layer. The widest Cmicro:Nmicro ratio was recorded at F and CT in the 0–20- and CT and rotational tillage (Rot) in the 20–40-cm layer. The MI dynamics were similar to the trends of Cmicro and Nmicro and changed from 0.72 ± 0.168 to 2.00 ± 0.030%. The highest share of Cmicro in CTOC was at Ab (1.82 ± 1.85%) and NT (1.66 ± 1.52 %) in the 0–10-, Ab (1.23 ± 1.27%) and NT (1.29 ± 1.32%) in the 10–20- and Ab (1.19 ± 1.09%) and F (1.11 ± 1.077%) in the 20–40-cm layer, correspondingly. The Pearson’s correlation coefficient between Cmicro and CTOC increased from the upper 0–10- to the lower 20–40-cm layer; it was “strong” and “high” between Cmicro and CTOC. Different uses of Mollisol affected the amplitude of the Cmicro and Nmicro seasonal changes, but it did not change their trend. Our results suggest the key role of Ab and NT technologies in Cmicro accumulation in the total organic carbon (TOC).

1. Introduction

Soil microorganisms conduct many biological processes in agroecosystems. They transform soil organic carbon, nitrogen, phosphorus, sulphur and other elements into the available ones for plants; they decompose and synthesize organic compounds into specific humus substances; they regulate plant health and they fulfil numerous ecosystem functions [1]. The impact of the environment on microbial communities in arable lands is usually assessed by an integral indicator as the total microbial biomass. The microbial biomass (MB) is part of a soil living phase, containing 5–10% from the total organic matter [2,3]. Paul [4] reported that 35% and 65% of the microbial biomass had a field-adjusted average life expectancy up to 7 months and 14 years, respectively. Bacteria and archeobacteria are the most active in a soil rhizosphere, which is enriched with >0.8 mm of soil pores, while mycorrhizal fungi are concentrated mainly near plant residues, forests or steppe litter [5]. The dominance of fungi over bacteria in the 0–5-cm layer was found by B. Butenschoen et al. [6]. F. Cotrufo et al. [7] thought that the amount of soil organic substrate transformed by microorganisms is the main indicator that characterizes the dynamics of a soil organic substance.
The seasonal dynamics of the contents of CTOC, Cmicro i Nmicro and Cmicro:Nmicro correlation indicate the trends of the transformation processes of soil organic substances in terrestrial natural and agrarian ecosystems. An agroecological seasonal stability of the soils, in view of the C:N interaction of organic soil compounds, is identified by their initial parameters at the beginning and before vegetation; by the amplitude or cycle nature of their seasonal changes and by the contents of CTOC, Cmicro and Nmicro at the end and after the vegetation of agricultural crops. During the vegetation of agricultural crops, both the change in the contents of organic compounds of carbon and nitrogen in the soils and their structural transformations take place.
Previous studies have suggested that tillage provokes changes in microbial and fungi communities. According to Nicolardot et al. [8], bacteria were a main destructor of crop residues under CT. No till facilitates a predominating fungal biomass over bacteria for a short period [9]. Such a fungi dominance has also been found in pastures and forests [10,11]. Bailey et al. [12] explained the predominance of a fungal biomass over microorganisms at no till by the features of the fatty acid phospholipid (PLFA) method. To avoid the difficulties in the enumeration of individual microbial/fungal communities, the chloroform fumigation extraction method (CFE) of MB determination was used in our research [13]. The CFE method is widely used to estimate MB in agricultural lands as a sensitive indicator of soil sustainability [14] and soil health [15]. The MB content increases with a soil quality improvement, manure application, mulching, using legumes in crop rotation, etc. [16].
A number of authors [17,18] have proposed using the MB dynamics for soil quality assessment. The soil MB lifetime corresponds with the rates of microbial activity in soils, as well as primary changes of TOC, nitrogen and sulphur compounds, indicating the starting processes of soil regeneration or degradation [19,20]. Seasonal changes of MB depend on the following: soil temperature, the soil water potential, content of labile organic matter and biophilic elements, quantity and quality of plant residues, oxy-redox potential and physicochemical environment [21]. On arable lands, agricultural practices change soil properties and regimes by affecting the soil MB content and dynamics. Reduced tillage and no till accumulate plant residues, TOC and total nitrogen (TN) at the soil surface, creating a trophic layer of food for fungi and microorganisms [22] and accelerating their growth and activity [23]. An amount of soil organic substrate transformed by microorganisms could be presented as a key indicator characterizing the dynamics of a soil organic matter [7]. According to Thiessen et al. [24], the humification coefficient (HC) depends on MB. Mineral soils with lower amounts of MB have greater HC as compared to organic soils, which have higher amounts of MB [25]. At the same time, the research literature does not present a complete understanding of the role of microorganisms in the synthesis and stabilization of biomolecules in soils. According to the data of Murphy et al. [26] and Rousk et al. [27], the MB did not affect the growth of SOC in soils, because the formation of specific humic substances is determined by numerous interrelated factors, such as: the labile carbon and nitrogen content, plant residue quality, abiotic soil–climatic parameters, etc. [28]. The mechanism of SOM synthesis under the influence of soil MB has not been disclosed yet. The soil MB dynamics, as well as the soil organic matter content, can be indirectly assessed by the magnitude of CO2. According to Hamilton et al. [29], one hectare of crop field (corn for grain, soybean rotation) annually released 4.2 tons of CO2 per year, of which 29% were produced by bacteria, 31% by fungi, 10% by fauna and 30% by the plant root system.
Thus, a critical assessment of the soil MB could improve our understanding of the management effects on SOM early changes induced by tillage, fertilizers, rotational and other agricultural practices. There is almost no information in the latest literature describing the long-term influences of different systems of tillage and land use on the seasonal MB content and dynamics. We also hypothesized that changes in a seasonal temperature and moisture against the background of different tillage would lead to significant differences in the temporal distributions of the MB. In our research, for comparative purposes, we determined the trend and amplitude of the seasonal Cmicro and Nmicro changes in different soil layers under natural and agricultural conenoses.

2. Materials and Methods

2.1. Study Site and Sampling

This research was conducted during 2010–2016 at the Hailun Soil and Water Monitoring Station (47°126′ N, 126°38′ E) of the Northeast Institute of Geography and Agroecology of the Chinese Academy of Sciences in Hailun City, Heilongjiang Province, Northeast China.
This area is located in a semi-arid region of the northern temperature zone and continental monsoon area (cold and arid in the winter, hot and rainy in the summer). The average annual precipitation is 530 mm, with 65% occurring in the period from June to August. The annual average temperature is 1.5 °C, with an extreme minimum temperature equal to −39.5 °C and an extreme maximum temperature +37 °C.
The hydrothermal coefficient of Selyaninov (HTC) [30] was determined by the formula:
H T C = r 0.1 Σ t > 10   ° C   ,  
where r—sum of precipitation for the period when air temperatures exceeded 10 °C and 0.1 ∑t > 10 °C—sum of effective accumulative temperatures above 10 °C reduced by 10 times.
The soil was a typical Mollisol (Udoll). International analogs of Chinese Mollisol are as follows: Haplic–Luvic Phaeozems, Haplic Chernozems, Udoll Mollisols (USA) [31] and leached blacksoil (Ukraine, Russia). The studied Chinese soil is characterized by a transitional “ustic”–“udic” moisture regime. The tillage systems included: 22 years of abandoned plot, 22 years of fallow F, no till, reduced till (RT) to a depth of 25 cm, convention tillage to a depth of 27–30 cm, combined tillage (Comb) to a depth of 25–30 cm and a rotary tillage to a depth of 20–25 cm.
The long-term stationary one-factor experiment was established in 2004 on a randomized complete design. Each elementary plot size was 8.4 m × 40 m = 336 m2, and the test plot was 100 m2. The experiment was repeated three times. Soil samples were taken from the 0–10-, 10–20- and 20–40-cm layers. The crop rotation consisted of soybeans and corn for grain. Crops were planted at the beginning of May, and they were harvested in early October. For all tillage practices, the following mineral fertilizers were provided: urea, triple superphosphate and potassium sulphate. The norms of the mineral fertilizers were: N69.5P51.75K15 + N100 (CO (NH2)2) for corn for grain and N20.25P51.75K15 for soybeans.

2.2. Soil MB Analyses

Dry combustion of the soil samples was used to determine the organic carbon content and total soil nitrogen [32]. Air-dry soil (10–15 g) with removed plant remains was ground in an agate mortar, sifted through a sieve with holes of 0.25 mm, reselected the small organic residues with tweezers and an electrostatically charged ebonite stick and the cleaned sample was poured into the “shuttle” (capsule), from which 20 mg of sample was taken for the analysis. Weighing was performed directly on the scales in an aluminium box; after weighing, it was closed with an envelope and twisted. After which, the sample was placed in an automatic sampler, from which it came to a dry oxygen combustion at a temperature of 600–650 °C on the Vario EL III analyzer.
The carbon content of the microbial biomass (Cmicro) was determined by the chloroform fumigation extraction method (CFE). This method involves the extraction of 0.5-M K2SO4 with a solution of lysis products of the biomass of soil microorganisms that died after 24 h of fumigation with chloroform vapor [33,34]. Fresh soil samples, which had been taken no earlier than 2 h before the start of the analysis, were used for this study. Fresh soil, from which 2 soil samples of 40 g each were taken, was sieved through a sieve with 2-mm holes, and plant residues and non-soil material were removed. Each soil sample was examined for the field moisture content. A soil sample intended for fumigation was transferred to an open 100-mL beaker and placed in a desiccator. At the bottom, in the central part of the desiccator, there was wet paper (to prevent drying of the soil during fumigation), 50 mL of 10-mol L−1 NaOH solution in a glass of 100 mL and 40 mL of chloroform (which does not contain ethanol) in a 100-mL beaker with small pieces of glass (to prevent the formation of large bubbles of chloroform). The desiccator was lubricated with Vaseline, covered with a ground lid (without air bubbles at the joint) and then the air was pumped out with a vacuum compressor until the chloroform began to boil. The boiling continued for 1 to 2 min, after which the desiccator tap was closed, and 2 min later, it was placed in a thermostat with a constant temperature of +25 °C for 24 h. A day later, under the hood, the tap was opened, atmospheric air was released and then the lid of the desiccator was opened. Control and fumigated soil samples were transferred to a 250-mL flask to which 150 mL of 0.5-M K2SO4 solution was added. The resulting suspension was shaken for 30 min on a rotator. The saline solution of the electrolyte—coagulator (0.5-M K2SO4), after the rotator was filtered into plastic bottles, was closed with a lid and placed in the refrigerator for daily storage at a temperature of +4 °C or in the freezer for long-term storage. The content of the organic carbon (Cmicro) and nitrogen (Nmicro) biomass of the microorganisms in the obtained filtrates was determined on the Elementar Liqui TOC II, Analyzensysteme GmbH, Germany. The carbon content of the microbial biomass was calculated by the difference between carbon in the fumigated and control samples using a factor of 0.45 for carbon and 0.54 for nitrogen [35,36,37,38].

2.3. Statistical Analyses

The arithmetic mean value, estimated variance, the reliable probability (p = 0.95) and the significant difference were determined by using Microsoft Excel 2016, IBM SPSS Statistics for Windows v. 20.0 (© SPSS, Chicago, IL, USA) and SigmaPlot for Windows Version 14.0 (2017 Systat Software, Inc., IBM Corp, Armonk, NY, USA). Mean average values and standard deviations were determined for each defined indicator. Student’s t-test at the significance level α = 0.05 was used to compare the mean values. The confidence interval (α = 0.01) was calculated by comparing sets of Cmicro and Nmicro values. The Bonferroni method was used to correct the errors of multiple comparisons in a one-way ANOVA test. A correlation analysis was made according to S. Pearson.

3. Results

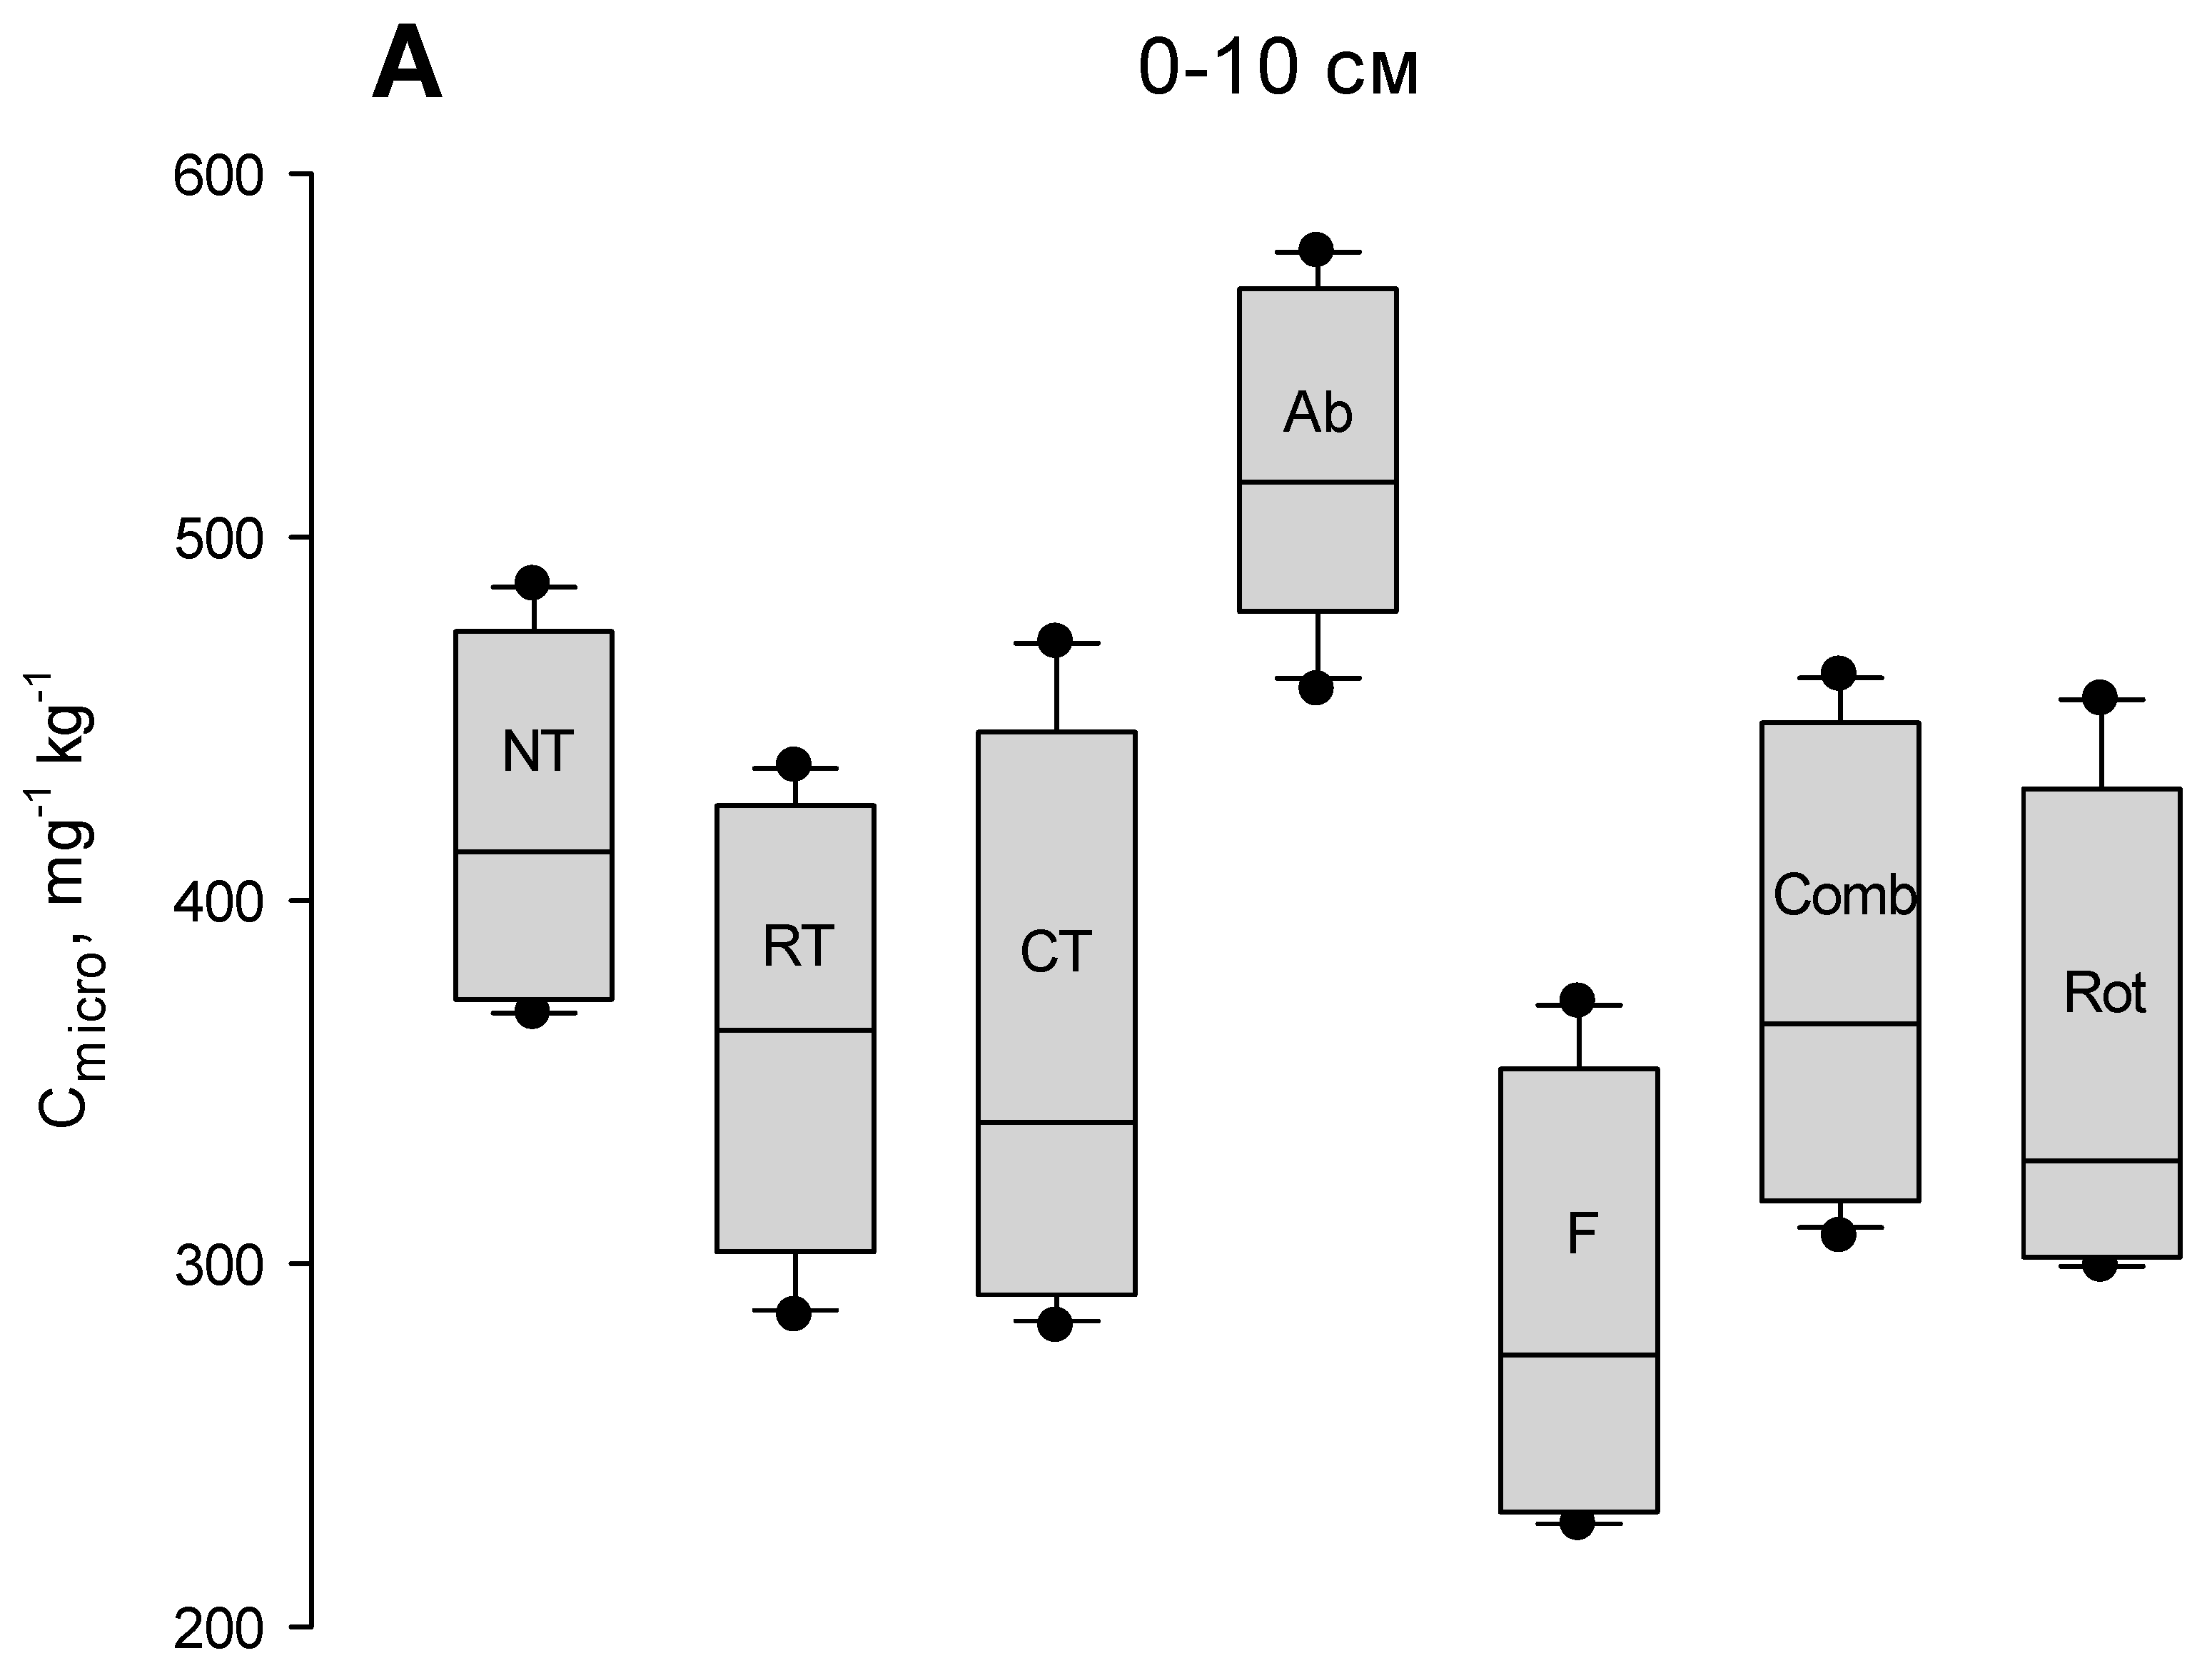
3.1. Seasonal Cmicro Changes

The size of the amplitude of the seasonal dynamics of organic carbon and nitrogen biomass of microorganisms depended on the nature of the use of Mollisol and the depth of soil sampling. The largest amplitude of seasonal changes of Cmicro was observed in soil samples of the upper 0–10-cm layer of Mollisol (Figure 1A), the smallest one in the layer of 10–20 cm (Figure 1B). The largest values of the third quartile Xn. (0.75) were observed for Ab in all soil layers. The smallest values of the first quartile Xn. (0.25) were for F in the layer 0–20 cm and Rot in the layer 20–40 cm (Figure 1C). The largest difference in the quartile scale (IQR0.25–0.75) was recorded for CT in the layer 0–20 cm and, for RT, in the layer 20–40 cm. The maximum quartile amplitude of the Cmicro values in the range IQR0.10–0.90 was found for CT and Rot in the layer 0–10 cm, for Ab and CT in the layer 10–20 cm and for RT and Comb in the layer 20–40 cm. The medians within the quartile range (IQR) tended toward the lower position, thus creating a lower asymmetry of the box (boxplot). The lower position of the median indicates a tendency to decrease the amplitude of the dynamics of Cmicro during the growing season. The carbon content of the microorganism biomass gradually decreased in the 0–10-cm layer and increased in the 10–40-cm layer from May 16 (203.08–577.79 mg−1 kg−1) to August 23 (191.29–470.02 mg−1 kg−1), and it increased in early October (207.42–518.09 mg−1 kg−1) (Figure 2).

3.2. Seasonal Nmicro and Cmicro:Nmicro Changes

The dynamics curve Nmicro repeated the trend of Cmicro: the maximum nitrogen content of microorganism biomass accumulated in the spring, gradually decreased until August and resumed in October (Figure 3). The high amplitude of fluctuations in the biomass of microorganisms indicates less resistance of microbial conenoses to environmental factors. The largest amplitude of seasonal changes Nmicro in the 0–10-, 10–20- and 20–40-cm layers of arable soils was observed for: CT—9.218 ± 7.98 mg−1 kg−1, Comb—4.317 ± 4.67 mg−1 kg−1 and Rot—2.23 ± 4.32 mg−1 kg−1. The ratio of Cmicro:Nmicro in arable soils increased rapidly from July 12 to August 23, and it had the highest peak in the 0–10-, 10–20- and 20–40-cm layers by CT (10.10 ± 0.81%), Comb (10.88 ± 1.11%) and Rot (12.54 ± 1.41%) (Figure 4). On the average per season, the highest value of the ratio Cmicro:Nmicro was observed for F, CT and Rot and the lowest ones for Ab and NT.
The highest content of organic carbon and nitrogen and the narrowest correlation of Cmicro:Nmicro in the 0–20-cm Mollisol layer were recorded under Ab and NT, and a contrary correlation was under CT, F and Rot. In the 20–40-cm layer, the widest correlation of Cmicro:Nmicro was formed under RT.

3.3. A Correlation Analysis and Determination of the Coefficients of Linear Correlation of K. Pearson

To establish the relationship between the change in carbon of the microorganism biomass and the dynamics of organic carbon of the soil during the growing season, we made a correlation analysis and determined the coefficients of the linear correlation of K. Pearson (Table 1). It was found out that the positive correlation between the two parameters increased from the upper 0–10-cm layer to the lower one: the 20–40-cm layer. The value of the correlation coefficient between Cmicro and Corg in the 0–10-cm layer of Hailun Mollisol according to the “Chaddock Table” is estimated mainly as “moderate” and “significant”. “Strong” (0.70–0.89) and single “high” (0.90–0.99) negative correlations in Hailun Mollisol were found between F Corg and RT Cmicro, Ab Cmicro and F Corg, Rot Corg and RT Cmicro and Comb Corg and Comb Cmicro in the 0–10-cm layer; NT Cmicro and CT Corg; F Corg, Comb Corg and Rot Corg; CT Cmicro, Comb Corg and Rot Corg; F Cmicro, Comb Corg and Rot Corg and Rot Corg and Comb Corg in the 10–20-cm layer; RT Cmicro and CT Corg; Ab Corg and Rot Corg; RT Cmicro and NT Corg, CT Corg, Ab Corg and Rot Corg; F Cmicro and RT Corg; Comb Cmicro, CT Corg and Rot Corg; Rot Cmicro and NT Corg and CT Corg, Ab Corg, Comb Corg and Rot Corg in the 20–40-cm laye.

4. Discussion

Seasonal changes in the biomass of microorganisms, which is determined by the method of fumigation–extraction, can occur two to four or more times [39,40,41]. Moreover, with the agricultural use of soils, the seasonal dynamics of the microorganism biomass is more pronounced as compared to natural conenoses [42]. According to the results of our research, the content of organic carbon and nitrogen was changed during the season; the highest content of Cmicro and Nmicro was observed in mid-May–July; it decreased by the end of August and recovered in October (Figure 2 and Figure 3). This pattern was observed in the Mollisol of Northeast China [43,44]. The speed of microbial circulation in soils, in addition to abiotic factors, is also affected by the presence of readily available humic substances, detritus, colloid desorption products and the transformation of plant residues, plant root system secretions, products of hydrolysis of organic polymers, etc. [45].

4.1. Temperature and Moisture Effect on the Soil Microbial Biomass Amount

Previous studies [46,47] suggested that seasonal variations in MB enhanced such abiotic factors as the temperature and moisture. The district of Hailun City is in the area of a continental climate of the eastern outskirts of Eurasia. Here, the area of a monsoon-type climate with a significant temperature amplitude is formed. In the years of 2010–2016, temperatures higher than 0, +5 and +10 °C were recorded on 26 March, 7 April and 28 April (Figure 5). At the end of April, Mollisol becomes heated very much, which leads to a temperature increase over +10 °C in a superficial soil layer on 22–26 April. However, in the first decade of May, a short-term cold period was recorded, which, on average, affected the decrease of the average monthly temperature by 0.3–2.2 °C. Beginning from the last decade of May until the second decade of September, the air temperature went up intensively without any significant cold periods. From May until October in 2010–2016, the general amount of precipitation changed from 304.3 to 523.9 mm. The largest amount of precipitation was recorded in July, and it exceeded this indicator in May and August by 1.8–4.7 and 2.3–5.7 times. On average, in 2010–2016, ∑t > 10 °C and HTC amounted to 3210.91 °C and 1.36, respectively. High average monthly temperatures and sufficient amounts of precipitation created optimal conditions for the formation of a biomass and for corn grain and soybeans to fill.
The technologies of soil cultivation (tillage) have direct and indirect effects on the dynamics and reserves of moisture in the soils [48]. The increase of the moisture content and reserves under mold–boardless/conservation tillage is associated with the reduction of evaporation, the increase of the number of agronomical valuable and water-resistant aggregates [49], the decrease of the density of “an arable sole”, the increase of humus content [50], a better porosity and infiltrating ability of the soils and soil-protective properties of the soil surface during heavy rain storms and signs of water erosion [51]. The use of plowless/conservation tillage supports the correlation between density and porosity similar to virgin lands [52,53]. A higher moisture content of the soils under soil-protective technologies improves the transport of nutrient elements, calcium and microelements through a plant root system [54].
The trend of the dynamics of the Cmicro content during a vegetative period depended more on the soil moisture content and temperature, and it depended less on soil management techniques. From May to August, the decrease in the Cmicro and Nmicro contents went along with the reduction of the moisture content and the temperature rise in the upper layers of Mollisol (Figure 6), higher water consumption by plants and higher evapotranspiration. From May 16 until July 12, in a layer 20–40 cm, the Cmicro and Nmicro contents increased (Figure 2), together with the increase of the moisture content in this layer and lower soil temperatures, as compared with the upper layer 0–20 cm (data not shown).
The largest decrease of the moisture content against the background of high soil temperatures (Figure 6) and Cmicro and Nmicro (Figure 2 and Figure 3) in all layers of Mollisol at the end of August was accompanied by the widest correlation of Cmicro:Nmicro (Figure 4). This effect was associated with the following: physical and chemical catalysis of humus compounds under the effect of high temperatures, solar radiation (ultraviolet radiation) and air oxidation [55]; dehydro-condensation of phenols via the mechanism of free radicals; nonexchangeable fixation of C–CO2 of soil air in heterocyclic aromatic compounds of humus substances; polycondensation and complex formation of organic compounds: carbon; oligo- and polymerization of polyphenols, pyrogallols, hydroquinones and catechins with their further fixation in stable fractions of humus substances [56] and the increase of the sizes of humus molecules by means of creating macromolecular polymers or super-molecular bio-monomers [57,58].
In a fall–winter period, after the harvest time, the process of a continuous biological and abiotic stabilization and the restoration of the compounds of organic carbon and nitrogen take place. The contents of Cmicro and Nmicro increase (Figure 2 and Figure 3), and the correlation of Cmicro and Nmicro gets narrower (Figure 4). Hydrophilic organic components enriched with carbon and nitrogen, which were formed as a result of the decay of postharvest residues, are linked with hydrophobic centers of humic substances and stabilized in dispersed and water-resistant fractions of soil aggregates [59]. In a cold autumn period, newly formed humus substances; organo-genic monomers and products of acid hydrolysis of nitrogen-containing substances (amino acids, amines and amides) penetrate into lower soil layers, together with gravitation water, get connected with mineral soil components, heterotrophic fixation of soil carbon dioxide and the condensation of organic C and N take place in highly molecular structure.

4.2. CO2-C Emission in Mollisol under Different Tillage Systems

The intensity of the soil microbial respiration (C-CO2) is the most dynamic indicator that describes the changes of labile carbon of soils, and it can serve as an important criterion for the estimation of the general biological activity of a conenosis microbial component [60,61]. The observation of the emission of carbon dioxide showed a different production of CO2-C Mollisol during vegetation (Figure 6). At the end of April, before sowing, various ridge tools were used at the 25-cm depth, which enhanced the activation of the mineralization processes and a short-term entry of CO2-C into the atmosphere. The effect of a “hot spot” [62], which occurred immediately after plowing, continued for several days and had no effect on the examination of carbon dioxide emission, which was done on 16 May. The smallest amount of emitted CO2 for the whole season was recorded in May. At this time, gaseous carbon emitted the most, namely: Ab (1.48 ± 0.25 kg−1 ha−1 h−1), Rot (0.75 ± 0.39 kg−1 ha−1 h−1) and CT (0.64 ± 0.43 kg−1 ha−1 h−1). The application of deep loosening under CT and Rot facilitated the fast warming of an arable soil layer, the enhancement of oxidative processes and CO2 diffusion from lower soil layers. The increase of the CO2-C emission in natural and agrarian conenoses took place in a summer period.
The highest peak of CO2–C emission was recorded in mid-July (Figure 7). This indicator had the highest meaning at Ab, Rot, CT and Comb. The increase of CO2 emission from mid-May until mid-July was associated with the cultivation of the sown area, which was done twice, the application of urea as the top dressing, the intensive accumulation of the biomass of the microorganisms and a plant root system and the activation of the enzymatic activity. More root exudates and plant fallings, products of decarboxylation of carbonates and humus substances, came into the soil under the effect of high soil temperature and moisture (the effect of monsoon rains).
At the end of August and the beginning of October, the amount of emitted CO2-C decreases (Figure 6). During this period, the highest amplitude of CO2-C dynamics was recorded under CB (0.58 ± 0.92 kg−1 ha−1 h−1) and Comb (0.68 ± 1.01 kg−1 ha−1 h−1). The highest amplitude of seasonal CO2-C changes was observed under CT and Comb. The following was typical for this time: the functioning and development of microorganisms worsened; the soil temperature, biomass and the activity of the plant root system decreased; a lesser amount of hydrophilic organic substrate entered the soil, as well as that of nonspecific and labile humic substances; the soil density increased and the arable soil layer lost the available moisture for plants. In this period, all the mentioned factors reduced the amount of emitted CO2-C from the Mollisol surface by 0.15–0.68 kg−1 ha−1 h−1. After harvesting, a large number of plant residues entered the soil, which enhanced the microbiological activity and, in turn, the increase of CO2 emission by the soil. On average per season, the largest amount of CO2-C was emitted under Ab—1.38–1.53 kg−1 ha−1 h−1 and Rot—1.08 kg−1 ha−1 h−1. The smallest emitted amount of CO2-C was recorded under F—0.44–0.54 kg−1 ha−1 h−1.

4.3. Tillage Effect on Dynamics of Soil Microbial Biomass

At the beginning of the growing season, there were numerous remains of the predecessor plant (soybeans) and labile humus substances, newly formed in the autumn–winter period. Mollisol at this time was enriched with mineral forms of nutrients due to the introduction of the main seed mineral fertilizer at the rate of N69.5P51.75K15, followed by two feedings of urea N50 + N50 in late April–early May. The presence of organic matter available for mineralization led to the initialization of the hydrolytic microflora (L-strategists), which was prepared for other groups of microorganisms of easily hydrolyzed substrate [63]. It was during this period that the so-called priming effect took place, which stimulated the metabolic activity of microorganisms in Mollisols [62]. As a result, in mid-May, the highest contents of Cmicro and Nmicro were observed in the 0–10-cm layer of soil in all studied variants. The highest values of Cmicro and Nmicro in this period were recorded for: Ab (577.79 ± 1.64 and 65.0 ± 0.47 mg−1 kg−1), NT (485.43 ± 1.97 and 52.7 ± 0.45 mg−1 kg−1). The lowest content of organic carbon and nitrogen was observed for black fallow.
During the period from May 16 to July 12, a reduction of the Cmicro and Nmicro contents occurred, as compared with the pre-sowing indicators. Kuprychenkov [64] stated that a significant decrease of the content of organic C and N from spring to summer was predetermined by the intensity of oxidation processes under the effect of average daily air temperatures over 20 °C and 50–60% of the soil moisture from the field capacity. At this time, vegetative plants receive actively the elements of mineral nutrition from humus. Oxygen saturation of the soil takes place immediately after its spring tillage, which results in the autotrophic mineralization of organic carbon compounds. According to the data received by Bulyhina et al. [65], CO2 emission during the spring–summer period is larger by 10–25 times, as compared with the emission during the fall period; also, CO2 emissions under virgin lands are larger by 10–23 times as compared with the application of regular plowing. The results received in the previous research [66] showed better enrichment of the soil organic substance with labile nitrogen-containing organic compounds under soil conservation tillage technologies. Hence, under soil conservation tillage, the accelerated catabolic metabolism takes place against the background of higher contents of organic substrates, required for depolymerization and intensive microbiological and enzymatic activity. During the first two months after a sowing period, the contents of Cmicro and Nmicro decrease, newly formed organic monomers are used by microorganisms and mineral compounds and even amino acids are used by plants [67]. Some soil nitrogen releases from the biological cycle. The energy, released during the course of catabolism, and biological monomers are used for the synthesis of humus compounds, polycondensation reactions and aromatization for the formation of associative complexes at the end of August. The highest value of Cmicro:Nmicro and the smallest one of Cmicro/CTOC are recorded at this time.
According to Bonde et al. [68], at the beginning of vegetation, the mineralization losses of nitrogen, on average, are larger by 55% as compared with those at the end of vegetation. Based on the results of the 10-year research, Salinas-Garcia et al. [69] found out that the amplitude of the seasonal changes of organic carbon under no till was, onaverage, higher by 16% as compared with its changes under other soil tillage technologies, and the largest difference of the above-mentioned changes was observed at the beginning of vegetation (64%) and at a flowering stage (41%). In our research, the amplitude of the seasonal changes of Cmicro and Nmicro under NT and Ab in the 0–10-cm layer (Figure 1A) was smaller as compared with other technologies due to a lower temperature and a larger amount of moisture (Figure 7). A “hot spot” in these treatments did not occur in the period under study, which can be explained by a growing activity of mycorrhizal fungi on plant residues and the lack of serious changes of soil temperature and moisture in Mollisol, the latter connected with the growing air temperatures and a monsoon type of a climate during the vegetative period [70]. Frey et al. [71,72] and Butenschoen [6] noted a significant predominance of fungal-to-bacterial biomass under no till. The results obtained by Jiang et al. [73] indicated the local placing of fungal biomass in macroaggregates and biomass of microorganisms in soil microaggregates, regardless of the method of tillage. Cleveland and Liptzin [74] believed that the high ratio of Cmicro:Nmicro in soil macroaggregates under CT as compared with NT indicates insufficient nitrogen content during plowing. According to the results of our research, confirmed by the work of Hernández and Lopez-Hernández [75] for CT (26.49–29.79 mg−1 kg−1) and F (23.52–27.21 mg−1 kg−1) on average for a season, the lowest amount of nitrogen accumulated in the biomass of microorganisms, which led to the widest ratio of Cmicro:Nmicro by rotational treatment (11.49 ± 1.41) and black fallow (11.43 ± 1.09) (Figure 4).
In August, a total amount of the hydrophilic organic substrate, nutrient elements and the content of moisture available for plants decreased; the density and soil temperature increased and the mode of ORP was characterized with maximal oxidation, tillage and the transportation of farm machinery across the field, which resulted in the damage of structural soil aggregates. As a result of the utilization of organic plant residues by microorganisms, fungi exudates and a plant root system, hydrophilic low-molecular humus substances, the reduction of nutrient substrate occurs, which leads to the decrease of a quantitative and species composition of microorganisms. The competition for available nutrition elements is observed between plants and microorganisms. All the above-mentioned factors had an effect on the largest decrease of the concentration of biomass of soil microorganisms at the end of August. At the beginning of October, before harvesting, the reutilization of nutrient elements into the soil takes place, the amount of plant fallings increases, which, against the background of a higher amount of precipitation and average daily air temperature + 12 °C, influenced the increase of the biomass of microorganisms in Mollisol. During the cold period of the year, the correlation between biomass of fungi and bacteria increases. At this time, one can see an active development of micellar and yeast fungi, actinomycetes, which are serious destructors of heavy-soluble heat-resistant compounds, such as cellulose and lignin [70,76]. In the spring, before vegetation and due to the above-mentioned organisms, a large amount of labile and nonspecific humic substances accumulate in the soils, the ones which are actively used by microorganisms and plants during a vegetative period.
MI is a sensitive indicator used in the study of primary changes in the qualitative composition of organic matter against the background of changes in soil properties [77]. The Cmicro/CTOC proportion increases as a result of the active conversion of soil organic matter by soil microorganisms, and it decreases in degraded soils. The microbial index (MI) of soils increases in light, well-moistened, weakly acid soils of natural grass conenoses [13]. According to the results of our research, during the growing season, MI varied from 0.72 ± 0.168 to 2.00 ± 0.030% (Figure 8). During the growing season, the value of MI varied similarly to the dynamics of Cmicro and Nmicro. The microbial index decreased from the beginning of the growing season to the end of August and increased in early October. The highest values of MI in the 0–20-cm layer were observed for Ab and NT in Hailun Mollisols. In the lower 20–40-cm layer of Mollisol, MI was predominant by Ab, F and CT. During the intensive growth and development of plants, most of the labile carbon of microorganisms in the humus was formed by Ab, NT and F (in the layer of 20–40 cm). RT had the middle position among other options in terms of the microbial index. At the beginning of October, MI increased with all tillage technologies and agroconenoses. The microbial index gradually decreased as the depth decreased.
Based on the results of the statistical processing of the data received by S. Pearson, the correlations of different dependence among the studied indicators were identified: air temperature, soil temperature and moisture at various depths; the sum of precipitation during the period under study and the effect of various tillage systems on the formation of CMiKpo, NMiKpo and the formation of moisture in different soil layers. In the variants where a correlation analysis showed the availability of a strong and reliable connection, a regression analysis was made, and a regression equation was composed.
Under the effect of all tillage systems (NT, RT, CT, Ab, F, Comb and Rot), direct correlation dependence between the amount of precipitation and CO2 release was determined—R = 0.86…0.98. The strongest correlation connections were identified in the variants with Comb (R2 = 0.96, y = 0.045x + 0.6417) and CT (R2 = 0.93, y = 0.0406x + 0.7575). Additionally, a correlation connection of an average strength for the precipitation amount was found with CMiKpo- R = 0.43 for F.
Under the effect of all tillage systems (NT, RT, CT, Ab, F, Comb and Rot), the direct correlation dependence between the air temperature and CO2 release was determined—R = 0.61…0.94. The strongest correlation connection was identified in the variant with Ab (R2 = 0.86, y = 0.03456x + 0.9421).
Under the effect of all tillage systems (NT, RT, CT, Ab, F, Comb and Rot), direct correlation dependence between the soil temperature and CO2 release was determined—R = 0.63…0.97. The strongest correlation connection was identified in the variant with Ab (R2 = 0.88, y = 0.602x + 21.93).
The effects of a temperature on the release of CO2 in NT, RT and CT at the depths of 0–10 and 10–20 cm were analyzed. A strong correlation connection between the studied parameters was identified, and R = 0.82…0.90. The strongest correlation connection was identified with NT at the depth of 10–20 cm (R2 = 0.81, y = 0.0497x + 0.2023).
A strong and reliable connection between the studied indicators and parameters was not found in the other variants.

5. Conclusions

In spite of a large number of publications related to microbial community study, it is still difficult to find research concerning seasonal changes of the microbial biomass influenced by agricultural practices and soil–climatic parameters. Our research showed that environmental conditions and tillage affected the trend, amount and turnover rates of a soil microbial biomass. The amount of Cmicro and Nmicro significantly reduced from May to August and increased in October. The amplitude of the seasonal Cmicro and Nmicro changed in 10–20 cm, and it was lower as compared with the 0–10- and 20–40-cm layers. In May, May–July and July, the microbial index was higher in such layers: the 0–10-, 10–20- and 20–40-cm layers, correspondently. Tillage influenced Mollisol’s biological characteristics significantly. Ab, NT and Rot yielded higher MI in the 0–20- layer, with Ab and F and CT in the 20–40-cm layer. On average per season, the largest amount of CO2–C in the plowing soils was emitted in Rot—1.08 and CT—0.88–0.99 kg−1 ha−1 h−1 and the smallest amount—in F, namely—0.44–0.54 kg−1 ha−1 h−1. A seasonable variability of CO2–C was as follows: 0.99–1.83 kg−1 ha−1 h−1 in natural conenoses, 0.33–1.51 kg−1 ha−1 h−1 in arable land and 0.33–0.75 kg−1 ha−1 h−1 in fallow land. The basal respiration rate, rather than air temperature, responded mainly to the soil moisture content and land use. The Ab and NT increased MB in the 0–20- layer, with Ab and Comb in the 20–40-cm layer. CT, Rot and F significantly decreased the Cmicro and Nmicro amounts and increased the Cmicro:Nmicro ratio, which indicates a potential N limitation in Mollisol induced by these tillage. The seasonal trend of Cmicro, Nmicro and MI in the 20–40-cm layer varied from the 0–20-cm layer because of its colder and wetter conditions. Our study illustrated that Mollisol’s microbial community highly responded to environmental changes and agricultural practices and could indicate the beginning of soil degradation or regeneration. This phenomenon may help develop an effective strategy for the implementation of cutting-edge agricultural practices incorporated into a concept of microbial ecology.

Author Contributions

Conceptualization, Y.S.K., X.Z. and C.S.; software, W.H., A.V.Y. and O.V.V.; formal analysis, Y.S.K. and O.V.V.; resources, X.Z. and C.S.; writing—original draft preparation, Y.S.K.; writing—review and editing, Y.S.K. and X.Z., visualization, Y.S.K., A.V.Y. and O.V.V., supervision, Y.S.K. and X.Z.; project administration, X.Z. and funding acquisition, X.Z. All authors have read and agreed to the published version of the manuscript.

Funding

This study was supported by the projects of the National Key Research and Development Program of China (2021YFD1500700).

Institutional Review Board Statement

The study was conducted in accordance with the Declaration of Helsinki and approved by the National University of Life and Environmental Sciences of Ukraine Ethics Committee (protocol № 544 from 14.05.2018) for studies involving humans.

Informed Consent Statement

Not applicable.

Data Availability Statement

The data will be available upon request.

Acknowledgments

The authors would like to thank the anonymous reviewers for their valuable comments.

Conflicts of Interest

The authors declare that there are no conflict of interest.

References

  1. Chernov, T.I.; Semenov, M.V. Management of Soil Microbial Communities: Opportunities and Prospects (a Review). Eurasian Soil Sci. 2021, 54, 1888–1902. [Google Scholar] [CrossRef]
  2. Dalal, R.C. Soil microbial biomass–what do the numbers really mean? Aust. J. Experim. Agric. 1998, 38, 649–665. [Google Scholar] [CrossRef]
  3. Jenkinson, D.S.; Ladd, J.N. Microbial biomass in soil: Measurement and turnover. Soil Biochem. 1991, 5, 415–471. [Google Scholar]
  4. Paul, A. The nature and dynamics of soil organic matter: Plant inputs, microbial transformations, and organic matter stabilization. Soil Biol. Biochem. 2016, 98, 109–126. [Google Scholar] [CrossRef] [Green Version]
  5. Fry, S. The spatial distribution of soil biota. In Soil Microbiol., Ecol. and Biochem., 4th ed.; Paul, E., Ed.; Academic Press: San Diego, CA, USA, 2015; pp. 223–244. [Google Scholar]
  6. Butenschoen, O.; Poll, C.; Langel, R. Endogeic earthworms alter carbon translocation by fungi at the soil–litter interface. Soil Biol. Biochem. 2007, 39, 2854–2864. [Google Scholar] [CrossRef]
  7. Cotrufo, F.; Wallenstein, M.; Denef, K.; Paul, E. The molecular efficiency-matrix stabilization (MEMS) framework integrates plant litter decomposition with soil organic matter stabilization. Glob Change Biol. 2013, 19, 988–995. [Google Scholar] [CrossRef] [Green Version]
  8. Nicolardot, B.; Bouziri, L.; Bastian, F.; Ranjard, L. A microcosm experiment to evaluate the influence of location and quality of plant residues on residue decomposition and genetic structure of soil microbial communities. Soil Biol. Biochem. 2007, 39, 1631–1644. [Google Scholar] [CrossRef]
  9. Helgason, B.L.; Walley, F.L.; Germida, J.J. Fungal and bacterial abundance in long-term no-till and intensive-till soils of the Northern Great Plains. Soil Sci. Soc. Am. J. 2009, 73, 120–127. [Google Scholar] [CrossRef]
  10. Demoling, F.; Nilsson, L.; Baath, E. Bacterial and fungal response to nitrogen fertilization in three coniferous forest soils. Soil Biol. Biochem. 2008, 40, 370–379. [Google Scholar] [CrossRef]
  11. de Vries, F.T.; Hoffland, E.; van Eekeren, N.; Brussaard, L.; Bloem, J. Fungal bacterial ratios in grasslands with contrasting nitrogen management. Soil Biol. Biochem. 2006, 38, 2092–2103. [Google Scholar] [CrossRef] [Green Version]
  12. Bailey, V.L.; Smith, J.L.; Bolton, H. Fungal: Bacterial ratios in soils investigated for enhanced C sequestration. Soil Biol. Biochem. 2002, 34, 997–1007. [Google Scholar] [CrossRef]
  13. Sparling, G.P. Ratio of microbial biomass carbon to soil organic carbon as a sensitive indicator of changes in soil organic matter. Aust. J. Soil Res. 1992, 30, 195–207. [Google Scholar] [CrossRef]
  14. Roy, J.; Guillerm, J.; Navas, M.; Dhillion, S. 9—Responses to Elevated CO2 in Mediterranean Old-Field Microcosms: Species, Community, and Ecosystem Components. Physiol. Ecol. 1996, 123–138. [Google Scholar] [CrossRef]
  15. Karlen, D.L.; Mausbach, M.J.; Doran, J.W.; Cline, R.G.; Harris, R.F.; Schuman, G.E. Soil quality: A concept, definition and framework for evaluation. Soil Sci. Soc. Am. J. 1997, 61, 4–10. [Google Scholar] [CrossRef] [Green Version]
  16. Holmes, W.; Zak, R. Soil Microbial Biomass Dynamics and Net Nitrogen Mineralization in Northern Hardwood Ecosystems. Soil Sci. Soc. Am. J. 1994, 58, 238–243. [Google Scholar] [CrossRef] [Green Version]
  17. Powlson, D.S.; Brookes, P.C.; Christensen, B.T. Measurement of soil microbial biomass provides an early indication of changes in total soil organic matter due to straw incorporation. Soil Biol. Biochem. 1987, 19, 159–164. [Google Scholar] [CrossRef]
  18. Anderson, J.F.; Domsch, K.H. Quantities of plant nutrients in the microbial biomass of selected soils. Soil Sci. 1980, 130, 211–216. [Google Scholar] [CrossRef]
  19. Schmidt, S.K.; Costello, E.K.; Nemergut, D.R.; Cleveland, C.C.; Reed, S.C.; Weintraub, M.N.; Meyer, A.F.; Martin, A.M. Biogeochemical consequences of rapid microbial turnover and seasonal succession in soil. Ecology 2007, 88, 1379–1385. [Google Scholar] [CrossRef]
  20. Powlson, D.S.; Jenkinson, D.S. A comparison of the organic matter, biomass, adenosine triphosphate and mineralizable nitrogen contents of ploughed and direct-drilled soils. J. Agric. Sci. 1981, 97, 713–721. [Google Scholar] [CrossRef]
  21. Wright, A.L.; Hons, F.M.; Lemon, R.G. Microbial activity and soil C sequestration for reduced and conventional tillage cotton. Appl. Soil Ecol. 2008, 38, 168–173. [Google Scholar] [CrossRef]
  22. Semenov, M.; Krasnov, G.; Semenov, V.; Bruggen, A. Mineral and Organic Fertilizers Distinctly Affect Fungal Communities in the Crop Rhizosphere. J. Fungi 2022, 8, 251. [Google Scholar] [CrossRef] [PubMed]
  23. Das, S.; Lee, J.; Cho, S.; Song, H.; Kim, P. Silicate Fertilizer Amendment Alters Fungal Communities and Accelerates Soil Organic Matter Decomposition. Front. Microbiol. 2019, 10, 2950. [Google Scholar] [CrossRef] [PubMed] [Green Version]
  24. Thiessen, S.; Gleixner, G.; Wutzler, T.; Reichstein, M. Both priming and temperature sensitivity of soil organic matter decomposition depend on microbial biomass–an incubation study. Soil Biol. Biochem. 2013, 57, 739–748. [Google Scholar] [CrossRef] [Green Version]
  25. Wang, H.; Xu, W.; Hu, G.; Dai, W.; Jiang, P.; Bai, E. The priming effect of soluble carbon inputs in organic and mineral soils from a temperate forest. Oecologia 2015, 178, 1239–1250. [Google Scholar] [CrossRef]
  26. Murphy, C.J.; Baggs, E.M.; Morley, N.; Wall, D.P.; Paterson, E. Rhizosphere priming can promote mobilisation of N-rich compounds from soil organic matter. Soil Biol. Biochem. 2015, 81, 236–243. [Google Scholar] [CrossRef]
  27. Rousk, J.; Hill, P.; Jones, D. Priming of the decomposition of ageing soil organic matter: Concentration dependence and microbial control. Function. Ecol. 2015, 29, 285–296. [Google Scholar] [CrossRef] [Green Version]
  28. Shahbaz, M.; Kuzyakov, Y.; Heitkamp, F. Decrease of soil organic matter stabilization with increasing inputs: Mechanisms and controls. Geoderma 2017, 304, 76–82. [Google Scholar] [CrossRef]
  29. Hamilton, S.K.; Doll, J.E.; Robertson, G.P. The Ecology of Agricultural Landscapes: Long-Term Research on the Path to Sustainability; Oxford University Press: New York, NY, USA, 2015. [Google Scholar]
  30. Selyaninov, G.T. About climate agricultural estimation. Proc. Agric. Meteorol. 1928, 20, 165–177. (In Russian) [Google Scholar]
  31. Soil Survey Staff. Illustrated Guide to Soil Taxonomy: Version 1.1.; USDA-NRCS: Lincoln, Nebraska, 2015. [Google Scholar]
  32. SSTU ISO. ISO 10694: 1995, IDT; 10694-2001 Soil Quality. Determination of Organic and Total Carbon Content by Dry Combustion (Elemental Analysis). Stateconsumerstandard of Ukraine: Kyiv, Ukraine, 2003. (In Ukrainian)
  33. Vance, E.D.; Brookes, P.C.; Jenkinson, D.S. An extraction method for measuring soil microbial biomass C. Soil Biol. Biochem. 1987, 19, 703–707. [Google Scholar] [CrossRef]
  34. Voroney, R.; Winter, J.; Beyaert, R. Soil microbial biomass C and N. In Soil Sampling and Methods of Analysis; Carter, M.R., Ed.; Canadian Society of Soil Science: Lewis, Chelsea, 1993; pp. 277–286. [Google Scholar]
  35. Wu, J.; Joergensen, R.G.; Pommering, B.; Chaussod, R.; Brookes, P.C. Measurement of soil microbial biomass C–an automated procedure. Soil Biol. Biochem. 1990, 22, 1167–1169. [Google Scholar] [CrossRef]
  36. Brookes, P.; Landman, A.; Pruden, G.; Jenkinson, D.S. Chloroform fumigation and the release of soil nitrogen: A rapid direct extraction method to measure microbial biomass nitrogen in soil. Soil Biol. Biochem. 1985, 17, 837–842. [Google Scholar] [CrossRef]
  37. Jenkinson, D.S. The determination of microbial biomass carbon and nitrogen in soil. In Advances in Nitrogen Cycling in Agricultural Ecosystems; Wilson, J.R., Ed.; CAB International: Wallingford, UK, 1988; pp. 368–386. [Google Scholar]
  38. Mueller, T.; Jensen, L.; Nielsen, N.; Magid, J. Turnover of carbon and nitrogen in a sandy loam soil following incorporation of chopped maize plants, barley straw and blue grass in the field. Soil Biol. Biochem. 1998, 30, 561–571. [Google Scholar] [CrossRef]
  39. Devi, N.B.; Yadava, P.S. Seasonal dynamics in soil microbial biomass C, N and P in a mixed-oak forest ecosystem of Manipur, North-east India. Appl. Soil Ecol. 2006, 31, 220–227. [Google Scholar] [CrossRef]
  40. Edwards, K.A.; Jefferies, R.L. Inter-annual and seasonal dynamics of soil microbial biomass and nutrients in wet and dry low-Arctic sedge meadows. Soil Biol. Biochem. 2013, 57, 83–90. [Google Scholar] [CrossRef]
  41. Chernova, T.I.; Zhelezova, A.D. Dynamics of soil microbial communities in different time ranges (review). Soil Sci. 2020, 5, 590–600. (In Russian) [Google Scholar]
  42. Lauber, C.L.; Ramirez, K.S.; Aanderud, Z.; Lennon, J.; Fierer, N. Temporal variability in soil microbial communities across land-use types. ISME J. 2013, 7, 1641–1650. [Google Scholar] [CrossRef]
  43. Sui, Y.Y.; Jiao, X.G.; Gao, C.S.; Chen, W.; Zhang, X.Y.; Liu, X.B. The Relationship among Organic Matter Content and Soil Microbial Biomass and Soil Enzyme Activities. Chin. J. Soil Res. 2009, 40, 1036–1039. [Google Scholar]
  44. Lou, Y.; Xu, M.; Wang, W.; Sun, X.; Zhao, K. Return rate of straw residue affects soil organic C sequestration by chemical fertilization. Soil Till Res. 2011, 113, 70–73. [Google Scholar] [CrossRef]
  45. McGill, W.; Cannon, K.R.; Robertson, J.A. Dynamics of Soil Microbial Biomass and Water-Soluble Organic C in Breton L After 50 Years of Cropping to Two Rotations. Can. J. Soil Res. 1986, 66, 1–19. [Google Scholar] [CrossRef]
  46. Sun, L.; Song, F.; Liu, S.; Cao, Q.; Liu, F.; Zhu, X. Integrated agricultural management practice improves soil quality in Northeast China. Arch. Agron. Soil Sci. 2018, 64, 1932–1943. [Google Scholar] [CrossRef]
  47. Luo, X.; Wang, M.K.; Hu, G.; Weng, B. Seasonal Change in Microbial Diversity and its Relationship with Soil Chemical Properties in an Orchard. PLoS ONE 2019, 14, e0215556. [Google Scholar] [CrossRef] [PubMed]
  48. Moraru, P.; Rusu, T. Effect of tillage systems on soil moisture, soil temperature, soil respiration and production of wheat, maize and soybean crops. J. Food Agric. Environ. 2012, 10, 445–448. [Google Scholar]
  49. Pagliai, M.; Raglione, M.; Panini, T.; Maletta, M.; La Marca, M. The structure of two alluvial soils in Italy after 10 years of conventional and minimum. Soil Tillage Res. 1995, 34, 209–223. [Google Scholar] [CrossRef]
  50. Anderson, S.; Gantzer, C.; Brown, J. Soil physical properties after 100 years of continuous cultivation. J. Soil Water Conserv. 1990, 45, 117–121. [Google Scholar]
  51. Sarauskis, E.; Romaneckas, K.; Buragiene, S. Impact of conventional and sustainable soil tillage and sowing technologies on physical-mechanical soil properties. Environ. Res. Eng. Manag. 2009, 49, 36–43. [Google Scholar]
  52. Josa, R.; Ginovart, M.; Solé, A. Effects of two tillage techniques on soil macroporosity in sub-humid environment. Agrophysics 2010, 24, 139–147. [Google Scholar]
  53. Mestelan, S.; Smeck, N.; Durkalski, J.; Dick, W. Changes in soil profile properties as affected by 44 years of continuous no-tillage. In Proceedings of the 17th ISTRO Conference, Kiel, Germany, 28 August–3 September 2006; pp. 1135–1140. [Google Scholar]
  54. NaNagara, T.; Phillips, R.; Leggett, J. Diffusion and mass flow of nitrate nitrogen into corn roots grown under field conditions. Agron. J. 1976, 68, 67–72. [Google Scholar] [CrossRef]
  55. Piccolo, A. Carbon Sequestration in Agricultural Soils: A Multidisciplinary Approach to Innovative Methods; Springer: Berlin/Heidelberg, Germany, 2012; 307p. [Google Scholar]
  56. Piccolo, A.; Spaccini, R.; Cozzolino, V.; Nuzzo, A.; Drosos, M.; Zavattaro, L.; Grignani, C.; Puglisi, E.; Trevisan, M. Effective carbon sequestration in Italian agricultural soils by in situ polymerization of soil organic matter under biomimetic photocatalysis. Land Degrad Dev. 2018, 29, 485–494. [Google Scholar] [CrossRef]
  57. Nebbioso, A.; Piccolo, A. Basis of a Humeomics Science: Chemical Fractionation and Molecular Characterization of Humic Biomacromolecules. Biomacromolecules 2011, 12, 1187–1199. [Google Scholar] [CrossRef]
  58. Nuzzo, A.; Spaccini, R.; Cozzolino, V. In situ polymerization of soil organic matter by oxidative biomimetic catalysis. Chem. Biol. Technol. Agric. 2017, 4, 12. [Google Scholar] [CrossRef] [Green Version]
  59. Tsybulko, N. SOM sequestration and mineralization in different soils of Belorussia, Belorussia State University. Ecology 2018, 2, 110–117. (In Ukrainian) [Google Scholar]
  60. Zabolotniy, O.; Zabolotna, A. Soil microbiological activity under Merlin herbicide usage. Yang Sci. 2014, 2, 16–20. (In Ukrainian) [Google Scholar]
  61. Keshalava, R. Simazine and karagard effect on soil biological activity. Plant Prot. Quarant. 2000, 9, 49. (In Russian) [Google Scholar]
  62. Fontaine, S.; Mariotti, A.; Abbadie, L. The priming effect of organic matter: A question of microbial competition? Soil Biol. Biochem. 2003, 35, 837–843. [Google Scholar] [CrossRef]
  63. Chimitdorzhieva, E.; Chimitdorzhieva, G. Carbon dynamics of microbial biomass of virgin steppe and dry steppe soils of Transbaikalia. Bull. KSU Name N. A. Nekrasova 2012, 3, 16–20. (In Russian) [Google Scholar]
  64. Kuprechenkov, M. Seasonal dynamics of chemical and agrochemical properties of bio- and agro Chernozem. Agric. Sci. Tech. Achiev. 2013, 7, 67–68. (In Russian) [Google Scholar]
  65. Bulygin, S.; Velichko, V.; Demidenko, O. Agrogenesis of Chernozem. Kyiv, Agrar. Sci. 2016, 356. (In Ukrainian) [Google Scholar]
  66. Kravchenko, Y.; Rogovska, N.; Petrenko, L.; Zhang, X.; Song, C.; Chen, Y. Quality and dynamics of soil organic matter in Typical Chernozem of Ukraine under different soil tillage systems. Can. J. Soil Sci. 2012, 92, 429–438. [Google Scholar] [CrossRef] [Green Version]
  67. Geisseler, D.; Horwath, W.; Joergensen, R.; Ludwig, B. Pathways of nitrogen utilization by soil microorganisms–A review. Soil Biol. Biochem. 2010, 42, 2058–2067. [Google Scholar] [CrossRef]
  68. Bonde, T.; Schnurer, J.; Rosswall, T. Microbial biomass as a fraction of potentially mineralizable nitrogen in soils from longterm field experiments. Soil Biol Biochem. 1988, 20, 447–452. [Google Scholar] [CrossRef]
  69. Salinas-Garcia, J.; Hons, F.; Matocha, J.; Zuberer, D. Soil carbon and nitrogen dynamics as affected by long-term tillage and nitrogen fertilization. Biol Fertil Soils 1997, 25, 182–188. [Google Scholar] [CrossRef]
  70. Kuhnert, R.; Oberkofler, I.; Peintner, U. Fungal growth and biomass development is boosted by plants in snow-covered soil. Microb. Ecol. 2012, 64, 79–90. [Google Scholar] [CrossRef] [PubMed]
  71. Frey, S.D.; Elliot, E.T.; Paustian, K. Bacterial and fungal abundance and biomass in conventional and no-tillage agroecosystems along two climatic gradients. Soil Biol. Biochem. 1999, 31, 573–585. [Google Scholar] [CrossRef]
  72. Frey, S.D.; Six, J.; Elliott, E.T. Reciprocal transfer of carbon and nitrogen by decomposer fungi at the soil–litter interface. Soil Biol. Biochem. 2003, 35, 1001–1004. [Google Scholar] [CrossRef]
  73. Jiang, X.; Alan, L.; Wright, X.; Liang, F. Tillage-induced changes in fungal and bacterial biomass associated with soil aggregates: A long-term field study in a subtropical rice soil in China. Appl. Soil Ecol. 2011, 48, 168–173. [Google Scholar] [CrossRef]
  74. Cleveland, C.C.; Liptzin, D. C:N:P stoichiometry in soils: Is there a “Redfield ratio” for the microbial biomass? Biogeochemistry 2007, 85, 235–252. [Google Scholar] [CrossRef]
  75. Hernández-Hernández, R.M.; Lopez-Hernández, D. Microbial biomass, mineral nitrogen and carbon content in savanna soil aggregates under conventional and no-tillage. Soil Biol. Biochem. 2002, 34, 1563–1570. [Google Scholar] [CrossRef]
  76. Schadt, C.W.; Martin, A.P.; Lipson, D.A.; Schmidt, S.K. Seasonal dynamics of previously unknown fungal lineages in tundra soils. Science 2003, 301, 1359–1361. [Google Scholar] [CrossRef] [Green Version]
  77. Anderson, T.H.; Domsch, K.H. Ratio of microbial biomass carbon to total organic carbon in arable soils. Soil Biol. Biochem. 1989, 21, 471–479. [Google Scholar] [CrossRef]
Figure 1. Sizes of seasonal dynamics (box plot 25–75%, median, n = 12, May–July–August–October) Cmicro in the 0−10- (A), 10−20- (B) and 20−40-cm (C) layers of Mollisol under use: conservation tillage (CT), no till (NT), reduced (ridge) tillage (RT), rotary (Rot), combined (Comb) tillage, fallow (F) and abandoned field (A,B).
Land 11 00486 g001aLand 11 00486 g001b
Figure 2. Seasonal dynamics of Cmicro in different of Mollisol layers after 9 years of use: conservation tillage (CT), no till (NT), rotary (Rot), reduced (ridge) tillage (RT), combined (Comb) tillage and fallow (F, 22 years) and abandoned field (Ab, 22 years). Average values with different lowercase letters indicate a significant difference between tillage options, and uppercase letters are a significant difference between the selection periods (HIP, α = 0.05).
Land 11 00486 g002
Figure 3. Seasonal dynamics of Nmicro in different of Mollisol layers after 9 years of use: conservation tillage (CT), no till (NT), rotary (Rot), reduced (ridge) tillage (RT), combined (Comb) tillage, fallow (F, 22 years) and abandoned field (Ab, 22 years). Average values with different lowercase letters indicate a significant difference between tillage options, and uppercase letters are a significant difference between the selection periods (HIP, α = 0.05).
Land 11 00486 g003
Figure 4. Seasonal dynamics of Cmicro:Nmicro in different Mollisol layers after 9 years of use: conservation tillage (CT), no till (NT), rotary (Rot), reduced (ridge) tillage (RT), combined (Comb) tillage, fallow (F, 22 years) and abandoned field (Ab, 22 years). Average values with different lowercase letters indicate a significant difference between tillage options, and uppercase letters are a significant difference between the selection periods (HIP, α = 0.05).
Land 11 00486 g004
Figure 5. Average air temperatures and precipitation in the season 2010–2016, Hailun Meteorological Station, China.
Land 11 00486 g005
Figure 6. Tillage effect on Mollisol temperature (°C; A) and moisture (W, %; B) in the 0–10- (A) and 10–20-cm (B) layers.
Land 11 00486 g006
Figure 7. Tillage effect on CO2–C emissions in Mollisol.
Land 11 00486 g007
Figure 8. MI dynamics in different layers of Mollisol after 9 years of use: conservation tillage (CT), no till (NT), rotary (Rot), reduced (ridge) tillage (RT), combined (Comb) tillage, fallow (F, 22 years) and abandoned field (Ab, 22 years). Average values with different lowercase letters indicate a significant difference between tillage options, and uppercase letters are a significant difference between the selection periods (HIP, α = 0.05).
Land 11 00486 g008
Table 1. K. Pearson’s linear correlation coefficients between Cmicro and Corg.
ParametersNT CTOCRT CTOCCT C CTOCAb C CTOCF CTOCComb CTOCRot CTOC
0–10 cm
NT Cmicro−0.418−0.395−0.351−0.143−0.789 *−0.142−0.678 *
RT Cmicro−0.571 *−0.550 *−0.558−0.371−0.884 *−0.323−0.792 *
CT Cmicro−0.289−0.285−0.278−0.0686−0.757 *−0.0173−0.597 *
Ab Cmicro−0.463−0.437−0.393−0.201−0.797 *−0.186−0.701 *
F Cmicro−0.269−0.255−0.2120.00751−0.700 *0.0125−0.580 *
Comb Cmicro−0.446−0.441−0.381−0.167−0.802 *−0.187−0.700 *
Rot Cmicro−0.177−0.165−0.1580.0506−0.680 *0.103−0.509
10–20 cm
NT Cmicro−0.697 *−0.664 *−0.708 *−0.604 *−0.877 *−0.787 *−0.731 *
RT Cmicro−0.229−0.405−0.324−0.157−0.636 *−0.630 *−0.654 *
CT Cmicro−0.221−0.544 *−0.522−0.135−0.680 *−0.820 *−0.714 *
Ab Cmicro−0.258−0.411−0.503−0.182−0.585 *−0.747 *−0.549 *
F Cmicro−0.0173−0.639 *−0.484−0.0712−0.609 *−0.758 *−0.780 *
Comb Cmicro−0.169−0.482−0.268−0.0977−0.618 *−0.598 *−0.665 *
Rot Cmicro−0.312−0.479−0.425−0.148−0.622 *−0.736 *−0.552 *
20–40 cm
NT Cmicro−0.660 *−0.644 *−0.591 *−0.174−0.135−0.553 *−0.175
RT Cmicro−0.788 *−0.605 *−0.907 *−0.866 *−0.413−0.850 *−0.875 *
CT Cmicro−0.654 *−0.492−0.859 *−0.798 *−0.358−0.735 *−0.824 *
Ab Cmicro−0.405−0.141−0.630 *−0.753 *−0.440−0.508−0.752 *
F Cmicro−0.615 *−0.703 *−0.682 *−0.308−0.0644−0.578 *−0.363
Comb Cmicro−0.506−0.363−0.746 *−0.685 *−0.347−0.589 *−0.704 *
Rot Cmicro−0.865 *−0.671 *−0.942 *−0.845 *−0.424−0.871*−0.836 *
* Indicates K. Pearson’s coefficient significant differences at p < 0.05 (n = 12).
Publisher’s Note: MDPI stays neutral with regard to jurisdictional claims in published maps and institutional affiliations.

