
Application of Cmic/Corg in the Soil Fertility Evaluation of Typical Forests in the Yulin Sandy Area

Abstract
:1. Introduction
2. Materials and Methods
2.1. Experimental Site and Soil Sampling
2.2. Statistical Analysis
3. Results
3.1. Bacterial Diversity and Species Composition Analyses
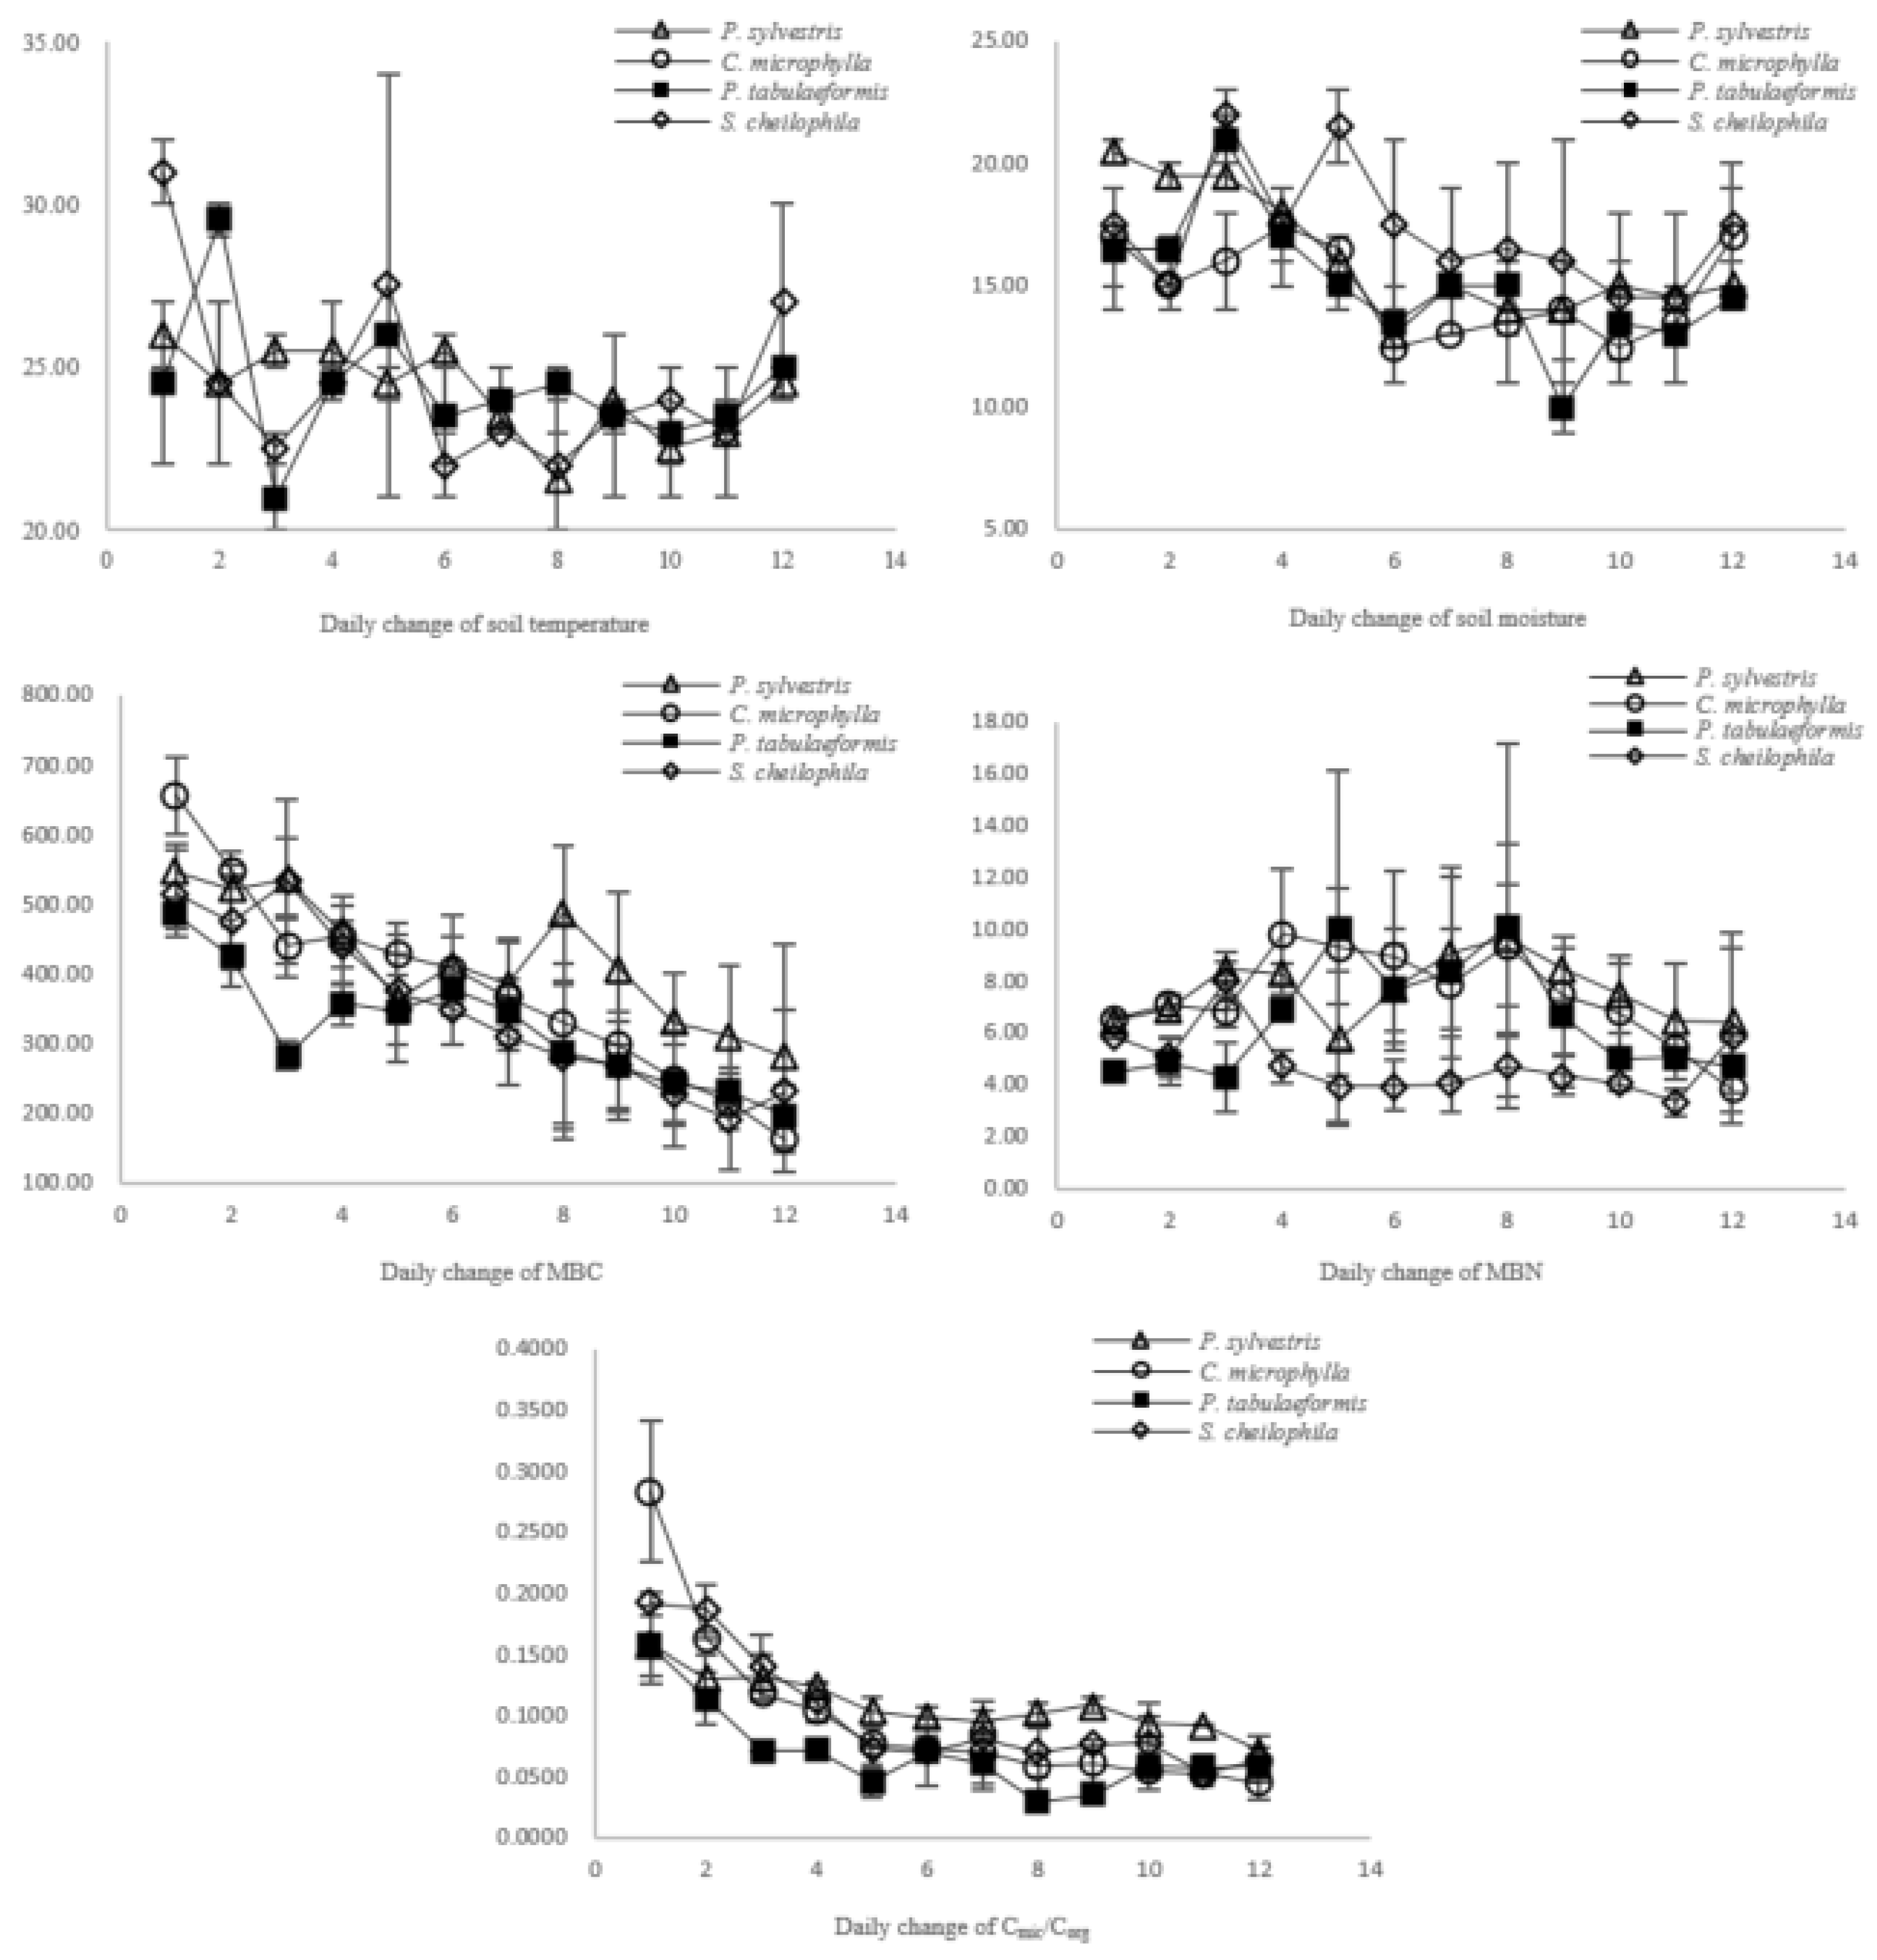
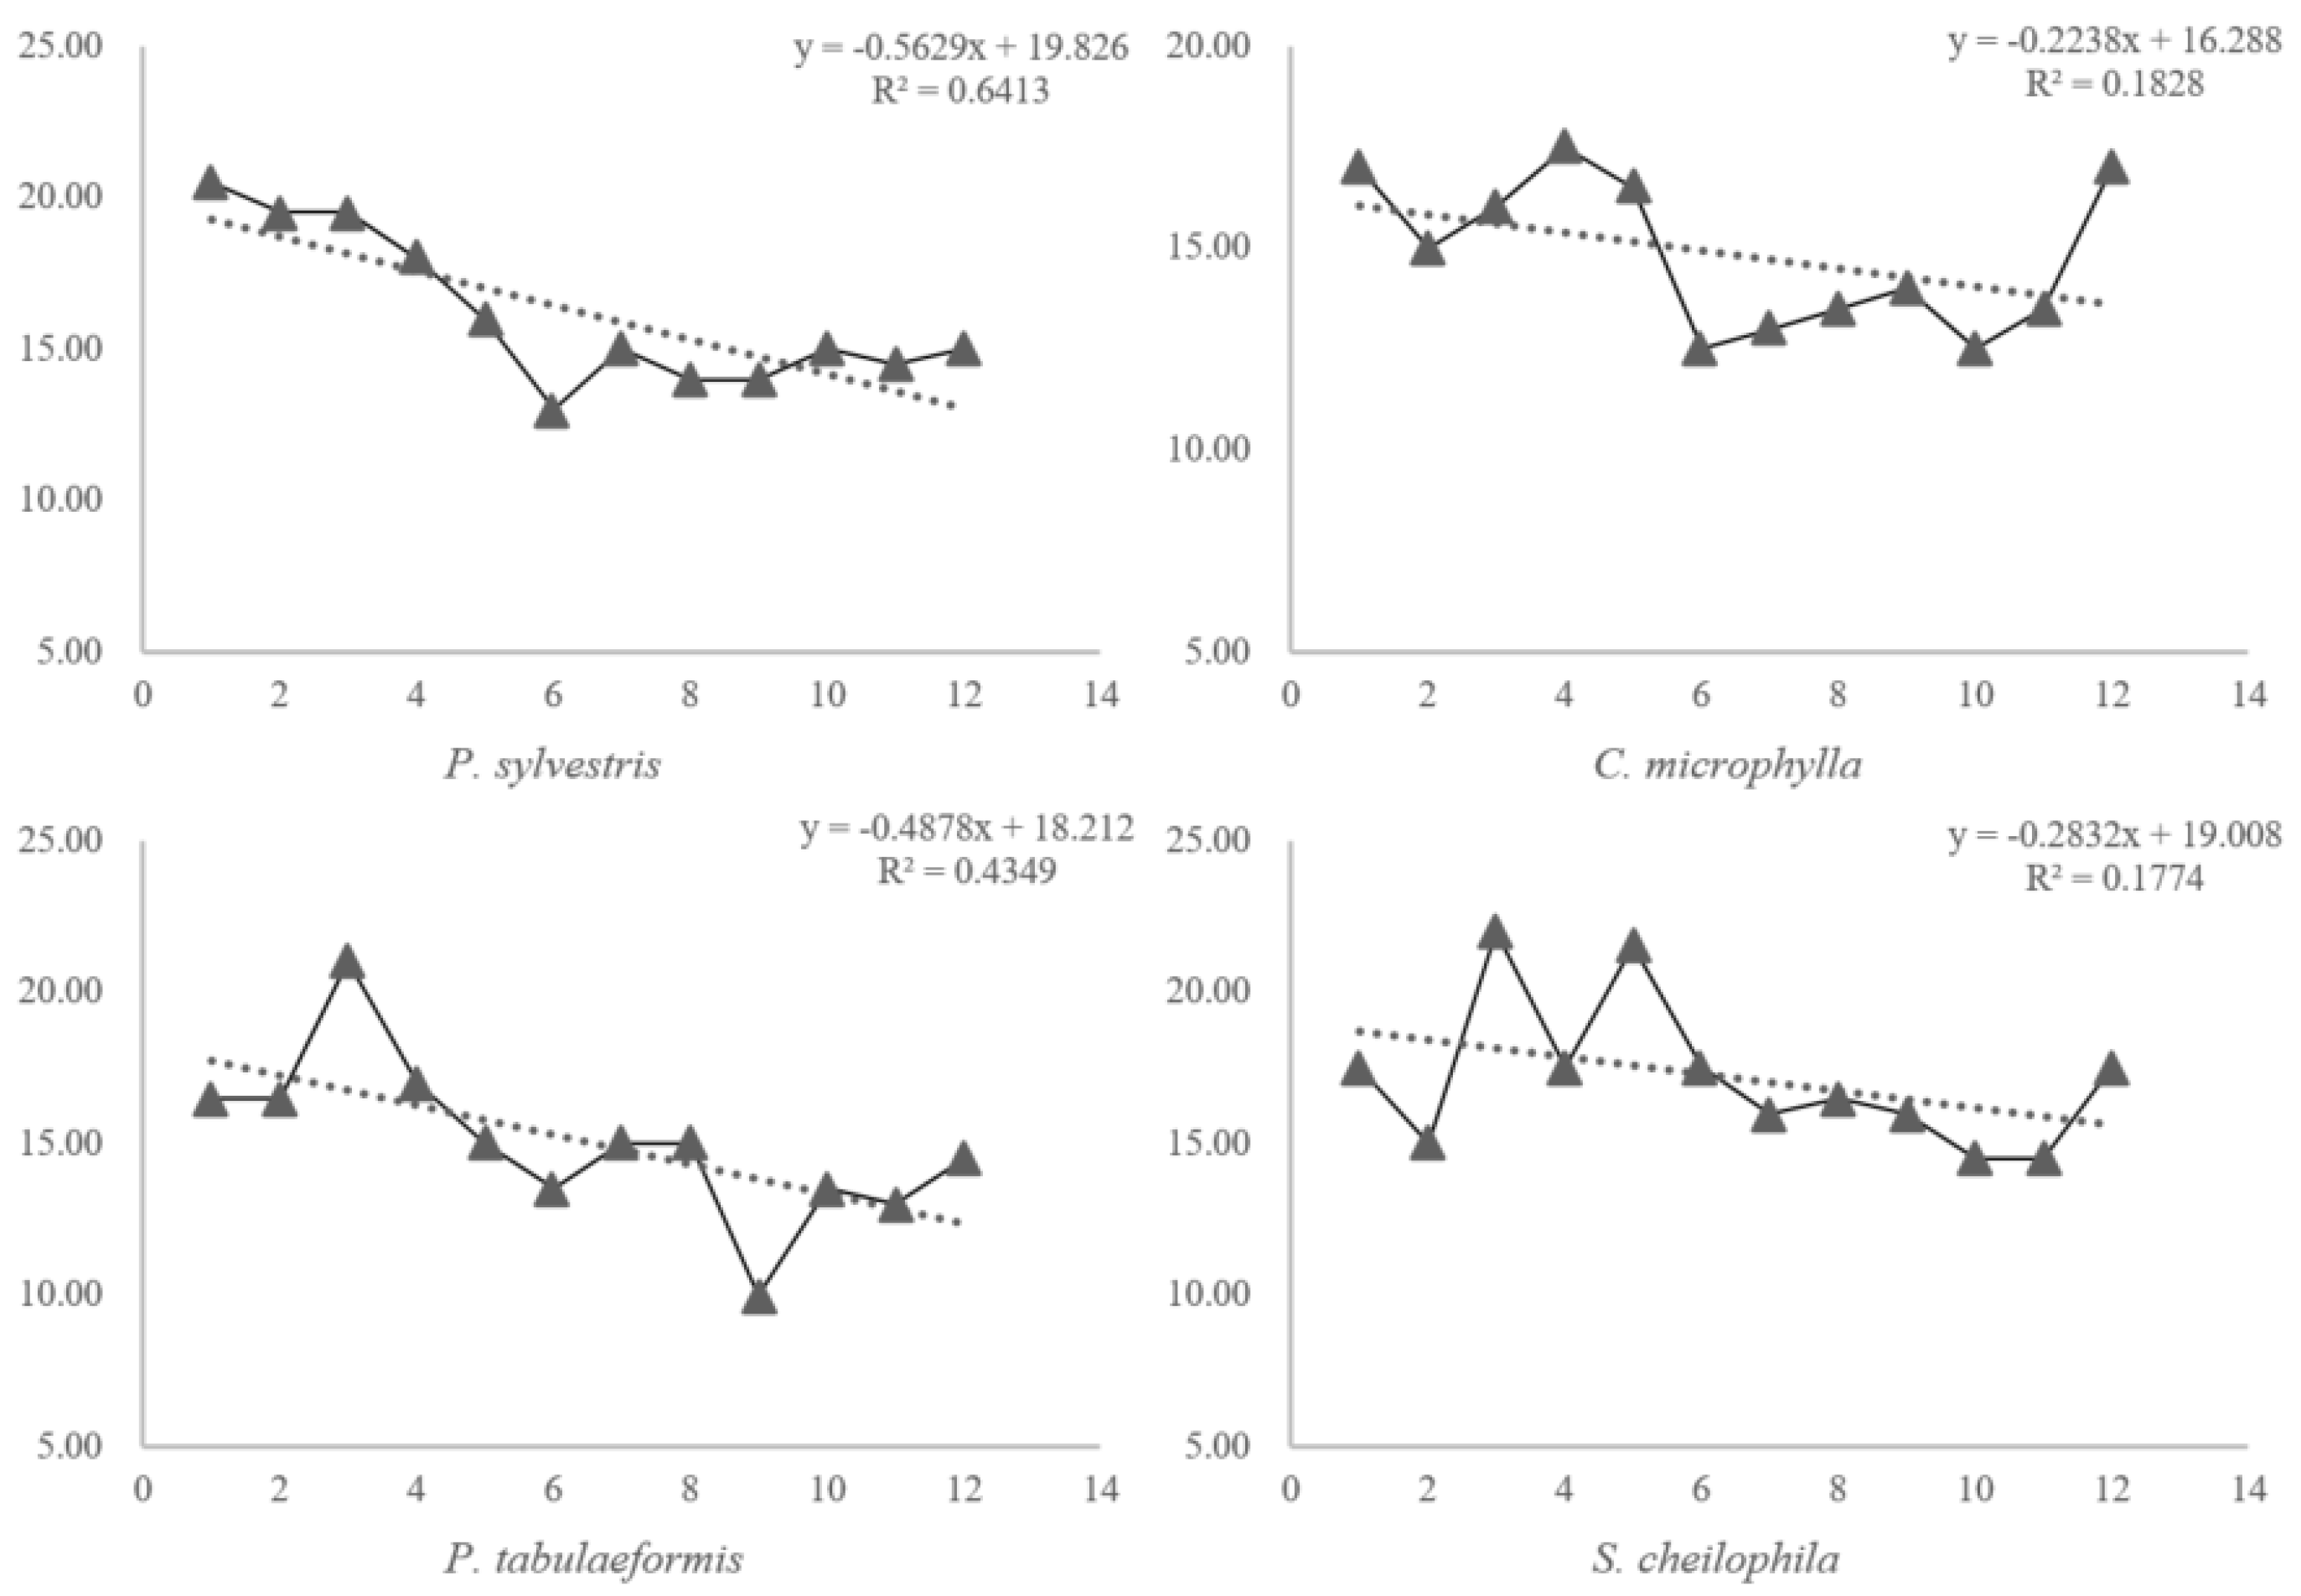
3.2. Soil Quality Evaluation Based on Changes in the Cmic/Corg Ratio
3.3. Verifying the Evaluation Results Using a BP Artificial Neural Network Model and Principal Component Analysis
4. Discussion
5. Conclusions
Author Contributions
Funding
Informed Consent Statement
Data Availability Statement
Acknowledgments
Conflicts of Interest
References
- Wallenstein, M.D.; Hall, E.K. A trait-based framework for predicting when and where microbial adaptation to climate change will affect ecosystem functioning. Biogeochemistry 2012, 109, 35–47. [Google Scholar] [CrossRef]
- Bardgett, R.D.; Freeman, C.; Ostle, N.J. Microbial contributions to climate change through carbon cycle feedbacks. ISME J. 2008, 2, 805–814. [Google Scholar] [CrossRef] [PubMed] [Green Version]
- Dieleman, W.I.; Vicca, S.; Dijkstra, F.A.; Hagedorn, F.; Hovenden, M.J.; Larsen, K.S. Simple additive effects are rare: A quantitative review of plant biomass and soil process responses to combined manipulations of CO2 and temperature. Glob. Chang. Biol. 2012, 18, 2681–2693. [Google Scholar] [CrossRef]
- Zhou, J.; Xue, K.; Xie, J.; Deng, Y.; Liyou, W.; Xiaoli, C. Microbial mediation of carbon-cycle feedbacks to climate warming. Nat. Clim. Chang. 2012, 2, 106–110. [Google Scholar] [CrossRef]
- Aerts, R. Climate, leaf litter chemistry and leaf litter decomposition in terrestrial ecosystems: A triangular relationship. Oikos 1997, 79, 439–449. [Google Scholar] [CrossRef]
- Parton, W.; Silver, W.L.; Burke, I.C.; Grassens, L.; Harmon, M.E.; Currie, W.S.; King, J.Y.; Adair, E.C.; Brandt, L.A.; Hart, S.C.; et al. Global-scale similarities in nitrogen release patterns during long-term decomposition. Science 2007, 315, 361–364. [Google Scholar] [CrossRef]
- Salinas, N.; Malhi, Y.; Meir, P.; Silman, M.; Roman, C.R.; Huaman, J.; Salinas, D.; Huaman, V.; Gibaja, A.; Mamani, M.; et al. The sensitivity of tropical leaf litter decomposition to temperature: Results from a large-scale leaf translocation experiment along an elevation gradient in Peruvian forests. New Phytol. 2011, 189, 967–977. [Google Scholar] [CrossRef]
- Norris, M.D.; Avis, P.G.; Reich, P.B.; Hobbie, S.E. Positive feedbacks between decomposition and soil nitrogen availability along fertility gradients. Plant Soil 2013, 367, 347–361. [Google Scholar] [CrossRef]
- Reid, A. Incorporating Microbial Processes into Climate Change Models; Report of the American Academy of Microbiology; American Academy of Microbiology: Washington, DC, USA, 2011. [Google Scholar]
- Treseder, K.; Balser, T.; Bradford, M.; Brodie, E.; Dubinsky, E.; Eviner, V. Integrating microbial ecology into ecosystem models: Challenges and priorities. Biogeochemistry 2012, 109, 7–18. [Google Scholar] [CrossRef] [Green Version]
- Collins, S.L.; Sinsabaugh, R.L.; Crenshaw, C.; Green, L.; PorrasAlfaro, A.; Stursova, M.; Zeglin, L.H. Pulse dynamics and microbial processes in aridland ecosystems. J. Ecol. 2008, 96, 413–420. [Google Scholar] [CrossRef]
- Dungait, J.A.J.; Hopkins, D.W.; Gregory, A.S.; Whitmore, A.P. Soil organic matter turnover is governed by accessibility not recalcitrance. Glob. Chang. Biol. 2012, 18, 1781–1796. [Google Scholar] [CrossRef]
- Wallenstein, M.D.; McMahon, S.K.; Schimel, J.P. Seasonal variation in enzyme activities and temperature sensitivities in Arctic tundra soils. Glob. Chang. Biol. 2009, 15, 1631–1639. [Google Scholar] [CrossRef]
- Wallenstein, M.; Allison, S.D.; Ernakovich, J.; Steinweg, J.M.; Sinsabaugh, R. Controls on the temperature sensitivity of soil enzymes: A key driver of in situ enzyme activity rates. In Soil E poipionzymology; Shukla, G.C., Varma, A., Eds.; Springer: Berlin, Germany, 2011; pp. 245–257. [Google Scholar]
- Richards, A.E.; Forrester, D.I.; Bauhus, J.; Scherer-Lorenzen, M. The influence of mixed tree plantations on the nutrition of individual species: A review. Tree Physiol. 2010, 30, 1192–1208. [Google Scholar] [CrossRef] [PubMed] [Green Version]
- Malchair, S.; Carnol, M. Microbial biomass and C and N transformation in forest floors under European beech, sessile oak, Norway spruce and Douglas-fir at four temperate forest sites. Soil Biol. Biochem. 2009, 41, 831–839. [Google Scholar] [CrossRef]
- Pereira, E.L.; Santos, S.A.P.; Arrobas, M.; Patricio, M.S. Microbial biomass and N mineralization in mixed plantations of broadleaves and nitrogen-fixing species. For. Syst. 2011, 20, 516–524. [Google Scholar] [CrossRef]
- Middleton, N.; Thomas, D. World Atlas of Desertification, 2nd ed.; Geographical Journal: London, UK, 1997. [Google Scholar]
- Lester, E.D.; Satomi, M.; Ponce, A. Microflora of extreme arid Atacama Desert soils. Soil Biol. Biochem. 2007, 39, 704–708. [Google Scholar] [CrossRef]
- Rasche, F.; Knapp, D.; Kaiser, C.; Koranda, M.; Kitzler, B.; Zechmeister-Boltenstern, S.; Richter, A. Sessitsch Seasonality and resource availability control bacterial and archaeal communities in soils of a temperate beech forest. ISME J. 2011, 5, 389–402. [Google Scholar] [CrossRef] [Green Version]
- Lauber, C.L.; Ramirez, K.S.; Aanderud, Z.; Lennon, J.; Fierer, N. Temporal variability in soil microbial communities across landuse types. ISME J. 2013, 7, 1641–1650. [Google Scholar] [CrossRef]
- Yang, S.S.; Tsai, S.H.; Fan, H.Y. Seasonal variation of microbial ecology in hemlock soil of Tatachia mountain, Taiwan. J. Microbiol. Immunol. 2006, 39, 195–205. [Google Scholar]
- Kujur, M.; Patel, A.K. Quantifying the contribution of different soil properties on microbial biomass carbon, nitrogen and phosphorous in dry tropical ecosystem. Int. J. Environ. Sci. 2012, 2, 2272–2284. [Google Scholar]
- Vance, E.D.; Brookes, P.C.; Jenkinson, D.S. An extraction method for measuring soil microbial C. Soil Biol. Biochem. 1987, 19, 703–707. [Google Scholar] [CrossRef]
- Bao, S.D. Soil and Agricultural Chemistry Analysis; China Agriculture Press: Beijing, China, 2000; pp. 145–198. (In Chinese) [Google Scholar]
- Fierer, N.; Jonathan, W.; Byron, J.A.; Uffe, N.N.; Scott, T.B.; Christian, L.L.; Sarah, O.; Jack, A.G.; Diana, H.W.; Caporaso, J.G. Cross-biome metagenomic analyses of soil microbial communities and their functional attributes. Proc. Natl. Acad. Sci. USA 2012, 109, 21390–21395. [Google Scholar] [CrossRef] [PubMed] [Green Version]
- Angel, R.; Conrad, R. Elucidating the microbial resuscitation cascade in biological soil crusts following a simulated rain event. Environ. Mircrobiol. 2013, 15, 2799–2815. [Google Scholar] [CrossRef] [PubMed]
- Valverde, A.; Makhalanyane, T.P.; Seely, M.; Cowan, D.A. Cyanobacteria drive community composition and functionality in rocksoil interface communities. Mol. Ecol. 2015, 24, 812–821. [Google Scholar] [CrossRef] [PubMed]
- Navarrete, A.A.; Kuramae, E.E.; Hollander, M.; Pijl, A.S.; Veen, V. Acidobacterial community responses to agricultural management of soybean in Amazon forest soils. FEMS Microbiol Ecol. 2013, 83, 607–621. [Google Scholar] [CrossRef] [Green Version]
- Hobbie, S.E. Temperature and plant species control over litter decomposition in Alaskan tundra. Ecol. Monogr. 1996, 66, 503–522. [Google Scholar] [CrossRef]
- Ruess, L.; Michelsen, A.; Schmidt, I.K.; Jonasson, S. Simulated climate change affecting microorganisms, nematode density and biodiversity in subarctic soils. Plant Soil 1999, 212, 63–73. [Google Scholar] [CrossRef]
- Wan, S.; Luo, Y.; Wallace, L.L. Changes in microclimate induced by experimental warming and clipping in tallgrass prairie. Glob. Chang. Biol. 2002, 8, 754–768. [Google Scholar] [CrossRef]
- Zhou, X.; Wan, S.; Luo, Y. Source components and interannual variability of soil CO2 efflux under experimental warming and clipping in a grassland ecosystem. Glob. Chang. Biol. 2007, 13, 761–775. [Google Scholar]
- Knorr, W.; Prentice, I.C.; House, J.I.; Holland, E.A. Long-term sensitivity of soil carbon turnover to warming. Nature 2005, 433, 298–301. [Google Scholar] [CrossRef]


| Chao1 | Good’s Coverage | Shannon | OTUs | |
|---|---|---|---|---|
| P. sylvestris | 7503.16 ± 414.189 | 0.918 ± 0.007 | 9.48 ± 0.37 | 5036 ± 742 |
| C. microphylla | 6130.645 ± 1305.308 | 0.933 ± 0.016 | 8.68 ± 0.73 | 4004 ± 627 |
| S. cheilophila | 6356.704 ± 1136.533 | 0.931 ± 0.013 | 9.12 ± 0.61 | 4635 ± 526 |
| P. tabulaeformis | 6231.064 ± 898.552 | 0.933 ± 0.010 | 9.25 ± 0.42 | 4372 ± 662 |
| P. sylvestris | C. microphylla | S. cheilophila | P. tabulaeformis | |
|---|---|---|---|---|
| Factor (X) | SM | ST | ST | SM |
| Pearson Correlation | 0.720 | 0.353 | 0.420 | 0.374 |
| Sig. | 0.000 | 0.091 | 0.041 | 0.074 |
| Curve | Cubic | Linear | S-shaped | Logical |
| AR2 | 0.632 | 0.084 | 0.177 | 0.119 |
| Equation (Y = Cmic/Corg) | Y = 0.176 − 0.001X2 + (5.716 × 10−5)X3 | Y = 0.11X + 0.018 | Ln(Y) = −0.807 − 38.564/X | Ln(1/Y) = 44.294 + 0.935 X |
| P. sylvestris | C. microphylla | S. cheilophila | P. tabulaeformis | |
|---|---|---|---|---|
| Original factor | SM | ST | ST | SM |
| Final factor | ID | AT | AT | ID |
| Independent replaced | SM = −0.5629ID + 19.826 | ST = 1.05AT | ST = 1.02 AT | SM = 0.4878ID + 18.212 |
| Final equation | Y = 0.5787 − 0.0103X2 − 0.0223X | Y = 0.1155X + 0.0188 | Y = 1/[0.4462EXP(37.8078/X)] | Y = 1/[0.2336EXP(0.4561X)] |
| TN (g/kg) | TP (g/kg) | TK (g/kg) | AN (mg/kg) | AP (mg/kg) | AK (mg/kg) | SOC (g/kg) | |
|---|---|---|---|---|---|---|---|
| P. sylvestris | 0.19 ± 0.01 | 0.25 ± 0.00 | 22.48 ± 0.30 | 17.50 ± 1.08 | 1.06 ± 0.05 | 89.50 ± 14.78 | 0.07 ± 0.01 |
| C. microphylla | 0.21 ± 0.01 | 0.28 ± 0.17 | 22.03 ± 0.09 | 22.16 ± 0.12 | 1.45 ± 0.20 | 82.17 ± 6.26 | 0.09 ± 0.02 |
| S. cheilophila | 0.17 ± 0.26 | 0.23 ± 0.01 | 23.00 ± 0.39 | 17.44 ± 0.70 | 0.68 ± 0.09 | 139.58 ± 12.58 | 0.08 ± 0.00 |
| P. tabulaeformis | 0.14 ± 0.01 | 0.23 ± 0.00 | 23.00 ± 0.12 | 18.95 ± 0.65 | 1.60 ± 0.60 | 92.25 ± 26.76 | 0.08 ± 0.00 |
| Component | Initial Eigenvalues | Extraction Sum of Squared Loadings | ||||
|---|---|---|---|---|---|---|
| Total | % of Variance | Cumulative % | Total | % of Variance | Cumulative % | |
| 1 | 3.100 | 44.284 | 44.284 | 3.100 | 44.284 | 44.284 |
| 2 | 1.341 | 19.154 | 63.438 | 1.341 | 19.154 | 63.438 |
| 3 | 1.053 | 15.040 | 78.478 | 1.053 | 15.040 | 78.478 |
| 4 | 0.827 | 11.819 | 90.298 | 0.827 | 11.819 | 90.298 |
| 5 | 0.443 | 6.323 | 96.621 | |||
| 6 | 0.148 | 2.120 | 98.740 | |||
| 7 | 0.088 | 1.260 | 100.000 | |||
| Classification | TN (g/kg) | TP (g/kg) | TK (g/kg) | AN (mg/kg) | AP (mg/kg) | AK (mg/kg) | SOC (g/kg) |
|---|---|---|---|---|---|---|---|
| 1 | >2 | >1 | >25 | >150 | >40 | >200 | >40 |
| 2 | 1.5–2.0 | 0.8–1 | 20–25 | 120–150 | 20–40 | 150–200 | 30–40 |
| 3 | 1.0–1.5 | 0.6–0.8 | 15–20 | 90–120 | 10–20 | 100–150 | 20–30 |
| 4 | 0.7–1.0 | 0.4–0.6 | 10–15 | 60–90 | 5–10 | 50–100 | 10–20 |
| 5 | 0.5–0.7 | 0.2–0.4 | 5–10 | 30–60 | 3–5 | 30–50 | 6–10 |
| 6 | <0.5 | <0.2 | <5 | <30 | <3 | <30 | <6 |
Publisher’s Note: MDPI stays neutral with regard to jurisdictional claims in published maps and institutional affiliations. |
© 2022 by the authors. Licensee MDPI, Basel, Switzerland. This article is an open access article distributed under the terms and conditions of the Creative Commons Attribution (CC BY) license (https://creativecommons.org/licenses/by/4.0/).
Share and Cite
Wang, Y.; Wang, S.; Zhou, C.-S.; Chi, W.-F. Application of Cmic/Corg in the Soil Fertility Evaluation of Typical Forests in the Yulin Sandy Area. Land 2022, 11, 559. https://doi.org/10.3390/land11040559
Wang Y, Wang S, Zhou C-S, Chi W-F. Application of Cmic/Corg in the Soil Fertility Evaluation of Typical Forests in the Yulin Sandy Area. Land. 2022; 11(4):559. https://doi.org/10.3390/land11040559
Chicago/Turabian StyleWang, Yue, Shan Wang, Chun-Sheng Zhou, and Wen-Feng Chi. 2022. "Application of Cmic/Corg in the Soil Fertility Evaluation of Typical Forests in the Yulin Sandy Area" Land 11, no. 4: 559. https://doi.org/10.3390/land11040559
APA StyleWang, Y., Wang, S., Zhou, C. -S., & Chi, W. -F. (2022). Application of Cmic/Corg in the Soil Fertility Evaluation of Typical Forests in the Yulin Sandy Area. Land, 11(4), 559. https://doi.org/10.3390/land11040559