Article

Oil Palm Land Use Change and Rice Sustainability in South Sumatra, Indonesia

1
Research Center for Population, National Research and Innovation Agency, Jakarta 12710, Indonesia
2
Department of Human Geography, The University of Tokyo, Tokyo 1538902, Japan
*
Author to whom correspondence should be addressed.
Land 2022, 11(5), 669; https://doi.org/10.3390/land11050669
Submission received: 23 February 2022 / Revised: 8 April 2022 / Accepted: 21 April 2022 / Published: 30 April 2022

Abstract

:
The massive development of oil palm plantations has made Indonesia the country with the largest land area of oil palm production in the world. However, it is feared that the massive development of oil palm will disrupt national food security. This paper aims to examine the implications of the development of oil palm plantations on the sustainability of rice plants in South Sumatra. The data for analysis are secondary data from the Ministry of Agriculture and the Central Statistics Agency of Indonesia. The results showed that, in the period of 1991–2017, the oil palm land area in South Sumatra increased by more than the rice area. Several districts have become centers of oil palm development, especially Musi Banyuasin and OKU. Although it is increasing rapidly, the development of oil palm does not interfere with the sustainability of rice in South Sumatra, which can be seen from the increase of the land area and productivity of rice. The areas of oil palm land in Musi Banyuasin and OKU is dominant over that of rice. With the more rapid development of the oil palm land area, in the next few years the dominance of oil palm plantations over rice will occur in several districts in South Sumatra.

1. Introduction

Rice is central to the food security of about half of the world’s population [1]. In Indonesia, rice is a staple food for more than 95 percent of the population. Rice is also a strategic political commodity, such that domestic rice production is a measure of food availability for Indonesia [2]. Efforts to meet rice needs in Indonesia have been carried out for a long time, especially through the food self-sufficiency program in the 1980s. In 2019, Indonesia produced 54.6 million tons of rice, placing Indonesia as the third-largest rice producer in Asia, after China and India [3]. However, the rice production is still lower than the needs of Indonesia’s 266.91 million population. In order to meet national rice needs, in the 2015–2019 period, on average, Indonesia imported 1.03 million tons of rice per year [4]. It is estimated that the demand for rice in Indonesia will increase because the population is expected to increase to 318.96 million in 2045 [5]. Hence, national rice production should be maintained and even increased, such that that food security in Indonesia can be maintained.
Increasing rice production faces various challenges, including the expansion of oil palm plantations as Indonesia’s leading commodity. The export value of oil palm in 2018 reached US$ 17.90 billion, or 10.99% of the total non-oil and gas exports [6]. Oil palm absorbs 2.56 million farmers and 4.25 million workers [7]. The oil palm area increased from 294.560 ha in 1980 to 14.02 million ha in 2017. Sumatra and the Kalimantan islands are centers of oil palm development because they have 94.5% of the total oil palm land in Indonesia. The area of oil palm land in Sumatra in 2017 was 8.38 million ha (59.6%), while that in Kalimantan Island was 4.9 million ha, or 34.7% of the total land area [8]. It is feared that the uncontrolled development of oil palm plantations will have an impact on the degradation of water resources and the decrease in environmental quality, which will ultimately decrease food production.
Land conversion from rice to oil palm is often associated with a decrease rice area, mainly in oil palm development centers. This is supported by the fact that massive oil palm development has an impact on land-use change [9,10,11,12]. Various studies show that land change from non-oil palm to oil palm occurs in various types of commodities, such as rubber plantations [13], rice crops [14,15,16], and forests [17,18]. Farmers choose to cultivate oil palm because this plant is more economically profitable [13,19,20]. This change in land use from rice to oil palm is feared to threaten the sustainability of food crops, especially rice. Hence, land use management should be carried out properly to prevent the decline in rice agricultural land as a result of the conversion to oil palm plantations.
The there is a chance of the occurrence of rice land-use change to oil palm in South Sumatra because the area of oil palm land in South Sumatra has increased faster than that of rice. Oil palm land increased from 94,186 ha in 1991 to 1.07 million ha in 2017, while rice land increased from 370,181 ha in 1991 to 999,972 ha in 2017. Efforts to prevent the reduction of rice land need to be carried out, such that rice farming is sustainable. This is refers to the concept of sustainable agriculture, namely agriculture that is long-term, sustainable, and does not cause disasters. The concept has become widespread, and reflects different values, priorities, and goals [21], [22]. In various concepts, land use is a key indicator of sustainable agricultural development, including land capability [23], land productivity [24], [25], land use pattern [26], and the percentage of land planted with a crop [27].
In order to maintain food sustainability in Indonesia, it is necessary to analyze the development of rice and oil palm land in oil palm development centers such as South Sumatra. However, specific research on the implications of oil palm development for rice in South Sumatra has not been carried out. On the other hand, efforts to increase rice production require accurate information about the development of rice fields in the midst of expanding oil palm plantations. Therefore, this study aims to determine the pattern of oil palm development in South Sumatra and its implications for the sustainability of rice fields. In particular, this study aims to analyze the trend of the development of oil palm land area and its implications for the sustainability of rice plants.

2. Data and Methods

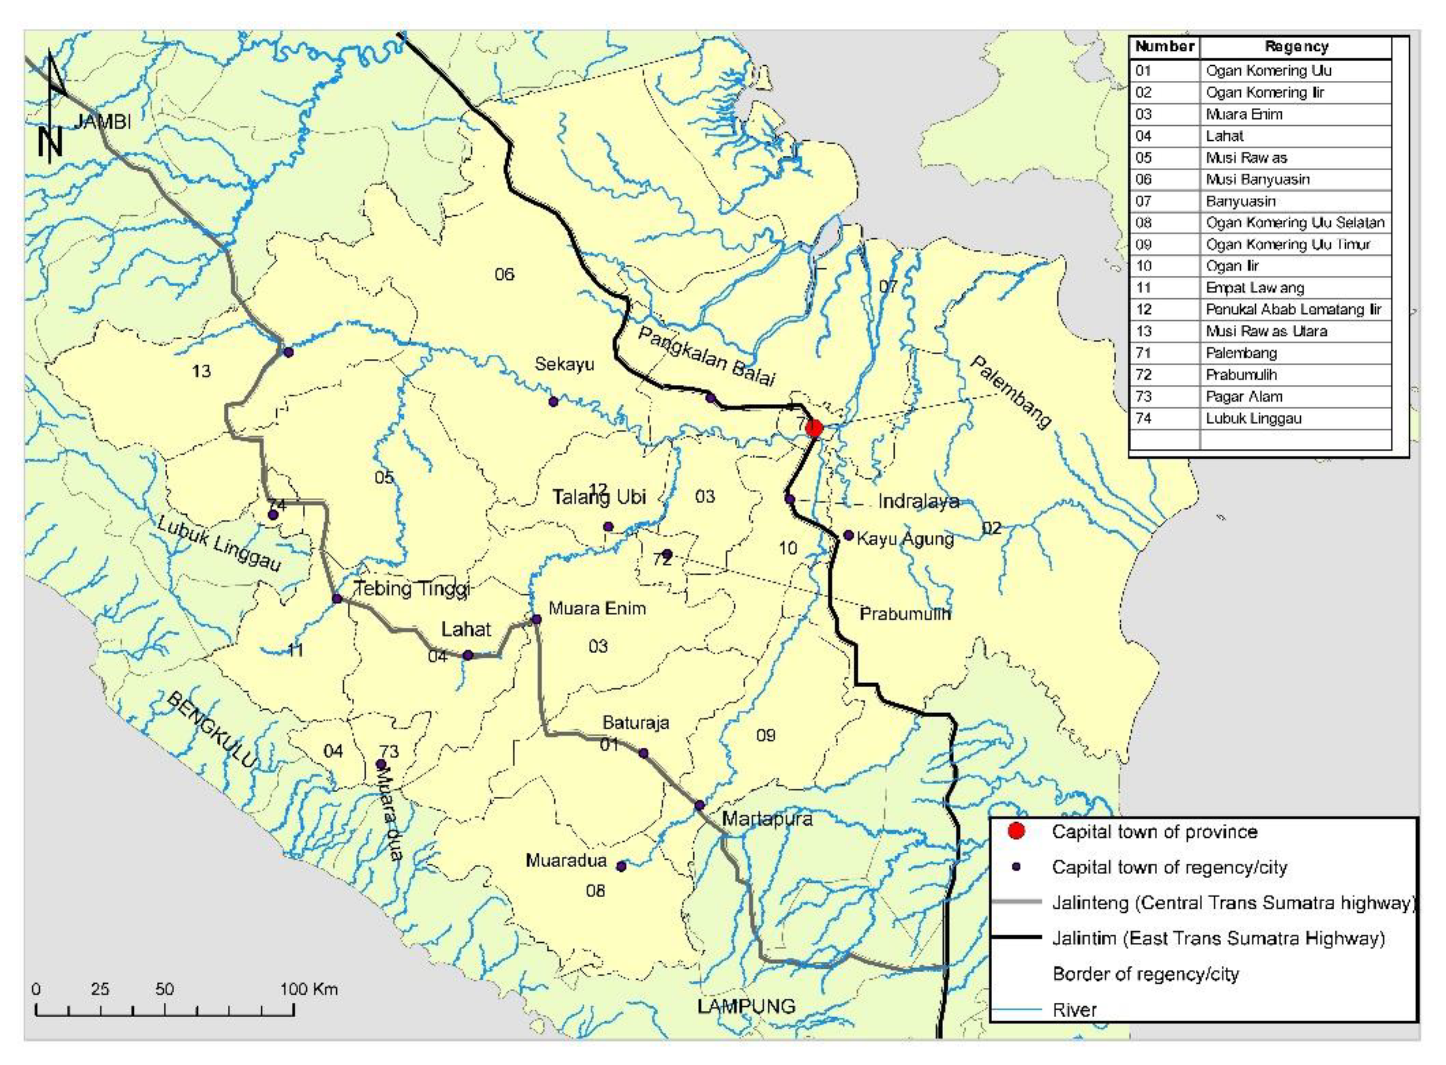
2.1. General Condition of South Sumatra

South Sumatra Province is located between 1° and 4° south latitude, and 102° and 106° east longitude, with a total area of 870.17 km2. The province is bordered by Jambi Province in the north, Lampung Province in the south, Bangka Belitung Province in the east, and Bengkulu Province in the west (Figure 1). Topographically, South Sumatra is divided into three regions. The first is the east coast of the land, consisting of swamps and brackish waters that are affected by tides. The vegetation is in the form of palmaceae and mangroves. The second is a vast lowland which is slightly to the west, and the third is farther into the western mainland region, in which the contours are hillier. This province consists of 13 district and four cities.
South Sumatra has the Bukit Barisan mountain range, which divides it into hills and valleys. The hilly areas have an altitude of 900–1200 m above sea level. Some of the highest peaks on the Bukit Barisan include the peaks of Mount Seminung (1904 m), Mount Dempo (3190 m), Mount Patah (1107 m), and Mount Bungkuk (2125 m). The western part of Bukit Barisan is a slope. Throughout this region, there are rubber, oil palm, coffee, and tea plantations, as well as various kinds of vegetable plantation. Meanwhile, low-lying and hilly areas have the potential to develop food crops and plantations.
South Sumatra has several rivers that play an important role in the development of oil palm as a crop that requires a lot of water to thrive. Most of the rivers’ waters are derived from the Bukit Barisan, except the Mesuji, Lalan and Banyuasin rivers. Among these rivers, the Musi River gets its water from the Bukit Barisan, and empties into the Bangka Strait. Ogan, Komering, Lematang, Kelingi, Lakit, Rupit and Waras Rivers are tributaries of the Musi River.

2.2. Data Collection and Analysis

In order to analyze the implications of oil palm development on rice fields, we collected data on the rice and oil palm land area. The data on the area of oil palm and rice land collected are for the 1991–2017 time period. The 2018 data is not included in the analysis because it does not present the area of oil palm land at the district level. The oil palm land data were collected by tracing secondary data from the Indonesian Ministry of Agriculture and the Central Statistics Agency of Indonesia. The source of the rice land area and productivity in the province level was the Central Statistics Agency of South Sumatra. We also collected data on the district area based on the Indonesian Central Statistics Agency.
The data collected were analyzed in order to discuss the development of oil palm, the spatial distribution of oil palm, and the development of rice land use in South Sumatra. The data analysis was carried out descriptively, both with maps and graphs. We calculated the proportion of oil palm acreage as follows:
POPi   = ( AOPi / DAi ) 100 % )  
POPi is the proportion of oil palm acreage for year i, AOPi is the total acreage of oil palm in year i, and DAi is a district area in year i.
We also calculated the proportion of rice acreage as follows:
PRi   = ( ARi / DAi ) 100 % )  
PRi is the proportion of rice acreage of year i, ARi is the total acreage of rice in year i, and DAi is a district area in year i.
The proportion of oil palm acreage in this study is divided into five categories: very low (green) = 0–1 %, low (light green) = 2–5 %, medium (yellow) = 6–10 %, high (orange) = 11–15 %, and very high (red) = 16% and above.

3. Results

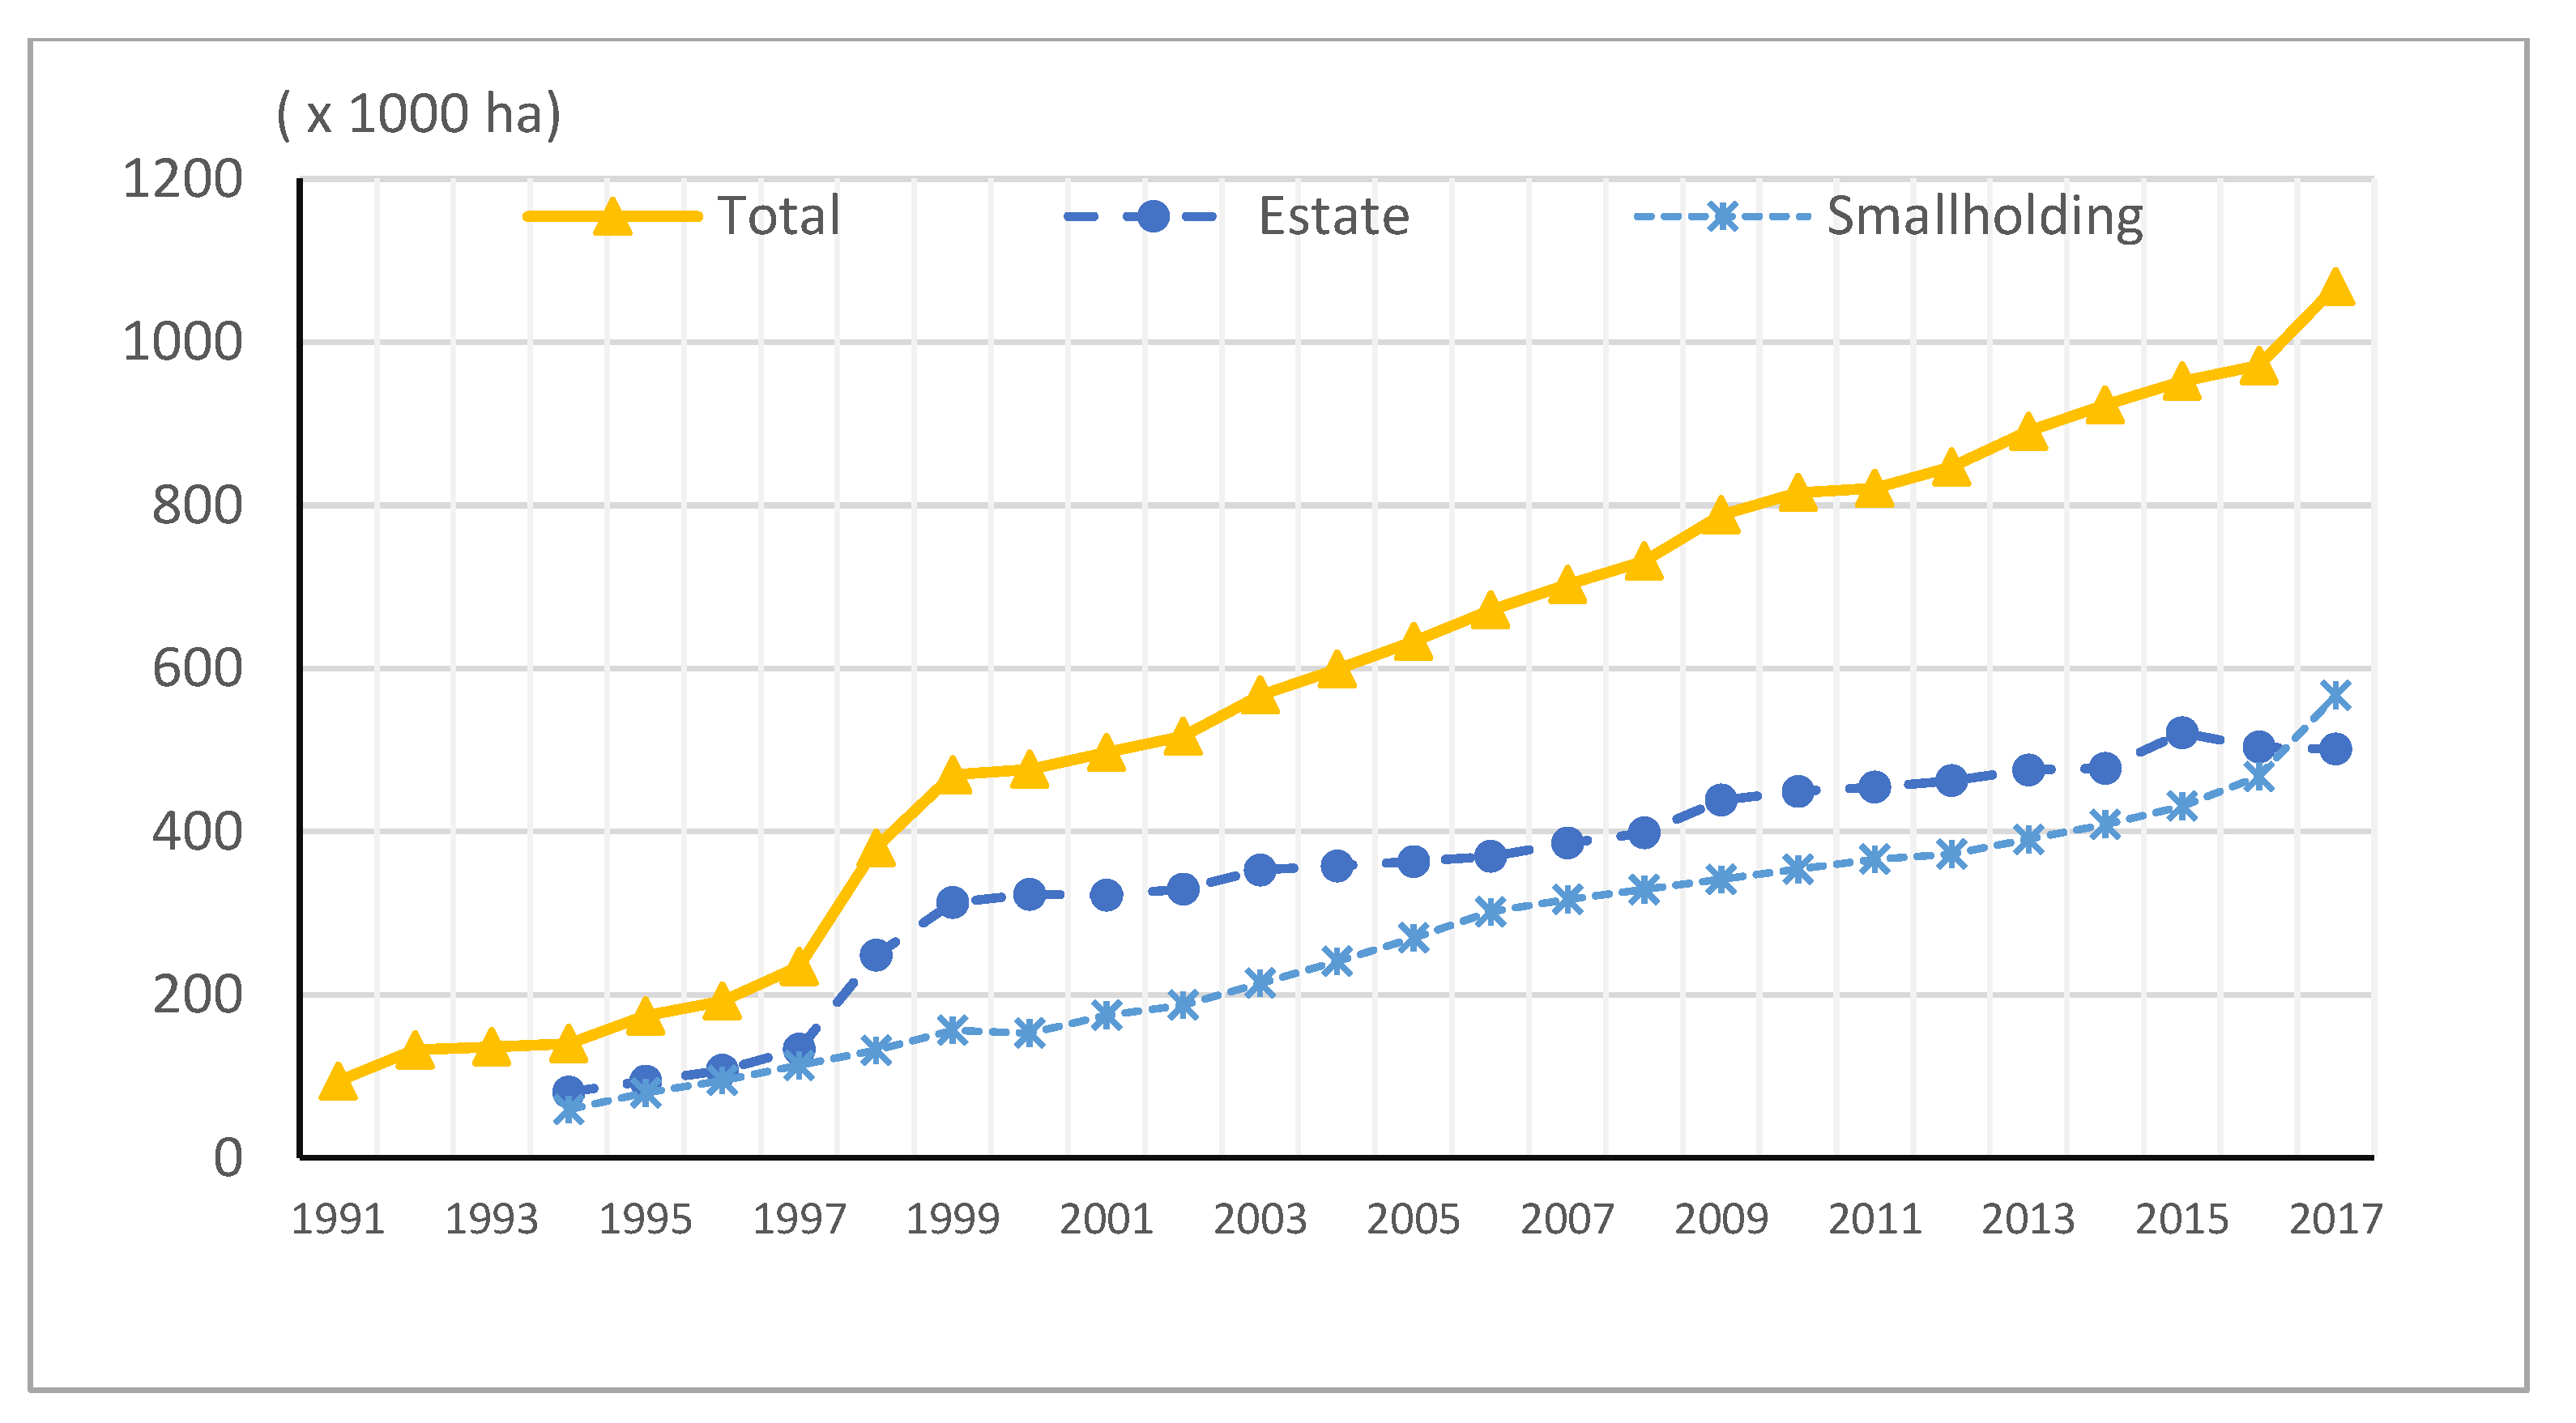
3.1. The Trend of Oil Palm Land Use in South Sumatra

The area of oil palm plantations in South Sumatra grew from 94,186 ha in 1991 to 1,068,049 ha in 2017. During this period, the average oil palm area grew by 39.8%/year. This development period was supported by the PIR-Trans project (1986–1997), which involved private plantations as nucleus companies. At the beginning of the PIR-Trans project, the acreage of oil palm land was still slowly developing. Then, in 1997–1999 there was an explosion in the acreage of oil palm plantations of private estates, while smallholding oil palm was growing slowly, and state oil palm was relatively stable (Figure 2). The oil palm acreage of the private company increased from 106,220 ha in 1997 to 278,256 ha in 1999, i.e., it increased by 162% in two years. On the other hand, the smallholders’ plantations increased from 113,680 ha in 1997 to 156,601 ha in 1999, i.e., 38% in two years.
After 1999, the development of oil palm estates slowed down until 2008, while the oil palm smallholdings were growing rapidly. In 1999–2008 the private oil palm acreage increased by an average of 0.8% per year. On the other hand, smallholding oil palm plantations expanded from 156.601 ha in 1999 to 301.875 ha in 2008, increasing by an average of 11.6% per year. After 2008, oil palm estates grew slowly and steadily after 2016, while oil palm smallholders grew slowly, but faster after 2016. In 2017, oil palm smallholders were larger than oil palm estates, at 566,876 ha and 501,173 ha, respectively.

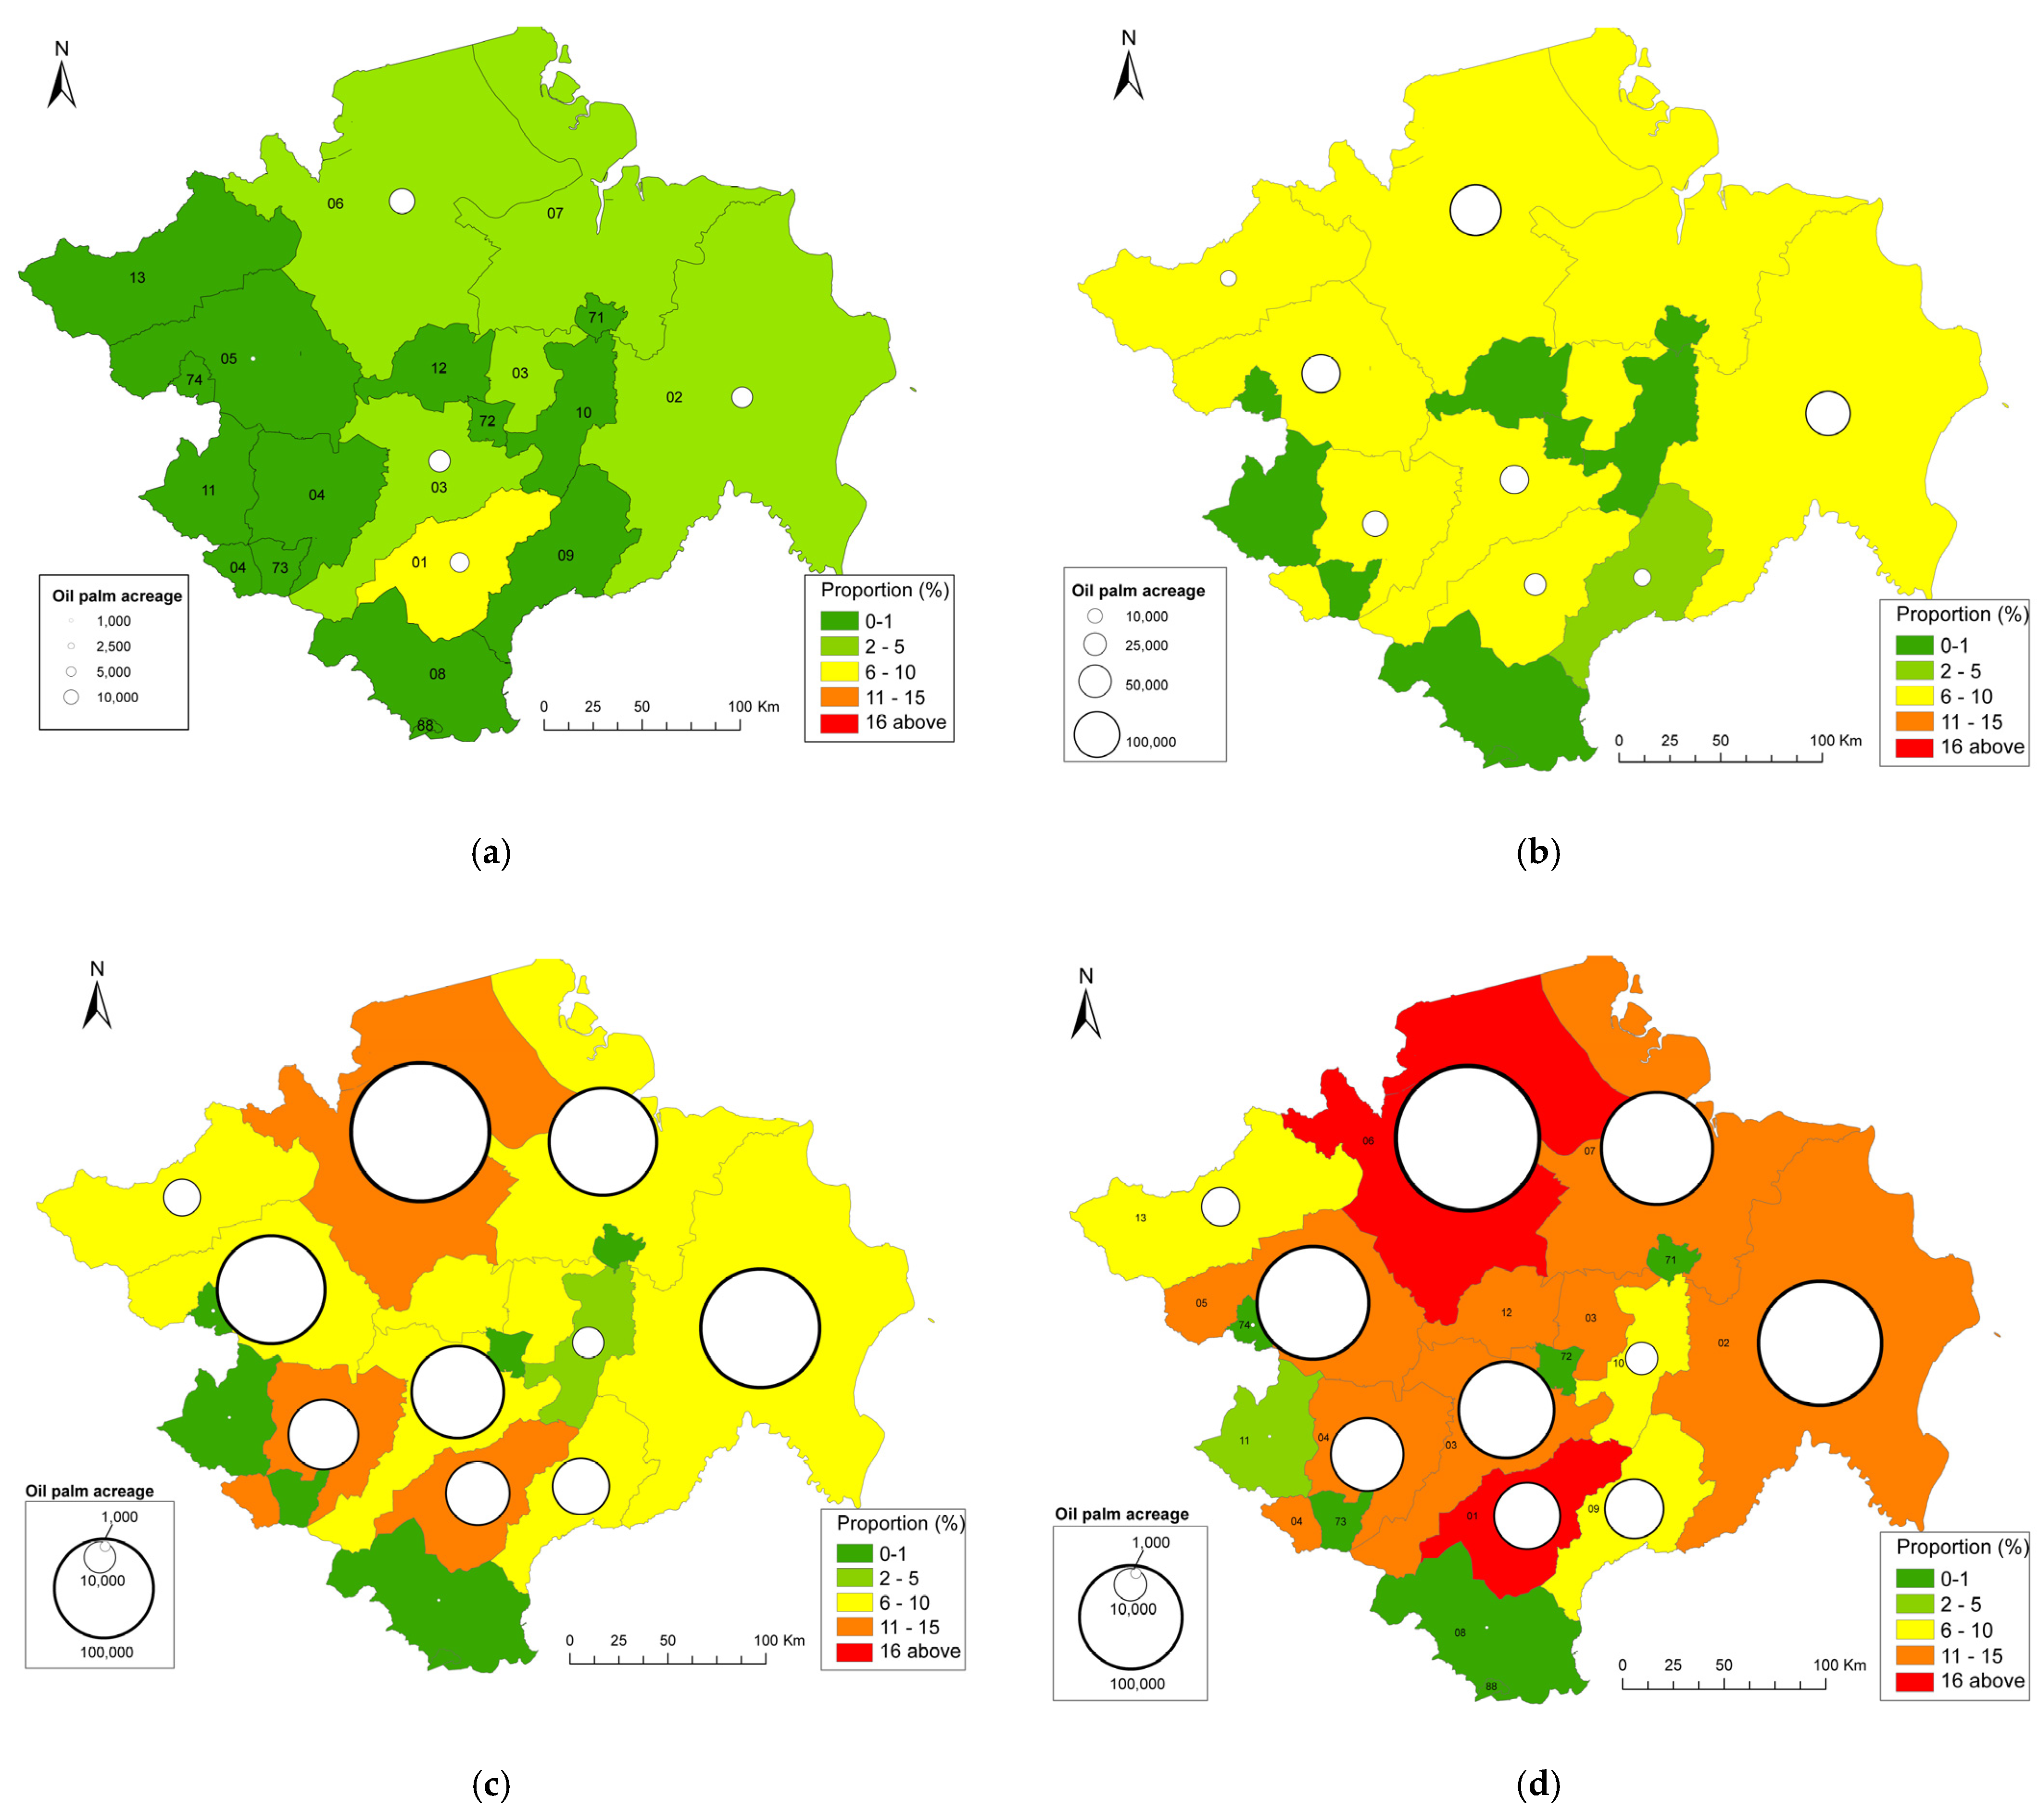
3.2. Spatial Distribution of Oil Palm

The spatial distribution of oil palm plantations in South Sumatra is presented in four-time points (Figure 3). The process of developing oil palm land in South Sumatra shows a shift from green areas to red areas, but there are districts that, until 2017, were still in the green area category. In 1991, oil palm had spread over six districts in South Sumatra, with a total acreage of 91,186 ha. The dominance of green areas still occured, but some districts changed to a light green color, which means that the proportion of oil palm acreage is 2–5%. At the time, the largest proportion of oil palm acreage to the district area is in Ogan Komering Ulu (OKU). The development of oil palm in the three districts is supported by the Nucleus Estate Smallholders Transmigration (PIR Trans) project, which is managed by the private estate.
Oil palm plantations in South Sumatra continued to grow to 496,950 ha in 2001. Based on the proportion of oil palm acreage to the district area, green areas began to become minor while yellow dominated. At that time, some districts which were located in hilly areas had not yet developed oil palm plantations. The development of oil palm in this period is supported by the Nucleus Estate Smallholders Credit to Primary Cooperative for its Members (PIR KKPA) project. In this project, the nucleus plasma is a private estate. Oil palm continued to increase to 809,821 ha in 2011. This year, the proportion of oil palm acreage to the total area in three districts was high (11–15%), i.e., in Musi Banyuasin, South OKU, and Lahat.
The acreage of oil palm in South Sumatra continued to grow, and in 2017 it reached 1.13 million ha. At that time, there was a domination of the district in which the proportion of oil palm land acreage to the district area was high and very high. There were two districts with a very high proportion of oil palm (16% and over): Musi Banyuasin and OKU. There are also five districts with a high proportion (11–15%): Ogan Komering Ilir, Banyuasin, Muara Enim, PALI, Musi Rawas and Lahat. The two districts with the largest oil palm acreage, namely Musi Banyuasin and Ogan Komering Ilir, had areas of 330,784 ha and 213,005 ha, respectively.

3.3. Rice Sustainability in South Sumatra

3.3.1. Rice Land-Use Change

Rice land in South Sumatra increased from 370,181 ha in 1991 to 999,972 ha in 2017. In the 1991–2017 period, the area of rice land increased by 6.54%/year. During the 1998 economic crisis, the area of rice fields in South Sumatra seemed to have increased more, then decreased in 1999 (Figure 4). Starting in 2001, the area of rice fields increased gradually until 2017. All of the rice development was carried out by farmers, and there was no development carried out by large companies such as oil palm.
The distribution of rice land development in South Sumatra by district is shown in Figure 5. In 1991, the largest land area was in Musibanyuasin District (125.476 ha), followed by the Ogan Komering Ulu (OKU) and Ogan Komering Ilir (OKI) districts. However, the largest proportion of rice land area to the total area is in OKU District, which is at the middle level (6–10%). At that time, the East OKU and southern OKU districts were still part of the OKU district. In 2001, the area of rice fields in South Sumatra increased to 511,928 ha. The largest area of rice land was in Musibanyuasin District (164,032 ha), followed by the OKI and OKU Regencies. The proportion of rice land area to the area in several districts was at the medium level (6–10%), up from the previous low level, namely in the Musi Banyuasin, Ogan Komering Ilir, and Lahat Regencies.
In 2011, the area of rice fields in South Sumatra was 784,820 ha. The largest rice area was in Banyuasin District, which in 2001 became part of Musibanyuasin District (190,341 ha), followed by East OKU (130,288 ha) and OKI (129,799 ha). However, the East OKU and Ogan Ilir Regencies had a very large proportion of rice land area (>16%), such that both districts were the main centers of rice development in South Sumatra. The proportion of land area in Banyuasin District was high (11–15%). At this time, the cities of Pagaralam and Palembang were also areas where the proportion of rice land area to the total area was at a high level (11–15%).
In 2017, the area of rice fields in South Sumatra was 999,972 ha. The three districts with the largest rice area were Banyuasin, East OKU, and OKI. The proportion of rice land area to the total area in the three districts was very high level (>16%). The three districts were the main centers for the development of rice crops in South Sumatra. The area of rice land in several districts also increased, namely Lahat, Musirawas, and Empat Lawang districts. The proportion of rice land area to the area in the district was 11–15%. The area of rice land in the Muara Enim and PALI regencies also increased, such that the proportion of rice land was at the middle level (6–10%).
In more detail, the development of rice and oil palm land area by district is presented based on data for 2011 and 2017. At these two time points, the composition of districts in South Sumatra had stabilized, such that the data between the districts can be compared. The data show that in the period of 2011–2017, the area of rice land in South Sumatra increased by 4.6% per year, while oil palm was 6.6%/year. In several districts, the area of rice land grew negatively, namely Empat Lawang and OKU. Negative developments in oil palm occurred in Lahat District (Table 1).
The four districts with the largest rice fields in South Sumatra were Banyuasin, East OKU, Ogan Komering Ilir, and Musibanyuasin. In the four districts, the rice and oil palm areas grew positively. However, the growth of oil palm land was greater than that of rice land. Two districts experienced very high oil palm land growth (>400%/year), namely Empat Lawang District and South OKU. If this pattern of development continues, oil palm will become increasingly dominant in several districts in South Sumatra.
The ratio of the land area of rice to oil palm in South Sumatra in 2017 was 0.9, such that the area of land for oil palm was larger than rice. However, in some districts, rice fields were larger than oil palm, namely Banyuasin, East OKU, Ogan Ilir, Empat Lawang, South OKU and Lubuk Linggau. In 2011, the rice fields in Empat Lawang and South OKU districts were very dominant compared to oil palm, but this dominance decreased in 2017. On the other hand, oil palm was dominant in other districts. In 2017, the smallest ratio of rice land to oil palm occurred in the Musibanyuasin and OKU districts, at 0.2 and 0.3, respectively, which indicates that oil palm was very dominant in these two districts.

3.3.2. Rice Productivity

Rice productivity in South Sumatra increased from 3.2 tons/ha/year in 1991 to 4.9 tons/ha/year in 2017 (Figure 6). This productivity is close to the national figure of 5.17 tons/ha of dry milled grain, in 2017. Compared to rice-producing countries, this productivity is lower than China, which produces 7.06 tons/ha, and Vietnam, which produces 5.82 tons/ha. However, it is higher than that of Bangladesh, which produces 4.62 tons/ha, India (2.69 tons/ha), and Thailand (2.92 tons/ha) [3].
The data shows that the productivity of rice fields in South Sumatra is at the level of national productivity. This fact shows that the development of oil palm plantations in South Sumatra is not directly related to the decline in rice productivity. This situation occurs because the oil palm planting area is generally far from that of the rice development area. Nevertheless, the excessive development of oil palm should be watched out for, because it can damage the ecosystem that has been built. In addition, it is feared that the dominant oil palm plantation will damage the balance of nature, which affects the decline in land productivity.

4. Discussion

Oil palm land use in South Sumatra increased, on average, by 39.8%/year in the period 1991–2017. The rapid development of oil palm plantations in South Sumatra involves the roles of the state estate, private estate, and smallholders. In the period before and during the crisis, the company’s role in oil palm development was very dominant. The role of state companies began at the beginning of oil palm development, while private companies began in 1986 in conjunction with the PIR-Trans project. The development of oil palm began with two PIR-Bun projects in the 1980s, namely PIR-Bun Talang Sawit in Musi Banyuasin and Muara Enim [29]. At that time, the state company was dominant due to its role as a nucleus company in the PIR-Bun project [30].
In the 1998 economic crisis, private companies played a dominant role, marked by a sharp increase in the area of oil palm plantations of private companies. This is inseparable from government policies that encouraged export-based industries to increase the country’s foreign exchange, one of which was oil palm [31]. Another study found that during the crisis some plantation sub-sector products, such as oil palm, cacao, cloves, and cocoa were the most sought-after. The sharp depreciation of the Indonesian currency (IDR) increased the export earnings for farmers and agribusiness entrepreneurs. In line with the windfall profit, the need for labor and business expansion is also increasing [32]. In reality, there are 55 investment companies in Musi Banyuasin with a total area of 193,974 ha, and 26 investment companies in Musi Rawas with an acreage of 59,317 ha [30].
After the crisis, smallholding was dominant for oil palm development, while private companies tended to remain. Smallholders have logical reasons to choose oil palm plantations. This commodity provides a high income [19,33,34,35]. Statistic data showed that the average income of farmers from oil palm in Indonesia in 2013 was 7.32 million/ha/year, which was higher than rubber (3.67 million/ha/year), sugarcane (6.83 million/ha/year), and coffee (3.42 million/ha/year) [36]. In South Sumatra, oil palm generated revenues of 8.35 million/ha/month, while rubber and cocoa were 4.27 million IDR/ha/year and 3.05 million IDR/ha/year, respectively [37].
Smallholdings of oil palm consist of plasma and independent smallholdings. Prior to the crisis, plasma farmers were dominant, while independent farmers were minor. After the crisis, independent farmers were more dominant than plasma farmers. This is similar to the result of the study in Riau Province; after the 2000s, independent smallholders were dominant [38]. Another study found that before the mid-1990s, smallholders were primarily involved in government-supported schemes, but since the mid-1990s independent smallholders became more important [13].
Different developmental patterns occur in rice plants. Rice fields in South Sumatra grew at around 6.54%/year in the period of 1991–2017. In contrast to oil palm, which is cultivated by companies and smallholdings, rice is only cultivated by smallholdings. The existence of rice fields is still maintained in the midst of oil palm development because rice farming is still profitable for farmers. Statistical data showed that the income of farmers from lowland rice was 13,806 IDR/ha/year, but higher than of dry-land rice, at 3020 IDR/ha/year [39]. The government’s policy of creating new rice fields also plays an important role in the development of rice plants in South Sumatra [40]. During the economic crisis, the area of rice development increased over it, but declined again after the economic crisis. During the crisis, the agricultural sector functioned as a social safety valve, by absorbing some of the retrenched labor [41].
Oil palm land use changes are marked by a change in the green area (a low proportion of oil palm land) to the red area (Figure 3). In 2017, the proportion of oil palm land area to the total area in the Musi Banyuasin and Ogan Komering Ulu Regencies was very high (red area). In both districts, oil palm was dominant over rice; the ratio of land area of rice to oil palm was 0.2 and 0.3, respectively. If not controlled, oil palm in the Musi Banyuasin and OKU districts will be increasingly dominant, because the average development of the oil palm land area in the 2011–2017 period was greater than the development of rice fields. Musi Banyuasin has become a center for oil palm because it was the starting point for oil palm development in South Sumatra through the PIR-Bun project. In 2015, there were 55 palm oil companies and 14 palm oil processing factories in this district [42]. Musi Banyuasin is traversed by the Musi River, while Ogan Komering Ulu is traversed by the Ogan River, which is a source of irrigation for oil palm plantations. Districts with a proportion of oil palm land area above 16% will increase in the near future, especially Ogan Komering Ilir and Banyuasin, due to the growth of oil palm land still being high.
The positive development has formed rice development centers, namely in areas where the proportion of rice land area to area is very high. These areas are the East OKU, Ogan Ilir, and Banyuasin districts. The three districts remain as rice centers because the area of rice land is growing positively. In the three districts, the rice area is larger than that of oil palm, as indicated by the ratio of rice to oil palm land being above 1. In East OKU, rice farming is supported by the Perjaya Dam, which was built in 1991 [43]. Rice farming in Banyuasin is not supported by dams, but has vast tidal and swampy areas. Meanwhile, Ogan Ilir District is supported by a very large swamp area. The Musi Rawas and Lahat districts will become very high (red area) due to rice land growing positively; the proportion of rice land area to palm oil area is at a high level.
In addition to the rice field expansion program, the South Sumatra government also continues to increase the productivity of rice fields. Empirical data show an increase in the productivity of rice land from 3.2 tons/ha/year in 1991 to 4.9 tons/ha/year 2017. This increase in productivity is due to government policies on the improvement of irrigation channels, technical assistance to farmers, and the use of superior seeds. In addition, balanced fertilization and the use of appropriate technology are also being continuously improved [44,45,46]. One of the implementations of superior seeds is the use of a new superior variety in tidal low land in South Sumatra [47]. The increase in rice productivity shows that the rapid development of oil palm has not affected the decline in rice productivity.

5. Conclusions

In the period of 1991–2017, the area of oil palm plantations in South Sumatra grew faster than that of rice fields. With a lower point of land area, in 2017, the area of oil palm land was larger than the area of rice. The rapid development of oil palm created oil palm development centers in South Sumatra, especially in the districts of Musi Banyuasin and Ogan Komering Ulu. The proportion of oil palm land area to the total area in the two districts is above 16%. In both districts, oil palm lands appear to be dominant compared to rice fields. Other districts which currently have a high proportion of oil palm land area will increase due to the positive growth of the oil palm area. In the next few years, if the current pattern of development continues, the dominance of oil palm plantations to rice will spread to several districts.
The rapid development of the oil palm land area has not disrupted the sustainability of rice, especially in terms of land area development and productivity. In the 1991–2017 period, rice fields in South Sumatra still grew by around 4.6%. The rice development centers, namely Banyuasin, Ogan Ilir and East OKU Regencies, also continue to maintain their existence as rice granaries in South Sumatra. The oil palm land area is growing faster than that of rice plantations. There are oil palm development centers in South Sumatra, especially in the districts of Musi Banyuasin and Ogan Komering Ulu. Several other districts which currently have a high proportion of oil palm land area will increase due to the positive growth of the oil palm area. Currently, the main actors in oil palm development are independent oil palm smallholders. In the next few years, if the current pattern of development continues, the dominance of oil palm plantations over rice will become larger, and will spread to several districts.
The development of oil palm in several regencies of South Sumatra is very high, such that it needs special attention, namely in Empat Lawang and South OKU District. In the period of 2011–2017, both districts, the development of oil palm land is very high (>200% per year). Environmentally sound land use planning is very important to control the expansion of oil palm land. It is also important to increase the income of rice farmers through various fertilizer supply programs, to improve distribution patterns, and to support agricultural infrastructure such that farmers remain interested in maintaining rice farming land.

Author Contributions

Conceptualization, N.N. methodology, N.N. formal analysis and investigation, N.N. and J.N. Resources, N.N. writing draft, N.N.; Review and editing, N.N.; J.N. Supervision, J.N. All authors have read and agreed to the published version of the manuscript.

Funding

This research received no external funding.

Institutional Review Board Statement

Not applicable.

Informed Consent Statement

Not applicable.

Data Availability Statement

The data that support the findings of this article are openly available in https://www.bps.go.id (accessed on 24 May 2021) and https://aplikasi2.pertanian.go.id/bdsp (accessed on 31 March 2022), reference number [4] and [28].

Conflicts of Interest

The authors declare no conflict of interest.

References

  1. FAO. A Regional Rice Strategy for Sustainable Food Security in Asia and The Pacific; Food and Agriculture Organization of the United Nations Regional Office for Asia and The Pacific: Bangkok, Thailand, 2014. [Google Scholar]
  2. Suryana, A. National Rice Performance. In Rice Policy in Asia. Regional Meeting in Bangkok; Dewan Ketahanan Nasional: Jakarta, Indonesia, 2002. [Google Scholar]
  3. FAO. Production Quantities/Yield of Rice, Paddy in Indonesia 1994–2019. 2020. Available online: http://www.fao.org/faostat/en/#data/QC/visualize (accessed on 24 May 2021).
  4. BPS. Impor Beras Menurut Negara Asal Utama, 2000–2020, BPS Indonesia. 2020. Available online: https://www.bps.go.id/statictable/2014/09/08/1043/impor-beras-menurut-negara-asal-utama- (accessed on 24 May 2021).
  5. BPS. Indonesia Population Projection 2015–2045; BPS: Jakarta, Indonesia, 2018. [Google Scholar]
  6. BPS. Statistical Yearbook of Indonesia 2019; BPS: Jakarta, Indonesia, 2018. [Google Scholar]
  7. Ministry of Agriculture. Tree Crop Estate Statistics of Indonesia 2017–2019; Directorate General of Plantation, Ministry of Agriculture RI: Jakarta, Indonesia, 2019. [Google Scholar]
  8. Ministry of Agriculture. Statistics of National Leading Estate Crops Commodity 2019–2021; Directorate General of Plantation, Ministry of Agriculture RI: Jakarta, Indonesia, 2020. [Google Scholar]
  9. Gunarso, P.; Hartoyo, M.E.; Agus, F.; Killeen, T.J. Oil palm and land use change in Indonesia, Malaysia and Papua New Guinea. In Reports from the Technical Panels of the 2nd Greenhouse Gas Working Group of the Roundtable on Sustainable Palm Oil (RSPO); RSPO: Geneva, Switzerland, 2013. [Google Scholar]
  10. Chrisendo, D.; Krishna, V.V.; Maize, I.; Qaim, M. Land-Use Changes, Nutrition, and Gender Roles in Indonesian Farm Households. For. Policy Econ. 2020, 118, 102245. [Google Scholar] [CrossRef]
  11. Bou Dib, J.; Alamsyah, M.; Matin, Q. Land-use change and income inequality in rural Indonesia Forest Policy and Economics Land-use change and income inequality in rural Indonesia. For. Policy Econ. 2018, 94, 55–66. [Google Scholar] [CrossRef]
  12. Bou Dib, J.; Krishna, V.V.; Qaim, M. Land-use change and livelihoods of non-farm households: The role of income from employment in oil palm and rubber in rural Indonesia. Land Use Policy 2018, 76, 828–838. [Google Scholar] [CrossRef] [Green Version]
  13. Euler, M.; Krishna, V.; Schwarze, S.; Siregar, H.; Qaim, M. Oil Palm Adoption, Household Welfare, and Nutrition Among Smallhoder Farmers in Indonesia. World Dev. 2017, 93, 219–235. [Google Scholar] [CrossRef] [Green Version]
  14. Astuti, U.P.; Wahyu, W.; Andi, I. Faktor Yang Mempengarhui Alih Fungsi Lahan Pangan Menjadi Kelapa Sawit di Bengkulu: Kasus Petani di Desa Kungkai Baru. In Urgensi dan Strategi Pengendalian Alih Fungsi Lahan Pertanian; Fakultas Pertanian Universitas Bengkulu: Bengkulu, Indonesia, 2011; pp. 189–195. [Google Scholar]
  15. Daulay, A.R.; Putri, E.I.K.; Barus, B.; Noorachmat, B.P. Analysis of Factors Affecting Lowland Conversion into Palm Oil Plantation in East Tanjung Jabung Regency. Anal. Kebijak. Pertan. 2016, 14, 1–15. [Google Scholar]
  16. Alridiwirsah. Konversi Lahan Sawah Menjadi Kelapa Sawit Dan Dampak Terhadap Ketersediaan Beras Di Kabupaten Labuhanbatu Utara. Agrium 2013, 18, 169–174. [Google Scholar]
  17. Prabowo, D.; Maryudi, A.; Imron, M.A. Forest Policy and Economics Conversion of forests into oil palm plantations in West Kalimantan, Indonesia: Insights from actors’ power and its dynamics. For. Policy Econ. 2017, 78, 32–39. [Google Scholar] [CrossRef]
  18. Sayer, J.; Ghazoul, J.; Nelson, P.N.; Klintuni, A. Oil palm expansion transforms tropical landscapes and livelihoods. Glob. Food Secur. 2012, 1, 114–119. [Google Scholar] [CrossRef]
  19. Feintrenie, L.; Chong, W.K.; Levang, P. Why do Farmers Prefer Oil Palm ? Lessons Learnt from Bungo District, Indonesia. Small-Scale For. 2010, 9, 379–396. [Google Scholar] [CrossRef]
  20. Krishna, V.; Euler, M.; Siregar, H.; Qoim, M. Farmer heterogeneity and differential livelihood impacts of oil palm expansion in Sumatra, Indonesia. In Proceedings of the 2016 Agricultural and Applied Economics Association (AAEA) Annual Meeting, Boston, MA, USA, 31 July–2 August 2016. [Google Scholar]
  21. Pretty, J.N. Regenerating Agriculture: Policies and Practice for Sustainability and Self-Reliance; Joseph Henry Press: Washington, DC, USA, 1995. [Google Scholar]
  22. Zhen, L.; Routray, J.K. Operational Indicators for Measuring Agricultural Sustainability in Operational Indicators for Measuring Agricultural Sustainability in Developing Countries. Environ. Manag. 2003, 32, 34–46. [Google Scholar] [CrossRef] [Green Version]
  23. Smith, C.S.; Mcdonald, G.T. Assessing the sustainability of agriculture at the planning stage. J. Environ. Manag. 1998, 52, 15–37. [Google Scholar] [CrossRef] [Green Version]
  24. Lebacq, T.; Baret, P.V.; Stilmant, D. Sustainability indicators for livestock farming: A review. Agron. Sustain. Dev. 2013, 33, 311–327. [Google Scholar] [CrossRef]
  25. Ripoll-Bosch, R.; Díez-Unquera, B.; Ruiz, R.; Villalba, D.; Molina, E.; Joy, M.; Olaizola, A.; Bernués, A. An integrated sustainability assessment of mediterranean sheep farms with different degrees of intensification. Agric. Syst. 2012, 105, 46–56. [Google Scholar] [CrossRef]
  26. Rasul, G.; Thapa, G.B. Sustainability of ecological and conventional agricultural systems in Bangladesh: An assessment based on environmental, economic and social perspectives. Agric. Syst. 2004, 79, 327–351. [Google Scholar] [CrossRef]
  27. Gomez-Limon, V.; Riesgo, J.A. Alternative approaches to the construction of a composite indicator of agricultural sustainability: An application to irrigated agriculture in the Duero basin in Spain. J. Environ. Manag. 2009, 90, 3345–3362. [Google Scholar] [CrossRef]
  28. Ministry of Agiculture. Pencarian Data Dengan Keluaran Berdasar Komoditas. Available online: https://aplikasi2.pertanian.go.id/bdsp/id/komoditas (accessed on 31 March 2022).
  29. Bakir, L.H. Kinerja Perusahaan Inti Rakyat Kelapa Sawit di Sumatera Selatan: Analisis Kemitraan dan Ekonomi Rumahtangga Petani; Institute Pertanian Bogor: Bogor, Indonesia, 2007. [Google Scholar]
  30. Ngadi; Nagata, J. Development of the Oil Palm Plantation Sector in South Sumatra Province. Komaba Stud. Hum. Geogr. 2020, 23, 1–12. [Google Scholar]
  31. Syafa’at, N.; Friyatno, S.; Mardianto dan Suyadi, S. Kinerja nilai tambah dan produksi sektor pertanian, 2000–2003. Analisis Kebijakan Pertanian 2013, 2, 1–16. [Google Scholar]
  32. Yudanto, N.; Santoso, M.S. Dampak krisis moneter terhadap sektor riil. Buletin Ekonomi Moneter dan Perbankan 1998, 1, 131–158. [Google Scholar] [CrossRef]
  33. Krishna, V.; Euler, V.; Siregar, H.; Qaim, M. Differential livelihood impacts of oil palm expansion in Indonesia. Agric. Econ. 2017, 48, 639–653. [Google Scholar] [CrossRef]
  34. Rist, L.; Feintrenie, L.; Levang, P. The livelihood impacts of oil palm: Smallholders in Indonesia. Biodivers. Conserv. 2010, 19, 1009–1024. [Google Scholar] [CrossRef]
  35. Alwarritzi, W.; Nanseki, T.; Chomei, Y. Impact of Oil Palm Expansion on Farmers’ Crop Income and Poverty Reduction in Indonesia: An Application of Propensity Score Matching. J. Agric. Sci. 2016, 8, 119–131. [Google Scholar] [CrossRef]
  36. BPS. Executive Summary the Cost Structure of Strategic Estate Crop Commodities: 2014 Results of Estate Crops Cultivation Household Survey, 2014; BPS Indonesia: Jakarta, Indonesia, 2016. [Google Scholar]
  37. BPS South Sumatra. Analisis Rumah Tangga Usaha Perkebunan di Sumatera Selatan: Hasil Sensus Pertanian 2013; BPS South Sumatra: Palembang, Indonesia, 2016. [Google Scholar]
  38. Nagata, J.; Arai, S.W. Evolutionary change in the palm oil plantation sector in Riau Province, Sumatra. In The Palm Oil Controversy in Southeast Asia: A Transnational Perspective; ISEAS Publishing Institute of Southeast Asian Studies: Singapore, 2013. [Google Scholar]
  39. BPS South Sumatra. Province South Sumatra Figure ST2013—Sub Sector Results of Paddy Cultivation Household Survey; BPS South Sumatra: Palembang, Indonesia, 2014. [Google Scholar]
  40. Susanto, R.H.; Mulyana, A.; Umar Harun, M.; Irsan, C.; Zaidan; Agus Suwignyo, R.; Nancy, C.; Sabarudin; Siswanto, A.; Husnah; et al. Master Plan Lumbung Pangan Sumatera Selatan; Universitas Sriwijaya: Palembang, Indonesia, 2005. [Google Scholar]
  41. Daryanto, A. Indonesia’s Crisis and the Agricultural Sector: The Relevance of Agricultural Demand-Led Industrialisation; UNE Asia Centre: Bangkok, Thailand, 1999. [Google Scholar]
  42. South Sumatra Plantation Service. Plantation Statistics; South Sumatra Plantation Services: Palembang, Indonesia, 2016. [Google Scholar]
  43. East OKU Government, “Pertanian”. 2021. Available online: http://www.okutimurkab.go.id/pertanian.html (accessed on 28 February 2022).
  44. BPS South Sumatra. Analysis of Paddy Productivity in South Sumatra; BPS South Sumatra: Palembang, Indonesia, 2020. [Google Scholar]
  45. Girsang, S.S.; Raharjo, B. Factors affecting rice yield productivity in tidal swamp of South Sumatra Factors affecting rice yield productivity in tidal swamp of South Sumatra. In Proceedings of the 1st International Conference on Sustainable Tropical Land Management, Bogor, Indonesia, 16–18 September 2020; p. 12. [Google Scholar]
  46. Kementerian PPN/Bappenas. Analysis of the Development of South Sumatra Province Series; Kementerian PPN/Bappenas: Jakarta. 2015. Available online: https://simreg.bappenas.go.id/assets/temaalus/document/Publikasi/DokPub/Analisis%20Provinsi%20Sumatera%20Selatan%202015ok.pdf (accessed on 22 February 2022).
  47. Maryana, Y.E.; Suprihatin, A.; Raharjo, B.; Ratmani, N.P.S. Increasing Paddy Productivity in Tidal Low Lands of South Sumatra through the Implementation of New Superior Varieties and Amator. J. Suboptimal Lands 2022, 11, 59–66. [Google Scholar] [CrossRef]
Figure 1. The location of South Sumatra Province.
Land 11 00669 g001
Figure 2. Oil palm acreage (ha) in South Sumatra (1991–2017).
Land 11 00669 g002
Figure 3. Spatial distribution of oil palm land areas in South Sumatra. Sources: Central Bureau Statistics of South Sumatra (1992, 2002); Department of Agriculture (2012, 2018). (a) Oil palm land distribution in 1991. (b) Oil palm land distribution in 2001. (c) Oil palm land distribution in 2011. (d) Oil palm land distribution in 2017.
Land 11 00669 g003
Figure 4. Rice acreage (ha) in South Sumatra (1991–2017). Source: Ministry of Agriculture, Indonesia.
Land 11 00669 g004
Figure 5. Spatial distribution of rice land areas in South Sumatra. Source: Ministry of Agriculture, Indonesia. (a) Rice land distribution in 1991. (b) Rice land distribution in 2001. (c) Rice land distribution in 2011. (d) Rice land distribution in 2017.
Land 11 00669 g005
Figure 6. Rice productivity in South Sumatra, 1991–2017. Source: Ministry of Agriculture (https://aplikasi2.pertanian.go.id/bdsp/id/komoditas accessed on 31 March 2022). [28].
Land 11 00669 g006
Table 1. Development of rice and oil palm land area in South Sumatra, 2011 and 2017.
DistrictRice Area (ha)Oil Palm Area (ha)Rice/Oil Palm
Land Ratio
20112017Growth
(%/Year)
20112017Growth (%/Year)20112017
Banyuasin190,341256,1945.8117,656186,7419.81.61.4
East OKU130,288173,5885.513,94828,09816.99.36.2
Ogan Komering Ilir129,799165,3474.6143,820213,0058.00.90.8
Musi Banyu Asin63,39778,1643.9195,312330,78411.60.30.2
Musi Rawas *57,51276,6305.5132,786151,8122.40.40.5
Ogan Ilir46,62647,8390.4970113,0345.74.83.7
Lahat34,80244,0074.450,16546,622−1.20.70.9
Empat Lawang29,00725,055−2.32807045402.7103.63.6
Muara Enim **44,97153,5433.2106,513106,9680.10.40.5
South OKU 26,21645,29712.11233526461.1213.112.8
OKU14,05412,849−1.440,95243,9001.20.30.3
Pagar Alam831291121.6000--
Lubuk Linggau427660436.912843039.333.414.1
Palembang464356873.7000--
Prabumulih5766181.28740−16.70.7-
Total784,820999,9734.6812,2581,131,9656.61.00.9
Note: * This is a combination of the Musirawas and Musirawas Utara districts. ** This is a combination of the Muara Enim and PALI districts. Source: BPS (several years); Ministry of Agriculture (several years).
Publisher’s Note: MDPI stays neutral with regard to jurisdictional claims in published maps and institutional affiliations.

