Abstract
Scientifically measuring the quantitative coupling relationship between urban–rural construction land (URCL) and population and formulating URCL utilization countermeasures are needed for protecting cultivated land resources, intensive utilization of land resources, and sustainable socioeconomic development. This study proposed an improved transition process theory of URCL and population and a coupling model of polar coordinates. Then, the coupling model was applied to Henan Province in China to analyze the coupling relationship between URCL and population, showing that the coupling relationship between URCL and urban–rural population (URP) in the province was unreasonable. However, the coupling rationality between rural construction land (RCL) and rural population (RP) had a significant improvement tendency. Furthermore, the coupling relationship between URCL and the population of prefecture-level cities in Henan province was analyzed, and the coupling model of polar coordinates proposed in this study achieved satisfactory results. Thus, compared with the commonly used Tapio’s decoupling model of elasticity, the coupling model further extends the concept of coupling analysis to the coupling type, coupling strength, and coupling rationality. The extension makes the measurement of the quantitative coupling relationship between URCL and population more scientific, comprehensive, and accurate.
1. Introduction
China has a large population, small per-capita land and cultivated land occupation, and insufficient reserves of cultivated land. Therefore, the Chinese government attaches great importance to land use management and implements strict intensive land use and cultivated land protection systems [1]. Urban–rural construction land (URCL) is the main component of construction land and the focus of land use management in China. The primary source of incremental URCL is cultivated land. Therefore, scientifically controlling the quantity of URCL and promoting its intensive utilization can protect cultivated land resources and ensure the national food security of China. However, URCL is the primary carrier of production and living activities in urban and rural areas. Therefore, ensuring a stable supply of URCL and correctly handling its relationship with urbanization, industrialization, and socioeconomic development can support sustainable socioeconomic development. In China, with its rapid urbanization, industrialization, and socioeconomic development, the total amount of URCL has gradually increased, and the utilization of URCL has become more extensive. Furthermore, with the increase in the population urbanization rate (PUR) and the reduction in the rural population (RP), rural construction land (RCL) has not decreased but has actually increased, and the structure of URCL has become more unreasonable. At the same time, the unreasonable utilization of URCL has led to socioeconomic problems such as “hollow villages”, “land finance”, and rising housing prices, which have hindered the process of urban and rural development [2]. Therefore, the Chinese government has adopted countermeasures such as construction land supply plans, “increasing versus decreasing balance”, and “human–land linking” land-use policies for URCL to control its growth and optimize its structure [3,4,5]. Moreover, the precondition of URCL’s management and regulation is to understand the transition characteristics and mechanism of URCL and scientifically measure the quantity and structure of URCL and its rationality for local conditions and developmental stage. Based on the above, differentiated countermeasures can be formulated to guide the reasonable allocation of URCL among urban and rural areas, regions, and generations. Therefore, the study of the coupling relationship between URCL and population has essential theoretical and practical significance.
The research on URCL mainly focuses on research fields such as urban–rural transition [6,7,8,9,10], land use transition [11,12,13,14,15], settlement networks [16,17,18,19,20,21], and urban sprawl [22,23,24,25,26]. Moreover, because URCL is composed of urban construction land (UCL) and RCL, the research on URCL includes research on itself as a whole and independent research on UCL or RCL. The research content of URCL includes its quantitative and structural transition characteristics, its relationship with natural conditions and socioeconomic factors, and so on. Among the related factors of URCL, the population is an essential one. Liu et al. first proposed a transition process model of URCL and population. The model explains the structure transition process of URCL and population based on land urbanization rate (LUR) measurement and the logistic population urbanization model [27]. Based on the model, Qu et al. proposed a quantity transition process model of URCL and summarized the influencing factors of URCL transition [28]. Zhu et al. proposed a spatial transition process model of URCL based on core-periphery theory, which further improved the transition process model of URCL [29]. Based on these studies, this study proposed a more accurate and comprehensive theory for the structural and quantitative transition process of URCL and population, further explaining the coupling relationship between URCL and population.
In terms of research methods to analyze the coupling relationship between URCL and socioeconomics, researchers have adopted Tapio’s decoupling model of elasticity [30,31,32,33,34], elastic coefficient model [35,36,37,38], coupling coordination degree model [39,40,41,42], IPAT model [43], and so on. Among these methods, Tapio’s decoupling model of elasticity is the most widely used. The model analyzes the coupling relationship between two objects by classifying the relationship into eight types and was initially used to measure the coupling relationship between carbon dioxide emissions and GDP [44]. Then, the model was widely used to measure the coupling relationship between resources and environment and socioeconomics. Tapio’s decoupling model of elasticity was applied to analyze the coupling relationship between URCL and urban–rural population (URP) [45,46,47], UCL and urban population (UP) [48,49], UCL and gross process product (GDP) [50,51], and RCL and RP [52,53,54]. Thus, the model has played an essential role in researching the coupling relationship between URCL and socioeconomics and has achieved satisfactory results. However, although Tapio’s decoupling model of elasticity can scientifically identify the coupling types, it cannot scientifically judge the coupling rationality because the model focuses on the increment and ignores the stock. Moreover, the discrete coupling types are not convenient for comparative analysis. Therefore, this study proposed a new coupling model to compensate for these drawbacks.
Based on the above, the primary purpose of this study was to propose a coupling model of polar coordinates to measure the quantitative coupling rationality between URCL and population scientifically. First, we derived an improved transition process theory of URCL and population based on the logistic population urbanization model. Second, we proposed the coupling model of polar coordinates, including three measures (i.e., coupling type, coupling strength, and coupling rationality) based on Tapio’s decoupling model of elasticity. Third, we used the proposed coupling model to analyze the coupling relationship between URCL and population in Henan province and its prefecture-level cities to validate the model’s effectiveness. Finally, we measured the utilization rationality of URCL by combining the per-capita construction land area (PCL) and the coupling model of polar coordinates, and thus further validated the model’s advantages.
2. Transition Process of URCL and Population
To analyze the coupling rationality between URCL and population, we proposed an improved transition process theory of URCL and population based on the logistic population urbanization model [55,56] and the ideal PCL of UCL and RCL (Figure 1) [Supplementary Materials Text S1]. The theory comprehensively illustrates the quantitative, structural, and intensive transition process of URCL in ideal and actual situations with the process of population urbanization.
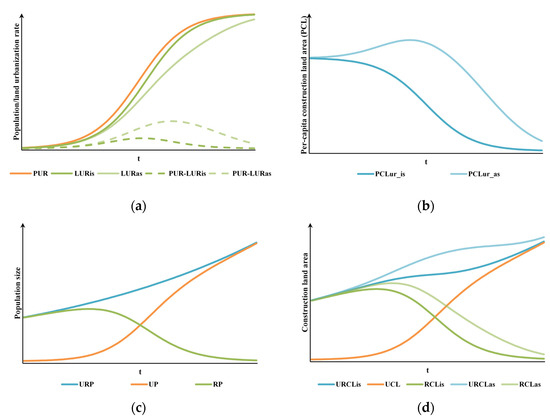
Figure 1.
The transition process of urban–rural construction land (URCL) and population: (a) PUR is the population urbanization rate. LURis and LURas are the land urbanization rates in the ideal and actual situations, respectively. (b) PCLur_is and PCLur_as are the per-capita URCL areas in the ideal and actual situations, respectively. (c) URP, UP, and RP are the urban–rural population size, urban population size, and rural population size, respectively. (d) URCLis, UCL, and RCLis are the urban–rural construction land area, urban construction land area, and rural construction land area in the ideal situation, respectively. URCLas and RCLas are the urban–rural construction land area and rural construction land area in the actual situation, respectively.
We use LUR to measure the structure of URCL, that is, the proportion of UCL to URCL (including UCL and RCL) [27]. LUR in the ideal situation (LURis) shows a “flat S-shaped growth curve”, the same as PUR. The difference between the two curves is that LURis lags behind PUR, and PUR–LURis shows a “bell-shaped curve” (Figure 1a). The reason for this is the PCL difference between urban and rural areas. In this process, the PCL of URCL (PCLur_is) shows a “reverse S-shaped decline curve,” indicating that the intensive utilization of URCL has improved (Figure 1b).
Furthermore, we assume that the growth of the URP is not limited by resources and environment and shows an “exponential growth curve”. Then, UP and RP show a “flat S-shaped growth curve with a raised tail” and a “reverse flat S-shaped decline curve with a concave head”, respectively (Figure 1c). Accordingly, URCL in the ideal situation (URCLis) shows a “higher-head and lower-middle growth curve” than URP. UCL and RCL in the ideal situation (RCLis) show the same curve shape as UP and RP, respectively, except that the curve head of RCLis is higher than that of RP (Figure 1d). Therefore, in the ideal situation, although URCL increases with URP, there is a period of decelerating growth of URCL in the midurbanization period, owing to the more intensive utilization of construction land in urban areas than in rural areas.
In the actual situation, the quantitative change and structural adjustment of URCL have a lag effect. With the urbanization process, although the RP turns into UP and the PUR increases, the RCL does not turn into UCL or become reclaimed in a short time. Furthermore, owing to the urban–rural dual-track structures of the population and land systems in China, the lag is more obvious, which leads to typical phenomena such as “hollow villages” and “amphibious land occupation”. Therefore, the evolution process between URCL and population in the actual situation is more complicated.
Specifically, the curve of LUR in the actual situation (LURas) is lower than that in the ideal situation (LURis), that is, the structural adjustment process of URCL is relatively lagging, especially in the middle and later stages of the urbanization process (Figure 1a). Additionally, the PCL of URCL in the actual situation (PCLur_as) does not show a “reverse S-shaped decline curve” similar to that in the ideal situation (PCLur_is) but instead shows an upward trend in the early and middle stages of urbanization process and then a gradual decrease (Figure 1b). Furthermore, the curves of URCL and RCL in the actual situation (URCLas and RCLas) are higher than those in the ideal situation (URCLis and RCLis). In particular, URCLas does not show a period of decelerating growth but rather a period of accelerated growth in the middle stages of the urbanization process, which further threatens the cultivated land protection and food security in China (Figure 1d).
According to the transition process of URCL and population in both the ideal and actual situations, the middle stage of urbanization is the critical period for the quantitative control and structural adjustment of URCL. Therefore, scientifically measuring the quantity and structure of URCL in this period and understanding its transition characteristics are important. Thus, scientific and effective differentiated control strategies for URCL can be formulated according to local conditions and different development stages.
3. Materials and Methods
3.1. Research Methods
LUR and PCL are two commonly used measures of the quantity and structure of URCL. The former is used to measure the distribution rationality of URCL between urban and rural areas. The calculation formulas of LUR and its ideal value (LURrv) are as follows [27]:
where PCLu_rv and PCLr_rv are the ideal PCL of UCL and RCL, respectively, and their values refer to relevant standards, which will be explained in detail below. The value ranges of LUR and LURrv are [0, 1], and their units are %. If LUR is greater than LURrv, the proportion of UCL is relatively large, and the speed of land urbanization is relatively fast. If LUR is less than LURrv, the proportion of RCL is relatively large, and the problems of “hollow villages” and “amphibious land occupation” are relatively severe.
PCL, whose common unit is m2/person, is used to measure the quantity matching degree between construction land and population, and it is also a common intensity measure of construction land. The ideal value of PCL commonly refers to Chinese national standards, including the “Code for classification of urban land use and planning standards of development land” (GB50137-2011), the “Standard for planning of towns” (GB50188-2007), and the “Standard for planning of villages and towns” (GB50188-93). PCL greater than its ideal value indicates that construction land use is relatively extensive, which may lead to wastage of land resources. Conversely, PCL less than its ideal value indicates that construction land supply is relatively tight, which may hamper socioeconomic development. The coupling rationality between construction land and population in the above two cases is relatively low. Therefore, only when PCL get close to its ideal value can the coupling rationality between construction land and population become relatively high. Thus, the high coupling rationality can support the sustainable utilization of land resources and the sustainable socioeconomic development. Referring to the above standards, we set the ideal PCL of URCL, UCL, and RCL (PCLur_rv, PCLu_rv, and PCLr_rv) in this study to 130 m2/person, 110 m2/person, and 150 m2/person, respectively, for the convenience of calculation and analysis.
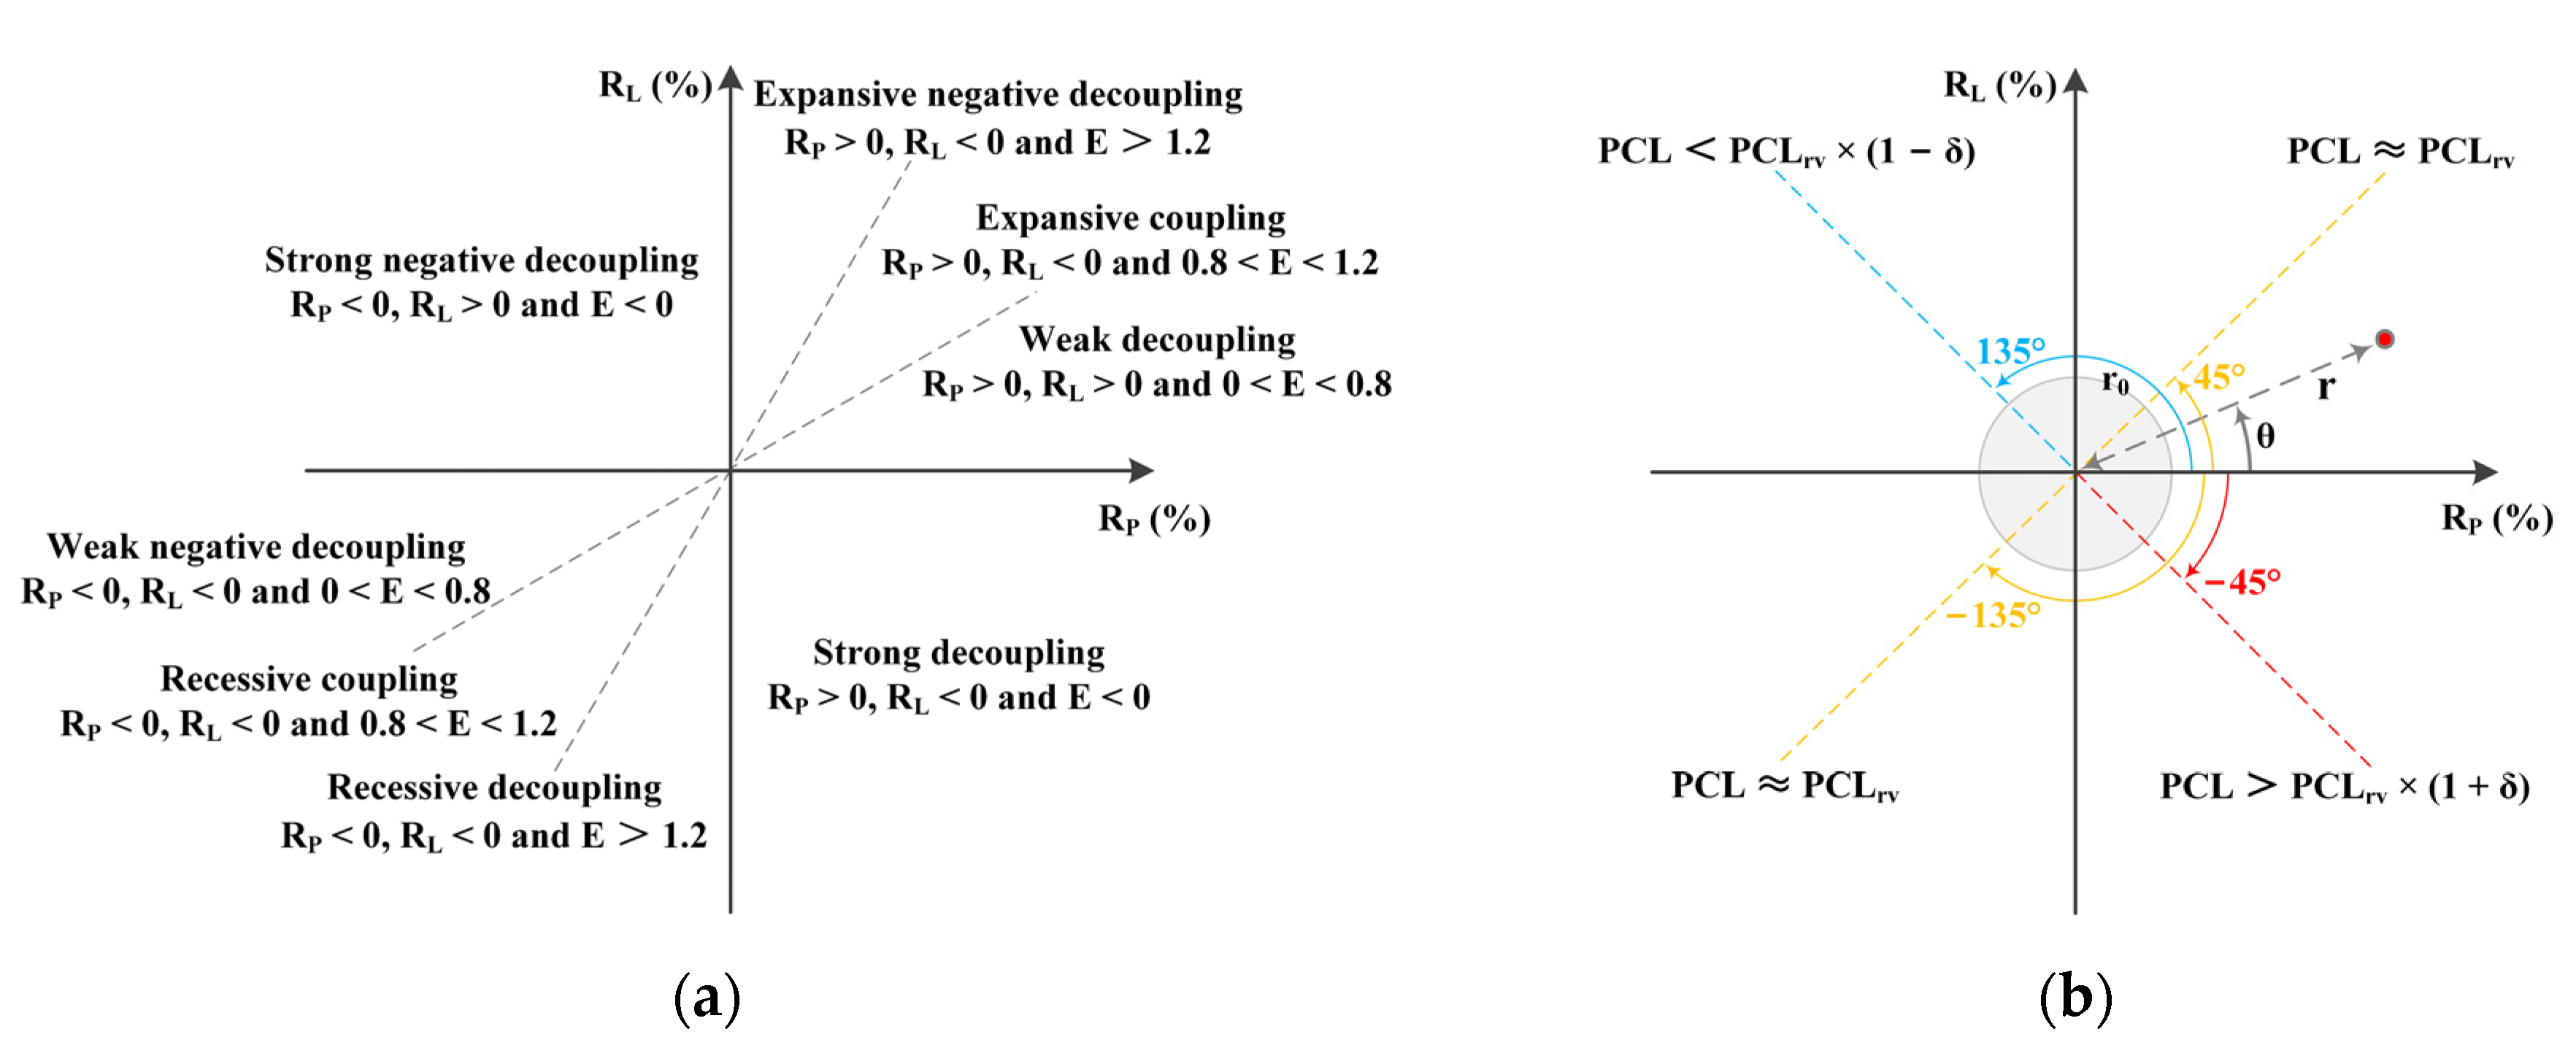
Furthermore, the essence of PCL is a static coupling measure of construction land and population. In contrast, Tapio’s decoupling model of elasticity is a commonly used dynamic coupling measure. The model classifies coupling relationships between construction land and population into eight types by measuring their positive and negative change rates and their elasticity, and then judges the coupling rationality (Figure 2a) [44]. The calculation formula of elasticity (E) is as follows:
where RL and RP are the change rates of construction land and population in a given period, respectively; Lt and L0 are the construction land areas at the starting and ending points of the given period, respectively, and they can be URCL, UCL or RCL in this study; and Pt and P0 are the population sizes at the starting and ending points of the given period, respectively, and they can be URP, UP, or RP in this study. However, Tapio’s decoupling model of elasticity has two drawbacks. First, it focuses on the increment of construction land and ignores its stock; as a result, it cannot scientifically judge the coupling rationality between construction land and population. For example, in the case of the reduction of construction land and the increase of population, which leads to PCL reduction, the construction land and population show a state of strong decoupling according to Tapio’s decoupling model of elasticity. Most studies have posited that this coupling state is reasonable, but this judgment is based on the hidden hypothesis that PCL exceeds its ideal value. However, if PCL is much smaller than its ideal value, the state of strong decoupling further compresses PCL. This compression makes the relationship between construction land and population tenser and can even hamper socioeconomic development. Therefore, the state of strong decoupling is unreasonable in the case given above. The second drawback is that the model divides coupling relationships into eight discrete types, which is not convenient for the comparative analysis of coupling rationality. Therefore, we proposed a coupling model of polar coordinates to compensate for these two drawbacks.
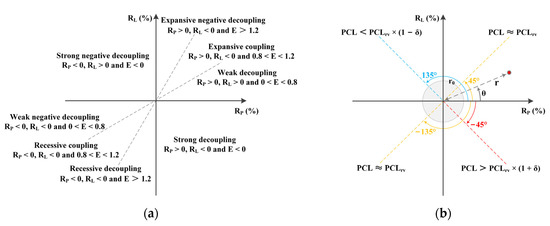
Figure 2.
Tapio’s decoupling model of elasticity and the coupling model of polar coordinates proposed in this study: (a) Tapio’s decoupling model of elasticity. In the figure, RL and RP are the change rates of construction land and population, respectively, and E is the population elasticity of construction land. (b) Coupling model of polar coordinates. In the figure, PCL and PCLrv are the per-capita construction land area and its ideal value, respectively, and δ is the tolerance coefficient of PL.
The coupling model of polar coordinates uses the polar coordinates in the scatter plot of the change rates of construction land and population to analyze the coupling relationship. Specifically, the polar coordinate angle (θ) and radius (r) measure the coupling type and strength between construction land and population, respectively (Figure 2b). The calculation formulas are as follows:
where RL and PP are the average annual change rates of construction land and population in a given period, respectively, for the convenience of comparative analysis. Referring to Tapio’s decoupling model of elasticity, the coupling angle (θ) can also classify coupling relationships into eight types; this classification is relatively intuitive. Additionally, the coupling strength as measured by the coupling radius (r) is, in essence, the significance of the coupling type, which can be used to infer whether the coupling type is accidental or credible.
Furthermore, the coupling model of polar coordinate introduces coupling rationality based on the additional consideration of PCL. The coupling rationality is calculated based on the difference between the coupling angle and its ideal value considering PCL. When PCL is greater than, less than, or approximately equal to its ideal value (PCLrv), the ideal coupling angles are −45°, 135°, and 45°/−135°, respectively (Figure 2b). The PCL in a given period in this study is the PCL average at the starting and ending points of the period. The calculation formulas of coupling rationality (CR) are as follows:
where δ is the tolerance coefficient of PCL, which we set to 0.1 in this study. According to the above formulas, the value range of CR is [−1, 1]. The larger the coupling rationality, the faster the PCL approaches its ideal value, which promotes a more reasonable quantitative matching degree between construction land and population. Conversely, the smaller the coupling rationality, the faster the PCL deviates from its ideal value, which makes the quantitative matching degree between construction land and population more unreasonable. Therefore, the coupling rationality is a scientific measure for judging the dynamic coupling rationality between construction land and population based on the static coupling measure of PCL.
3.2. Study Area and Data Sources
We selected Henan province in China as the study area to validate our method. Henan province, located in Central China, is the country’s third-most populous province, its fifth-largest economic province, its second-largest grain-producing province, and it has the second-largest area of cultivated land in China (Figure 3). In 2016, the per-capita cultivated land area of Henan province was 853.34 m2/person, which was lower than the national average of 973.34 m2/person. The PCL of URCL in Henan province was 221.76 m2/person, which was higher than the national average of 206.39 m2/person. The PUR of Henan province was 48.50%, which was lower than the national average of 57.35%. The above data suggest that the socioeconomic development of Henan province places pressure on cultivated land protection and food security, and that this pressure will further increase with the urbanization process. Furthermore, the extensive utilization and unreasonable structure of URCL in Henan province also exacerbate the contradiction between the demand for URCL and the protection of cultivated land. Therefore, the utilization of URCL in Henan province is representative of China, and research on it has important practical significance.
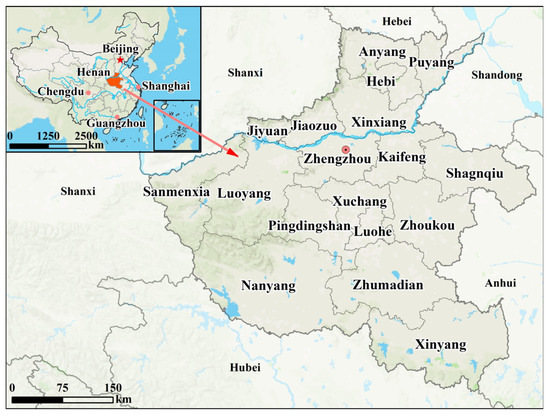
Figure 3.
Location and subregions of Henan province.
Considering the research method of this study, the coupling analysis between URCL and population requires URCL data and URP data. In this study, the former was obtained from the second national land survey in 2009 and subsequent annual land change surveys provided by the “land survey results sharing application service platform” of the Ministry of Natural Resources of China. The latter was obtained from the “Henan Statistical Yearbook”. The research unit of this study had two scales: provinces and prefecture-level cities. The research time range was from 2010 to 2016, owing to the time range of available URCL data.
4. Results
4.1. General Analysis
4.1.1. Quantitative and Structural Analysis
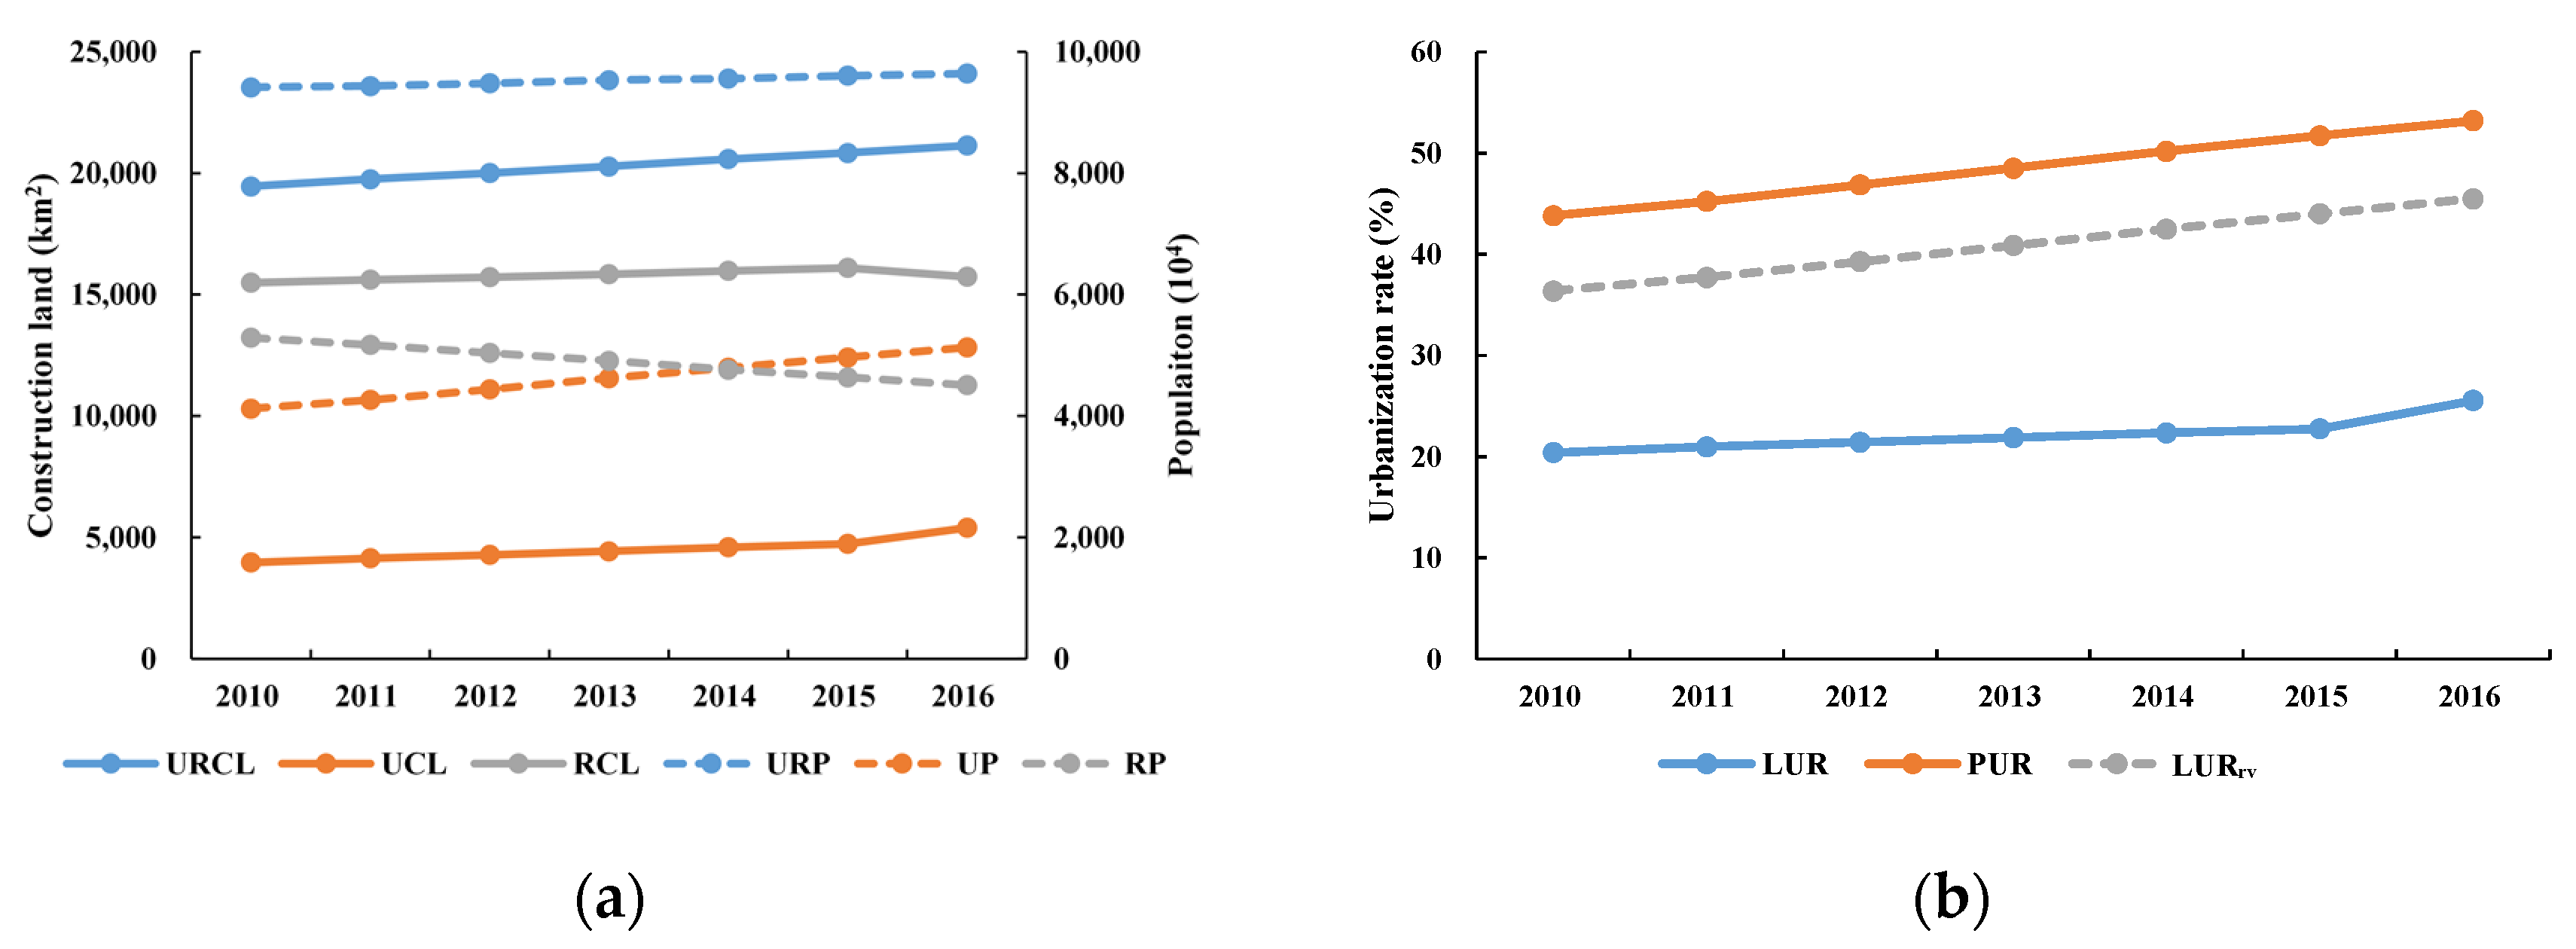
We first analyzed the overall changes in the quantity and structure of URCL in Henan province. The URCL of Henan province increased from 194.55 km2 in 2010 to 211.38 km2 in 2016, with an average annual growth rate of 1.39%. During the same period, the URP of Henan province increased from 94.13 million to 96.40 million, with an average annual growth rate of 0.40%. The growth rate of URCL is four times higher than that of URP (Figure 4a). The LUR of Henan province increased from 20.40% in 2010 to 25.55% in 2016, with an average annual growth rate of 0.86 percentage points. During the same period, the PUR of Henan province increased from 43.80% to 53.21%, with an average annual growth rate of 1.57 percentage points. The average annual growth rate of LUR was only half of that of PUR, which suggests that the structural adjustment speed of URCL was much slower than that of the population (Figure 4b). Furthermore, the ideal value of LUR should have increased from 36.37% in 2010 to 45.47% in 2016, with an average annual growth rate of 1.52 percentage points. In fact, the difference between the LUR and its ideal value increased from 15.97% to 19.92%, with an average annual growth rate of 0.66 percentage points, during the same period (Figure 4b). This widening difference further shows that the structure of URCL became more unreasonable.
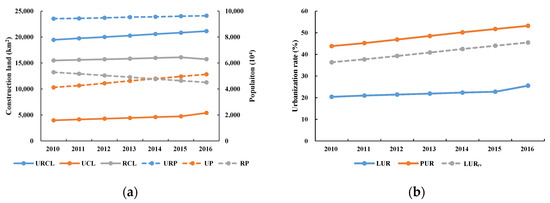
Figure 4.
Quantity and structure changes of URCL and population in Henan province from 2010 to 2016: (a) changes in URCL, UCL, RCL, URP, UP, and RP; (b) changes in LUR, PUR, and the ideal value of LUR (LURrv).
Furthermore, we analyzed the changes in construction land and population in urban and rural areas, respectively (Figure 4a). The UCL of Henan province increased from 39.68 km2 in 2010 to 54.01 km2 in 2016, with an average annual growth rate of 5.27%. During the same period, the UP of Henan province increased from 41.23 million to 51.29 million, with an average annual growth rate of 3.71%. The growth rate of UCL is 1.5 times higher than that of UP. Accordingly, the RCL of Henan province increased from 154.87 km2 in 2010 to 157.37 km2 in 2016, with an average annual growth rate of 0.27%. However, during the same period, the RP of Henan province decreased from 52.90 million to 45.11 million, with an average annual decrease rate of 2.62%. These changes in RCL and RP indicate that RCL did not decrease with the decrease of RP but showed an unexpected growth trend. This abnormal phenomenon is the main reason that the structure of URCL has not been adjusted over time.
4.1.2. Static and Dynamic Coupling Analysis
Next, we analyzed the coupling relationship between three construction land and population pairs, namely URCL–URP, UCL–UP, and RCL–RP. Each pair used PCL and the coupling model of polar coordinates proposed in this study to analyze its static and dynamic coupling relationships.
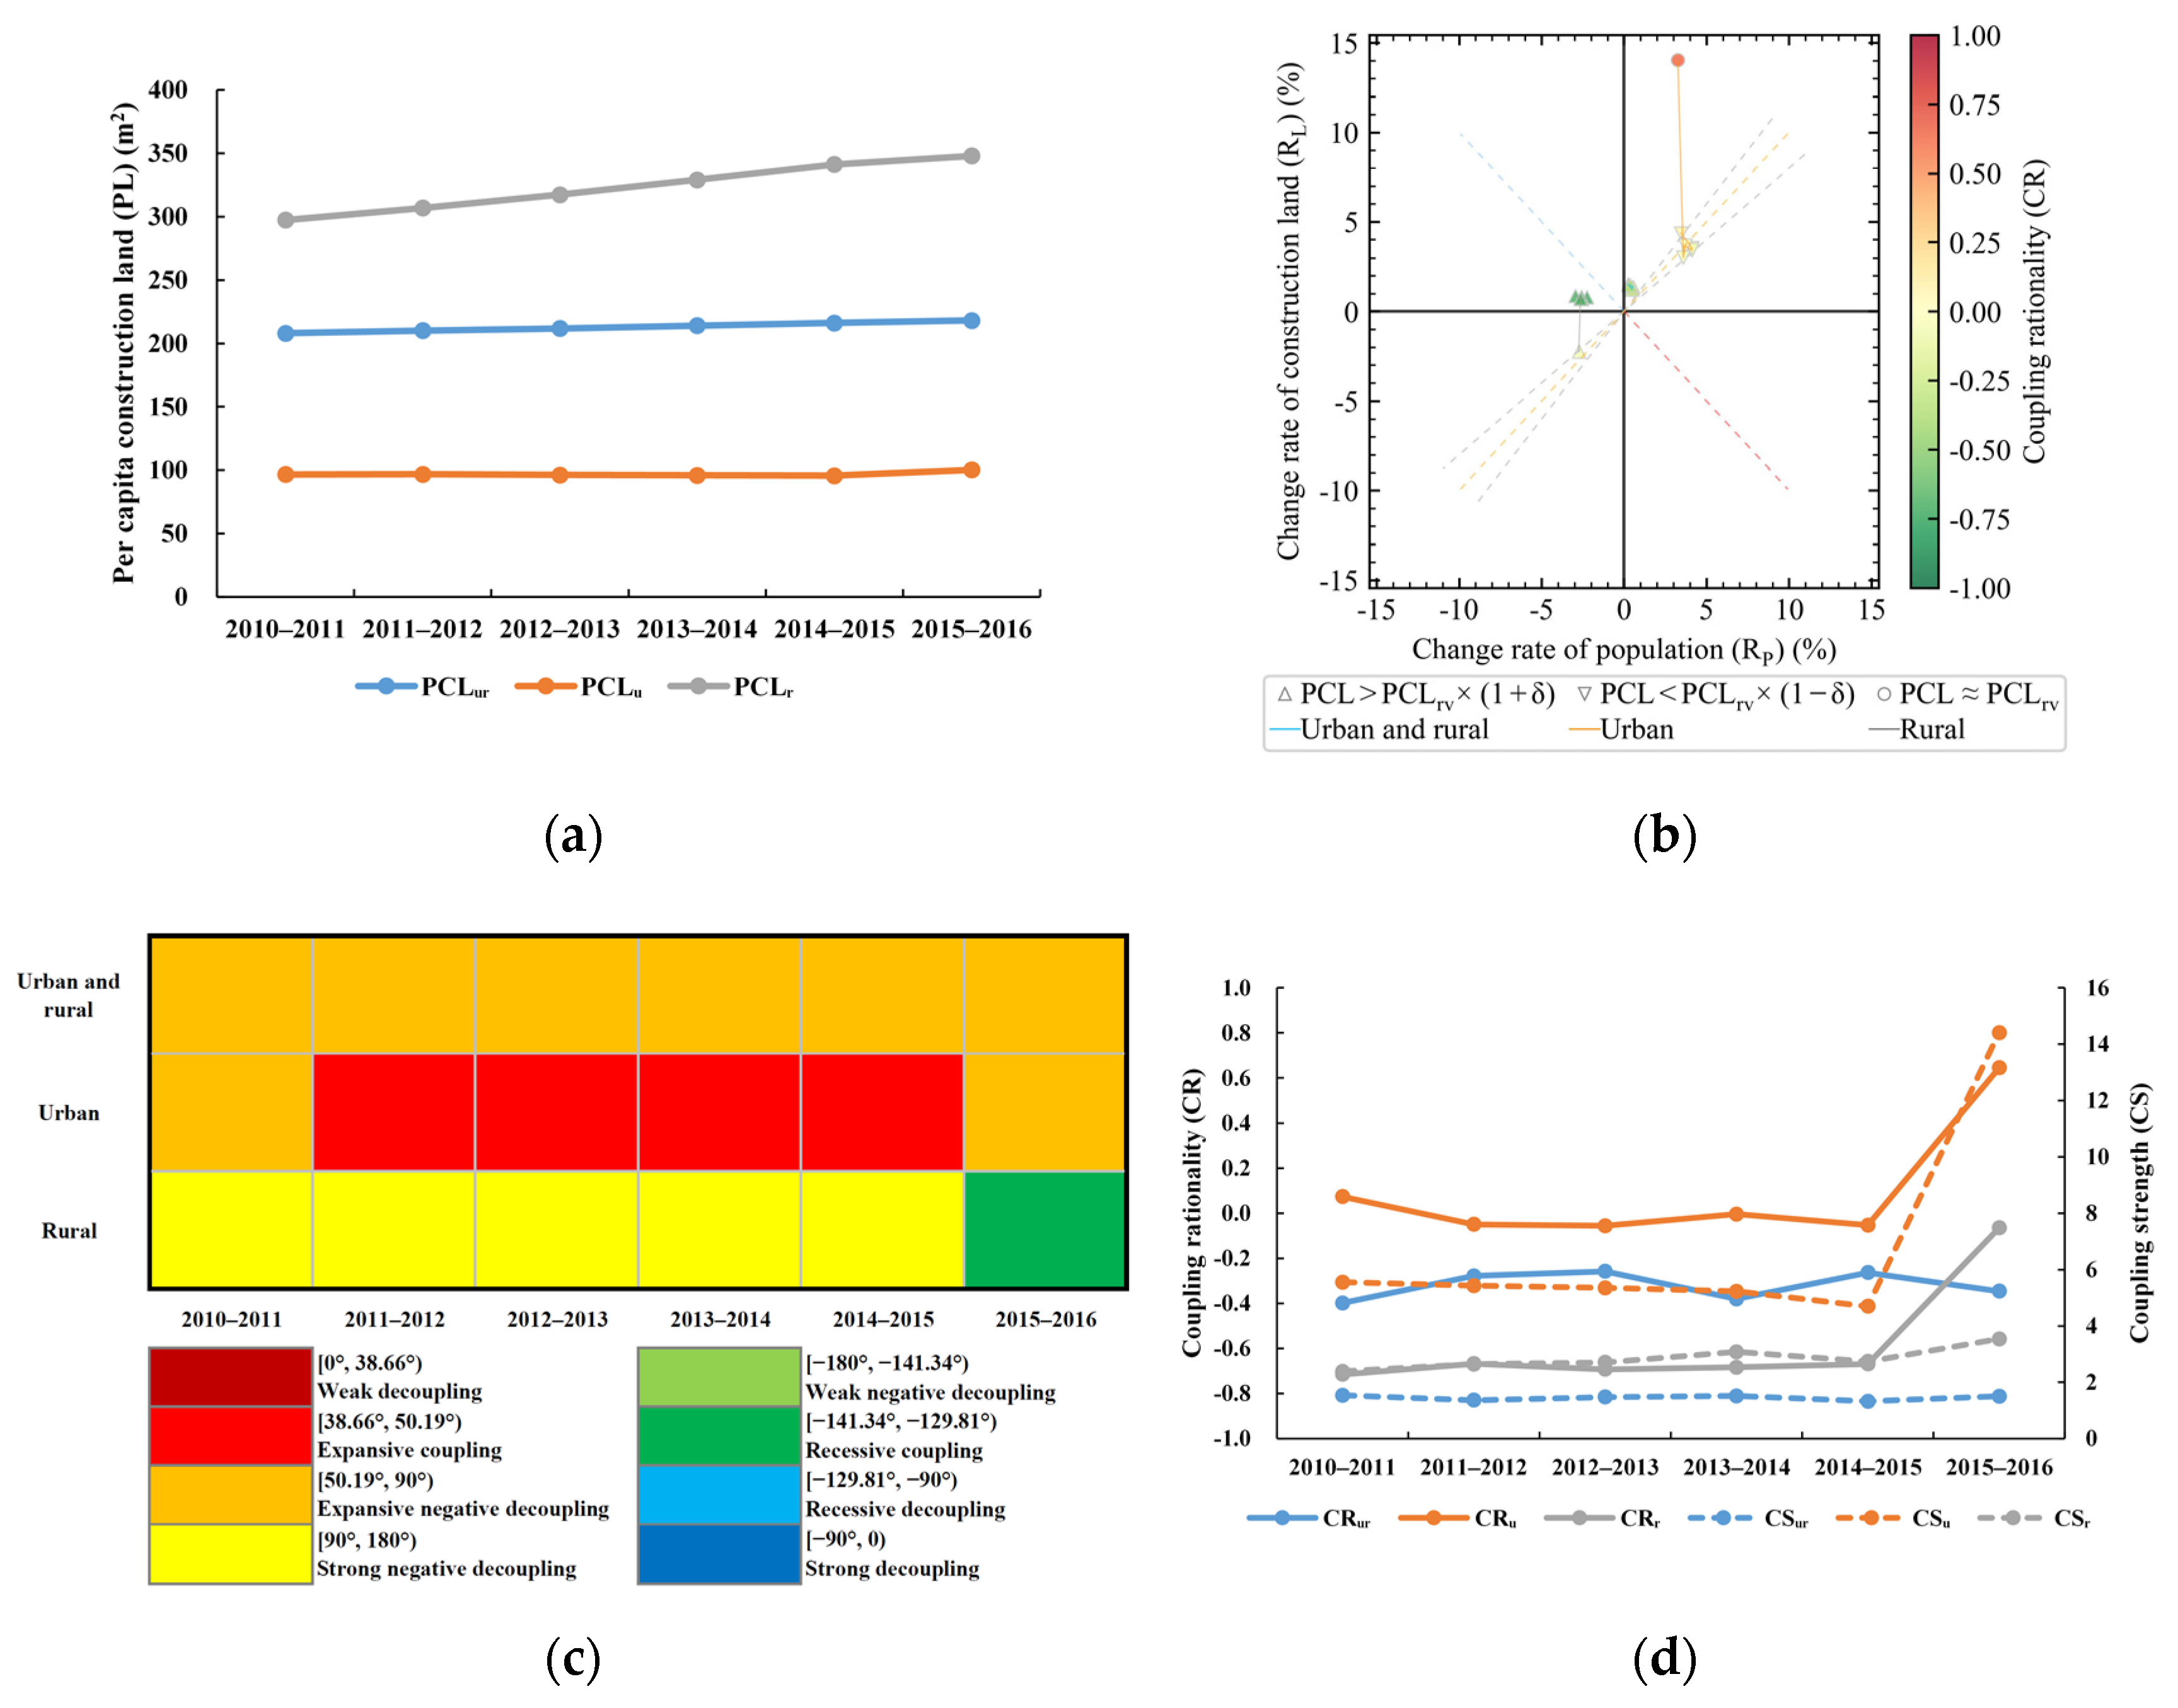
First, we analyzed the coupling relationship between URCL and URP in Henan province. The PCL of URCL increased from 206.69 m2/person in 2010 to 219.28 m2/person in 2016, all greater than their ideal value of 130 m2/person (Figure 5a). Therefore, from the perspective of static coupling, the relationship between URCL and URP was unreasonable and had a further deterioration trend. Furthermore, from 2010 to 2016, the coupling angle between URCL and URP was 68.18–80.86°; so, the coupling type was expansion negative decoupling (Figure 5b,c). During this period, the coupling radius between URCL and URP was 1.54–1.51, which indicates that the coupling strength was relatively weak but stable. Additionally, because the PCL of URCL exceeded the upper tolerance limit of its ideal value, 143 m2/person, during the period, the ideal coupling angle between URCL and URP was −45°. Then, according to the difference between the coupling angle and its ideal value, the coupling rationality was −0.40 to −0.26 during the period (Figure 5b,d). Therefore, from the perspective of dynamic coupling, the relationship between URCL and URP was also unreasonable, but the overall state was relatively stable.
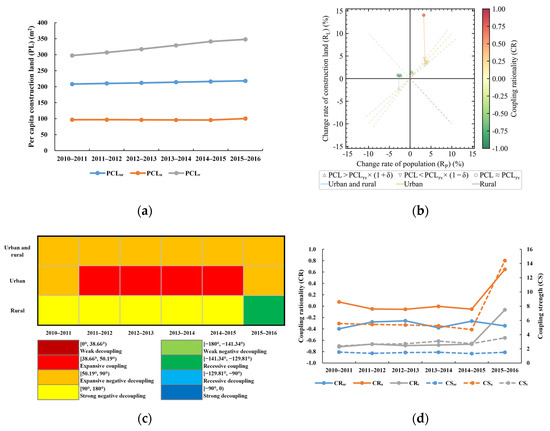
Figure 5.
Static and dynamic coupling analysis of URCL and population in Henan province from 2010 to 2016: (a) PCL changes of URCL, UCL, and RCL; (b) coupling scatter plot; (c) changes of coupling angle and coupling types; (d) changes of coupling rationality and coupling strength. In the figure, CRur, CRu, and CRr are the coupling rationality of URCL–URP, UCL–UP, and RCL–RP, respectively, and CSur, CSu, and CSr are their coupling strengths.
Second, we analyzed the coupling relationship between UCL and UP in Henan province. The PCL of UCL increased from 96.24 m2/person in 2010 to 105.30 m2/person in 2016, all less than their ideal value of 110 m2/person (Figure 5a). Therefore, from the perspective of static coupling, the relationship between UCL and UP was relatively reasonable and had a tendency to approach its ideal value. Although the increased PCL of UCL indicates the decreased intensity of UCL, this decrease was necessary and reasonable for socioeconomic development. Furthermore, from 2010 to 2016, the coupling angle between UCL and UP was 39.98–76.92°, and the coupling type was expansive coupling except for the periods of 2010–2011 and 2015–2016, which were expansive negative decoupling (Figure 5b,c). During the period, the coupling radius between UCL and UP was 4.70–5.55, except for the 2015–2016 period, which was 14.41. The coupling radius indicates that the coupling strength between UCL and UP was relatively strong and had an increasing trend. Additionally, during most of the period, the PCL of UCL was less than the lower tolerance limit of its ideal value, 99 m2/person, except for the 2015–2016 period, which was within the tolerance range of its ideal value, 99–121 m2/person. Accordingly, the ideal coupling angle between UCL and UP was 135° except in the 2015–2016 period, during which the ideal coupling angle was 90°. Then, according to the difference between the coupling angle and its ideal value, the coupling rationality was −0.06 to 0.65 during the period (Figure 5b,d). Therefore, from the perspective of dynamic coupling, the relationship between URL and UP was moderately reasonable and had an improvement trend.
Finally, we analyzed the coupling relationship between RCL and RP in Henan province. The PCL of RCL increased from 292.76 m2/person in 2010 to 348.89 m2/person in 2016, which was much higher than its ideal value of 150 m2/person (Figure 5a). Therefore, from the perspective of static coupling, the relationship between RCL and RP was highly unreasonable and showed a further deterioration trend. Furthermore, from 2010 to 2016, the coupling angle between RCL and RP was 160.63–219.18°; so, the coupling type was strong negative decoupling except for the 2015–2016 period, which was recessive decoupling (Figure 5b,c). During the period, the coupling radius between RCL and RP was 2.39–3.54, which indicates that the coupling strength was in a relatively weak stable state. Additionally, because the PCL of RCL exceeded the upper tolerance limit of its ideal value, 165 m2/person, during the period, the ideal coupling angle between RCL and RP was −45°. Then, according to the difference between the coupling angle and its ideal value, the coupling rationality was −0.72 to −0.06 during the period (Figure 5b,d). Therefore, from the perspective of dynamic coupling, the relationship between RCL and RP was also highly unreasonable, but there was an improvement trend.
As analyzed above, the static and dynamic coupling relationships between UCL and UP in Henan province were relatively reasonable, but these relationships between RCL and RP were highly unreasonable. Therefore, the unreasonable coupling relationship between RCL and RP was the reason for the unreasonable coupling relationship between URCL and URP. Furthermore, this suggests that RCL is the key to the future management and regulation of URCL.
4.2. Regional Analysis
4.2.1. Static Coupling Analysis
Next, we used PCL to analyze the static coupling relationships between URCL and population in 2010 and 2016 from the perspective of prefecture-level cities in Henan province.
First, we analyzed the static coupling relationship between URCL and URP (Figure 6a,d). In 2010, the PCL of URCL for all prefecture-level cities of Henan province exceeded the ideal value of 130 m2/person, and the highest one, Xinyang in the south, reached 318.85 m2/person. Moreover, the PCL of URCL further increased in 2016. The number of prefecture-level cities with low PCL of URCL decreased significantly, and a cluster of high PCL of URCL emerged in the south of Henan province. Overall, the PCL of URCL in Henan province presented a spatial pattern where the middle-western regions were the center of low PCL of URCL, and the surrounding regions were areas with high PCL of URCL. This spatial pattern suggests that the static coupling rationality between URCL and URP in the middle-western regions was relatively high. In contrast, the rationality in the surrounding regions was relatively low, especially in the south.
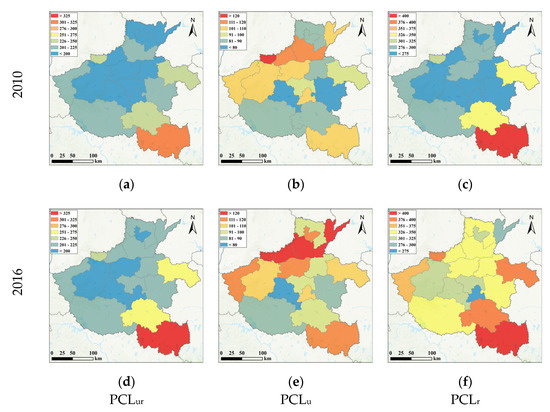
Figure 6.
Regional PCL changes of URCL in Henan province from 2010 to 2016 (Unit: m2/person): (a) regional PCL of URCL in 2010; (b) regional PCL of UCL in 2010; (c) regional PCL of RCL in 2010; (d) regional PCL of URCL in 2016; (e) regional PCL of UCL in 2016; (f) regional PCL of RCL in 2016.
Second, we analyzed the static coupling relationship between UCL and UP (Figure 6b,e). In 2010, the PCL of UCL for most prefecture-level cities of Henan province was relatively reasonable. Only three prefecture-level cities’ PCL of UCL was higher than the ideal value of 110 m2/person. These prefecture-level cities were located in the center and north of Henan province. In 2016, the PCL of UCL increased slightly, and the number of prefecture-level cities with a PCL of UCL higher than the ideal value increased to eight. Most of these prefecture-level cities were located in the middle-north of Henan province, but some were located in the south and west. Overall, the static coupling rationality between UCL and UP in Henan province was generally high. Specifically, most prefecture-level cities in the middle had relatively high rationality. In contrast, some prefecture-level cities in the north had relatively low rationality.
Finally, we analyzed the static coupling relationship between RCL and RP (Figure 6c,f). In 2010, the PCL of RCL for all prefecture-level cities of Henan province exceeded the ideal value of 150 m2/person. Additionally, four prefecture-level cities’ PCL of RCL was higher than 300 m2/person. These prefecture-level cities were located in the south and east of Henan province. Moreover, the PCL of RCL further increased in 2016, and only two prefecture-level cities’ PCL of RCL was lower than 300 m2/person. Overall, the static coupling rationality between RCL and RP in Henan province was low. Specifically, the rationality in the middle of Henan province was relatively high, while the rationality in the surrounding regions was relatively low. Moreover, the PCL of RCL presented an overall trend of continuous increase, and this trend deserves more attention in the future.
4.2.2. Dynamic Coupling Analysis
We used the coupling model of polar coordinates to analyze the dynamic coupling relationships between URCL and population in two periods, 2010–2013 and 2013–2016, from the perspective of prefecture-level cities in Henan province.
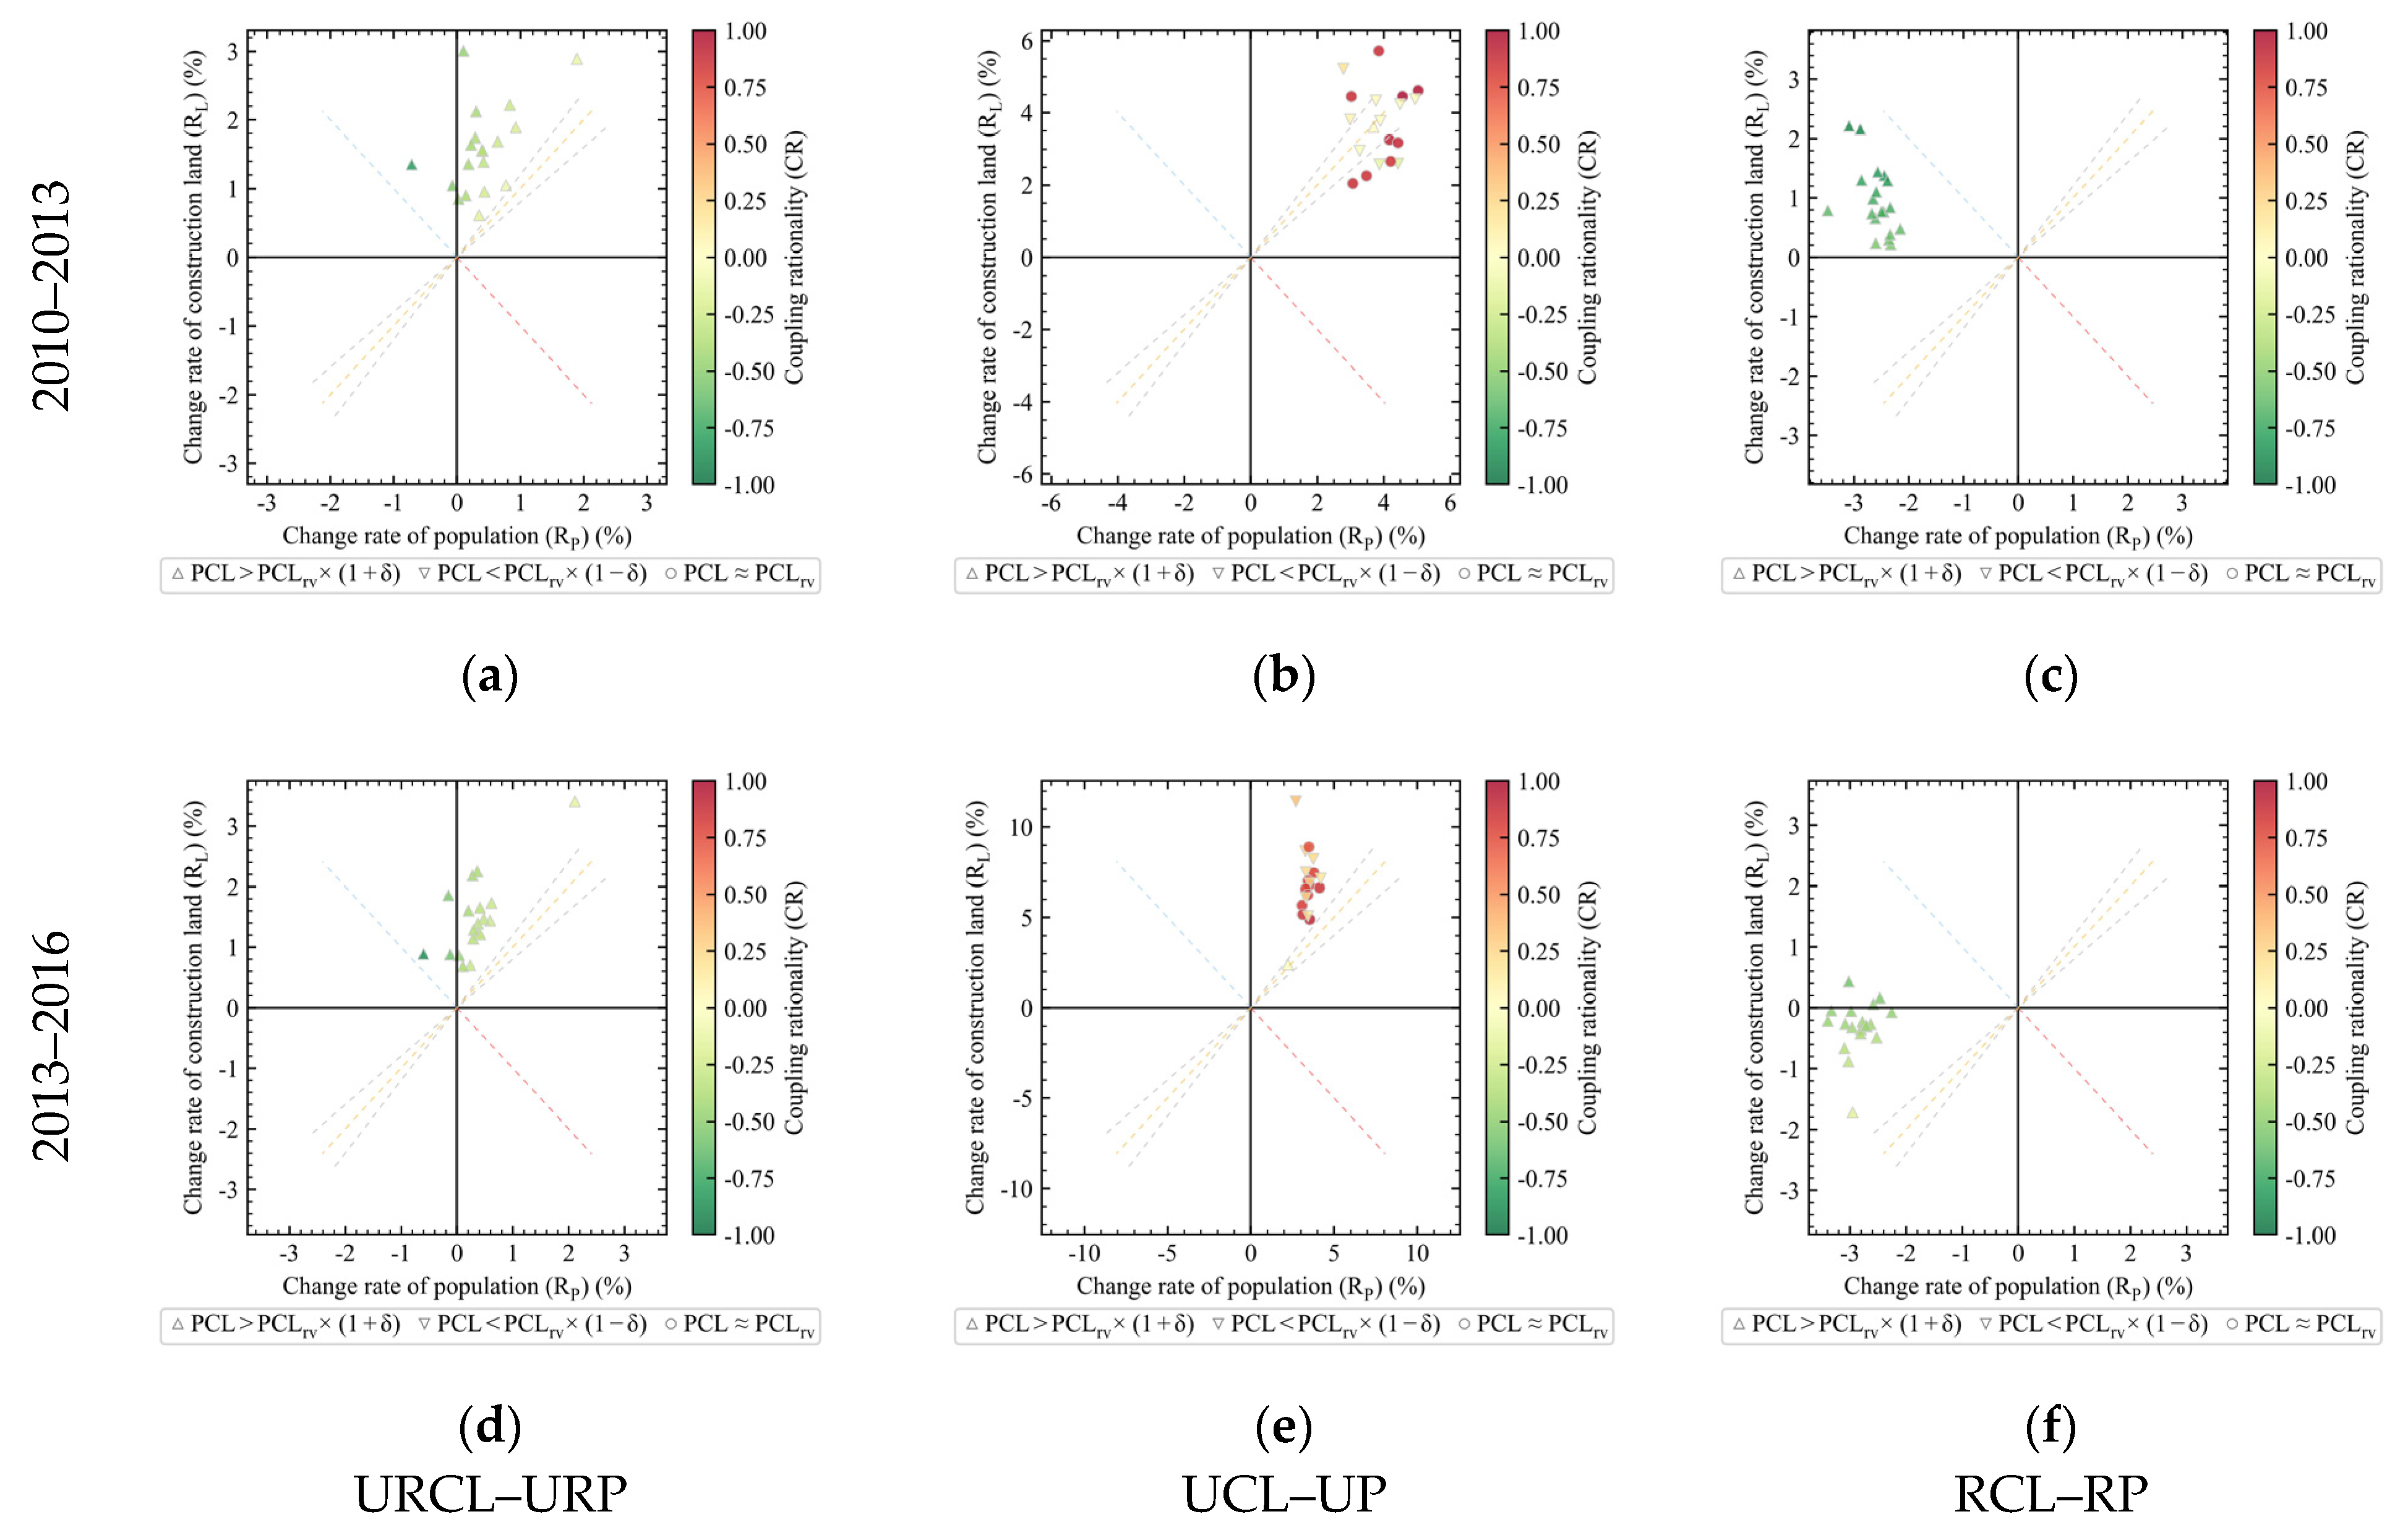
First, we analyzed the dynamic coupling relationship between URCL and URP (Figure 7a,d). The average coupling angle between URCL and URP of prefecture-level cities changed from 77.08° in 2010–2013 to 80.27° in 2013–2016. This change indicates that the dynamic coupling relationship was relatively stable in the state of expansion negative decoupling. However, a trend of transition from expansion negative decoupling to strong negative decoupling was observed. The average coupling radius between URCL and URP of prefecture-level cities decreased from 1.68 in 2010–2013 to 1.55 in 2013–2016. This decrease indicates that the coupling strength presented a weakening trend, but the overall trend was relatively stable. The average coupling rationality between URCL and URP of prefecture-level cities decreased from −0.3564 in 2010–2013 to −0.3918 in 2010–2013. Therefore, the coupling rationality was generally low and presented a trend of deterioration. Furthermore, the coupling rationality between URCL and URP in the north of Henan province improved in the two periods, while the coupling rationality in the south deteriorated (Figure 8a,d).
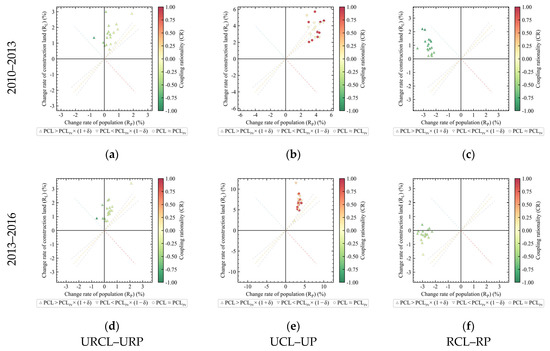
Figure 7.
Coupling scatter plot of URCL and population in the prefecture-level cites of Henan province from 2010 to 2016: (a) coupling scatter plot of URCL and URP from 2010 to 2013; (b) coupling scatter plot of UCL and UP from 2010 to 2013; (c) coupling scatter plot of RCL and RP from 2010 to 2013; (d) coupling scatter plot of URCL and URP from 2013 to 2016; (e) coupling scatter plot of UCL and UP from 2013 to 2016; (f) coupling scatter plot of RCL and RP from 2013 to 2016.
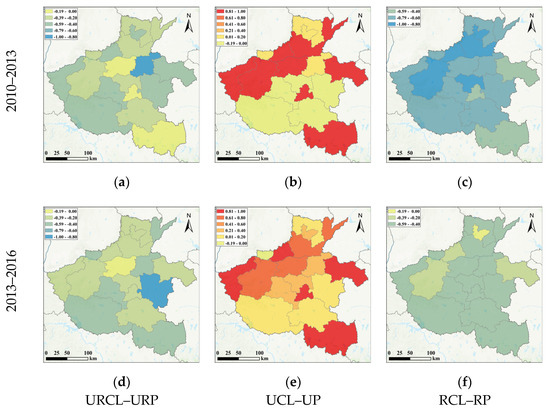
Figure 8.
Regional changes of coupling rationality between URCL and population in Henan province from 2010 to 2016: (a) regional coupling rationality between URCL and URP from 2010 to 2013; (b) regional coupling rationality between UCL and UP from 2010 to 2013; (c) regional coupling rationality between RCL and RP from 2010 to 2013; (d) regional coupling rationality between URCL and URP from 2013 to 2016; (e) regional coupling rationality between UCL and UP from 2013 to 2016; (f) regional coupling rationality between RCL and RP from 2013 to 2016.
Second, we analyzed the dynamic coupling relationship between UCL and UP (Figure 7b,e). The average coupling angle between UCL and UP of prefecture-level cities changed from 42.77° in 2010–2013 to 62.08° in 2013–2016. This change indicates that the dynamic coupling relationship transformed from weak decoupling and expansion coupling to expansive negative decoupling. The average coupling radius between UCL and UP of prefecture-level cities increased from 5.42 in 2010–2013 to 7.61 in 2013–2016. This increase indicates that the coupling strength was significantly enhanced. The average coupling rationality between UCL and UP of prefecture-level cities increased from 0.4490 in 2010–2013 to 0.5044 in 2013–2016. Therefore, the coupling rationality presented a slight improvement. Moreover, the coupling rationality between URCL and URP in the middle-south of Henan province significantly improved, while the coupling rationality of some prefecture-level cities in the middle-west slightly deteriorated (Figure 8b,e).
Finally, we analyzed the dynamic coupling relationship between RCL and RP (Figure 7c,f). The average coupling angle between RCL and RP of prefecture-level cities changed from 160.85° in 2010–2013 to −173.98° in 2013–2016. This change indicates that the dynamic coupling relationship transformed from strong negative decoupling to weak negative decoupling. The average coupling radius between RCL and RP of prefecture-level cities increased from 2.82 in 2010–2013 to 2.90 in 2013–2016. This increase indicates that the coupling strength presented an increasing trend, but the overall trend was relatively stable. The average coupling rationality between RCL and RP of prefecture-level cities increased from −0.7127 in 2010–2013 to −0.4331 in 2010–2013. Therefore, the coupling rationality between RCL and RP of most prefecture-level cities improved significantly in the two periods, especially in some prefecture-level cities in the north, west, and middle of Henan province (Figure 8c,f).
5. Discussion
Scientifically measuring the quantity and structure of URCL and understanding its transition characteristics are essential for sustainable utilization of land resources and sustainable development of the economy and society. As mentioned above, LUR, PCL, and Tapio’s decoupling model of elasticity have been the primary measures of the quantity and structure of URCL in the past. However, this study found two drawbacks in using Tapio’s decoupling model of elasticity to measure the dynamic coupling characteristics between URCL and population. One is that the model focuses on the increment of URCL and ignores its stock, which may lead to unscientific measurement. The other is the inconvenience of comparing coupling relationships by discrete coupling types. Therefore, this study proposed the coupling model of polar coordinates to compensate for these two drawbacks. First, the model extends the concept of coupling analysis from the original analysis of coupling types to three aspects: the coupling type, coupling strength, and coupling rationality. The proposal of coupling rationality makes the coupling analysis more scientific and avoids the drawback of Tapio’s decoupling model of elasticity, which does not consider the stock of URCL. Second, coupling rationality and coupling strength are continuous measures. They can analyze the continuous change trend of the coupling relationship between URCL and population quantitatively or compare different research units’ coupling states more accurately.
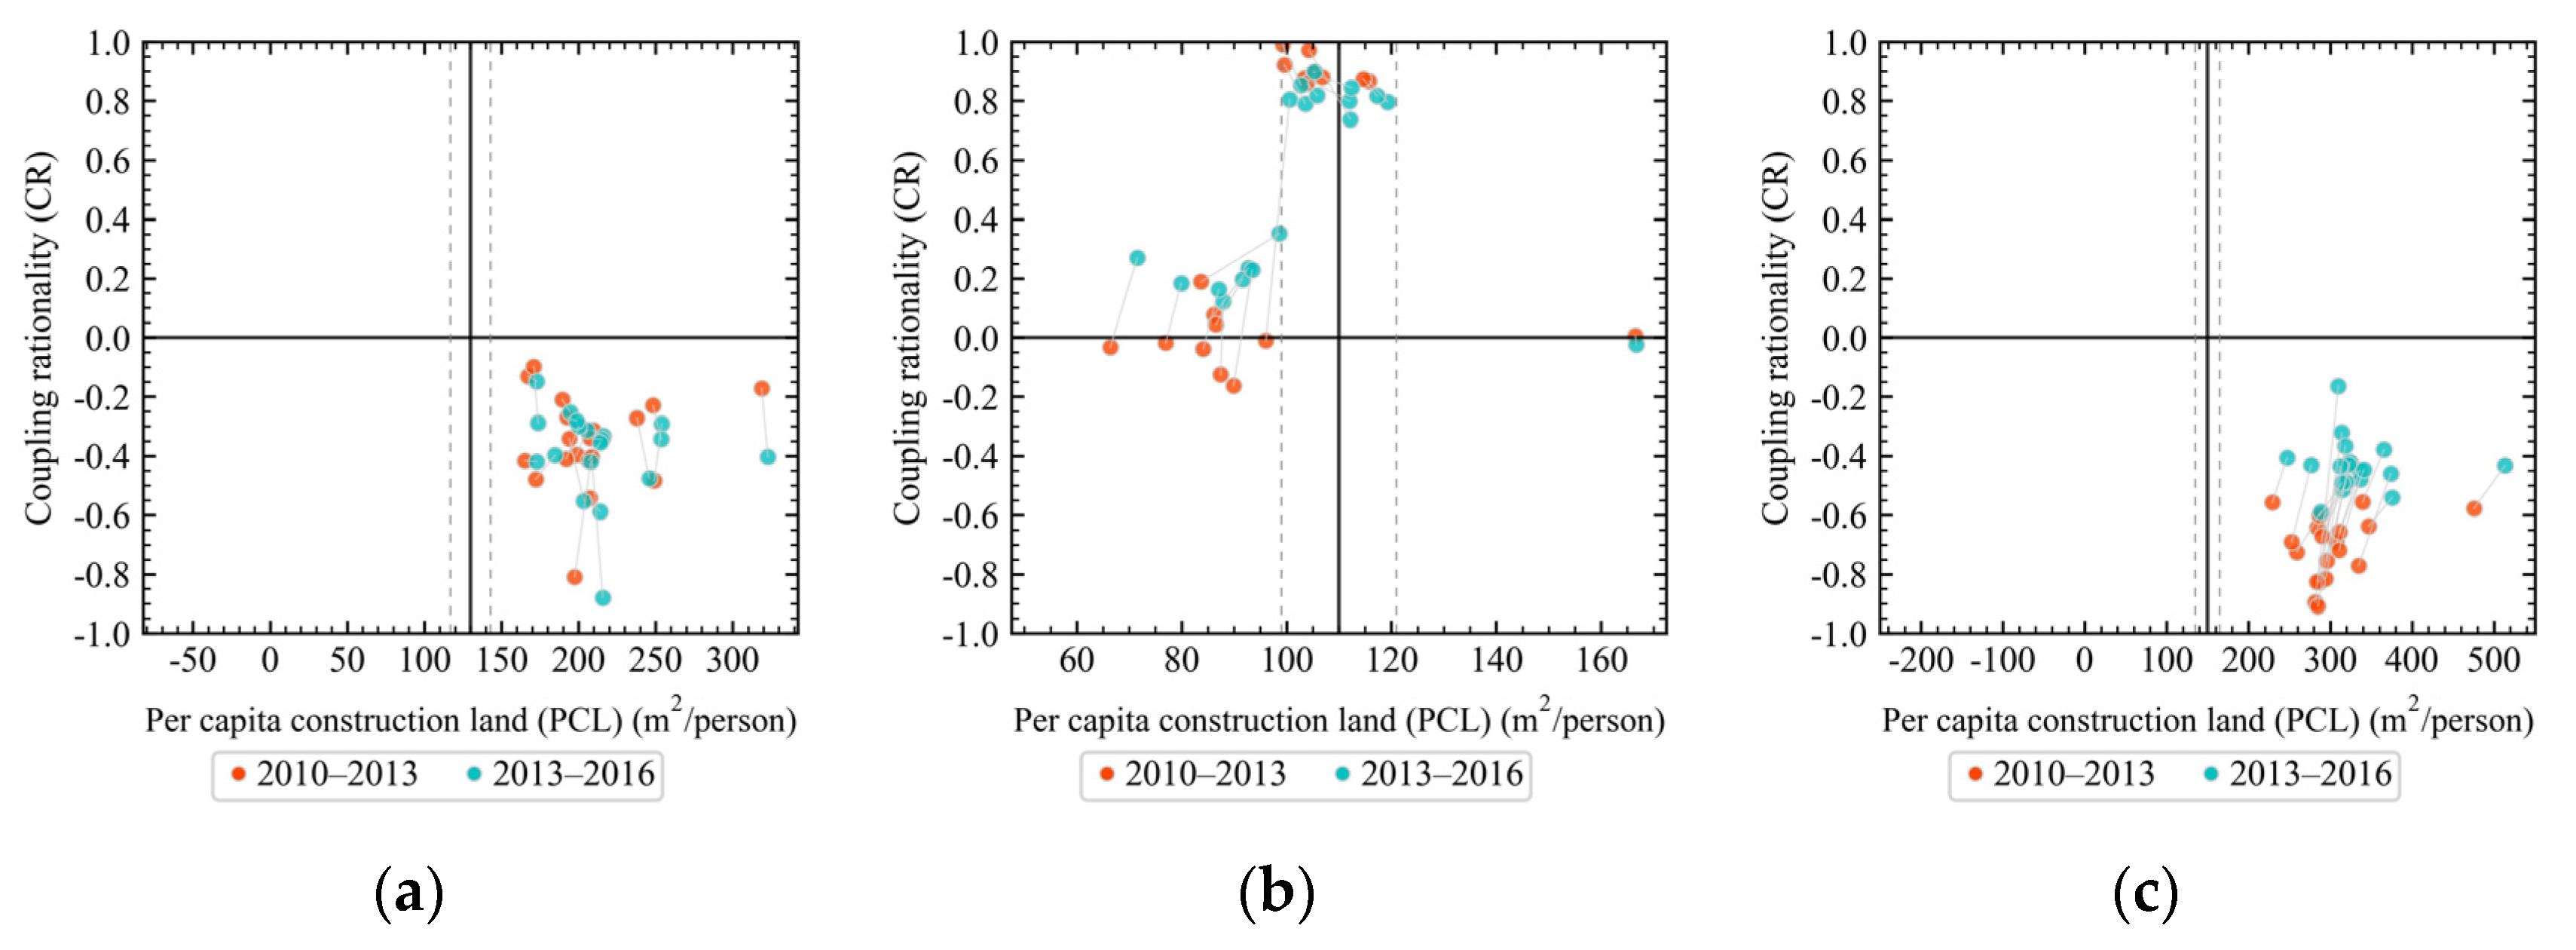
To better explain the coupling characteristics between URCL and population, we use the PCL and coupling rationality to measure the static and dynamic coupling characteristics, respectively. Specifically, PCL is a rationality measure of the stock URCL. If the PCL is within its reasonable value range, the stock state is relatively reasonable, and vice versa. The coupling rationality is a rationality measure of the incremental URCL. The higher the coupling rationality, the more reasonable the incremental URCL, and vice versa. Here, we took the coupling state transition of 18 prefecture-level cities in Henan province in two periods, 2010–2013 and 2013–2016, as an example for further illustration (Figure 9).
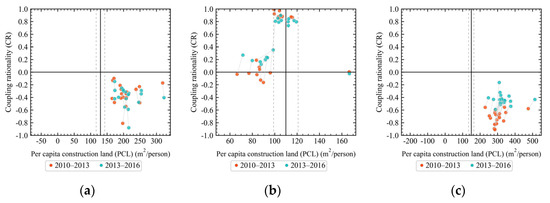
Figure 9.
Transition analysis of the coupling state between URCL and population in Henan province from 2010 to 2016: (a) coupling state transition of URCL–URP; (b) coupling state transition of UCL–UP; (c) coupling state transition of RCL–RP.
First, we analyzed the coupling state transition of URCL–URP (Figure 9a). In the two periods, the PCL of URCL for all prefecture-level cities was greater than the upper limit of its reasonable value, and the coupling rationality was less than zero. These measures indicate that the overall state of URCL for all prefecture-level cities in Henan province was unreasonable from both the incremental and stock perspective, and the state was relatively stable.
Second, we analyzed the coupling state transition of UCL–UP (Figure 9b). From the scatterplot, the prefecture-level cities formed three groups. The first group included the prefecture-level cities whose PCL was less than the lower limit of the reasonable value, and the coupling rationality was moderate. In the two periods, the first group’s PCL and coupling rationality presented a significant improvement trend. The second group included the prefecture-level cities whose PCL was within the reasonable range, and the coupling rationality was relatively high. Although the PCL of the second group had no significant change in the two periods, the coupling rationality presented a slight deterioration trend. The third group included only one prefecture-level city whose PCL was greater than the upper limit of the reasonable value, and the coupling rationality was moderate. In the two periods, the state of the third group was relatively stable. The above analysis results indicate apparent differences in the utilization rationality of UCL for prefecture-level cities in Henan province. Furthermore, the overall state of UCL was relatively reasonable and showed an improvement trend.
Finally, we analyzed the coupling state transition of RCL–RP (Figure 9c). Similar to the coupling state of URCL-URP, in the two periods, the PCL of RCL for all prefecture-level cities was greater than the upper limit of its reasonable value, and the coupling rationality was less than zero. However, the difference was that the coupling rationality presented a significant improvement trend. The similarity and difference indicate that although the overall state of RCL for all prefecture-level cities in Henan province was unreasonable, the increment of RCL showed signs of improvement.
The above case analysis results indicate that the combination of PCL and coupling rationality can measure the utilization rationality of URCL scientifically and accurately. Based on the measures and analysis, scientific and practical differentiated control strategies for URCL can be formulated according to local conditions and development stages. Furthermore, the case analysis results prove that the coupling model of polar coordinates proposed in this study is more scientific and convenient than the commonly used Tapio’s decoupling model of elasticity.
6. Conclusions
URCL is the primary carrier of production and living activities in urban and rural areas. Under the background of more people and less land in China and the continuous occupation of cultivated land resources by construction land, it is of great significance to scientifically measure the utilization rationality of URCL and formulate differentiated countermeasures accordingly. Therefore, this study first proposed an improved transition process theory of URCL and population in ideal and actual situations and proved that the middle stage of urbanization is the critical period for the quantitative control and structural adjustment of URCL. Then, this study proposed the coupling model of polar coordinates to measure the quantitative coupling relationship between URCL and population and used Henan province in China to verify the model. The analysis results show that the PCL of URCL and the coupling rationality between URCL and URP in Henan province were relatively unreasonable and stable in general. Specifically, the PCL of UCL and the coupling rationality between UCL and UP were relatively reasonable, while the PCL of RCL and the coupling rationality between RCL and RP were unreasonable. Therefore, the unreasonable utilization of RCL was the primary reason for the unreasonable utilization of URCL. However, the excellent phenomenon was that the coupling rationality between RCL and RP had a significant improvement tendency. We further analyzed the coupling relationship between URCL and population of prefecture-level cities in Henan province, which was meaningful for formulating differentiated countermeasures for the reasonable utilization of URCL.
The coupling model of polar coordinates proposed in this study achieved satisfactory results in its application in Henan province. The model considers the incremental and stock rationality of URCL and includes measures such as the coupling type, coupling strength, and coupling rationality. Furthermore, coupling strength and rationality are continuous measures that are convenient for comparison. Therefore, the coupling model of polar coordinates makes the measurement of the quantitative coupling relationship between URCL and population more scientific, comprehensive, and accurate, which makes up for the drawbacks of Tapio’s decoupling model of elasticity. In this paper, because the population is a significant factor closely related to URCL, we analyzed the utilization rationality of URCL through the coupling relationship between URCL and population. However, the economy is also closely related to URCL. In future research, we will further analyze the utilization rationality of URCL through the coupling relationship between URCL and the economy. Compared with the research on the coupling relationship between URCL and population, a direct difficulty is that there is no generally accepted reference standard for the static coupling characteristics between URCL and economy. Furthermore, the coupling model of polar coordinates proposed in this study is based on Tapio’s decoupling model of elasticity, originally used to measure the coupling relationship between carbon dioxide emission and GDP. The coupling model of polar coordinates has the coupling type identification function that Tapio’s decoupling model of elasticity has as well as the coupling strength and rationality measurement functions that Tapio’s decoupling model of elasticity lacks. Therefore, the coupling model of polar coordinates can extend its application to research on the coupling relationship between resources and environment and socioeconomics.
Supplementary Materials
The following supporting information can be downloaded at: https://www.mdpi.com/article/10.3390/land11050735/s1, Text S1: Illustration on the transition process curves of urban–rural construction land and population.
Author Contributions
Conceptualization, J.L. (Jiwei Li) and Q.Y.; methodology, J.L. (Jiwei Li) and Q.Y.; software, J.L. (Jiwei Li); validation, E.C., H.W., X.F., and Y.G.; formal analysis, Q.Y., W.C., and X.K.; investigation, Q.B. and J.L. (Jie Lu); data curation, Q.B. and J.L. (Jie Lu); writing—original draft preparation, J.L. (Jiwei Li) and Q.Y.; writing—review and editing, W.C. and X.K.; visualization, J.L. (Jiwei Li) and Q.Y.; supervision, J.L. (Jiwei Li) and W.C.; project administration, J.L. (Jiwei Li) and W.C.; funding acquisition, Q.Y., J.L. (Jiwei Li), and E.C. All authors have read and agreed to the published version of the manuscript.
Funding
This research was funded by the National Natural Science Foundation of China (grant no. 41701203), the Humanities and Social Sciences Research Project of Education Department of Henan Province (grant no. 2019-ZZJH-048), the Humanities and Social Sciences Research Project of Education Department of Henan Province (grant no. 2021-ZZJH-157), the Zhengzhou Soft Science Research Plan Projects (grant no. 2020RKXF0105), and the Technological Innovation Foundation of Henan Agricultural University (grant no. KJCX2018B04).
Institutional Review Board Statement
Not applicable.
Informed Consent Statement
Not applicable.
Data Availability Statement
The data presented in this study are available on request from the corresponding author.
Acknowledgments
We are grateful to the reviewers for their constructive and valuable comments.
Conflicts of Interest
The authors declare no conflict of interest.
References
- Long, H. Land use policy in China: Introduction. Land Use Policy 2014, 40, 1–5. [Google Scholar] [CrossRef]
- Liu, Y.; Fang, F.; Li, Y. Key issues of land use in China and implications for policy making. Land Use Policy 2014, 40, 6–12. [Google Scholar] [CrossRef]
- Gao, W.; de Vries, W.T.; Zhao, Q. Understanding rural resettlement paths under the increasing versus decreasing balance land use policy in China. Land Use Policy 2021, 103, 105325. [Google Scholar] [CrossRef]
- Huang, X.; Li, Y.; Yu, R.; Zhao, X. Reconsidering the Controversial Land Use Policy of “Linking the Decrease in Rural Construction Land with the Increase in Urban Construction Land“: A Local Government Perspective. China Rev. Interdiscip. J. Greater China 2014, 14, 175–198. [Google Scholar]
- Long, H.; Li, Y.; Liu, Y.; Woods, M.; Zou, J. Accelerated Restructuring in Rural China Fueled by ’Increasing Vs. Decreasing Balance’ Land-Use Policy for Dealing with Hollowed Villages. Land Use Policy 2012, 29, 11–22. [Google Scholar] [CrossRef]
- Ma, L.; Chen, M.; Fang, F.; Che, X. Research on the spatiotemporal variation of rural-urban transformation and its driving mechanisms in underdeveloped regions: Gansu Province in western China as an example. Sustain. Cities Soc. 2019, 50, 101675. [Google Scholar] [CrossRef]
- Biller, D.; Andres, L.; Cuberes, D. A Dynamic Spatial Model of Rural-Urban Transformation with Public Goods; World Bank Group: Washington, DC, USA, 2014; ISBN 2014-1020. [Google Scholar]
- Siciliano, G. Urbanization strategies, rural development and land use changes in China: A multiple-level integrated assessment. Land Use Policy 2012, 29, 165–178. [Google Scholar] [CrossRef]
- Mcgee, T.G. Managing the rural–urban transformation in East Asia in the 21st century. Sustain. Sci. 2008, 3, 155–167. [Google Scholar] [CrossRef]
- Hart, G.P.; Sitas, A. Beyond the urban-rural divide: Linking land, labour, and livelihoods. Transform. Crit. Perspect. S. Afr. 2005, 56, 31–38. [Google Scholar] [CrossRef]
- Meyfroidt, P.; Roy Chowdhury, R.; de Bremond, A.; Ellis, E.C.; Erb, K.H.; Filatova, T.; Garrett, R.D.; Grove, J.M.; Heinimann, A.; Kuemmerle, T.; et al. Middle-range theories of land system change. Glob. Environ. Change 2018, 53, 52–67. [Google Scholar] [CrossRef]
- Nourqolipour, R.; Shariff, A.R.B.M.; Balasundram, S.K.; Ahmad, N.B.; Sood, A.M.; Buyong, T. Predicting the Effects of Urban Development on Land Transition and Spatial Patterns of Land Use in Western Peninsular Malaysia. Appl. Spat. Anal. Policy 2016, 9, 1–19. [Google Scholar] [CrossRef]
- Chen, K.; Long, H.; Liao, L.; Tu, S.; Li, T. Land use transitions and urban-rural integrated development: Theoretical framework and China’s evidence. Land Use Policy 2020, 92, 104465. [Google Scholar] [CrossRef]
- Long, H.; Zhang, Y.; Ma, L.; Tu, S. Land Use Transitions: Progress, Challenges and Prospects. Land 2021, 10, 903. [Google Scholar] [CrossRef]
- Kong, X.; Fu, M.; Zhao, X.; Wang, J.; Jiang, P. Ecological effects of land-use change on two sides of the Hu Huanyong Line in China. Land Use Policy 2022, 113, 105895. [Google Scholar] [CrossRef]
- Lawniczak, R.; Kubiak, J. Changes in the settlement network in the Notec Forest (Poland) in a historical perspective. J. Maps 2021, 17, 14–22. [Google Scholar] [CrossRef]
- Prus, B.; Szylar, M. The analysis of settlement network’s dispersion using Ward’s taxonomy method. Surv. Rev. 2019, 51, 273–279. [Google Scholar] [CrossRef]
- Prus, B.; Bacior, S.; Dudzinska, M. Settlement network concentration as determinant for rural areas development. In Proceedings of the 16th International Scientific Conference: Engineering for Rural Development, Jelgava, Latvia, 24–26 May 2017; Malinovska, L., Osadcuks, V., Eds.; Latvia University of Life Sciences and Technologies: Jelgava, Latvia, 2017; pp. 474–480. [Google Scholar]
- Yiannakou, A.; Eppas, D.; Zeka, D. Spatial Interactions between the Settlement Network, Natural Landscape and Zones of Economic Activities: A Case Study in a Greek Region. Sustainability 2017, 9, 1715. [Google Scholar] [CrossRef] [Green Version]
- Andreasen, M.H.; Moller-Jensen, L. Beyond the networks: Self-help services and post-settlement network extensions in the periphery of Dar es Salaam. Habitat Int. 2016, 53, 39–47. [Google Scholar] [CrossRef] [Green Version]
- Asimakopoulos, A.; Mogios, E.; Xenikos, D.G. Geographic location, network patterns and population distribution of rural settlements in Greece. Int. J. Mod. Phys. B 2016, 30, 1541009. [Google Scholar] [CrossRef]
- Kabanda, T.H. Using land cover, population, and night light data to assess urban expansion in Kimberley, South Africa. S. Afr. Geogr. J. 2022, 1–14. [Google Scholar] [CrossRef]
- Terama, E.; Clarke, E.; Rounsevell, M.D.A.; Fronzek, S.; Carter, T.R. Modelling population structure in the context of urban land use change in Europe. Reg. Environ. Change 2019, 19, 667–677. [Google Scholar] [CrossRef] [Green Version]
- de Espindola, G.M.; Neves Da Costa Carneiro, E.L.; Facanha, A.C. Four decades of urban sprawl and population growth in Teresina, Brazil. Appl. Geogr. 2017, 79, 73–83. [Google Scholar] [CrossRef]
- Skog, K.L.; Steinnes, M. How do centrality, population growth and urban sprawl impact farmland conversion in Norway? Land Use Policy 2016, 59, 185–196. [Google Scholar] [CrossRef]
- Egidi, G.; Halbac-Cotoara-Zamfir, R.; Cividino, S.; Quaranta, G.; Salvati, L.; Colantoni, A. Rural in Town: Traditional Agriculture, Population Trends, and Long-Term Urban Expansion in Metropolitan Rome. Land 2020, 9, 53. [Google Scholar] [CrossRef] [Green Version]
- Liu, Y.; Li, J.; Hou, H.; Liu, Y. Study on urbanization rate of urban-rural construction landand its influencing factors: A case study of Hubei Province. Geogr. Res. 2014, 32, 132–142. [Google Scholar]
- Qu, Y.; Jiang, G.; Tian, Y.; Shang, R.; Wei, S.; Li, Y. Urban-Rural construction land Transition (URCLT) in Shandong Province of China: Features measurement and mechanism exploration. Habitat Int. 2019, 86, 101–115. [Google Scholar] [CrossRef]
- Zhu, C.; Zhang, X.; Wang, K.; Yuan, S.; Yang, L.; Skitmore, M. Urban-rural construction land transition and its coupling relationship with population flow in China’s urban agglomeration region. Cities 2020, 101, 102701. [Google Scholar] [CrossRef]
- Li, M.; Hao, J.; Chen, L.; Gu, T.; Guan, Q.; Chen, A. Decoupling of urban and rural construction land and population change in China at the prefectural level. Resour. Sci. 2019, 41, 1897–1910. [Google Scholar] [CrossRef]
- Wang, J.; Fang, C.; Li, Y. Spatio-temporal Analysis of Population and Construction Land Change in Urban and Rural China. J. Nat. Resour. 2014, 11, 1271–1281. [Google Scholar]
- Liu, S.; Ye, Y.; Zhong, S. Research on Shift Route of Gravity Center and Decoupling Relationship between Urban Land Expansion and Economic Growth in China. Resour. Environ. Yangtze Basin 2020, 29, 2563–2571. [Google Scholar]
- Dong, G.; Zhang, W.; Xu, X.; Jia, K. Multi-Dimensional Feature Recognition and Policy Implications of Rural Human–Land Relationships in China. Land 2021, 10, 1086. [Google Scholar] [CrossRef]
- Song, W.; Liu, M. Assessment of Decoupling Between Rural Settlement Area and Rural Population in China. Land Use Policy 2014, 39, 331–341. [Google Scholar] [CrossRef]
- Zhang, J.; Wang, Y.; Ge, Y. Evaluating the Relationship Between Urban Population Growth and Land Expansion From a Policymaking Perspective: Ningbo, China. J. Urban Plan. Dev. 2020, 146, 4. [Google Scholar] [CrossRef]
- Qu, Y.; Jiang, G.; Ma, W.; Li, Z. How Does the Rural Settlement Transition Contribute to Shaping Sustainable Rural Development? Evidence From Shandong, China. J. Rural. Stud. 2021, 82, 279–293. [Google Scholar] [CrossRef]
- Cai, E.; Chen, W.; Wei, H.; Li, J.; Wang, H.; Guo, Y.; Feng, X. The Coupling Characteristics of Population and Residential Land in Rural Areas of China and its Implications for Sustainable Land Use. Sustain. Dev. 2020, 28, 646–656. [Google Scholar] [CrossRef]
- Qu, Y.; Jiang, G.; Li, Z.; Tian, Y.; Wei, S. Understanding Rural Land Use Transition and Regional Consolidation Implications in China. Land Use Policy 2019, 82, 742–753. [Google Scholar] [CrossRef]
- Zhu, S.; Kong, X.; Jiang, P. Identification of the human-land relationship involved in the urbanization of rural settlements in Wuhan city circle, China. J. Rural. Stud. 2020, 77, 75–83. [Google Scholar] [CrossRef]
- Li, Y.; Kong, X.; Zhu, Z. Multiscale Analysis of the Correlation Patterns Between the Urban Population and Construction Land in China. Sustain. Cities Soc. 2020, 61, 102326. [Google Scholar] [CrossRef]
- Liu, Y.; Zhou, G.; Liu, D.; Yu, H.; Zhu, L.; Zhang, J. The Interaction of Population, Industry and Land in Process of Urbanization in China: A Case Study in Jilin Province. Chin. Geogr. Sci. 2018, 28, 529–542. [Google Scholar] [CrossRef] [Green Version]
- Jin, D.; Dai, L. Temporal and Spatial Characteristics and Driving Factors of Coordinated Development between Population Urbanization and Land Urbanization in China. China Land Sci. 2021, 35, 74–84. [Google Scholar]
- Zhong, T.; Huang, X.; Baiyuan, W. On the Degrees of Decoupling and Recoupling of Economic Growth and Expansion of Construction Land in China from 2002 to 2007. J. Nat. Resour. 2010, 25, 18–31. [Google Scholar]
- Tapio, P. Towards a theory of decoupling: Degrees of decoupling in the EU and the case of road traffic in Finland between 1970 and 2001. Transp. Policy 2005, 12, 137–151. [Google Scholar] [CrossRef] [Green Version]
- Cai, E.; Liu, Y.; Li, J.; Chen, W. Spatiotemporal Characteristics of Urban-Rural Construction Land Transition and Rural-Urban Migrants in Rapid-Urbanization Areas of Central China. J. Urban Plan. Dev. 2020, 146, 05019023. [Google Scholar] [CrossRef]
- Wang, C.; Liu, Y.; Kong, X.; Li, J. Spatiotemporal Decoupling between Population and Construction Land in Urban and Rural Hubei Province. Sustainability 2017, 9, 1258. [Google Scholar] [CrossRef] [Green Version]
- Cai, F.; Pu, L.; Zhu, M. Assessment Framework and Decision-Support System for Consolidating Urban-Rural Construction Land in Coastal China. Sustainability 2014, 6, 7689–7709. [Google Scholar] [CrossRef] [Green Version]
- Liu, Y.; Cai, E.; Jing, Y.; Gong, J.; Wang, Z. Analyzing the Decoupling between Rural-to-Urban Migrants and Urban Land Expansion in Hubei Province, China. Sustainability 2018, 10, 345. [Google Scholar] [CrossRef] [Green Version]
- Li, Z.; Luan, W.; Zhang, Z.; Su, M. Relationship between urban construction land expansion and population/economic growth in Liaoning Province, China. Land Use Policy 2020, 99, 105022. [Google Scholar] [CrossRef]
- Wang, X.; Gao, C.; Song, C.; Chen, X.; Wang, C. Decoupling Analysis between Urban Land Expansion and Economic Growth at the Different Scale: A Case Study of Shandong Province in China. Econ. Geogr. 2021, 41, 97–104. [Google Scholar]
- Huang, M.; Yue, W.; He, X. Decoupling Relationship between Urban Expansion and Economic Growth and Its Spatial Heterogeneity in the Yangtze Economic Belt. J. Nat. Resour. 2018, 33, 219–232. [Google Scholar]
- Shi, M.; Xie, Y.; Cao, Q. Spatiotemporal Changes in Rural Settlement Land and Rural Population in the Middle Basin of the Heihe River, China. Sustainability 2016, 8, 614. [Google Scholar] [CrossRef] [Green Version]
- Shi, L.; Wang, Y. Evolution Characteristics and Driving Factors of Negative Decoupled Rural Residential Land and Resident Population in the Yellow River Basin. Land Use Policy 2021, 109, 105685. [Google Scholar] [CrossRef]
- Zhang, X.; Wang, J.; Song, W.; Wang, F.; Gao, X.; Liu, L.; Dong, K.; Yang, D. Decoupling Analysis between Rural Population Change and Rural Construction Land Changes in China. Land 2022, 11, 231. [Google Scholar] [CrossRef]
- Northam, R.M. Urban Geography; John Wiley & Sons: New York, NY, USA, 1979; pp. 65–67. [Google Scholar]
- Karmeshu. Demographic Models of Urbanization. Environ. Plan. B Plan. Des. 1988, 15, 47–54. [Google Scholar] [CrossRef]


Publisher’s Note: MDPI stays neutral with regard to jurisdictional claims in published maps and institutional affiliations. |
© 2022 by the authors. Licensee MDPI, Basel, Switzerland. This article is an open access article distributed under the terms and conditions of the Creative Commons Attribution (CC BY) license (https://creativecommons.org/licenses/by/4.0/).