1. Introduction
The increasingly serious greenhouse effect has become the most pressing global environmental problem [
1,
2], and the main cause of the greenhouse effect is the large amount of carbon dioxide emissions. At present, China is the world’s largest carbon emitter, accounting for 35.6% of global greenhouse gas emissions [
3]. With the speedy development of China’s economy, agricultural modernization, the rapid development of chemical agriculture, petroleum agriculture, and mechanical agriculture, China’s total grain production continues to improve. Meanwhile, China’s carbon emissions from agriculture are also growing significantly [
4]. China’s crop production accounts for more than 50% of full agricultural output, making it the main component of agriculture. Wheat, corn, and rice account for more than half of the planting space of food crops [
5]. However, within the methods of grain production in China, the costs of resources and of environmental impacts are too high. In the past 30 years, the total grain output has increased by 90%, but fertilizer consumption and greenhouse gas emissions have increased by 180% and 103%, respectively [
6,
7].
An appropriate scale-up of agricultural land is the only way to develop modern agriculture [
8], which will promote cultivated productivity, ensure food safety, increase peasants’ incomes, and advance rural maintenance. Large-scale farmers have much more potential to assume maintainable farming practices. However, some scholars [
9,
10,
11] believe that the environmental pollution caused by large-scale agricultural production, especially in the use of agricultural chemicals and energy, will be magnified due to the limitations of farmers’ educational levels and scientific farming technical abilities. Moreover, this will ultimately aggravate the emission of carbon dioxide and thus accelerate deterioration of the ecological environment.
In recent years, agricultural carbon emissions have received extensive attention [
12]. Previous studies have primarily targeted the effects that influence agricultural carbon emissions, in addition to agricultural production categories [
13,
14], technology progress [
15,
16], and farmers’ costs and income [
17,
18]. The results showed that research and development (R&D) events can cut carbon emissions through refining agricultural production technology [
19]. Additionally, resources for R&D activities are very important in increasing the amount of advanced agricultural production technology, ultimately reducing carbon emissions [
20]. Other studies have proven that R&D support can effectively enhance the potency of agricultural production, thereby dropping its carbon emissions [
21,
22]. Ma et al. [
23] indicated that population, affluence, and technology constitute the biggest impacts on CO
2 emissions. Other studies have considered whether demographic structure can also affect agricultural CO
2 emissions. For example, Li and Zhou [
24] explored the effect of a series of demographic structural influences on agricultural CO
2 emissions, concluding that average house size, and therefore the dependency magnitude relation, place negative impacts on agricultural CO
2 emissions. Based on the spatial political economy model, Liao et al. [
25] investigated the CO
2 emissions of entirely different crops planted in the Kingdom of Sweden’s agriculture sector.
As agriculture is the dominant sector in China and, albeit conjointly, the first driver of environmental degradation, the scale of cultivated land takes center stage in environmental protection debates [
26,
27]. In this respect, studies have shown that the relations of different farm sizes in nearly all aspects, such as efficiency of agricultural production, use of pesticides and fertilizers [
28], employment, and income, are highly relevant. With an increase in the scale of planting, a scale economy effect will be reached. Economies of scale are inherently associated with capital-intensive technological development: with the increasing number of foreign technological inventions, each unit of land can scale up production productivity and labor utilization, and thereby reduce input costs [
29] in the meantime. That is to say, the larger the land occupied, the smaller the carbon footprint per unit of land. In order to realize economies of scale, China has introduced a number of policies, such as the No. One Documents, and a series of different agricultural policy documents in 2013 and 2014, whose goals are to market various kinds of large-scale farming [
30]. In particular, the “separating three property rights” policy broadcasted in 2014 separated the possession, constricting, and management rights of farmland [
31,
32], and this further helped farmers achieve large-scale units [
32]. However, some scholars say that compared with small-scale management, large-scale planting cannot protect the ecological environment. Wiggins et al. [
33] argued that a converse relationship between land area and efficiency exists, owing to diseconomies of scale, as well as an absence of economies of scale in agriculture. Knickel et al. [
34] and Ashkenazy et al. [
35] also questioned whether large-scale farming supports sustainable agriculture. Accordingly, it is significant to explore the relationship between the scale of cultivated land management and agricultural environmental pollution.
The existing research results mainly discuss the impact of agricultural economic development level, production efficiency, structural factors, and labor scale on agricultural carbon emissions [
17,
23]; however, little consideration is given to reducing carbon emissions by adjusting the scale of land. The mode of agricultural production under large-scale management is bound to be very different from that of small-scale peasants. The massive transfer of labor toward non-agricultural sectors, and the outflow of cultivated land have resulted in changes in the scale of agricultural land management [
24]. These changes led to the recombination and adjustment of production factors, which will inevitably have a significant influence on future agricultural carbon emissions [
29]. Meanwhile, whether or not expanding the planting area can reduce carbon emissions is still controversial. In addition, most of the existing studies carried out research on farmers in specific areas through micro-surveys [
33,
35]. These data obtained are cross-sectional, which can not reveal underlying macro laws; furthermore, less consideration is given to the continuous changes of agricultural factor input and carbon emissions in time.
Therefore, the innovation of this paper is mainly reflected in two aspects. Firstly, based on an analysis of the impact mechanism of land scale on carbon emissions, this paper tested the threshold effect of land scale on the carbon emissions from the planting industry. Secondly, different crops have different effects on carbon emissions as a result of their planting areas, input of production factors, and farming systems. Therefore, taking the three major grains in China (corn, wheat, and rice) as an example, this paper further discusses whether there are differences between these crops in the relationship between planting scale and carbon emission.
The remainder of this paper is organized as follows:
Section 2 outlines the theoretical frameworks;
Section 3 describes the methodology and data;
Section 4 presents the results and discussion; and
Section 5 finishes with conclusions and policy implications.
2. Theoretical Framework
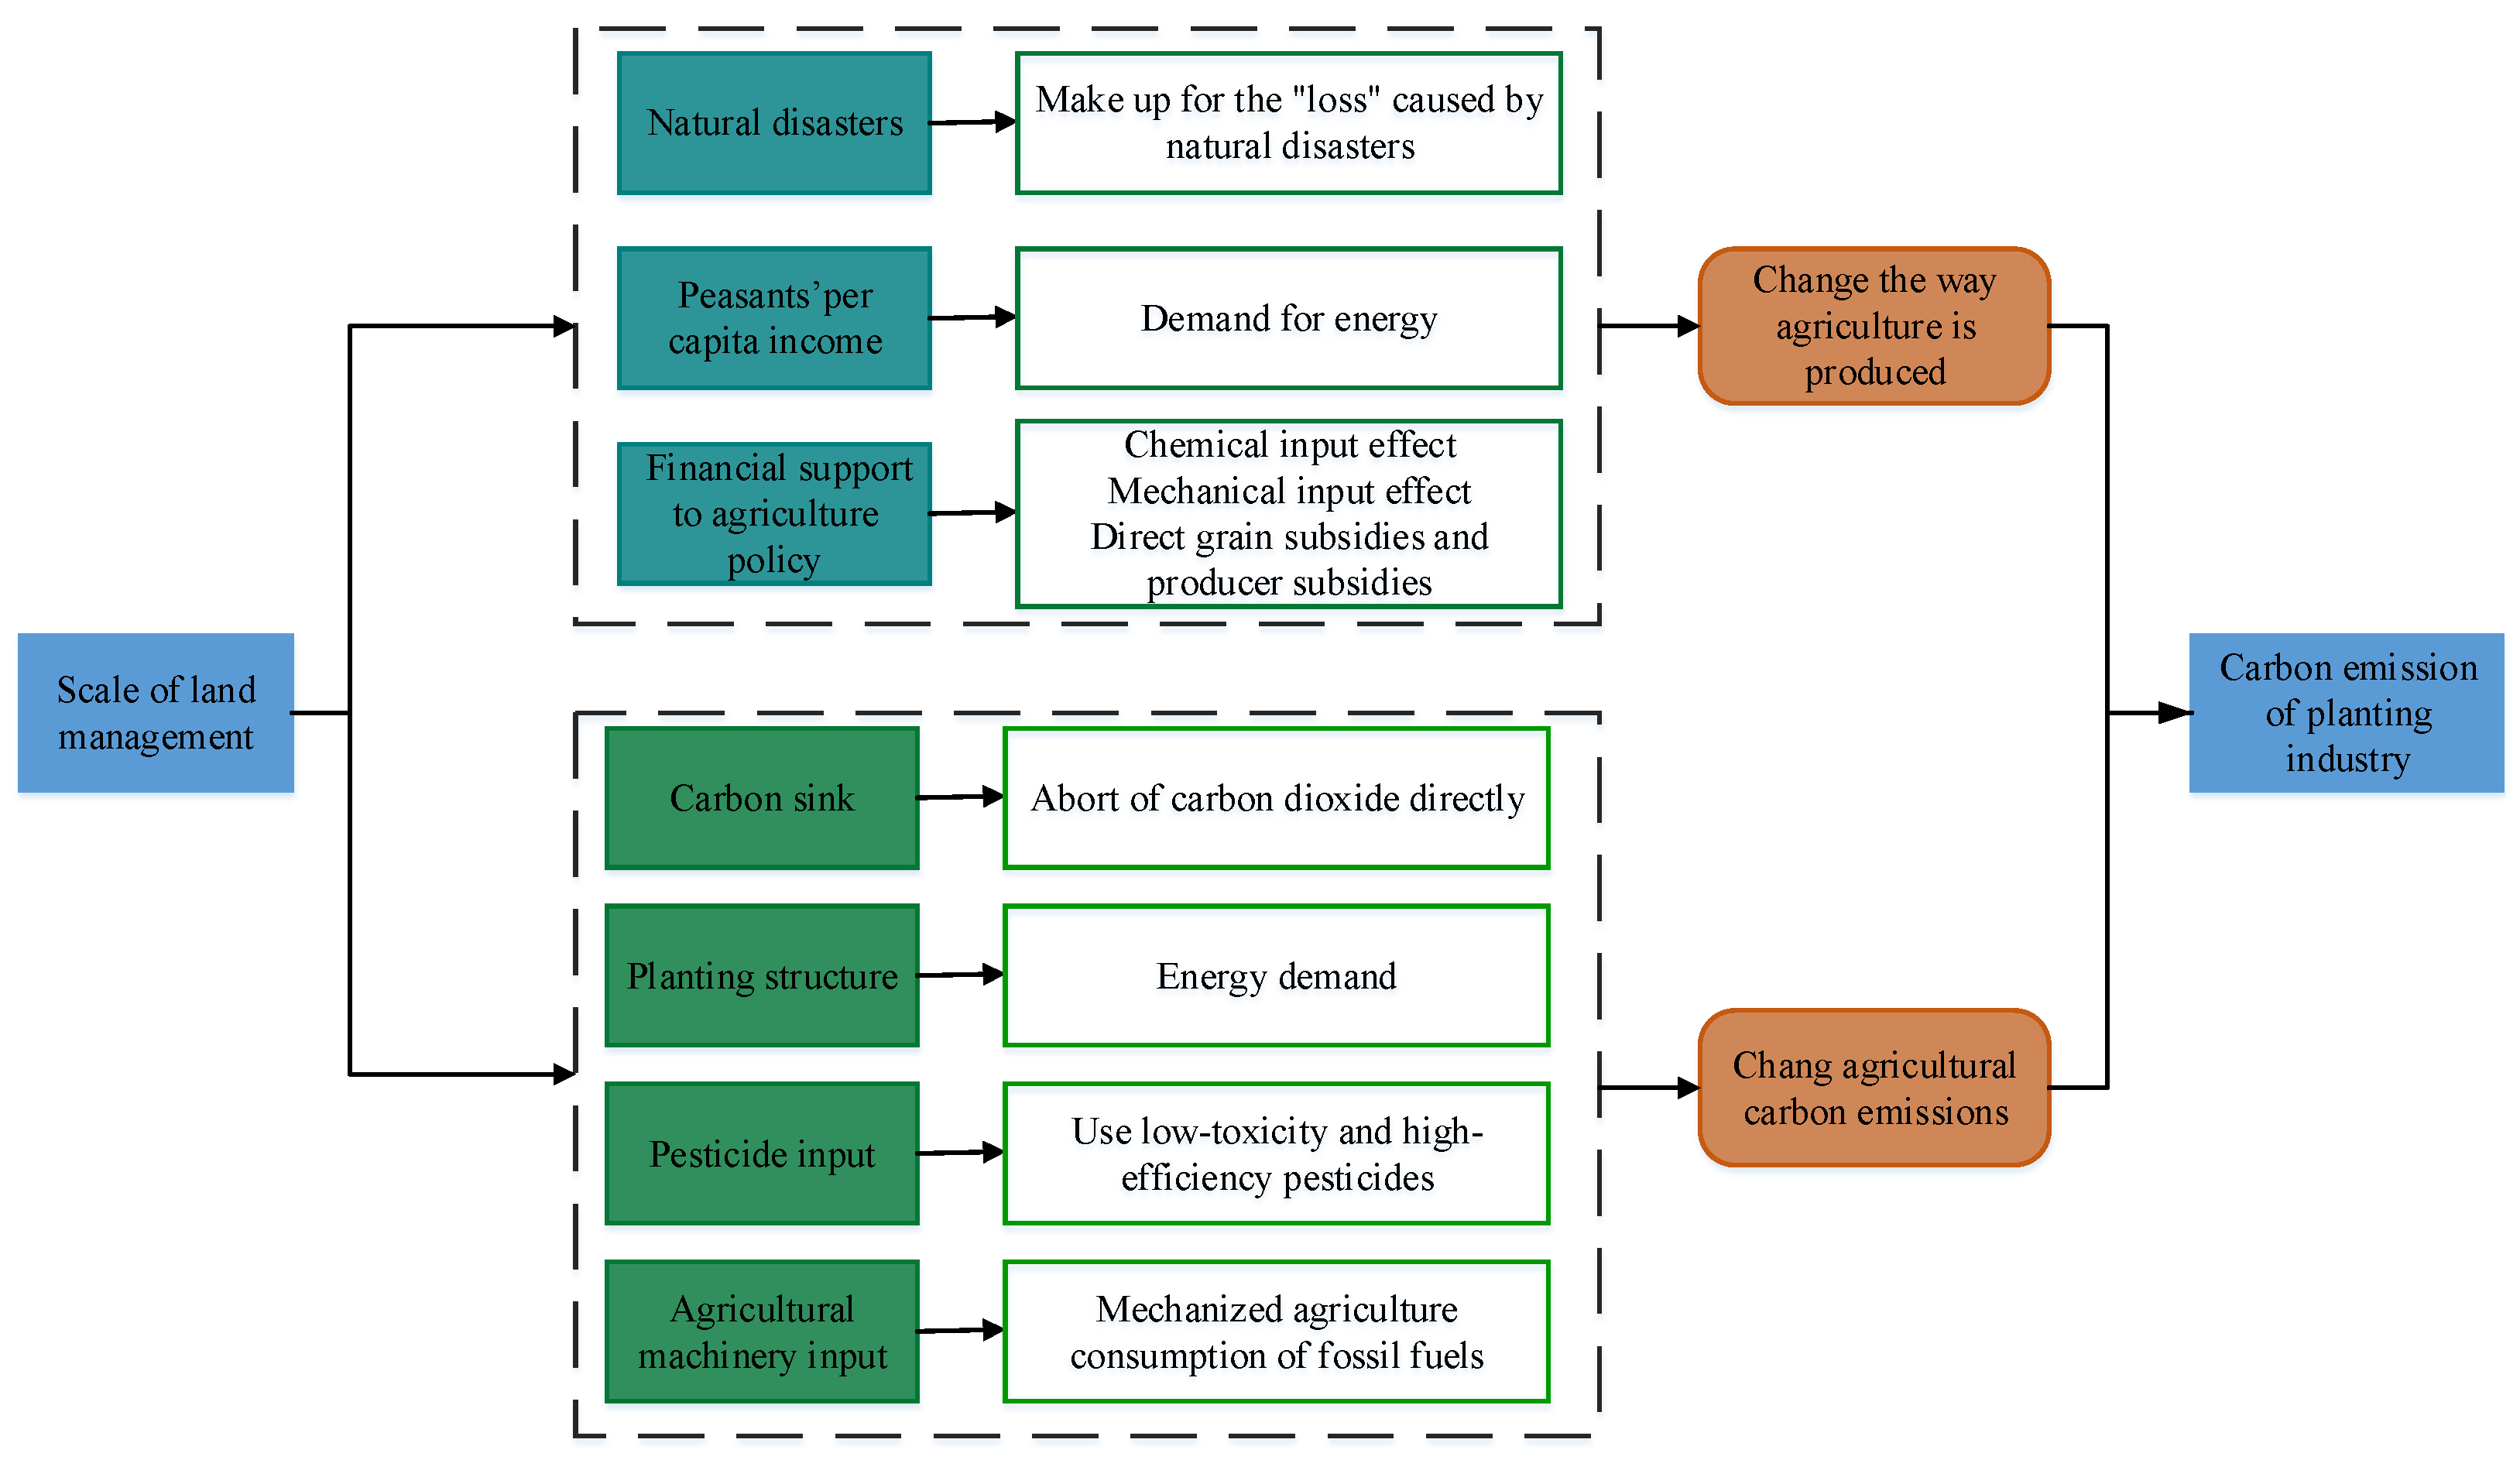
Figure 1 depicts the theoretical framework. In theory, the scale of land management can affect agricultural carbon emissions through indirect paths such as natural disasters [
36], fiscal support for agriculture, farmers’ per capita income [
37], planting structure, pesticide input [
38], and agricultural machinery input [
39]. When encountering the same natural disaster, the larger the scale of land management, the larger the affected area of agriculture and the greater the reduction in yield, which will cause a greater distinction between the anticipated agricultural yield and the real yield. In order to make up for the “loss” caused by natural disasters, farmers with larger land management scales are more likely to change their original farming methods, thereby affecting agricultural carbon emissions. In terms of fiscal support for agriculture, farmers with a larger land management scale pay more attention to maintaining the land for sustainable use. Therefore, subsidies for soil-testing formula fertilizers and for slow and controlled-release fertilizers can be used to reduce the amount of chemical input and increase use efficiency. Subsidies are more conducive to the use of less toxic and less harmful agrochemicals, thereby reducing carbon emissions. Moreover, for farmers with a larger business scale, a purchase subsidy for agricultural machinery can significantly increase the investment intensity of their machinery and equipment, promote the consumption of fossil fuels and increase carbon emissions. Finally, an increase in the direct grain and producer subsidies obtained by farmers with a large planting scale can significantly enhance the enthusiasm of farmers to grow grain, in turn increasing the area of grain planting and thereby promote a relative reduction in the carbon emissions of planting. For peasants with a larger land management scale, an increase in their per capita income can lead to a greater energy demand for agricultural production. At the same time, peasants’ demand for electricity, natural gas, and other energy sources involved in production and living will also increase. Under the inflexible conditions that the energy consumption of the whole society is subjugated by carbon-based energy, agricultural carbon emissions will also increase. Different crops use different amounts of agricultural chemicals, such as pesticides and fertilizers, due to their different growth characteristics. Studies have shown that food crops emit less carbon than cash crops. Therefore, as the proportion of the food crop operation scale increases, carbon emissions relatively decrease. Peasants with larger management scales are more inclined to adopt new technologies such as efficient fertilization, which increases the efficiency of chemical input requirements and reduces environmental pollution and carbon emissions. The scale of land management affects the input intensity of agricultural machinery, which conversely affects agricultural carbon emissions. With an increase in the scale of land management, the level of mechanization will continue to increase, thereby accelerating the consumption of energy such as petroleum fuels, which in turn will increase carbon emissions. In summation, the use of agricultural machinery is conducive to improving agricultural production efficiency and reducing carbon emissions relatively.
3. Methodology and Data
3.1. Calculation Method of Planting Carbon Emissions
Based on the research results of many scholars, this paper determined the planting carbon emissions from the following two aspects: The first aspect is the carbon emissions from the input of production factors. Based on the research results of existing scholars, the carbon sources of planting production were classified into five categories in this paper: agricultural fertilizer, diesel oil, pesticide, plastic film, and irrigation. Planting carbon emissions include those from the use of agricultural fertilizers, diesel pesticides, and plastic film, and from the use of machinery and electricity for agricultural irrigation. Taking into consideration that tillage does not apply to all food crops, carbon emissions from tillage are not accounted for. The second aspect is the carbon emissions from growing wheat, corn, and rice, which produce nitrous oxide and methane gas. Methane emissions from rice cultivation have been incorporated into the planting carbon emission measurement system. Wheat, corn, and rice are the three major grain crops in China, and they are of equal importance in agricultural production. Meanwhile, because the growth habits of the three grain crops are quite different, they produce different types of greenhouse gases as they grow. Therefore, this paper divided the three major grain crops into spring wheat, winter wheat, corn, upland rice, medium rice, and double-cropping late rice, and considered the nitrous oxide and methane gas produced by them in the planting carbon emission measurement system. When adding up the planting carbon emissions, replace C, Methane (CH
4), and N
2O into standard C. The replacement criterion used was as follows: the greenhouse effect induced by 1 t of nitrous oxide (N
2O) is equivalent to that induced by 81.2727 t of C (2.98 million t CO
2), and that induced by 1 t of methane (CH
4) is equivalent to that induced by 6.8182 t of C (25t CO
2). Planting carbon emissions can be measured in the following way:
where
is the total carbon emissions of the three food crops in year
, 10
4 t;
represents the amount of carbon emission sources;
represents the type of carbon sources; and
represents the carbon emission coefficient of each source.
The carbon emission coefficients for each factor of production are shown in
Table 1, and the gas emission types and corresponding emission factors for each food crop are shown in
Table 2.
3.2. Panel Threshold Regression Model
This article used the method of Gonzalez et al. [
41] to establish the panel threshold regression model created by Tong, which is often used to divide the interval endogenously and find the threshold value according to the characteristics of the data itself. Thus, this approach can effectively avoid the bias caused by artificially dividing the sample interval, or by using the quadratic term model. The outstanding advantage of this model is its ability to automatically identify the sample data, in order to estimate the specific threshold number and value, and to perform a significant test of the threshold effect. In threshold research, the existing academic achievements mostly use the grouping test and the cross-item test model. The grouping test sets the dividing point through subjective experience, and the cross-item test is limited by the uncertainty of the form of the cross-item; neither approach can implement a significance test for the threshold effect. The threshold regression model can overcome the shortcomings of the above two methods, and can also complete a significance test while accurately estimating the threshold value [
42]. Specifically, there are four advantages to this model. Firstly, it is not required to establish nonlinear equations in order to represent the relationships between variables. Secondly, the sample data decide the value and the amount of the threshold completely. Thirdly, it can calculate the boldness interval of those parameters with an asymptotic distribution theorem. Fourthly, the statistical significance of the thresholds can be estimated using the bootstrap method [
43].
The process of estimating the panel threshold regression model is as follows: First, a value of the threshold variable is arbitrarily selected as the threshold value, the data are divided into two intervals, and the parameter values of the two intervals are estimated by the least square method. Then, the total residual of the square of the two interval parameters is calculated. Then, different thresholds are continuously and repeatedly selected, and the residual sum of squares corresponding to the threshold sum is recorded. Finally, the residual sum of squares is compared. Based on this study, the processes are as follows:
First, a panel threshold model is established in order to check the nonlinear effect of the scale of agricultural land on agricultural carbon emissions. The basic model is as follows:
Based on Formula (2), it is initially assumed that there is a single-threshold effect to find a single-threshold model (3); this can then be extended to a double-threshold model (4).
In the above equation, is the explained variable; is the controlled variable; is the core explanatory variable; is the threshold variable; is the threshold value; and is the indicator function. Next, the dummy variable is set as , when ; otherwise, . The variables are the influence coefficients of the explanatory variables on the explained variables when the threshold variables are in different threshold intervals. The variable represents constant terms; and refers to the random error terms.
For a given threshold
, the assessed value β of
and the corresponding residual sum of squares can be obtained after estimating the following model:
The variable corresponds to the least residual total of squares; is the optimum threshold. When deciding the calculable threshold value, the corresponding parameter values of the model are determined. When deciding the parameter values, the threshold effect is additionally tested in order to assess the importance of the threshold effect, and the genuineness of the threshold estimated value.
In order to test the importance of the threshold effect, the hypothesis of the model test is
, and the following LM statistics are created to test the null hypothesis:
In this expression, and are the null hypothesis and the residual total of squares below the condition of the threshold influence, respectively, and is the variance of the threshold regression residuals. As the threshold value is not identifiable below the null hypothesis, does not follow the standard asymptotic distribution, and the crucial worth cannot be obtained.
Then, the genuineness of the threshold estimation is tested, for which the matching null hypothesis is
. The precise figures are as follows:
where
is the unrestrained residual number of squares. At the
level of notable,
After the first threshold is obtained, the existence of two and three thresholds is sequentially verified until the null hypothesis is accepted. Then, the final threshold is determined. On the premise of the current research results of the model, and on the assumption of the existence of threshold effects, the following threshold regression models were constructed to study the impact of the single- and double-threshold effects of cultivated land area on agricultural carbon emissions. The specific models are presented in Equations (9) and (10):
In these expressions, is the explained variable, on behalf of the agricultural carbon emissions of province i in year t; is the explanatory variable, on behalf of the area of cultivated land of country i in year t; includes carbon sink, natural disasters, fiscal policy of supporting agriculture, and per capita income of farmers; is the threshold variable, representing the threshold value of different levels; is the coefficient of the control variable; represent the coefficients of the core explanatory variables in different intervals; is the indicator function; is the constant term; and is the random error term.
3.3. Data Sources
This study used data from 30 provinces in mainland China, excluding Tibet, from 2003 to 2018. The net output of agricultural chemical fertilizers, the use of agricultural diesel, the use of agricultural chemicals, the use of agricultural plastic film, the sown area, and the output of various food crops, were all obtained from China Rural Statistical Yearbooks [
44]. The carbon emissions caused by irrigation were calculated from the irrigated area of arable land, and the data came from the China Water Conservancy Statistical Yearbook [
45]. The population figures were obtained from China Statistical Yearbooks [
46] at the end of the year. The annual gross agricultural production value of each province came from the China Agricultural Yearbook [
47]. For the missing data in the data collection process, the mean value method was used for supplementation.
Based on the net yield of agricultural chemical fertilizers, the use of agricultural diesel oil, the use of agricultural chemicals, and the use of agricultural plastic film, all of the data were the sum of the actual use of all crops in each province and region in the same year. The data of irrigated area of cultivated land represented the total irrigated area of all crops in each province and region in the current year. As there were no data on sub-crops, this article referred to former scholars regarding the output value of the planting industry as 50% of the output value of agriculture, and the input quantity and irrigation area of the three major grain crops as half of the total input quantity and irrigation area of agricultural materials in each province.
5. Conclusions and Policy Implications
Based on the data of 30 provinces in China from 2003 to 2018 in this study, we used a threshold model to quantitatively study the impact of planting scale on agricultural carbon emissions. Then, taking the main rice-, wheat-, and corn-producing areas as examples, we further explored the impact of the scale of planting land on agricultural carbon emissions. The conclusions that can be drawn are that, firstly, the distribution of carbon emissions from the planting industry shows a decreasing trend from southwest to northwest, and that the national carbon emissions from the planting industry also decrease. Secondly, the threshold value of planting scale on agricultural carbon emissions is 2.444, the threshold effect is 99%.; it has an inverted “U” shape. Thirdly, a threshold effect of farmland management scale on agricultural carbon emissions exists in the main rice- and wheat-producing areas, and there is a double-threshold effect in the main rice-producing areas, but not in the main corn-producing areas. Fourthly, the fiscal policy of supporting agriculture positively affects agricultural carbon emissions.
Based on the above findings, this study has the following implications:
- (1)
The government should establish a unified carbon accounting system, in order to monitor the scale of planting land and agricultural carbon emissions in all provinces, so as to maximize the ecological effect of planting land. In terms of carbon emissions reduction, we can establish files on the basic situation of farmers’ agricultural production and operation, calculate and formulate standards of use for pesticides, chemical fertilizers, and plastic film by farmers, and formulate reward and punishment measures, in order to achieve the effect of carbon emissions reduction. It is suggested to reduce the redundancy of agricultural production resources, promote the rational utilization of agricultural factor resources, and protect the rural ecological environment.
- (2)
Continuously expanding the scale of agricultural land management is conducive to reducing agricultural carbon emissions. We should constantly improve China’s land transfer system, further clarify the property rights of agricultural land, issue policy documents and measures to promote and reward the legal transfer of agricultural land, and guide various forms of large-scale transfer. In particular, the main rice- and corn-producing areas should speed up large-scale operation in order to reach the inflection point of the inverted “U” shape as soon as possible. For the main wheat-producing areas, the planting scale does not have an inverted “U”-shaped impact on agricultural carbon emissions, but continuously promotes an increase in carbon emissions. Therefore, the planting area of wheat-producing areas should be reasonably planned to control carbon emissions.
- (3)
The government should increase investment in scientific research and encourage scientific research in institutes, agricultural colleges, and enterprises, in order to carry out research and development of low-carbon production technologies related to grain production. At the same time, enterprises and scientific research institutions should be supported to establish scientific research teams, in order to provide technical support for agricultural carbon emission reduction.
This paper only analyzes the impact mechanism of land scale on planting carbon emissions from a macro perspective. In the future, farmers’ level data can be further used to study the impact path of agricultural land management scale on agricultural carbon emissions, in order to verify the robustness of these conclusions.


