
History of Land Cover Change on Santa Cruz Island, Galapagos


Abstract
:1. Introduction
2. Methods
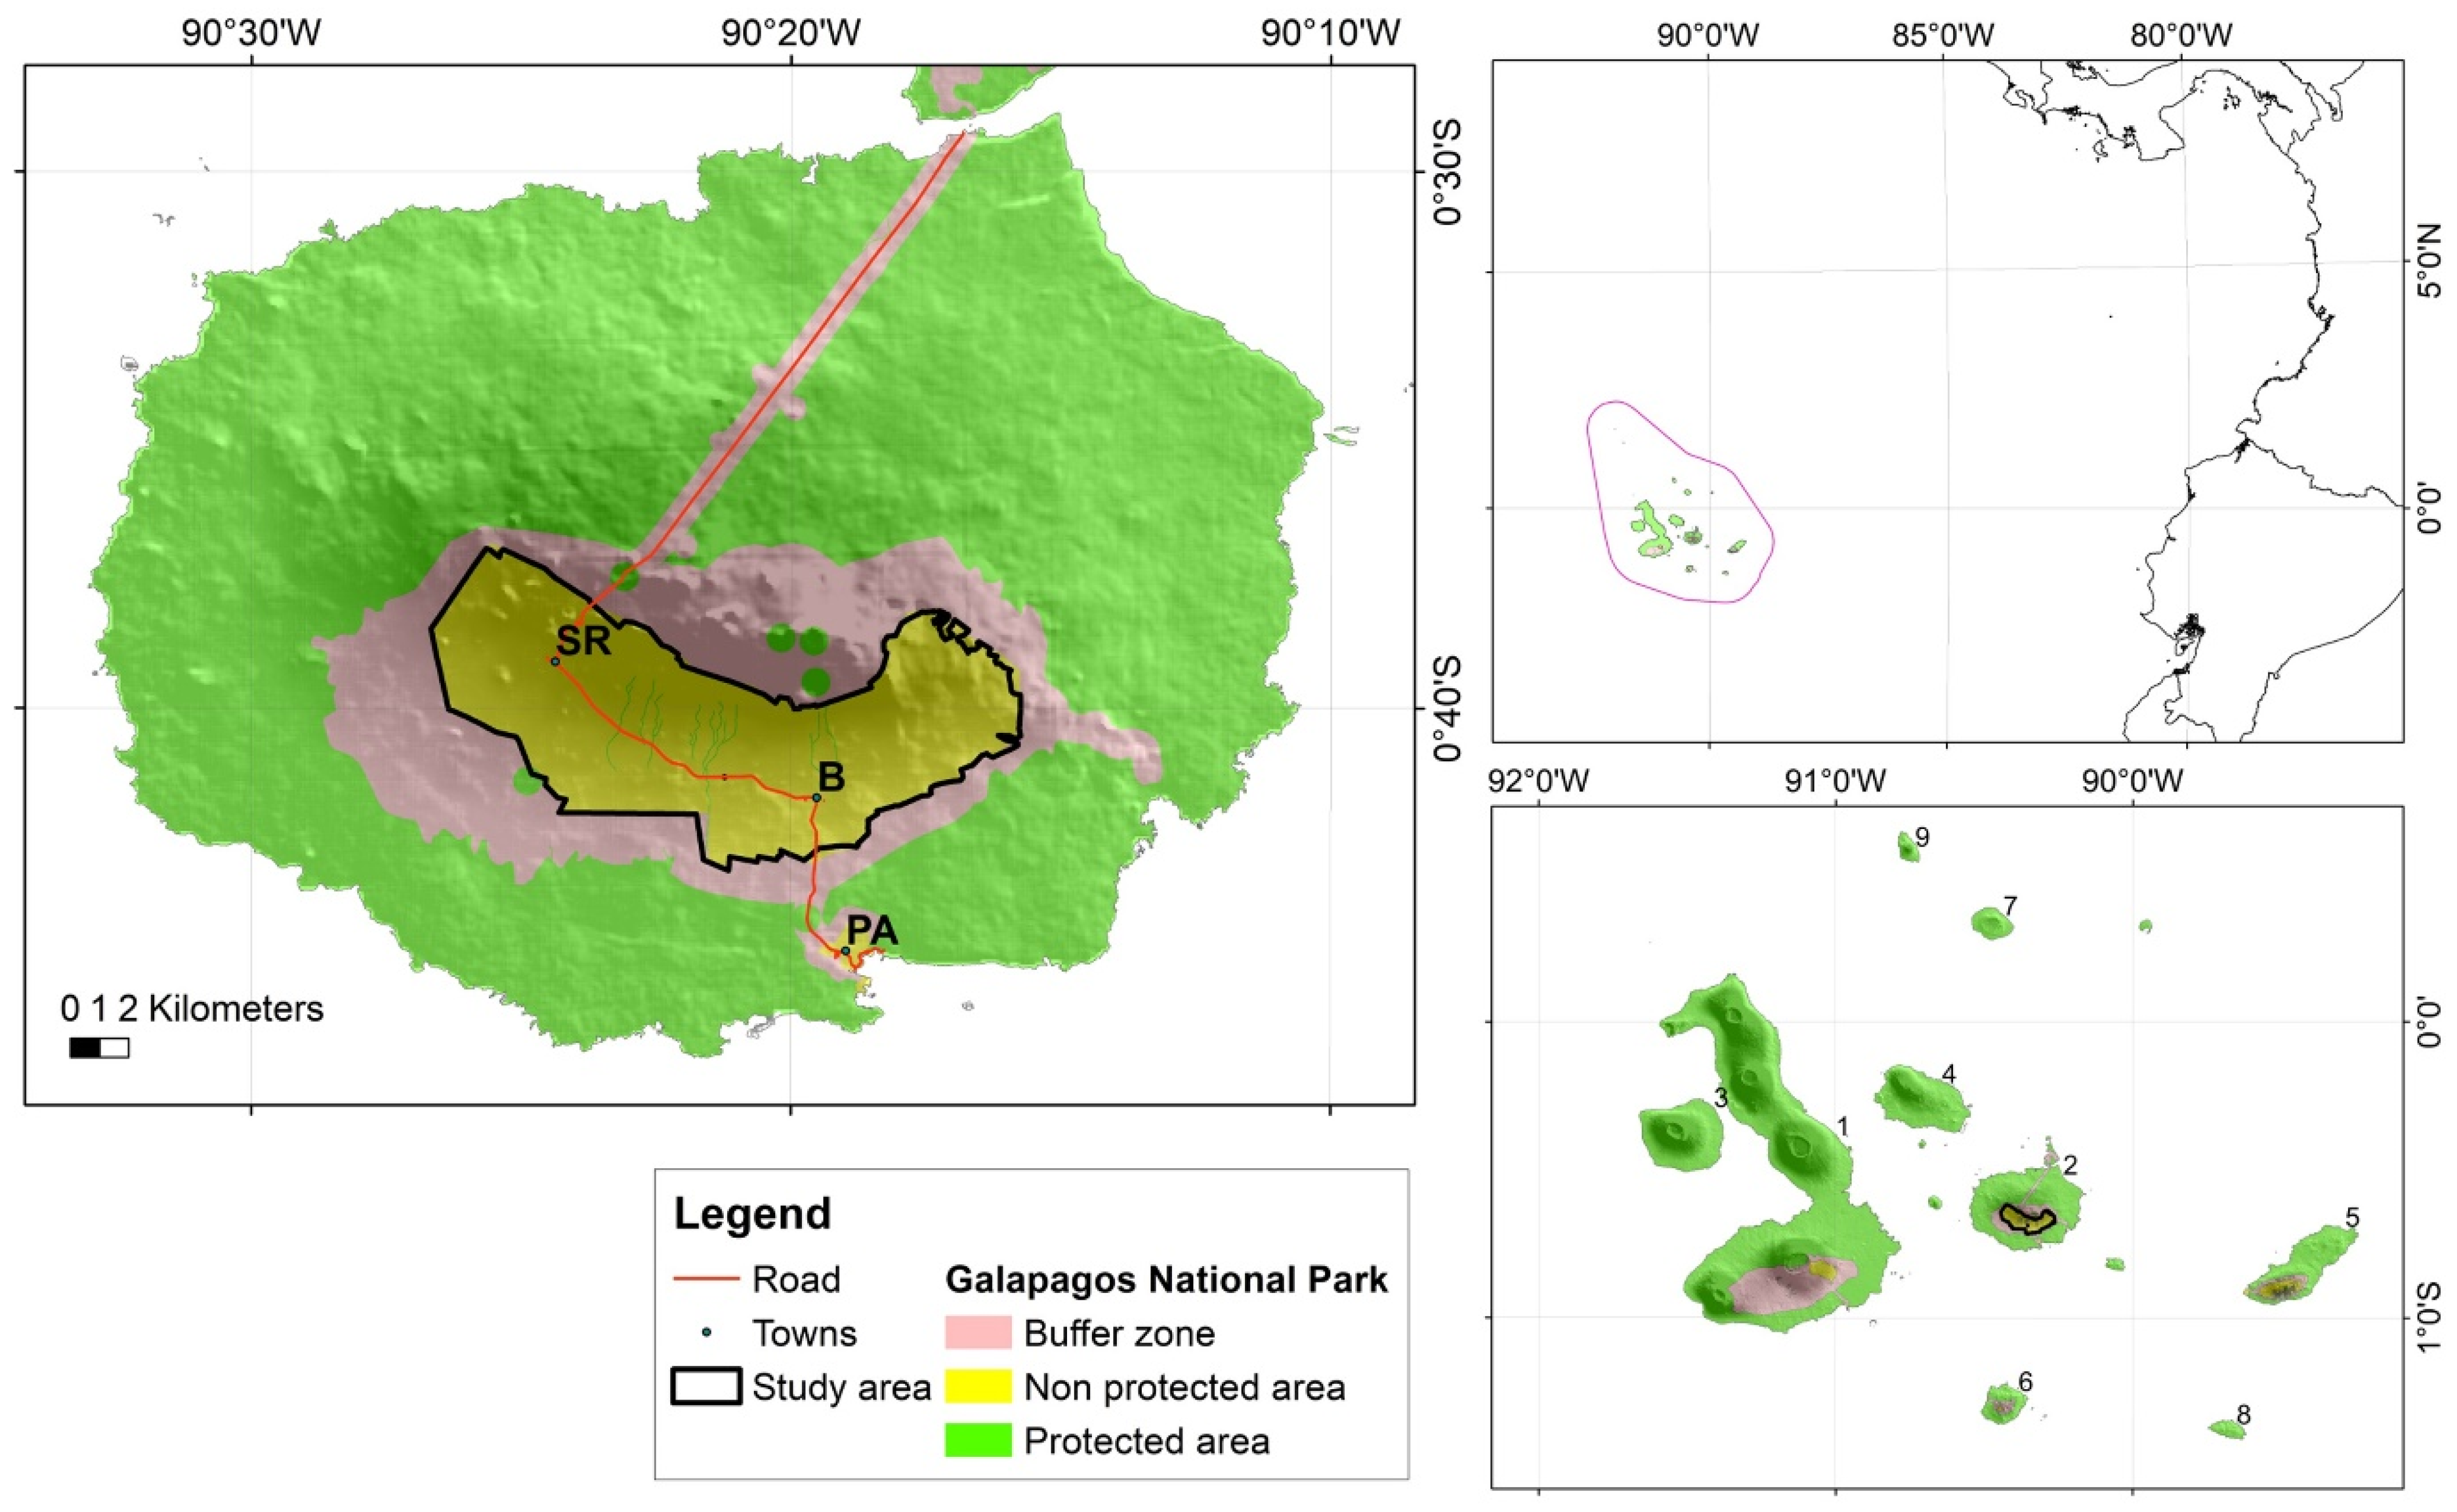
2.1. Study Area
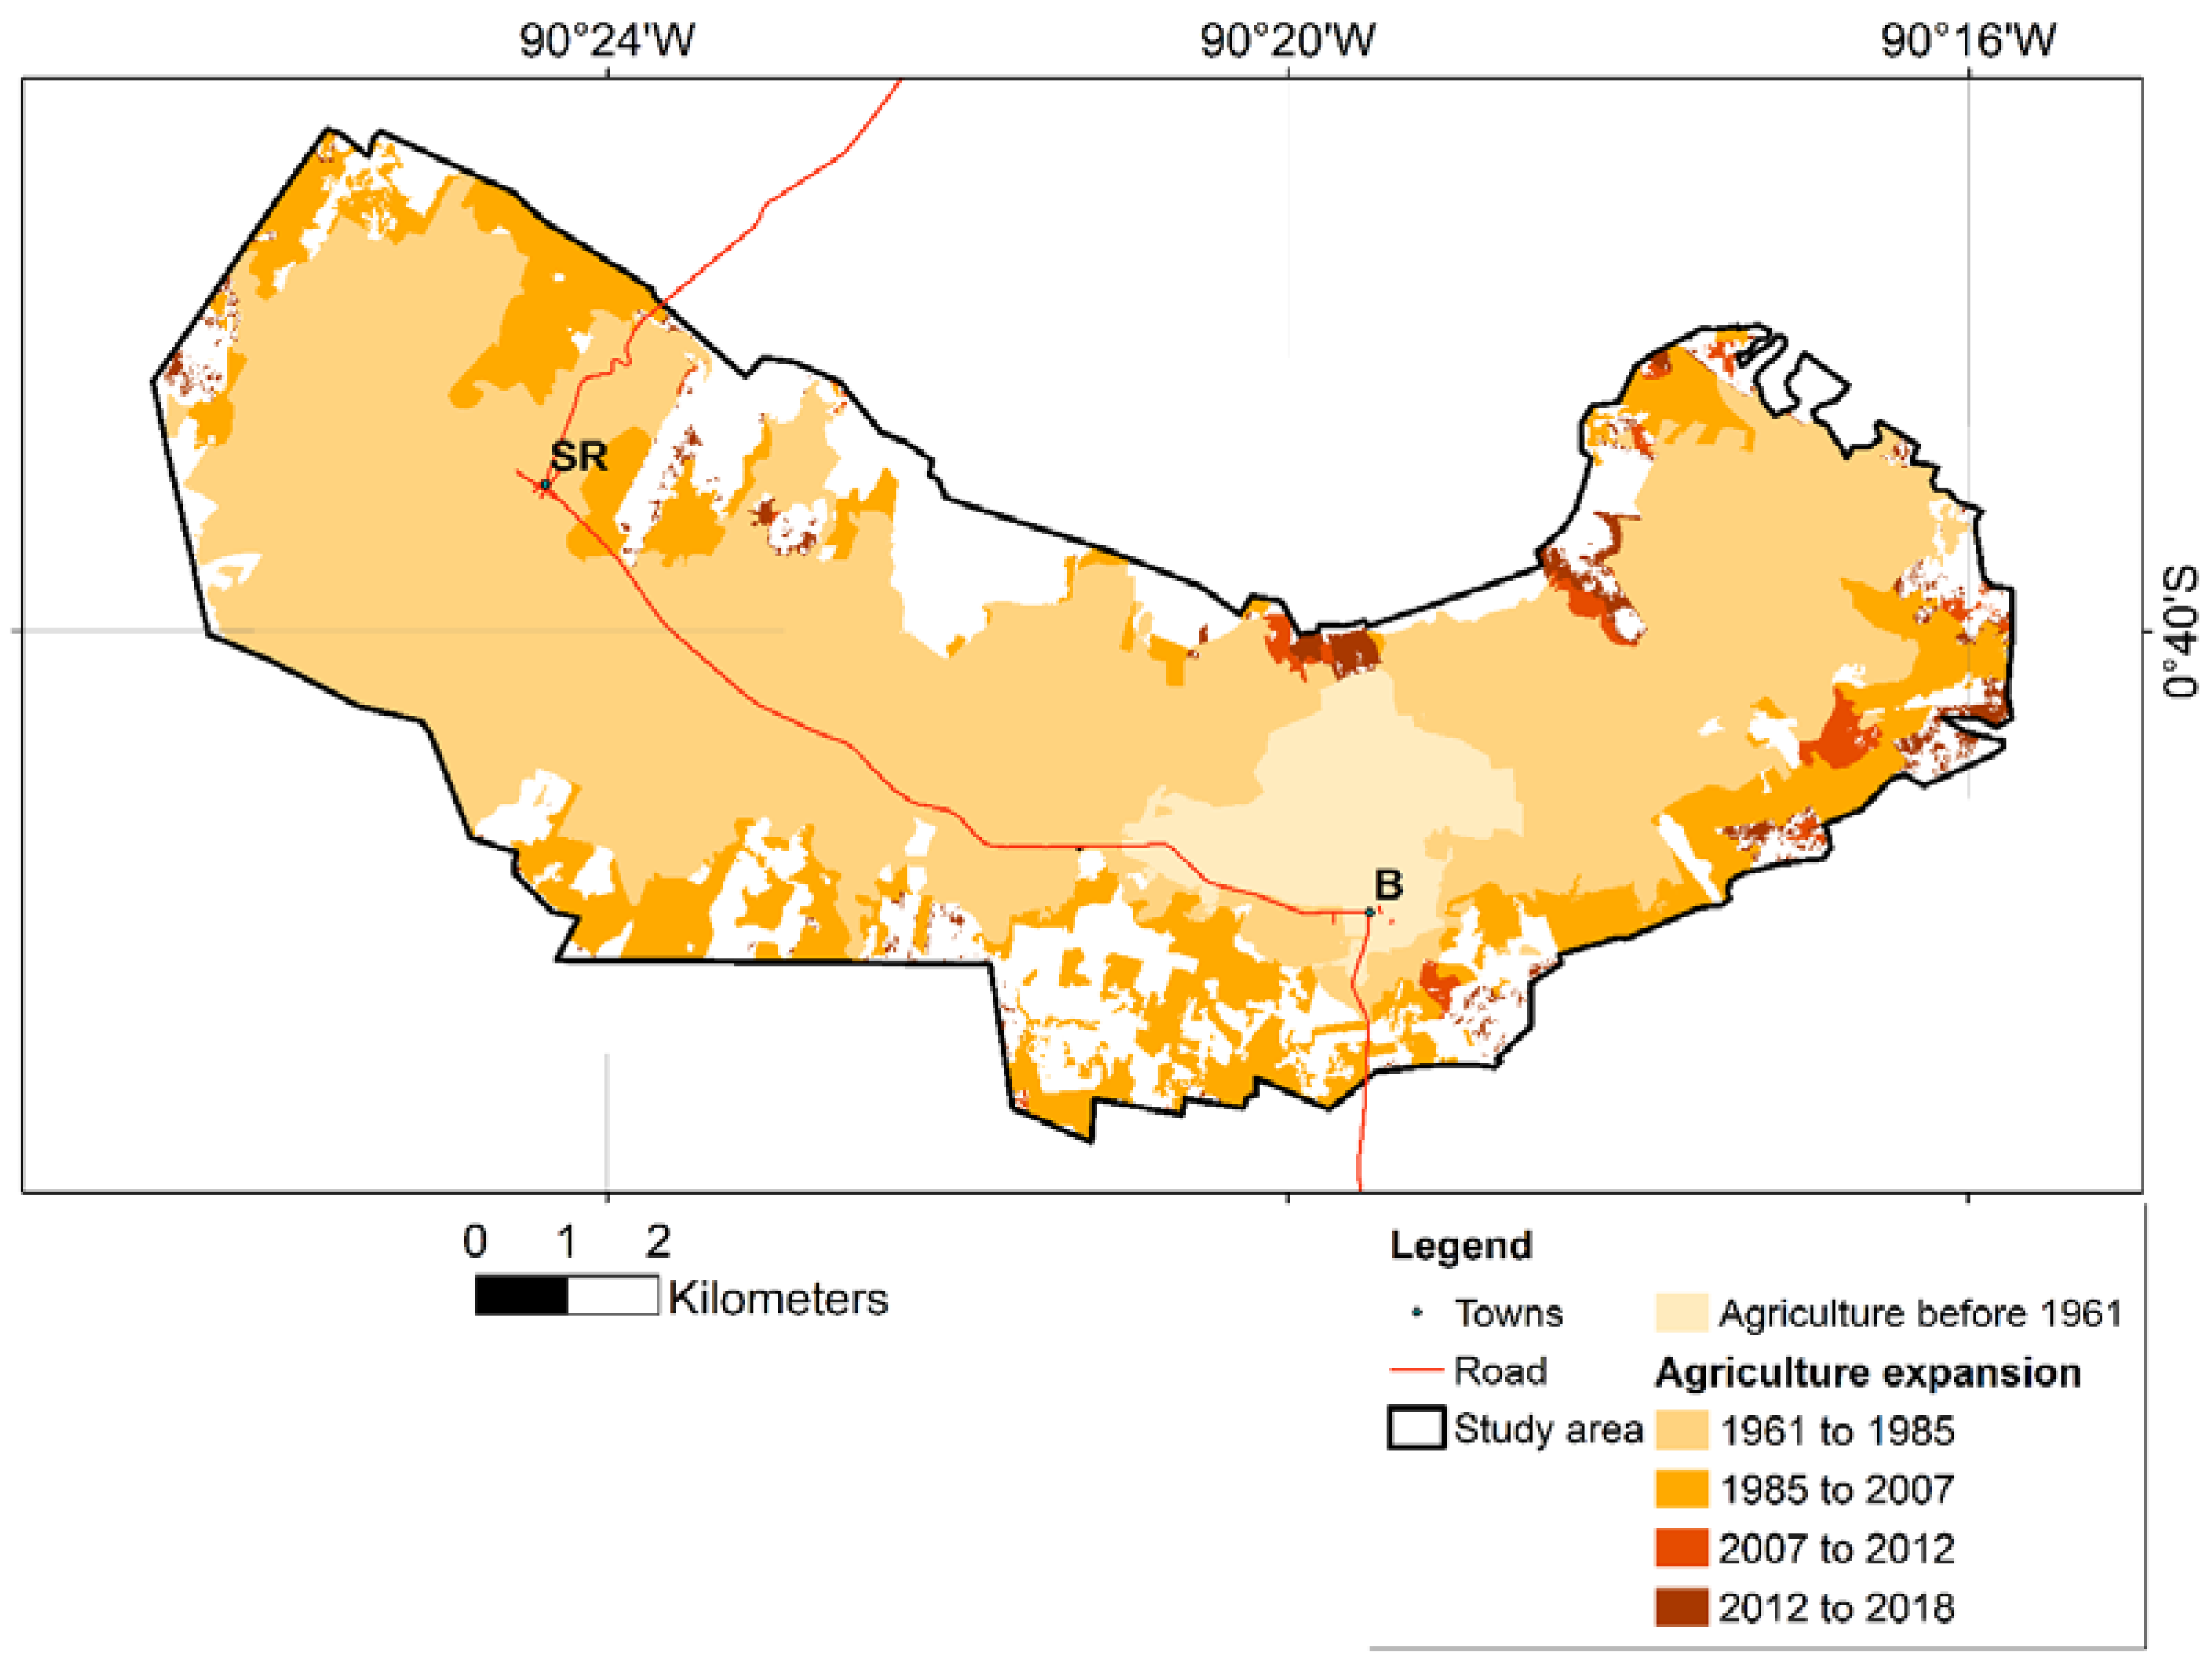
2.2. Reconstruction of Land Cover Change (1961–2018)
2.3. Ancillary Biophysical and Socioeconomic Data
2.4. Statistical Analysis
3. Results
3.1. Reconstruction of Historical Land Cover Maps
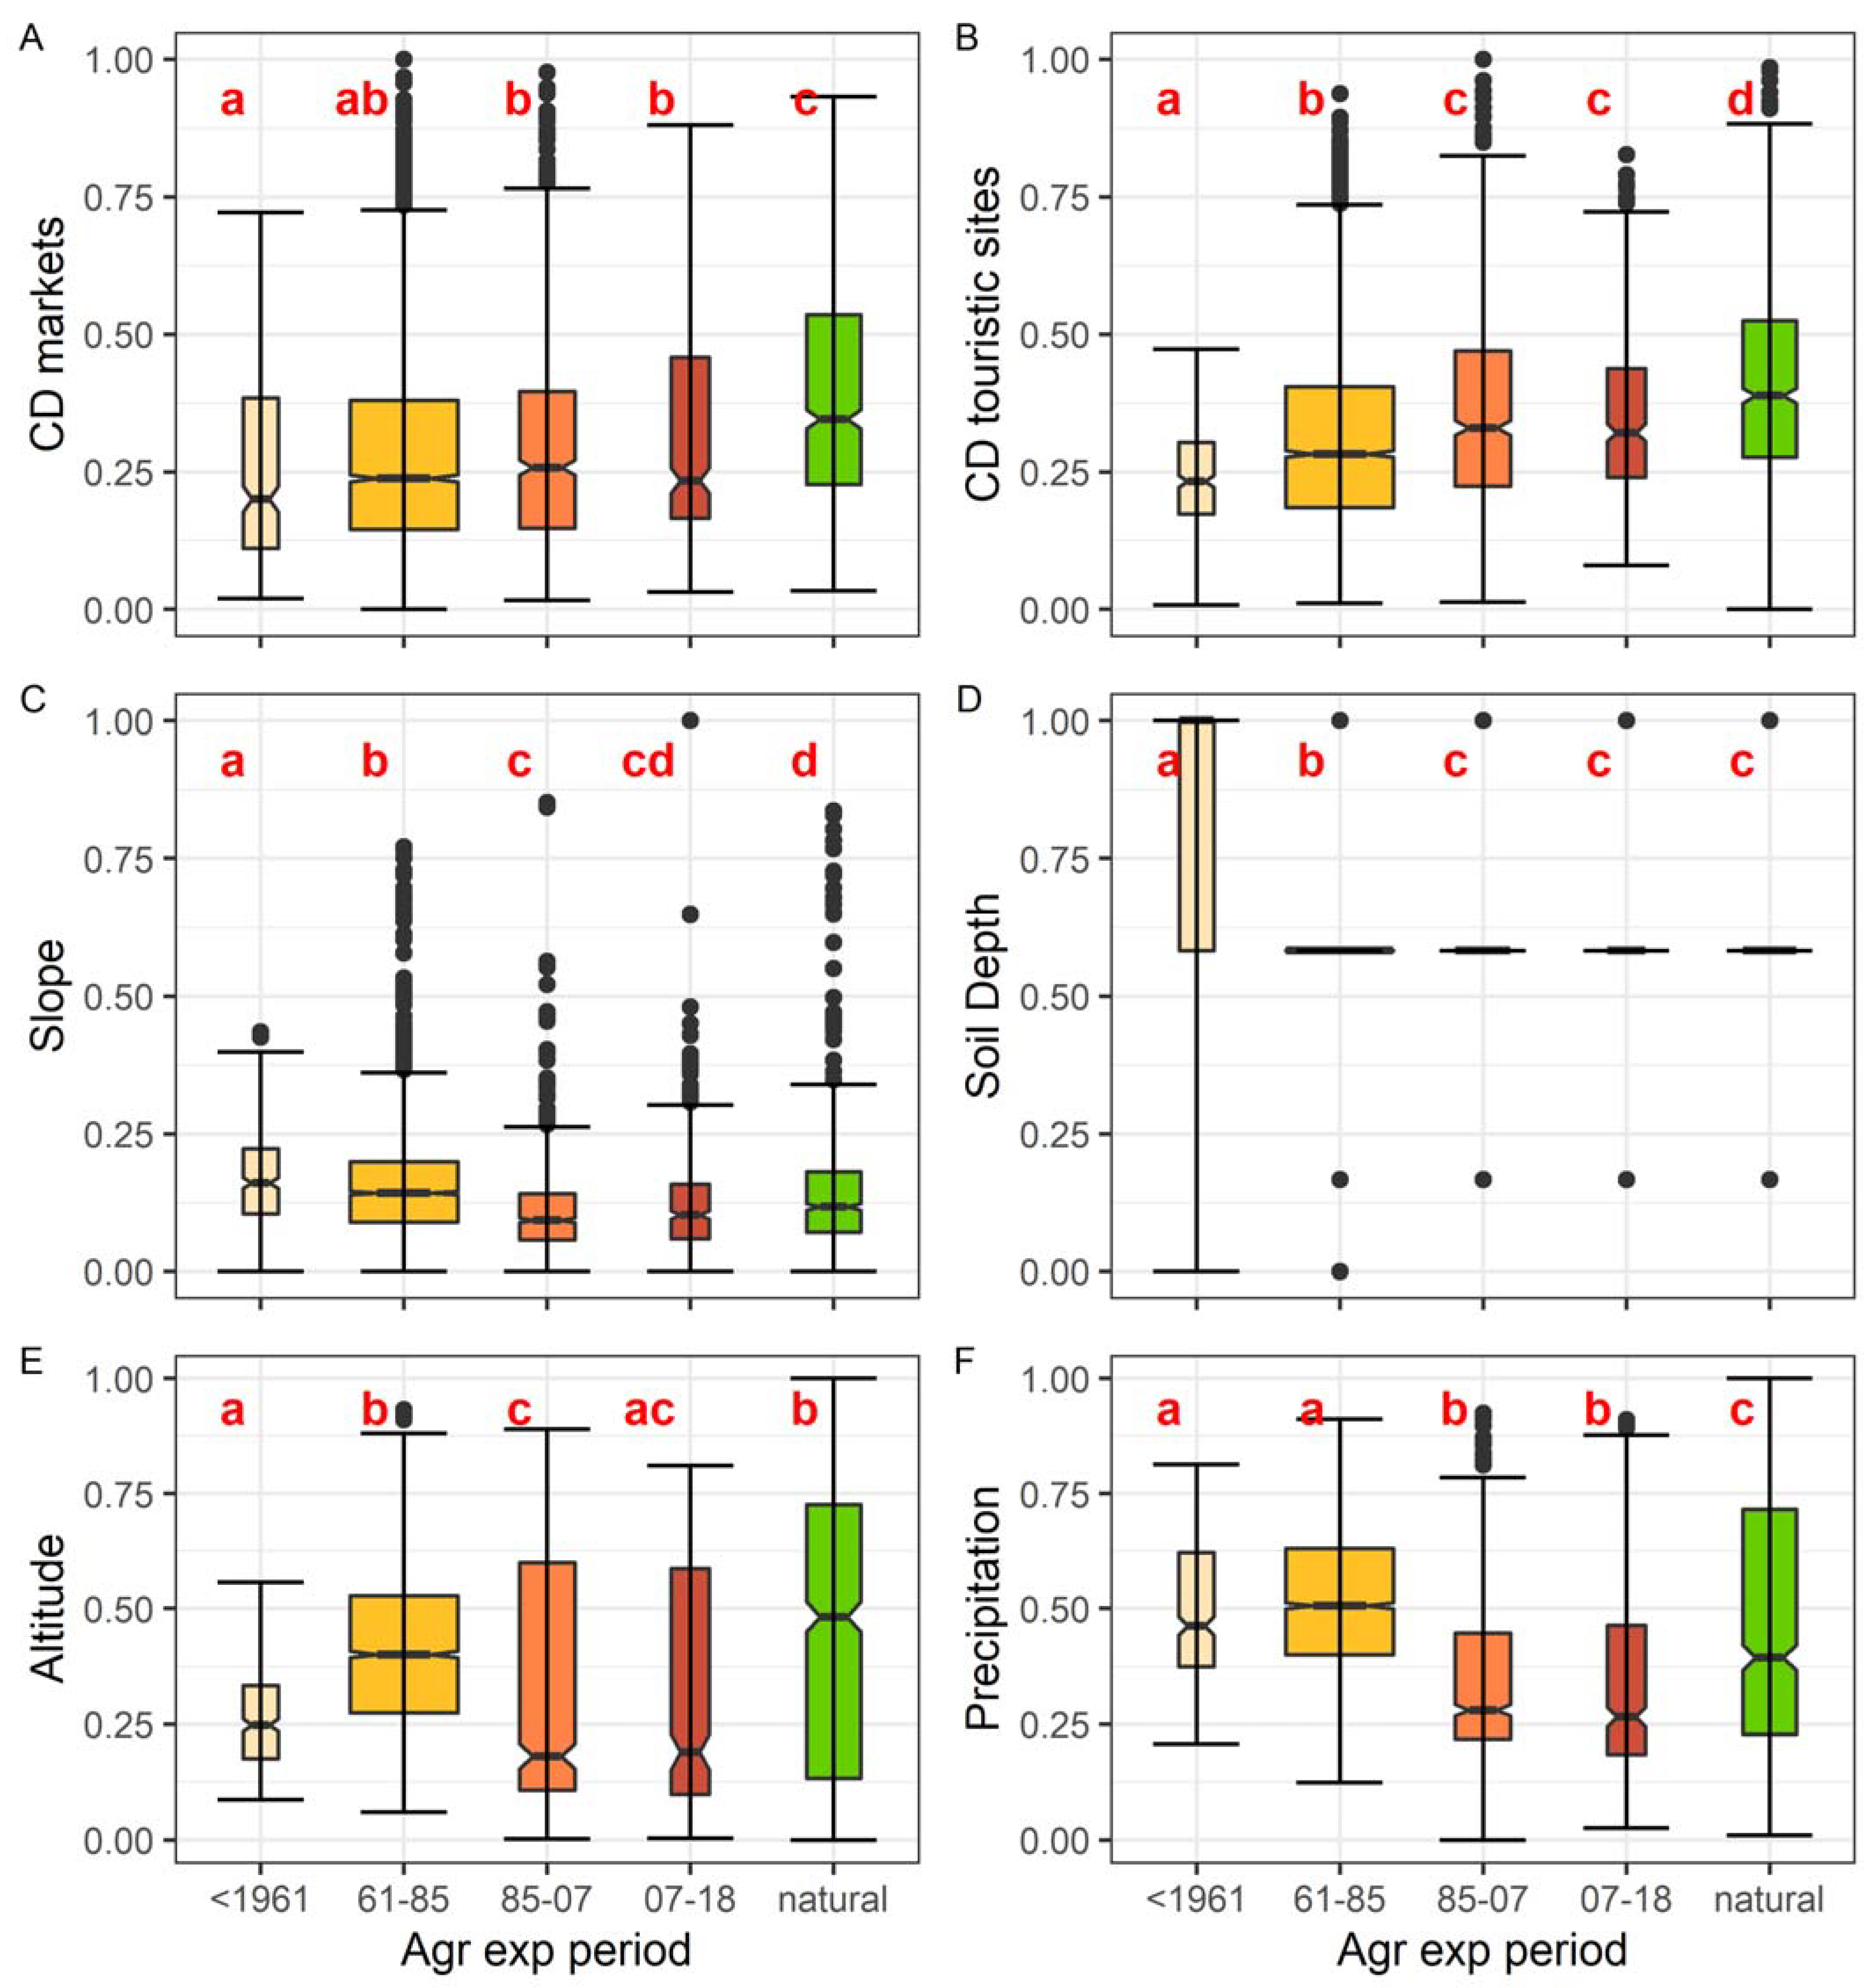
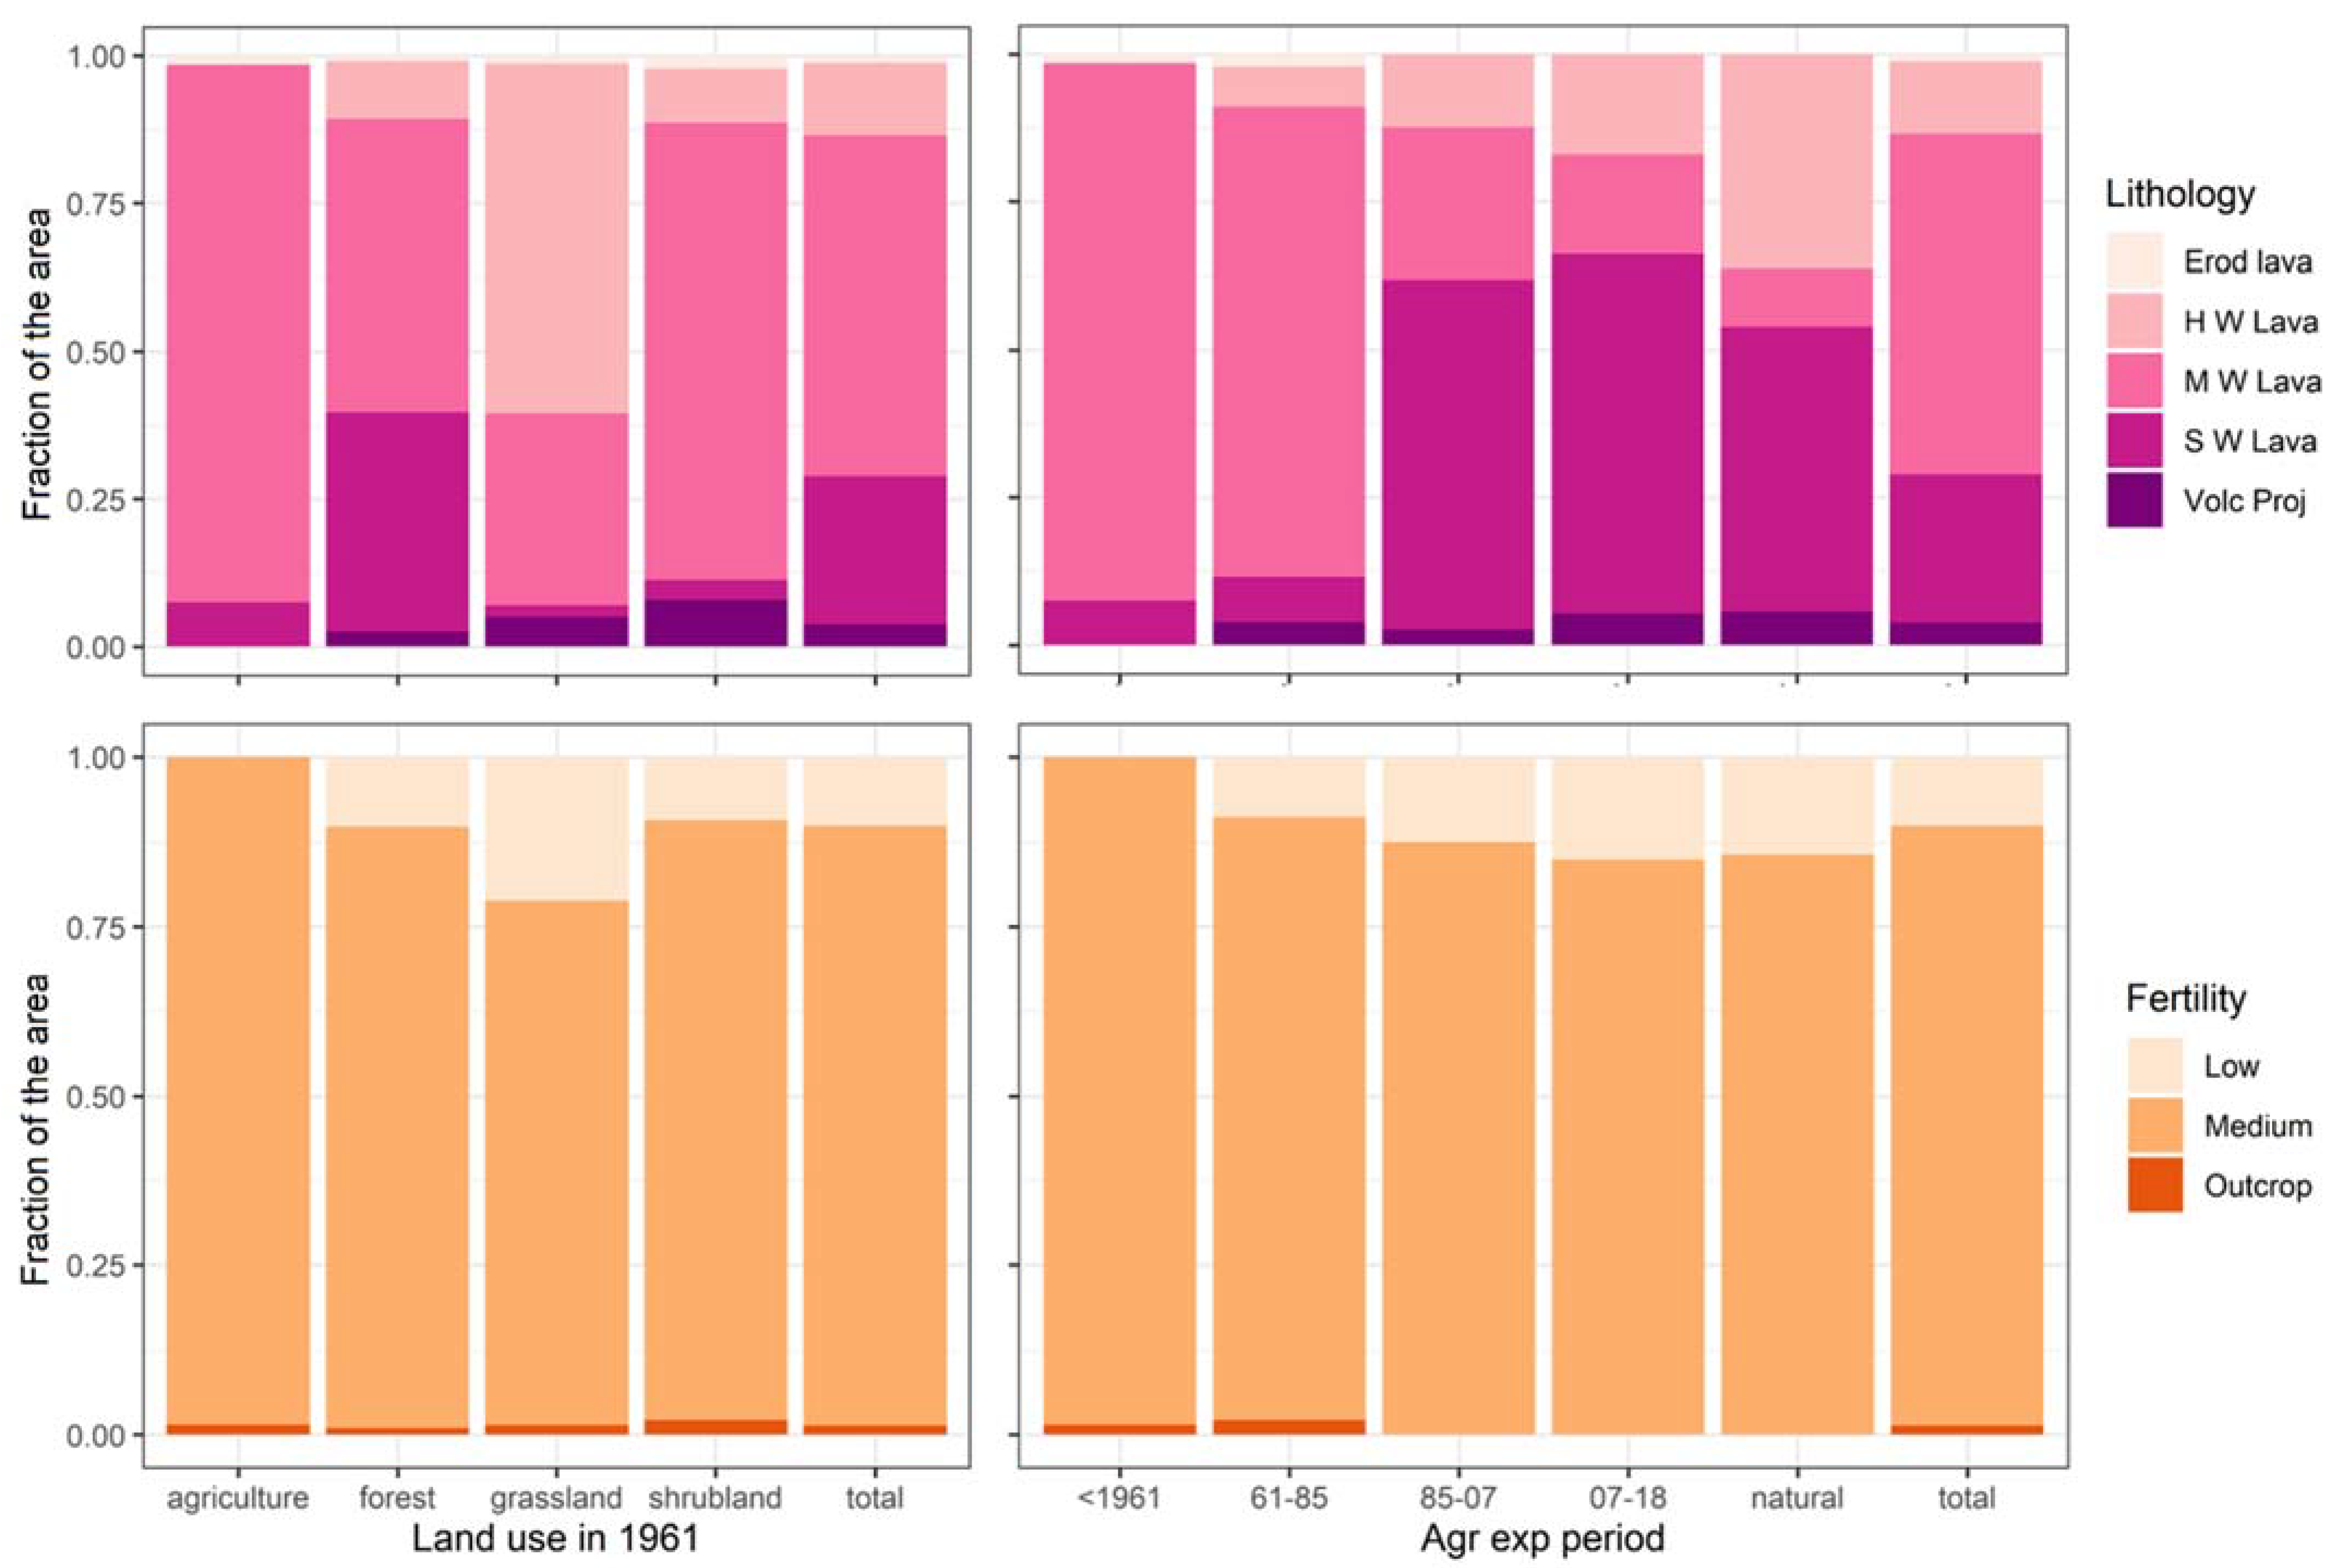
3.2. Drivers of Agricultural Expansion
3.3. Association between Agricultural Expansion, Demography, and Socio-Economic Conditions
3.4. Farm Typology and its Relationship with the Land Cover Change
4. Discussion
4.1. Land Cover Change Dynamics
4.2. Decreasing Rate of Agricultural Expansion
4.3. Change in Farm Typology over Time
5. Conclusions
Supplementary Materials
Author Contributions
Funding
Institutional Review Board Statement
Informed Consent Statement
Data Availability Statement
Acknowledgments
Conflicts of Interest
References
- Tauger, M.B. Agriculture in World History, 2nd ed.; Routledge: London, UK, 2020; Volume 1, ISBN 9780367420918. [Google Scholar]
- Food and Agriculture Organization FAOSTAT. Available online: http://www.fao.org/faostat/en/#data/RL/visualize (accessed on 25 June 2021).
- Lowder, S.K.; Skoet, J.; Raney, T. The Number, Size, and Distribution of Farms, Smallholder Farms, and Family Farms Worldwide. World Dev. 2016, 87, 16–29. [Google Scholar] [CrossRef] [Green Version]
- Wilson, T.; Sleeter, B.; Sleeter, R.; Soulard, C. Land-Use Threats and Protected Areas: A Scenario-Based, Landscape Level Approach. Land 2014, 3, 362–389. [Google Scholar] [CrossRef] [Green Version]
- Bouchoms, S.; Wang, Z.; Vanacker, V.; Van Oost, K. Evaluating the Effects of Soil Erosion and Productivity Decline on Soil Carbon Dynamics Using a Model-Based Approach. Soil 2019, 5, 367–382. [Google Scholar] [CrossRef] [Green Version]
- Tarolli, P.; Vanacker, V.; Middelkoop, H.; Brown, A.G. Landscapes in the Anthropocene: State of the Art and Future Directions. Anthropocene 2014, 6, 1–2. [Google Scholar] [CrossRef]
- Sterling, S.M.; Ducharne, A.; Polcher, J. The Impact of Global Land-Cover Change on the Terrestrial Water Cycle. Nat. Clim. Chang. 2013, 3, 385–390. [Google Scholar] [CrossRef]
- Bosmans, J.; Van Beek, L.; Sutanudjaja, E.; Bierkens, M. Hydrological Impacts of Global Land Cover Change and Human Water Use. Hydrol. Earth Syst. Sci 2017, 21, 5603–5626. [Google Scholar] [CrossRef] [Green Version]
- Heald, C.L.; Spracklen, D.V. Land Use Change Impacts on Air Quality and Climate. Chem. Rev. 2015, 115, 4476–4496. [Google Scholar] [CrossRef] [Green Version]
- Vitousek, P.M. Ecosystem Science and Human-Environment Interactions in the Hawaiian Archipelago. J. Ecol. 2006, 94, 510–521. [Google Scholar] [CrossRef]
- Lambin, E.; Geist, H. Regional Differences in Tropical Deforestation. Environ. Sci. Policy Sustain. Dev. 2003, 45, 22–36. [Google Scholar] [CrossRef]
- Balthazar, V.; Vanacker, V.; Molina, A.; Lambin, E.F. Impacts of Forest Cover Change on Ecosystem Services in High Andean Mountains. Ecol. Indic. 2015, 48, 63–75. [Google Scholar] [CrossRef]
- Jadin, I.; Vanacker, V.; Hoang, H.T.T. Drivers of forest cover dynamics in smallholder farming systems: The case of northwestern Vietnam. Ambio 2013, 42, 344–356. [Google Scholar] [CrossRef] [PubMed] [Green Version]
- Gobbi, B.; Van Rompaey, A.; Loto, D.; Gasparri, I.; Vanacker, V. Comparing Forest Structural Attributes Derived from UAV-Based Point Clouds with Conventional Forest Inventories in the Dry Chaco. Remote Sens. 2020, 12, 4005. [Google Scholar] [CrossRef]
- Tsendbazar, N.; Herold, M.; Li, L.; Tarko, A.; De Bruin, S.; Masiliunas, D.; Lesiv, M.; Fritz, S.; Buchhorn, M.; Smets, B.; et al. Towards Operational Validation of Annual Global Land Cover Maps. Remote Sens. Environ. 2021, 266, 112686. [Google Scholar] [CrossRef]
- Buchhorn, M.; Smets, B.; Bertels, L.; Lesiv, M.; Tsendbazar, N.-E.; Masiliunas, D.; Linlin, L.; Herold, M.; Fritz, S. Copernicus Global Land Service: Land Cover 100m: Collection 3: Epoch 2015: Globe (Version V3.0.1). Zenodo 2020, 1–14. [Google Scholar] [CrossRef]
- Land Monitoring Core Service (LMCS) Home|Copernicus Global Land Service. Available online: https://land.copernicus.eu/global/ (accessed on 20 April 2022).
- Earth Resources Observation and Science (EROS) Center National Land Cover Database|United States Geological Survey. Available online: https://www.usgs.gov/centers/eros/science/national-land-cover-database (accessed on 20 April 2022).
- Verburg, P.H.; Veldkamp, A. Projecting Land Use Transitions at Forest Fringes in the Philippines at Two Spatial Scales. Landsc. Ecol. 2004, 19, 77–98. [Google Scholar] [CrossRef]
- Smiraglia, D.; Ceccarelli, T.; Bajocco, S.; Perini, L.; Salvati, L. Unraveling Landscape Complexity: Land Use/Land Cover Changes and Landscape Pattern Dynamics (1954–2008) in Contrasting Peri-Urban and Agro-Forest Regions of Northern Italy. Environ. Manag. 2015, 56, 916–932. [Google Scholar] [CrossRef] [PubMed]
- Bajocco, S.; Ceccarelli, T.; Smiraglia, D.; Salvati, L.; Ricotta, C. Modeling the Ecological Niche of Long-Term Land Use Changes: The Role of Biophysical Factors. Ecol. Indic. 2016, 60, 231–236. [Google Scholar] [CrossRef]
- Jayne, T.S.; Muyanga, M.; Wineman, A.; Ghebru, H.; Stevens, C.; Stickler, M.; Chapoto, A.; Anseeuw, W.; Van der Westhuizen, D.; Nyange, D. Are Medium-Scale Farms Driving Agricultural Transformation in Sub-Saharan Africa? Agric. Econ. 2019, 50, 75–95. [Google Scholar] [CrossRef] [Green Version]
- Geist, H.; McConnell, W.; Lambin, E.; Moran, E.; Alves, D.; Rudel, T. Causes and Trajectories of Land-Use/Cover Change. In Land-Use and Land-Cover Change, 1st ed.; Lambin, E., Geist, H., Eds.; Springer: Berlin/Heidelberg, Germany, 2006; pp. 41–70. ISBN 978-3-540-32202-3. [Google Scholar]
- Byerlee, D.; Stevenson, J.; Villoria, N. Does Intensification Slow Crop Land Expansion or Encourage Deforestation? Glob. Food Sec. 2014, 3, 92–98. [Google Scholar] [CrossRef] [Green Version]
- Hoang, H.T.T.; Vanacker, V.; Van Rompaey, A.; Vu, K.C.; Nguyen, A.T. Changing Human-Landscape Interactions after Development of Tourism in the Northern Vietnamese Highlands. Anthropocene 2014, 5, 42–51. [Google Scholar] [CrossRef] [Green Version]
- Perz, S.G.; Walker, R.T.; Caldas, M.M. Beyond Population and Environment: Household Demographic Life Cycles and Land Use Allocation among Small Farms in the Amazon. Hum. Ecol. 2006, 34, 829–849. [Google Scholar] [CrossRef]
- Serra, P.; Pons, X.; Saurí, D. Land-Cover and Land-Use Change in a Mediterranean Landscape: A Spatial Analysis of Driving Forces Integrating Biophysical and Human Factors. Appl. Geogr. 2008, 28, 189–209. [Google Scholar] [CrossRef]
- Royle, S.A. Geography of Islands, 1st ed.; Routledge: London, UK, 2002; ISBN 9780203160367. [Google Scholar]
- Napolitano, M.; Stone, J.; DiNapoli, R.; Thompson, V. Introduction: The Archaeology of Island Colonization. In The Archaeology of Island Colonization: Global Approaches to Initial Human Settlement, 1st ed.; Napolitano, M., Stone, J., DiNapoli, R., Thompson, V., Eds.; University Press of Florida: Gainesville, FL, USA, 2021; pp. 1–34. ISBN 978-0-8130-5778-1. [Google Scholar]
- Braje, T.J.; Leppard, T.P.; Fitzpatrick, S.M.; Erlandson, J.M. Archaeology, Historical Ecology and Anthropogenic Island Ecosystems. Environ. Conserv. 2017, 44, 286–297. [Google Scholar] [CrossRef] [Green Version]
- Graham, N.R.; Gruner, D.S.; Lim, J.Y.; Gillespie, R.G. Island Ecology and Evolution: Challenges in the Anthropocene. Environ. Conserv. 2017, 44, 323–335. [Google Scholar] [CrossRef] [Green Version]
- Percy, M.S.; Schmitt, S.R.; Riveros-Iregui, D.A.; Mirus, B.B. The Galápagos archipelago: A natural laboratory to examine sharp hydroclimatic, geologic and anthropogenic gradients. Wiley Interdiscip. Rev. Water 2016, 3, 587–600. [Google Scholar] [CrossRef]
- Newman, R.; Capitani, C.; Courtney-Mustaphi, C.; Thorn, J.P.R.; Kariuki, R.; Enns, C.; Marchant, R. Integrating Insights from Social-Ecological Interactions into Sustainable Land Use Change Scenarios for Small Islands in the Western Indian Ocean. Sustainability 2020, 12, 1340. [Google Scholar] [CrossRef] [Green Version]
- Norder, S.J.; De Lima, R.F.; De Nascimento, L.; Lim, J.Y.; Fernández-Palacios, J.M.; Romeiras, M.M.; Elias, R.B.; Cabezas, F.J.; Catarino, L.; Ceríaco, L.M.P.; et al. Global Change in Microcosms: Environmental and Societal Predictors of Land Cover Change on the Atlantic Ocean Islands. Anthropocene 2020, 30, 100242. [Google Scholar] [CrossRef]
- Balzan, M.V.; Potschin-Young, M.; Haines-Young, R. Island Ecosystem Services: Insights from a Literature Review on Case-Study Island Ecosystem Services and Future Prospects. Int. J. Biodivers. Sci. Ecosyst. Serv. Manag. 2018, 14, 71–90. [Google Scholar] [CrossRef]
- Massetti, A.; Gil, A. Mapping and Assessing Land Cover/Land Use and Aboveground Carbon Stocks Rapid Changes in Small Oceanic Islands’ Terrestrial Ecosystems: A Case Study of Madeira Island, Portugal (2009–2011). Remote Sens. Environ. 2020, 239, 111625. [Google Scholar] [CrossRef]
- Vitousek, P.M.; Chadwick, O. Pacific Islands in the Anthropocene. Elem. Sci. Anthr. 2013, 1, 11. [Google Scholar] [CrossRef] [Green Version]
- Vanacker, V.; Bellin, N.; Molina, A.; Kubik, P.W. Erosion regulation as a function of human disturbances to vegetation cover: A conceptual model. Landscape Ecology 2014, 29, 293–309. [Google Scholar] [CrossRef]
- Fitzpatrick, S.M.; Giovas, C.M. Tropical Islands of the Anthropocene: Deep Histories of Anthropogenic Terrestrial–Marine Entanglement in the Pacific and Caribbean. Proc. Natl. Acad. Sci. USA 2021, 118, e2022209118. [Google Scholar] [CrossRef] [PubMed]
- Ratter, B.M. Introduction to the Geography of Small Islands. In Geography of Small Islands: Outposts of Globalisation, 1st ed.; Springer International Publishing AG: Cham, Switzerland, 2018; pp. 1–24. [Google Scholar] [CrossRef]
- Campbell, J.R. Development, Global Change and Traditional Food Security in Pacific Island Countries. Reg. Environ. Chang. 2015, 15, 1313–1324. [Google Scholar] [CrossRef]
- Brewington, L. The Double Bind of Tourism in Galapagos Society. In Science and Conservation in the Galapagos Islands; Walsh, S.J., Mena, C.F., Eds.; Springer: New York, NY, USA, 2013; pp. 105–125. [Google Scholar] [CrossRef]
- Mestanza-Ramón, C.; Pranzini, E.; Anfuso, G.; Botero, C.; Chica-Ruiz, A.; Mooser, A. An Attempt to Characterize the “3S” (Sea, Sun, and Sand) Parameters: Application to the Galapagos Islands and Continental Ecuadorian Beaches. Sustainability 2020, 12, 3468. [Google Scholar] [CrossRef] [Green Version]
- Brewington, L. Transitions and Drivers of Land Use/Land Cover Change in Hawaiʻi: A Case Study of Maui. In Land Cover and Land Use Change on Islands Social & Ecological Threats to Sustainability, 1st ed.; Walsh, S., Riveros-Iregui, D., Arce-Nazario, J., Page, P., Eds.; Springer Nature Switzerland AG: Cham, Switzerland, 2020; pp. 89–117. ISBN 978-3-030-43973-6. [Google Scholar]
- Leppard, T.P. Similarity and Diversity in the Prehistoric Colonization of Islands and Coasts by Food-Producing Communities. J. Isl. Coast. Archaeol. 2014, 9, 1–15. [Google Scholar] [CrossRef]
- Hunt, T.L.; Lipo, C.P. The Last Great Migration: Human Colonization of the Remote Pacific Islands. In Human Dispersal and Species Movement From Prehistory to the Present; Boivin, N., Crassard, R., Petraglia, M., Eds.; Cambridge University Press: Cambridge, UK, 2017; pp. 194–216. ISBN 9781107164147. [Google Scholar]
- Giovas, C.M.; Fitzpatrick, S.M. Prehistoric Migration in the Caribbean: Past Perspectives, New Models and the Ideal Free Distribution of West Indian Colonization. World Archaeol. 2014, 46, 569–589. [Google Scholar] [CrossRef]
- Pazmiño, A.; Serrao-Neumann, S.; Choy, D.L. Towards Comprehensive Policy Integration for the Sustainability of Small Islands: A Landscape-Scale Planning Approach for the Galápagos Islands. Sustainability 2018, 10, 1228. [Google Scholar] [CrossRef] [Green Version]
- Toulkeridis, T.; Angermeyer, H. Volcanoes of the Galapagos, 2nd ed.; Universidad de las Fuerzas Armadas: Quito, Ecuador, 2019; ISBN 9789942364883. [Google Scholar]
- Bow, C. Geology and Petrogeneses of the Lavas of Floreana and Santa Cruz Islands: Galapagos Archipelago. Ph.D. Thesis, University of Oregon, Eugene, OR, USA, 1979. [Google Scholar]
- White, W.M.; McBirney, A.R.; Duncan, R.A. Petrology and Geochemistry of the Galápagos Islands: Portrait of a Pathological Mantle Plume. J. Geophys. Res. Solid Earth 1993, 98, 19533–19563. [Google Scholar] [CrossRef]
- McBirney, A.R.; Williams, H. Geology and Petrology of the Galápagos Islands. In Geological Society of America Memoirs; Geological Society of America: Boulder, CO, USA, 1969; Volume 118, pp. 1–197. [Google Scholar]
- Schwartz, D. Volcanic, Structural, and Morphological History of Santa Cruz Island, Galápagos Archipelago. Masters’s Thesis, University of Idaho, Moscow, ID, USA, 2014. [Google Scholar]
- Taboada, T.; Rodríguez-Lado, L.; Ferro-Vázquez, C.; Stoops, G.; Martínez Cortizas, A. Chemical Weathering in the Volcanic Soils of Isla Santa Cruz (Galápagos Islands, Ecuador). Geoderma 2016, 261, 160–168. [Google Scholar] [CrossRef] [Green Version]
- Lasso, L.; Espinosa, J. Soils from the Galapagos Islands. In The Soils of Ecuador, 1st ed.; Moreno, J., Espinosa, J., Bernal, G., Eds.; Springer International Publishing AG: Cham, Switzerland, 2018; pp. 139–150. ISBN 978-3-319-25319-0. [Google Scholar]
- Laruelle, J. Galapagos, 1st ed.; Natuurwetenschappelijk tijdschrift: Ghent, Belgium, 1967; Volume 47, 237p. [Google Scholar]
- Laruelle, J. Study of a Soil Sequence on Indefatigable Island. In The Galápagos; Bowman, R.I., Ed.; University of California Press: Berkeley, CA, USA, 1966; pp. 87–92. [Google Scholar]
- Stoops, G. Soils and Palaeosoils of the Galápagos Islands: What We Know and What We Don’t Know, a Meta-Analysis. Pacific Sci. 2013, 68, 1–36. [Google Scholar] [CrossRef] [Green Version]
- Laruelle, J.; Stoops, G. Minor Elements in Galapagos Soils. Pedologie 1967, 17, 232–257. [Google Scholar]
- Trueman, M.; D’Ozouville, N. Characterizing the Galapagos Terrestrial Climate in the Face of Global Climate Change. Galapagos Res. 2010, 67, 26–37. [Google Scholar]
- Violette, S.; D’Ozouville, N.; Pryet, A.; Deffontaines, B.; Fortin, J.; Adelinet, M. Hydrogeology of the Galápagos Archipelago: An Integrated and Comparative Approach Between Islands. In The Galapagos: A Natural Laboratory for the Earth Sciences; Harpp, K., Mittelstaedt, E., D’Ozouville, N., Wilson, L.G., Eds.; Wiley Blackwell: Washington, DC, USA, 2014; pp. 167–183. ISBN 9781118852538. [Google Scholar]
- Paltán, H.A.; Benitez, F.L.; Rosero, P.; Escobar-Camacho, D.; Cuesta, F.; Mena, C.F. Climate and Sea Surface Trends in the Galapagos Islands. Sci. Rep. 2021, 11, 14465. [Google Scholar] [CrossRef] [PubMed]
- Mena, C.F.; Paltán, H.A.; Benitez, F.L.; Sampedro, C.; Valverde, M. Threats of Climate Change in Small Oceanic Islands: The Case of Climate and Agriculture in the Galapagos Islands, Ecuador. In Land Cover and Land Use Change on Islands: Social and Ecological Interactions in the Galapagos Islands; Walsh, S.J., Riveros-Iregui, D., Arce-Nazario, J., Page, P.H., Eds.; Springer Nature Switzerland AG: Cham, Switzerland, 2020; pp. 119–135. ISBN 978-3-030-43973-6. [Google Scholar]
- Idrovo, H. Galápagos, Huellas En El Paraíso, 1st ed.; Ediciones Libri Mundi: Quito, Ecuador, 2005; ISBN 978-9978-57-043-2. [Google Scholar]
- Hickman, J. The Enchanted Islands: The Galapagos Discovered. Not. Galapagos 1985, 1, 26–27. [Google Scholar]
- Lundh, J.P. The Colonia de Santa Cruz of 1926. Not. Galapagos 1996, 1, 21. [Google Scholar]
- Lundh, J.P. A Brief Account of Some Early Inhabitants of Santa Cruz Island. Not. Galapagos 1995, 55, 2–3. [Google Scholar]
- Black, J. Galápagos, Archipiélago Del Ecuador, 1st ed.; Imprenta Europa: Quito, Ecuador, 1973. [Google Scholar]
- Gondard, P.; Mazurek, H. (Eds.) 30 Anos de Reforma Agraria y Colonización En El Ecuador: 1964–1994. In Dinámicas Territoriales: Ecuador, Bolivia, Perú, Venezuela, Estudios de Geografía; Colegio de Geógrafos del Ecuador, CGE/Corporación Editora Nacional, CEN/Institut de Recherche pour Ie Developpernent; IRD/Pontificia Universidad Católica del Ecuador, PUCE/Quito: Quito, Ecuador, 2001; Volume 10, pp. 15–40. [Google Scholar]
- Grenier, C. Conservación Contra Natura: Las Islas Galápagos; Instituto Francés de Estudios Andinos: Quito, Ecuador, 2007; ISBN 9978226540. [Google Scholar]
- Junta Nacional de Planificación y Coordinación Económica. III Censo de Población 1974: Resultados Definitivos; Galápagos, 1st ed.; Junta Nacional de Planificación y Coordinación Económica: Quito, Ecuador, 1976; Volume 10. [Google Scholar]
- Instituto Nacional de Estadística y Censos. IV Censo de Población, 1982: Galápagos, 1st ed.; Instituto Nacional de Estadística y Censos: Quito, Ecuador, 1984; Volume 18.
- Instituto Nacional de Estadística y Censos Censo de Población y Vivienda-Galápagos. 2015. Available online: https://www.ecuadorencifras.gob.ec/censo-de-poblacion-y-vivienda-galapagos/ (accessed on 29 March 2022).
- Epler, B. Tourism, the Economy, Population Growth, and Conservation in Galapagos. Charles Darwin Found. 2007, 55, 75. [Google Scholar]
- Jones, G. Luxury Tourism and Environmentalism Business History of Emerging Markets View Project History of Beauty Industry View Project. In The Oxford Handbook of Luxury Business, 1st ed.; Donzé, P.-Y., Pouillard, V., Roberts, J., Eds.; Oxford University Press: Oxford, UK, 2020; pp. 571–590. [Google Scholar] [CrossRef]
- Trueman, M.; Hobbs, R.J.; Van Niel, K. Interdisciplinary Historical Vegetation Mapping for Ecological Restoration in Galapagos. Landsc. Ecol. 2013, 28, 519–532. [Google Scholar] [CrossRef]
- Huttell, C. Cartografia de La Vegetacion En Las Islas Galapagos. Monog. Syst. Bot. Missouri Bot. Gard. 1990, 32, 117–122. [Google Scholar]
- Villa, A.; Segarra, P. Changes in Land Use and Vegetative Cover in the Rural Areas of Santa Cruz and San Cristóbal; Galapagos Conservancy: Santa Cruz, Ecuador, 2011. [Google Scholar]
- Bustamante, B.; Cadillo, J.; Cevallos, J.; Liger, B.; Llive, F.; Medina, F.; Parra, R.; Ramos, J.; Villarraga, H.; Ma, S.; et al. Diagnóstico y Análisis Biofísico para Evaluación y Formulación de Escenarios de Desarrollo en el Archipiélago de Galápagos; Instituto de Altos Estudios Nacionales: Quito, Ecuador, 2014. [Google Scholar]
- Laso, F.; Benítez, F.L.; Rivas-Torres, G.; Sampedro, C.; Arce-Nazario, J. Land Cover Classification of Complex Agroecosystems in the Non-Protected Highlands of the Galapagos Islands. Remote Sens. 2020, 12, 65. [Google Scholar] [CrossRef] [Green Version]
- Instituto Geográfico Militar (IGM). Aerial Photographs of Santa Cruz Galapagos. 1/50,000; Instituto Geográfico Militar: Quito, Ecuador, 1959. [Google Scholar]
- Instituto Geográfico Militar (IGM). Aerial Photographs of Santa Cruz Galapagos. 1/50,000; Instituto Geográfico Militar: Quito, Ecuador, 1960. [Google Scholar]
- Instituto Geográfico Militar (IGM). Aerial Photographs of Santa Cruz Galapagos. 1/50,000; Instituto Geográfico Militar: Quito, Ecuador, 1963. [Google Scholar]
- Instituto Geográfico Militar (IGM). Aerial Photographs of Santa Cruz Galapagos. 1/60,000; Instituto Geográfico Militar: Quito, Ecuador, 1985. [Google Scholar]
- Instituto Geográfico Militar (IGM). Aerial Photographs of Santa Cruz Galapagos. 1/30,000; Instituto Geográfico Militar: Quito, Ecuador, 2007. [Google Scholar]
- Sistema Nacional de Información y Gestión de Tierras Rurales e Infraestructura Tecnológica (SIGTIERRAS). Fotografía Aérea y Ortofotos Sistema Nacional de Informacion de Tierras Rurales e Infraestructura Tecnológica; Sistema Nacional de Información y Gestión de Tierras Rurales e Infraestructura Tecnológica (SIGTIERRAS): Quito, Ecuador, 2012.
- Sistema Nacional de Información y Gestión de Tierras Rurales e Infraestructura Tecnológica (SIGTIERRAS); Instituto Nacional Galápagos (INGALA); Programa Nacional de Regionalización Agraria (PRONAREG ORSTOM). Mapa Geomorfológico de La Isla Santa Cruz Galápagos. Escala 1/100 000; Sistema Nacional de Información y Gestión de Tierras Rurales e Infraestructura Tecnológica (SIGTIERRAS); Instituto Nacional Galápagos (INGALA); Programa Nacional de Regionalización Agraria (PRONAREG ORSTOM): Quito, Ecuador, 2011.
- Sistema Nacional de Información y Gestión de Tierras Rurales e Infraestructura Tecnológica (SIGTIERRAS); Instituto Nacional Galapagos (INGALA); Programa Nacional de Regionalizacion Agraria (PRONAREG ORSTOM). Mapa de Suelos de La Isla Santa Cruz Galapagos. Escala 1/100 000; Sistema Nacional de Información y Gestión de Tierras Rurales e Infraestructura Tecnológica (SIGTIERRAS); Instituto Nacional Galapagos (INGALA); Programa Nacional de Regionalizacion Agraria (PRONAREG ORSTOM): Quito, Ecuador, 2011.
- Sistema Nacional de Información y Gestión de Tierras Rurales e Infraestructura Tecnológica (Sigtierras). Memorias Técnicas Variables; Sistema Nacional de Información y Gestión de Tierras Rurales e Infraestructura Tecnológica (Sigtierras): Quito, Ecuador, 2011.
- Instituto Nacional Galápagos (INGALA); Programa Nacional de Regionalización Agraria (Pronareg); Oficina para la Investigación científica y Técnica de Ultramar (ORSTOM). Inventario Cartográfico de Los Recursos Naturales, Geomorfología, Vegetación, Hídricos, Ecológicos y Biofísicos de Las Islas Galápagos, Ecuador. 1:100,000 Mapas; INGALA: Quito, Ecuador, 1989; 161p. [Google Scholar]
- USGS USGS EROS Archive—Digital Elevation—Shuttle Radar Topography Mission (SRTM) 1 Arc-Second Global|U.S. Geological Survey. Available online: https://www.usgs.gov/centers/eros/science/usgs-eros-archive-digital-elevation-shuttle-radar-topography-mission-srtm-1?qt-science_center_objects=0#qt-science_center_objects (accessed on 9 March 2022).
- Vanacker, V.; Govers, G.; Barros, S.; Poesen, J.; Deckers, J. The Effect of Short-Term Socio-Economic and Demographic Change on Landuse Dynamics and Its Corresponding Geomorphic Response with Relation to Water Erosion in a Tropical Mountainous Catchment, Ecuador. Landsc. Ecol. 2003, 18, 1–15. [Google Scholar] [CrossRef]
- Instituto Geográfico Militar. I. Cartografía Base Escala 1:50,000 Del Ecuador. Available online: http://www.geoportaligm.gob.ec (accessed on 21 December 2018).
- Larrea, C. Demografía y Estructura Social En Galápagos: 1990–2008; Universidad Andina Simon Bolivar: Quito, Ecuador, 2008. [Google Scholar]
- Junta Nacional de Planificación y Coordinación Económica. Plan de Conservación y Desarrollo Selectivo Para La Provincia de Galápagos; Junta Nacional de Planificación y Coordinación Económica: Quito, Ecuador, 1975; 250p.
- Instituto Nacional de Estadísticas y Censos V Censo de Poblacion y IV de Vivienda. 1990. Available online: http://redatam.inec.gob.ec/cgibin/RpWebEngine.exe/PortalAction?BASE=CPV1990 (accessed on 17 June 2020).
- Instituto Ecuatoriano de Estadísticas y Censos VI Censo de Población y V de Vivienda. 2001. Available online: http://redatam.inec.gob.ec/cgibin/RpWebEngine.exe/PortalAction?BASE=CPV2001 (accessed on 3 May 2018).
- Galapagos Conservation Trust History of Tourism—Discovering Galapagos. Available online: https://www.discoveringgalapagos.org.uk/discover/sustainable-development/sustainable-tourism/history-of-tourism/ (accessed on 10 March 2022).
- Instituto Nacional de Estadísticas y Censos. Censo Agropecuario 1974—Cantón Santa Cruz, 1st ed.; Oficina de Censos: Quito, Ecuador, 1978.
- Rodríguez Rojas, J. Indicadores Regionales de Galápagos Ecuador, 1st ed.; Fundación Charles Darwin para las Islas Galápagos: Quito, Ecuador, 1992; ISBN 978-9978-53-002-3. [Google Scholar]
- Instituto Nacional de Estadística y Censos Censo Nacional Agropecuario 2000 Galapagos. Available online: https://www.ecuadorencifras.gob.ec/censo-nacional-agropecuario/ (accessed on 21 July 2021).
- Consejo de Gobierno del Régimen Especial de Galápagos (CGREG). Censo de Unidades de Producción Agropecuaria de Galápagos 2014 (UPA); Martínez, R., Ed.; 2015; 143p, Available online: https://www.gobiernogalapagos.gob.ec/wp-content/uploads/downloads/2015/09/modelo-de-gestion-plan-galapagos-version-14_sep_2015.pdf (accessed on 10 April 2022).
- R Core Team. R: The R Project for Statistical Computing. Available online: https://www.r-project.org/ (accessed on 29 March 2022).
- Thorsten, P. Calculate Pairwise Multiple Comparisons of Mean Rank Sums. R package version PMCMRplus 1.9.4. 2021. Available online: https://cran.r-project.org/web/packages/PMCMRplus/index.html (accessed on 1 February 2022).
- Cichosz, P. Data Mining Algorithms: Explained Using R.; John Wiley & Sons, Ltd.: West Sussex, UK, 2015; pp. 349–372. ISBN 9781118332580. [Google Scholar]
- Newman, M.E.; McLaren, K.P.; Wilson, B.S. Long-Term Socio-Economic and Spatial Pattern Drivers of Land Cover Change in a Caribbean Tropical Moist Forest, the Cockpit Country, Jamaica. Agric. Ecosyst. Environ. 2014, 186, 185–200. [Google Scholar] [CrossRef]
- Norder, S.J.; Seijmonsbergen, A.C.; Rughooputh, S.D.D.V.; Van Loon, E.E.; Tatayah, V.; Kamminga, A.T.; Rijsdijk, K.F. Assessing Temporal Couplings in Social–Ecological Island Systems: Historical Deforestation and Soil Loss on Mauritius (Indian Ocean). Ecol. Soc. 2017, 22, 29. [Google Scholar] [CrossRef] [Green Version]
- Baer, A.; Chadwick, O.; Kirch, P.V. Soil Nutrients and Intensive Dryland Agricultural Production in Kaupō, Maui, Hawaiian Islands. J. Archaeol. Sci. Reports 2015, 3, 429–436. [Google Scholar] [CrossRef]
- Kirch, P.V.; Holson, J.; Baer, A. Intensive Dryland Agriculture in Kaupō, Maui, Hawaiian Islands. Asian Perspect. 2009, 48, 265–290. [Google Scholar] [CrossRef]
- Vitousek, P.M.; Ladefoged, T.N.; Kirch, P.V.; Hartshorn, A.S.; Graves, M.W.; Hotchkiss, S.C.; Tutjapurkar, S.; Chadwick, O.A. Soils, Agriculture, and Society in Precontact Hawai’i. Science 2004, 304, 1665–1669. [Google Scholar] [CrossRef]
- Ladefoged, T.N.; Kirch, P.V.; Gon, S.M.; Chadwick, O.A.; Hartshorn, A.S.; Vitousek, P.M. Opportunities and Constraints for Intensive Agriculture in the Hawaiian Archipelago Prior to European Contact. J. Archaeol. Sci. 2009, 36, 2374–2383. [Google Scholar] [CrossRef]
- Kennett, D.J.; Winterhalder, B. Demographic Expansion, Despotism and the Colonisation of East and South Polynesia. In Islands of Inquiry: Colonisation, Seafaring and the Archaeology of Maritime Landscapes, 1st ed.; Clark, G., Leach, F., O’Connor, S., Eds.; ANU Press: Canberra, Australia, 2008; pp. 87–96. ISBN 978-1-921313-90-5. [Google Scholar]
- Winterhalder, B.; Kennett, D.J.; Grote, M.N.; Bartruff, J. Ideal Free Settlement of California’s Northern Channel Islands. J. Anthropol. Archaeol. 2010, 29, 469–490. [Google Scholar] [CrossRef] [Green Version]
- Jazwa, C.S.; Kennett, D.J.; Winterhalder, B. A Test of Ideal Free Distribution Predictions Using Targeted Survey and Excavation on California’s Northern Channel Islands. J. Archaeol. Method Theory 2016, 23, 1242–1284. [Google Scholar] [CrossRef]
- Hanna, J.A.; Giovas, C.M. An Islandscape IFD: Using the Ideal Free Distribution to Predict Pre-Columbian Settlements from Grenada to St. Vincent, Eastern Caribbean. Environ. Archaeol. 2019, 1–18. [Google Scholar] [CrossRef]
- Siegel, P.E.; Jones, J.G.; Pearsall, D.M.; Dunning, N.P.; Farrell, P.; Duncan, N.A.; Curtis, J.H.; Singh, S.K. Paleoenvironmental Evidence for First Human Colonization of the Eastern Caribbean. Quat. Sci. Rev. 2015, 129, 275–295. [Google Scholar] [CrossRef]
- Lane, B.G. Geospatial Modelling for Predicting the Ideal Free Settlement of Rapa. Archaeol. Ocean. 2017, 52, 13–21. [Google Scholar] [CrossRef]
- Instituto Nacional de Estadísticas y Censos. Análisis de Resultados Definitivos Censo de Población y Vivienda Galápagos 2015; Instituto Nacional de Estadísticas y Censos: Quito, Ecuador, 2015; 46p. [Google Scholar]
- Eras-Almeida, A.A.; Egido-Aguilera, M.A.; Blechinger, P.; Berendes, S.; Caamaño, E.; García-Alcalde, E. Decarbonizing the Galapagos Islands: Techno-Economic Perspectives for the Hybrid Renewable Mini-Grid Baltra-Santa Cruz. Sustainability 2020, 12, 2282. [Google Scholar] [CrossRef] [Green Version]
- Quiroga, D.; Sevilla, A. Darwin, Darwinism and Conservation in the Galapagos Islands The Legacy of Darwin and its New Applications, 1st ed.; Quiroga, D., Sevilla, A., Eds.; Springer International Publishing: Cham, Switzerland, 2016; pp. 54–90. ISBN 9783319340500. [Google Scholar]
- Acosta Solís, M. Galápagos Observado Fitológicamente, 1st ed.; Imprenta de la Universidad Central: Quito, Ecuador, 1937; Volume 1. [Google Scholar]
- Chalons, M.; Samandoroff, Y. El Porvenir Agropecuario de Las Galápagos; Ministerio de Agricultura: Guayaquil, Ecuador, 1937.
- Perry, R. The Galapagos Islands; Dodd, Mead and Company: New York, NY, USA, 1972. [Google Scholar]
- Maignan, S. En El Archipiélago de Colon: Sostener El Sector Agropecuario Para Garantizar La Conservación de Un Patrimonio Natural Único. In Mosaico Agrario: Diversidades y Antagonismos Socio-Económicos en el Campo Ecuatoriano, 1st ed.; Vaillant, M., Cepeda, D., Gondard, P., Zapatta, A., Meunier, A., Eds.; SIPAE-IRD-IFEA; 2007; pp. 268–292. ISBN 978-9978-45-810-5. [Google Scholar]
- Fischer, J.; Zerger, A.; Gibbons, P.; Stott, J.; Law, B.S. Tree Decline and the Future of Australian Farmland Biodiversity. Proc. Natl. Acad. Sci. USA. 2010, 107, 19597–19602. [Google Scholar] [CrossRef] [Green Version]
- Taylor, J.E.; Hardner, J.; Stewart, M. Ecotourism and Economic Growth in the Galapagos: An Island Economy-Wide Analysis. Environ. Dev. Econ. 2009, 14, 139–162. [Google Scholar] [CrossRef] [Green Version]
- Miller, B.W.; Breckheimer, I.; McCleary, A.L.; Guzmán-Ramirez, L.; Caplow, S.C.; Jones-Smith, J.C.; Walsh, S.J. Using Stylized Agent-Based Models for Population-Environment Research: A Case Study from the Galápagos Islands. Popul. Environ. 2010, 31, 401–426. [Google Scholar] [CrossRef] [Green Version]
- Burbano, D.V.; Meredith, T.C. Effects of Tourism Growth in a UNESCO World Heritage Site: Resource-Based Livelihood Diversification in the Galapagos Islands, Ecuador. J. Sustain. Tour. 2021, 29, 1270–1289. [Google Scholar] [CrossRef]
- Celata, F.; Sanna, V.S. The Post-Political Ecology of Protected Areas: Nature, Social Justice and Political Conflicts in the Galápagos Islands. Local Environ. 2012, 17, 977–990. [Google Scholar] [CrossRef]
- Walsh, S.J.; Mena, C.F. Perspectives for the Study of the Galapagos Islands: Complex Systems and Human–Environment Interactions. In Science and Conservation in the Galapagos Islands. Social and Ecological Interactions in the Galapagos Islands, 1st ed.; Walsh, S., Mena, C., Eds.; Springer Nature Switzerland AG: Cham, Switzerland, 2013; Volume 1, pp. 49–67. ISBN 9781461457930. [Google Scholar] [CrossRef]
- Toral-Granda, M.V.; Causton, C.E.; Jager, H.; Trueman, M.; Izurieta, J.C.; Araujo, E.; Cruz, M.; Zander, K.K.; Izurieta, A.; Garnett, S.T. Alien Species Pathways to the Galapagos Islands, Ecuador. PLoS ONE 2017, 12, e0184379. [Google Scholar] [CrossRef] [Green Version]
- Laso, F. Galapagos Is a Garden. In Land Cover and Land Use Change on Islands Social & Ecological Threats to Sustainability, 1st ed.; Walsh, S., Riveros-Iregui, D., Arce-Nazario, J., Page, P., Eds.; Springer Nature Switzerland AG: Cham, Switzerland, 2020; pp. 137–166. ISBN 978-3-030-43973-6. [Google Scholar]
- Sampedro, C.; Pizzitutti, F.; Quiroga, D.; Walsh, S.J.; Mena, C.F. Food Supply System Dynamics in the Galapagos Islands: Agriculture, Livestock and Imports. Renew. Agric. Food Syst. 2020, 35, 234–248. [Google Scholar] [CrossRef]
- Urquía, D.; Gutierrez, B.; Pozo, G.; Pozo, M.J.; Torres, M.D.L. Origin and Dispersion Pathways of Guava in the Galapagos Islands Inferred through Genetics and Historical Records. Ecol. Evol. 2021, 11, 15111–15131. [Google Scholar] [CrossRef] [PubMed]
- Renteria, J.L.; Atkinson, R.; Crespo, C.; Gardener, M.R.; Grosholz, E.D. Challenges for the Management of the Invasive Blackberry (Rubus Niveus) in the Restoration of the Scalesia Forest in the Galapagos Islands. Invasive Plant Sci. Manag. 2021, 14, 20–28. [Google Scholar] [CrossRef]
- Albuja, I. Use of Molecular Markers to Describe the Invasion History of Cedrela Odorata, L. in Galapagos, Ecuador; Universidad San Francisco De Quito: Quito, Ecuador, 2021. [Google Scholar]
- Jäger, H.; Kowarik, I.; Tye, A. Destruction without Extinction: Long-Term Impacts of an Invasive Tree Species on Galápagos Highland Vegetation. J. Ecol. 2009, 97, 1252–1263. [Google Scholar] [CrossRef]
- Jäger, H. Quinine Tree Invasion and Control in Galapagos: A Case Study. In Understanding Invasive Species in the Galapagos Islands. Social and Ecological Interactions in the Galapagos Islands, 1st ed.; Torres, M., Mena, C., Eds.; Springer Nature Switzerland AG: Cham, Switzerland, 2018; pp. 69–76. [Google Scholar] [CrossRef]
- Gardener, M.R.; Atkinson, R.; Rentería, J.L. Eradications and People: Lessons from the Plant Eradication Program in Galapagos. Restor. Ecol. 2010, 18, 20–29. [Google Scholar] [CrossRef]
- Rivas-Torres, G.; Adams, D.C. A Conceptual Framework for the Management of a Highly Valued Invasive Tree in the Galapagos Islands. In Understanding Invasive Species in the Galapagos Islands. Social and Ecological Interactions in the Galapagos Islands, 1st ed.; Torres, M., Mena, C., Eds.; Springer Nature Switzerland AG: Cham, Switzerland, 2018; pp. 193–217. ISBN 978-3-319-67177-2. [Google Scholar] [CrossRef]
- Brewington, L. Stakeholder Perceptions of Invasive Species and Participatory Remote Sensing in the Galapagos Islands. In Understanding Invasive Species in the Galapagos Islands. Social and Ecological Interactions in the Galapagos Islands, 1st ed.; Torres, M., Mena, C., Eds.; Springer Nature Switzerland AG: Cham, Switzerland, 2018; pp. 175–192. ISBN 978-3-319-67177-2. [Google Scholar] [CrossRef]
- Khatun, K. Land Use Management in the Galapagos: A Preliminary Study on Reducing the Impacts of Invasive Plant Species through Sustainable Agriculture and Payment for Ecosystem Services. L. Degrad. Dev. 2018, 29, 3069–3076. [Google Scholar] [CrossRef]
- Walentowitz, A.; Manthey, M.; Preciado, M.B.B.; Chango, R.; Sevilla, C.; Jäger, H. Limited Natural Regeneration of Unique Scalesia Forest Following Invasive Plant Removal in Galapagos. PLoS ONE 2021, 16, e0258467. [Google Scholar] [CrossRef]
- Jaramillo, P.; Lorenz, S.; Ortiz, G.; Cueva, P.; Jiménez, E.; Ortiz, J.; Rueda, D.; Freire, M.; Gibbs, J. Galápagos Verde 2050: Una Oportunidad Para La Restauración de Ecosistemas Degradados y El Fomento de Una Agricultura Sostenible En El Archipiélago; 2015; ISBN 9789942857101. Available online: https://www.galapagos.org/wp-content/uploads/2015/08/InformeGalapagos_2013-2014-19-Jaramillo-article.pdf (accessed on 10 April 2022).
- Rivas-Torres, G.F.; Benítez, F.L.; Rueda, D.; Sevilla, C.; Mena, C.F. A Methodology for Mapping Native and Invasive Vegetation Coverage in Archipelagos: An Example from the Galápagos Islands. Prog. Phys. Geogr. Earth Environ. 2018, 42, 83–111. [Google Scholar] [CrossRef] [Green Version]
- Sampedro, C.; Mena, C.F. Remote Sensing of Invasive Species in the Galapagos Islands: Comparison of Pixel-Based, Principal Component, and Object-Oriented Image Classification Approaches. In Understanding Invasive Species in the Galapagos Islands. Social and Ecological Interactions in the Galapagos Islands, 1st ed.; Torres, M., Mena, C., Eds.; Springer Nature Switzerland AG: Cham, Switzerland, 2018; pp. 155–174. eISBN 978-3-319-67177-2. [Google Scholar] [CrossRef]
- Toledo, A. Rentabilidad de la producción agrícola en Santa Cruz, Galápagos. In Ensayos Económicos Del Sector Agrícola de Galápagos, 1st ed.; Viteri, C., Darwin, F.C., Eds.; Conservación Internacional Ecuador y Ministerio de Agricultura Ganadería Acuacultura y Pesca: Santa Cruz Galápagos, Ecuador, 2019; pp. 8–48. [Google Scholar]


| Name of the Station | Lat | Long | Z (m) | Years Functioning | Mean Annual Rainfall (mm) | Mean Annual Temperature (°C) |
|---|---|---|---|---|---|---|
| Seymour-Airport | 0°25′ S | 90°16′ W | 16 | 1963–1982 | 122 | 25 |
| Charles Darwin—INAMHI | 0°44′ S | 90°50′ W | 6 | 1964–now | 332 | 24 |
| Bellavista—Isla Sta. Cruz | 0°41′ S | 90°19′ W | 194 | 1964–now | 950 | 23 |
| Sta. Rosa—Galápagos | 0°39′ S | 90°18′ W | 184 | 1978–1983 | 697 | n.d. |
| Description | Date | Source | Resolution (cm) |
|---|---|---|---|
| Land cover maps | 1961 | Trueman et al. (2013) [76] | 1/100,000 |
| 1985 | PRONAREG-ORSTOM [77] | 1/100,000 | |
| 2007 | CLIRSEN [78] | 1/50,000 | |
| 2012 | SENPLADES [79] | 1/5000 | |
| 2018 | Lasso et al. (2020) [80] | 1/18,000 | |
| Aerial photographs | 1959 | Instituto Geografico Militar [81] | 1/50,000 |
| 1960 | Instituto Geografico Militar [82] | 1/50,000 | |
| 1963 | Instituto Geografico Militar [83] | 1/50,000 | |
| 1985 | Instituto Geografico Militar [84] | 1/60,000 | |
| 2007 | Instituto Geografico Militar [85] | 1/30,000 | |
| 2012 | SIGTIERRAS [86] | 1/5000 |
| Name | Description |
|---|---|
| Agricultural land | Rural agricultural land including vegetable fields, orchards, coffee plantations (Coffea arabica), pasture (Penisetum purpureum or Penicum maximun), farms, and rural centers. |
| Natural forest | Forests with a dominance of native tree species such as Scalesia pedunculata, Bursera graveolens, Unchair tomentosa, and Psidium galapageium. |
| Natural shrubland | Shrubland with native plants (up to 3 m height) such as Cyathea Weatherbyana, Miconia robinsoniana, and Caesalpinia bonduct |
| Natural grassland | Grassland with native grasses such as Paspalum longepedunculatum, Paspalum pinicillatum, and Calamagrostis pumila. |
| Invasive species | Areas covered by non-native species such as blackberries (Rubus niveus), guayaba (Psidium guajava), quinine (Cinchona Pubescens), and cedar (Cedrela odorata). |
| Land Cover Change Attributed to Different Trajectories (%) | Amount of Land Cover Change (ha/Year) | |||||||
|---|---|---|---|---|---|---|---|---|
| 1961 to 1985 | 1985 to 2007 | 2007 to 2012 | 2012 to 2018 | 1961 to 1985 | 1985 to 2007 | 2007 to 2012 | 2012 to 2018 | |
| Agricultural expansion | 56.9 | 16.1 | 1.0 | 1.6 | 266.7 | 75.4 | 4.9 | 7.8 |
| Forest degradation | 1.7 | <0.1 | 0.6 | 0.0 | 7.8 | 0.1 | 3.0 | 0.0 |
| Invasive species expansion | 0.0 | 18.8 | 1.9 | 12.9 | 0.0 | 88.3 | 8.7 | 60.6 |
| Invasive species control | 0.0 | 0.0 | 0.3 | 3.8 | 0.0 | 0.0 | 1.4 | 17.7 |
| Restoration | 0.0 | 0.0 | 0.0 | 3.2 | 0.0 | 0.0 | 0.0 | 15.1 |
| No change | 41.5 | 65.1 | 96.2 | 78.4 | ||||
| Total | 100 | |||||||
Publisher’s Note: MDPI stays neutral with regard to jurisdictional claims in published maps and institutional affiliations. |
© 2022 by the authors. Licensee MDPI, Basel, Switzerland. This article is an open access article distributed under the terms and conditions of the Creative Commons Attribution (CC BY) license (https://creativecommons.org/licenses/by/4.0/).
Share and Cite
Alomía Herrera, I.; Paque, R.; Maertens, M.; Vanacker, V. History of Land Cover Change on Santa Cruz Island, Galapagos. Land 2022, 11, 1017. https://doi.org/10.3390/land11071017
Alomía Herrera I, Paque R, Maertens M, Vanacker V. History of Land Cover Change on Santa Cruz Island, Galapagos. Land. 2022; 11(7):1017. https://doi.org/10.3390/land11071017
Chicago/Turabian StyleAlomía Herrera, Ilia, Rose Paque, Michiel Maertens, and Veerle Vanacker. 2022. "History of Land Cover Change on Santa Cruz Island, Galapagos" Land 11, no. 7: 1017. https://doi.org/10.3390/land11071017