Article

Relationships between Near-Surface Horizontal Dust Fluxes and Dust Depositions at the Centre and Edge of the Taklamakan Desert

1
Institute of Desert Meteorology, China Meteorological Administration, Urumqi 830002, China
2
National Observation and Research Station of Desert Meteorology, Taklimakan Desert of Xinjiang, Urumqi 830002, China
3
Xinjiang Key Laboratory of Desert Meteorology and Sandstorm, Urumqi 830002, China
4
Key Laboratory of Tree-Ring Physical and Chemical Research, China Meteorological Administration, Urumqi 830002, China
5
Taklimakan Desert Meteorology Field Experiment Station, China Meteorological Administration, Urumqi 830002, China
6
Key Laboratory of Meteorological Disaster, Ministry of Education (KLME), School of Atmospheric Science, Nanjing University of Information Science & Technology, Nanjing 210044, China
*
Author to whom correspondence should be addressed.
Land 2022, 11(7), 959; https://doi.org/10.3390/land11070959
Submission received: 25 May 2022 / Revised: 17 June 2022 / Accepted: 20 June 2022 / Published: 21 June 2022
(This article belongs to the Section Land – Observation and Monitoring)

Abstract

:
The emission, transport, and deposition of dust are frequently the focus of dust aerosol studies. However, owing to limited observation data, few studies have examined the relationships between the key parameters of dust transport, especially in typical dust source areas. Therefore, investigating the relationship between near-surface horizontal dust fluxes and dust depositions in typical desert source areas can further help us to understand the movement and transport patterns of dust aerosols. Based on observational experiments on two key transport parameters, this study focused on the quantitative relationship between the horizontal dust flux (Q) and dust deposition (D). A 13-month long dust sample collection experiment was conducted from August 2017 to August 2018 at Xiaotang Station (hereafter XT,40°48′ N, 84°18′ E) and Tazhong Station (hereafter TZ, 39°00′ N, 83°40′ E). The results show that the observed D and Q peaks coincided with periods of high dust storm incidence, with the greatest accumulation observed in spring. Moreover, both Q and D decreased with increasing height in XT, and this phenomenon remained on a monthly scale. In contrast, no clear decreasing pattern in Q and D with increasing height was observed in TZ. Additionally, relatively coarse particles, primarily from local sources, dominated dust depositions in both locations. The proportion of deposited dust particles with a size <20 μm was slightly higher in XT than that in TZ. Specifically, dust depositions in XT contained finer local dust particles and more dust from long-distance transport. Furthermore, D and Q had a significantly positive linear correlation in XT; however, no significant correlation was observed in TZ. Analysis of the wind dynamics and surface dust particle size indicated that topographic differences between the two stations caused these differences in correlation.

1. Introduction

Sandstorm and other dust severe weather can cause dust residence in the atmosphere and bring certain negative effects to the environment. Furthermore, strong dust transport causes long-term climate effects, resulting in regional and even global climate and environmental changes [1,2,3,4,5]. Meanwhile, the transport of dust particles poses a serious threat to human health [6]. Therefore, more academic focus on dust transport, especially the details of transport parameters, is needed. Horizontal dust transport is the one of most important parameters for consideration in dust transport research, and the accurate assessment of horizontal dust transport is helpful to improve the quantitative understanding of dust transport and provide data support for the revision of key parameters of a sand and dust storm numerical model [7,8,9,10,11]. Deserts and desertified land are among the most significant sources of airborne dust. Therefore, how the transport process or key parameters of sand in the dust source area evolve needs to be explored; of course, this needs the support of scientific experiments and data.
Deserts and desertified land are important sources of sand and dust in the atmosphere, and the activity of dust and sand materials in the near-surface layer is a complex interconnected process. Previous studies indicate that dust activity in the near-surface layer comprises three complex interconnected processes: emission, transport, and deposition [12,13,14,15,16,17]. The dust emission process includes dust initiation and emission volume. The transport process involves gradient changes in transport height, horizontal flux, and dust deposition volume; the deposition process involves the dust deposition rate and volume [18]. There are many studies on dust activity in the near-surface layer in foreign countries, and progress has been made in the near surface sand dust concentration, horizontal flux and dust depositions volume [18,19,20,21,22]. However, there are few studies on horizontal dust transport in the near-surface layer, and the observation height of previous studies is relatively low, generally at 0–5 m near the surface [8,12,23], which inspired us; in this study, an innovative observational experiment was designed to evaluate the variability of the near-surface vertical gradient of dust deposition and horizontal dust transport at two sites in the Taklimakan Desert. In this observational experiment, the key parameters in the process of dust transport and deposition were obtained, and further, the relationship between Q and D was established to explain the internal link between them.
The study of the horizontal dust flux and amount of dust deposition is important to elucidate dust distribution characteristics in the near-surface layer. Currently, recent studies have focused on this issue and elaborated important research results. Chepil found that the magnitude of the horizontal dust flux was largely determined by surface conditions, such as surface roughness, soil type, and soil looseness [23]. However, when the conditions of the underlying surface remained stable, the horizontal dust flux at a fixed height increased as the distance it travelled across farmland increased [24,25]. Regarding the variation in horizontal dust flux with height, many researchers found that the transport flux declined sharply with increased height and proposed various distribution equations for dust flux versus height, which were primarily exponential functions [26,27,28,29,30] and power functions [31,32]. The latest research results of horizontal dust flux also include methods and verifications of empirical formulas with new data, and effects of weather and climate; experiments [33,34,35,36,37,38], such as the method of estimating low-frequency variations in the density of turbulent dust-aerosol fluxes over hyper-arid, arid, semi-arid and lake dried beds, have been proposed based on measurement data on aerosol-particle concentrations and the vertical wind velocity component [33]. Zhang et al. [34] studied the distribution of biological soil crust in sand and dust storm source areas of Central and East Asia using moderate resolution imaging spectroradiometer satellite (MODIS) surface reflectance data collected in 2000–2019 to determine its potential impact on dust emission according to two empirical schemes. Meanwhile, scholars also conducted research on horizontal dust fluxes in China. Zhao et al. [39] investigated the horizontal dust fluxes for three typical underlying surfaces (desert, desert–oasis transition zone, and oasis) in Minqin, and they concluded that horizontal dust fluxes in deserts and transition zones showed a significant decreasing trend with increasing height, whereas horizontal dust fluxes in oases displayed a gradual increase with increasing height. The change in horizontal dust fluxes with height for these three surfaces uniformly followed a strict power function relationship. The horizontal dust fluxes in the desert–oasis transition zones and oases were 42% and 74% less than that in the desert, respectively. Aeolian dust samplers were mounted at 15 heights on a 50 m monitoring tower in Minqin in May 2007 to monitor the horizontal dust flux [9]. Similarly, the variation of near surface horizontal dust flux with height in the southeast of Tengger Desert can be expressed by power function fitting [40].Yang et al. [41] and Yang et al. [12,42] investigated horizontal dust fluxes during dust storms in three areas of the Taklamakan Desert, specifically TZ in the central desert, XT in the northern transition zone, and Cele on the southern margin; they showed that the variation within a height range from 0 to 200 cm was adequately fitted using a power function. Luo et al. explored wind speeds and dust deposition characteristics in the near-surface layer at the north-eastern edge of the Ulan Buh Desert and found that the horizontal dust flux and dust deposition in the near-surface layer in transition zones and oases decreased with increasing height. However, the above-mentioned observations primarily focused on specific measurements of a particular dust event, and thus lacked a continuous analysis of dust accumulation throughout the year. Moreover, these observations were obtained at a relatively low altitude; therefore, the results cannot adequately explain the variations in horizontal dust fluxes and dust depositions throughout the near-surface layer. Moreover, dust transport is influenced by both weather processes and underlying surface conditions (soil composition, vegetation cover, topography, etc.) [43,44,45,46]. Therefore, variability inevitably exists among the horizontal dust fluxes in different regions.
In summary, investigations regarding dust emission, transport, and deposition mainly focus on estimating the amount of dust emission from the ground surface, the mechanisms of dust emission and the influencing factors, simulating the processes and calculating the total amount of dust transport at high levels, and dust deposition [8,18,19,20,21,41,42]. However, the research on dust aerosol emissions in this region mainly focuses on emissions from dusty weather in the Taklimakan Desert [47,48,49,50], without considering the details of sand rising and dust falling in the near-surface layer of the desert source area. As an important link of dust aerosol transmission from the ground to the atmospheric boundary layer, the near-surface layer is still lacking research on the structure due to difficulties in obtaining data during disastrous dust storm over the dust source area, which is an important segment of dust transport in the horizontal and vertical directions. We ignore the effect of the natural undulating state of sand dunes at the dust source on the transport process of dust particles, exhibiting the uncertainty of the dust transport parameters, such as horizontal dust flux, and restricting the calculation accuracy of the numerical model. Therefore, in this study, we paid special attention to the vertical variation of horizontal dust flux and dust depositions as well as their relationship in dust storms near the surface of the dust source area. The results can provide new scientific information on the distribution and transport of dust aerosols in the desert flat and natural dune state and, furthermore, provide scientific reference for the improvement of dust parameters in the numerical model forecasting of dust storms.
The present study is as follows. Section 2 describes the study area and the experimental design. Based on the experimental data, Section 3 describes the vertical distribution of horizontal dust fluxes and dust depositions, properties of the underlying surfaces, particle size composition during dust depositions, relationship between horizontal dust fluxes and dust depositions, and wind dynamic analysis. Finally, the discussion and conclusions are presented in Section 4 and Section 5, respectively.

2. Experimental Design, Sample Collection, and Data Acquisition

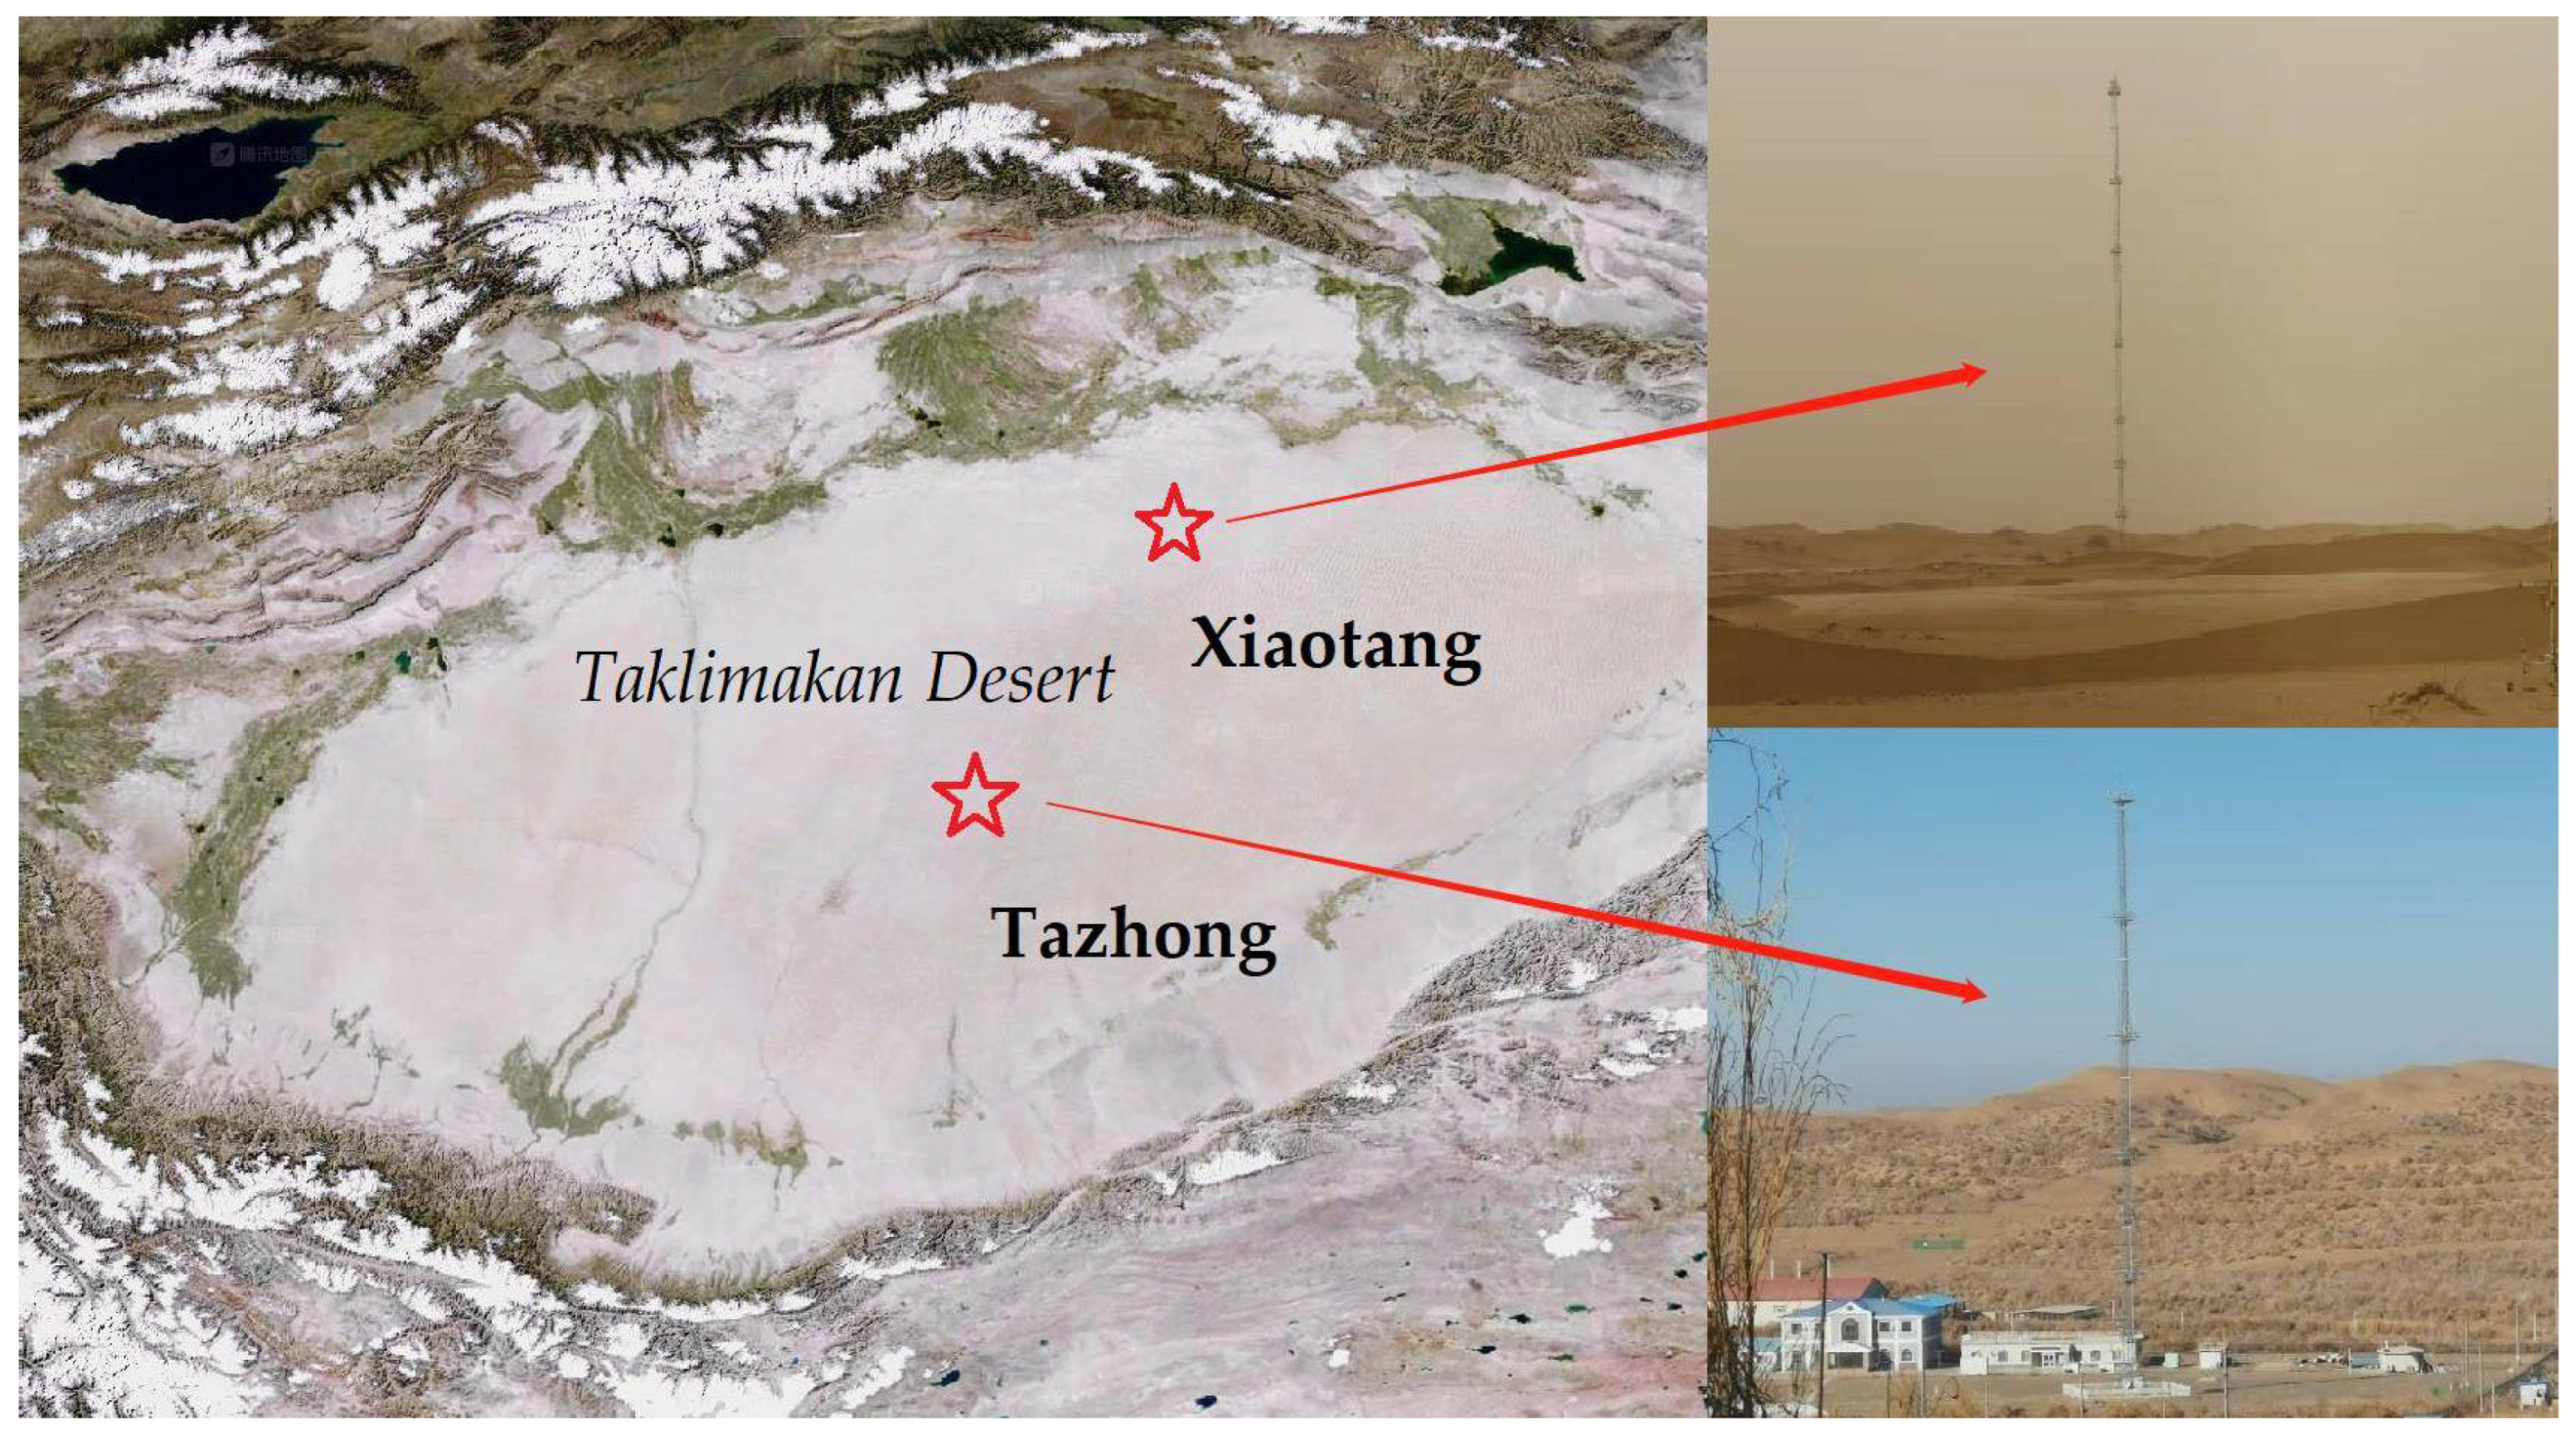
2.1. Experimental Design

Two stations (Figure 1) were selected to represent a typical, relatively flat desert and undulating desert terrain; these were the XT Station, on the northern margin of the Taklamakan Desert, and the TZ Station, in the hinterlands of the Taklamakan Desert [51]. The 100 m gradient observation in XT and the 80 m gradient observation system in TZ were carried out simultaneously. The sand and dust sample collection included Q and D. A 13-month long dust sample collection experiment was conducted from August 2017 to August 2018 at these stations and is detailed in Table 1.

2.2. Sample Collection and Measurement

The Big Spring Number Eight (BSNE) dust collectors were deployed on platforms composed of seven layers (Table 1), with a height of 80 m in TZ and 100 m in XT, to form a dust gradient observation and collection system, which was used to collect dust samples during dust storms to determine the horizontal dust flux. The particle size characteristics of the dust samples were analyzed in the laboratory. The BSNE dust collectors used for the horizontal dust flux determination conformed to commonly used international standards regarding the size, appearance, and dimensions of the dust inlet. At the beginning of the test, the operators inspected the dust collection system at each layer and height and cleaned the dust collection boxes. During the day after each dust storm, when wind speeds dropped below 5 m/s (to ensure the safety of operators), the dust aerosol samples were retrieved and placed in sealed bags. To reduce errors, the bags were weighed and marked prior to collection events. Then, the sand collection boxes were cleaned again. Weighing was completed on site to avoid weight errors caused by wear and tear of the sealed bags during transport and to ensure the accuracy of the data. After collection, the dust samples were measured in a dust particle size laboratory using a Mastersizer-2000 laser particle-size analyzer from Malvern, UK, with a measurement range of 0.02 to 2000 μm. The data obtained consisted of particle size, proportion of particles of each size, median particle size, standard deviation of particle size, kurtosis and skewness of particle size, etc.

2.3. Standard for Particle Size Classification

The particle size classification criteria of the study were as follows: <1.0 μm, 1.0–2.5 μm, 2.5–10 μm, 10–20 μm, 20–50 μm, 50–100 μm and >100 μm. The median particle size in the study area was about 100 μm [52]. Particles larger than 100 μm were considered coarse particles. Aircraft observations during dust storms [53,54,55] suggest that particles smaller than 20 μm are the major components in the dust transported to the upper air. Therefore, 20 μm is also an important classification standard. Additionally, in environmental monitoring, PM1, PM2.5, and PM10 are common aerosol fine particle classifications.

2.4. Sample Size Description

The test period of dust deposition was from August 2017 to August 2018, and the cumulative amount was collected at the XT and TZ observation points, respectively, at the end of each month, a total of 26 times. During the sampling period, a total of 21 samples were collected once sandstorm occurred, with 10 layers at each observation point, and a total of 470 samples were collected at the two observation points. The collection cycle of horizontal dust flux was consistent with the dust deposition and had the same total number of samples.

3. Analysis of the Results

3.1. Q and D of Horizontal and Vertical Variation Law in the Near-Surface Layer

Based on the observation data, Figure 2 presents the variations in accumulated D and Q in the vertical direction over time at XT and TZ from August 2017 to August 2018. This provides a visual representation of the variations in the near-surface layer D and Q values at each level on a monthly scale at the two observation sites. The values in autumn and winter are represented by cool colors, which means that Q and D are lower value periods. The values in spring and summer are represented by warm colors, which means that Q and D are higher. This is related to the occurrence cycle of dusty weather in the Taklimakan Desert.
First, taking time as the observation axis, the near-surface layer D and Q at each level in XT reached an annual maximum during spring, specifically May. The maximum occurred at a height of 1 m with a monthly accumulation of approximately 30.0 g for D and over 170 g for Q. Minimal values occurred during winter, specifically December, when both monthly accumulations were approximately 3.0 g. The yearly trend was as follows: D gradually decreased after August 2017, and then dropped substantially in October. Monthly accumulations slowly increased after March and peaked in May, followed by a significant decrease in D. Both the D and Q accumulations during spring were an order of magnitude higher than those during winter, with the monthly Q accumulation being particularly pronounced. The temporal trends in both accumulations at TZ throughout the year were consistent with those at XT, with the maximum values occurring in May, at 18.1 g and 36.8 g for D and Q, respectively, and the minimum values appearing in February, at approximately 3.0 g.
Secondly, from the vertical direction, the vertical analysis for both the monthly and annual accumulation showed a clear decreasing trend with increasing height for both D and Q accumulation in all layers at XT, with a particularly prominent decrease for the near-surface layers below a height of 32 m. This trend was not clearly seen in the annual accumulations at TZ, where D peaked at 1 m and then fluctuated with altitude. Nevertheless, when the altitude increased beyond 16 m, D gradually declined. The vertical distribution of Q was rather complex, with the maximum appearing at 47 m. The monthly accumulation also exhibited a decrease–increase–decrease pattern with increasing altitude.

3.2. Characteristics of Particle Size Transport in Dust Storm Process

The interval distribution of dust particle sizes, also known as the differential or frequency distribution, represents the percentage of particles of each particle size interval in a series; this is an important physical property of an underlying surface that influences the variation in Q during dust storms [52]. Dust storms happened frequently during the spring of 2018. Interval distribution was concurrently measured from four dust storms at both sites (27 April, 7 May, 24 May, and 31 May) (Figure 3). Because these four processes are systemic weather-induced dust storms, and the dust storms occur at the same time period at the XT station and TZ station, they are thus more representative. During most of the dust storms, more than 80% of the dust deposition in XT and more than 90% of that in TZ consisted of sand particles with a particle size >50 μm. During each dust storm, more sand particles with a particle size <50 μm were collected at XT than at TZ. In particular, during the 24 May event, the dust deposition at XT was concentrated in the intervals of 2.5–10 μm, 10–20 μm, and <50 μm, whereas the dust deposition at TZ was dominated by sand particles >50 μm, which accounted for over 80% of the total deposition. Dust storms are one of the most important weather processes for the long-distance transport of dust. Some scholars have pointed out that fine particles at <20 μm in size may have originated from long-distance transport and deposition, while relatively coarse particles were deposited by local transport processes [56]. However, it was observed that the proportion of XT fine particles is larger than TZ, which indicates that XT dust particles contained a higher content of dust from long-distance transport, while TZ is relatively low.

3.3. Correlation Analysis of Near-Surface Dust Depositions and Horizontal Dust Fluxes

The Taklimakan Desert is one of the most important dust source areas of sandstorms. Q and D are some of the most important parameters in the process of dust particle transport or depositions. If the empirical conversion relationship between Q and D can be established by the data obtained from field observation, then they can be derived from each other. A positive correlation between Q and D has been found in previous studies, and the two variables can be converted to each other according to linear functions [22]. Correlation analysis was conducted on the annual Q and D accumulations at equal heights for both the XT and TZ stations. Figure 4 reveals a significantly positive linear correlation between D and Q at XT, at the margin of the desert (p < 0.001), with a coefficient of determination (R2) of 0.9627 and a conversion relationship as follows:
D = 0.12 Q + 67.53,
An interesting phenomenon is that the observation results of Q and D in XT on the northern edge of the Taklimakan Desert show an ideal positive correlation (based on annual accumulation), but there is no significant correlation between Q and D in the center of the Taklimakan Desert. Why there are different observation results in the same desert has aroused our thinking. A preliminary explanation is given in the discussion section. At the same time, in order to further confirm the correctness of our observation results, the correlation between Q and D in the XT monthly accumulation on the northern edge of Taklimakan desert is given (Figure 5), in which R2 is 0.7079. Therefore, it can further prove that our observation results have high reliability.

3.4. Analysis of the Vertical Distribution of Near-Surface Dust Depositions and Horizontal Fluxes of Sand and Dust in Relation to Maximum Horizontal Wind Speed

Four sandstorms that occurred simultaneously in XT and TZ were selected. The maximum horizontal wind speed is the maximum ten-minute horizontal wind speed when the sandstorm occurs. As with Q and D, it was taken from the level 10 observation altitude. The maximum horizontal wind speed during the four dust processes is used for comparative analysis in Figure 6. These four processes are systemic weather-induced dust storms, and the dust storms occurred in the same time period at XT station and TZ station, so they are more representative.
Generally, D and Q are positively correlated. However, factors such as atmospheric dynamics and topography during a dust storm tend to significantly reduce this correlation [22]. Previous studies have confirmed the correlation between horizontal wind speed and Q [55], and Q is the dominant factor for D. Hence, it is necessary to analyze whether wind dynamics influence the relationship between Q and D. To investigate the cause of the significant difference between the D and Q relationships at the two stations, the dynamic weather factors during dust storms at the two stations were examined. Figure 5 displays the variations in Q and D and maximum wind speed with altitude for four dust storm events at both stations (see Section 3.2). Figure 6 shows that the maximum horizontal wind speed at XT was greater than that at TZ during the same storms. The maximum horizontal wind speed profiles at both stations were consistent with the exponential function for horizontal wind speed within the atmospheric boundary layer, i.e., high friction and low wind speed near the surface and vice versa in the upper atmosphere. This analysis indicated that dynamic wind conditions were not the primary influencing factor on the correlation between Q and D.
Nevertheless, the Q and D profiles at XT and TZ revealed substantial differences. First, the Q and D value in XT gradually decreased with height, reflecting a power function; this feature was shared by all of the dust storm processes. However, at TZ, they did not show a clear decreasing pattern across layers, and Q and D also had different patterns. Second, the Q value variation in TZ differed from that in XT as described below. The Q value decreased with height at the level of 2–8 m; Q increased with height in the range of 8–48 m; and the horizontal dust flux Q did not exhibit a significant variation trend with height at the level of 48–60 m. Thus, a clear positive linear correlation existed between Q and D at XT, whereas no clear pattern was observed at TZ (Figure 6). Huo et al., pointed out that this pattern is partly caused by the wind-driven sand-dust transport from the nearby natural dunes. This process is called the “secondary sand source” to illustrate the sand-dust transport process during dust storms in the desert where large dunes and valleys exist [57]. This indicates that the terrain change of natural sand dunes affects the vertical profile change of Q, and indirectly leads to the poor correlation between Q and D.

4. Discussion

Our analysis of the variations in near-surface D and Q with altitude and their relationships under different topographic conditions provided important insights for the study of dust transport. Section 3.3 shows that the relationship between D and Q at the XT station, located on flat terrain, was in line with previous findings of a positive linear correlation; however, no significant correlation was observed at TZ, a station located on undulating terrain. The trends in D and Q with height are analyzed in Section 3.1. They decreased across the layers, with D dominated by Q at XT, showing a clear positive correlation [22]. In contrast, no distinct pattern in D and Q variations with height was observed at TZ, which showed a more complex relationship between D and Q. Section 3.2 explains that the dust particle size distributions for D at both stations was generally dominated by coarse particles, and the physical properties of the corresponding underlying surfaces were similar. Section 3.4 reveals that the wind dynamic conditions were not the main factor impacting the correlation between Q and D. Therefore, the results of this study show that a significant positive correlation between D and Q existed in an area with flat terrain. In contrast, the area with complex terrain was impacted by topographical factors; hence, the positive correlation between D and Q was weakened or completely eliminated [9].
Based on individual cases, both Q and D at XT clearly decreased with altitude, whereas they did not show a similar pattern at TZ. This may have directly contributed to the findings that a significantly positive linear correlation between Q and D existed at XT, but no significant relationship was observed between the two variables at TZ. However, the similar underlying surface properties and wind dynamic conditions at both sites indicated that these aspects were not the main contributors to the correlation between Q and D. This in turn provided indirect confirmation that topographic conditions were the primary cause of the correlation between the two variables [57].
The scarcity of observations in dust source areas has constrained the development of dust storm models. Our team put tremendous effort into collecting valuable observation data from extremely harsh and challenging monitoring environments during dust storms. Although these data do not provide a sufficiently large sample, this field has been of concern to us since 2007, and this research will continue. At present, an empirical equation governing the relationship between D and Q over flat terrain of the Taklimakan Desert is as follows: D = 0.12 Q + 67.53.
The above empirical formula needs to be further verified by more experimental data that may originate from different desert Sharing observation data benefits research teams with the same research interests. We look forward to more cooperation in future. As next steps, we will continue similar observation in different regions, including the Gurbantunggut Desert in Northern Xinjiang, hoping to further verify the applicability of the research results.

5. Conclusions

In this study, based on the double gradient observation test in the central area and marginal area of the Taklimakan Desert, a total of 13 months of valuable observation data were obtained. There are two preliminary results. Firstly, a positive feedback relationship between D and Q was verified in the relatively flat desert area. We hope that all scholars concerned would continue to verify this empirical conversion relationship in other re-search areas of similar conditions. Secondly, the natural topographic relief of the desert affects the calculation of Q near the ground, the results of which further improve our detailed understanding of the key parameters of dust aerosol. The specific conclusions are as follows:
(1)
Throughout the year, the maximum values of D and Q at both stations occurred during spring, which had the highest dust storm frequency, and the lowest accumulation exists during winter. The monthly and annual accumulation of D and Q at XT showed a clear decreasing trend with increasing altitude; however, a similar trend was lacking at TZ. This was likely related to the distinct topographic differences between the two stations.
(2)
Coarse dust particles with a particle size >50 μm dominated in D at both locations and typically comprised over 80% of the total at XT and over 90% at TZ. Both stations received dust predominantly from local dust sources. In addition, more dust particles in the <50 μm range were collected at XT.
(3)
There was a significantly positive linear correlation between D and Q at XT; however, no significant correlation was observed at TZ. An empirical equation for the relationship between D and Q at XT was established to be D = 0.12 Q + 67.53. This equation is applicable to areas with flat terrain, such as XT, but not to areas with complex topographic features.

Author Contributions

Conceptualization, validation, investigation W.H.; writing—original draft, data analysis, writing—review and editing, M.S.; methodology, advice, X.Z.; formal analysis, advice, A.M.; experiment design, Q.H.; scientific tests, advice, Y.W., F.Y., M.M., C.Z. and X.Y. All authors have read and agreed to the published version of the manuscript.

Funding

This research was funded by the Xinjiang Natural Science Founds of China (2021D01A197), Fundamental scientific research business foundation of centrallevel public welfare scientific research institutes (IDM2021001), National Natural Science Foundation of China (41905009, 42030612 and 41875023) and Strategic Priority Research Program of the Chinese Academy of Sciences (XDA20100306).

Data Availability Statement

The data that support the findings of this study are available from the authors upon reasonable request.

Acknowledgments

We thank all those who participated in this experiment and all members of the desert meteorological boundary layer research team for their support.

Conflicts of Interest

The authors declare that they have no known competing financial interest or personal relationships that could have appeared to influence the work reported in this paper.

References

  1. Martin, R.L.; Kok, J.F.; Hugenholtz, C.H.; Barchyn, T.E.; Chamecki, M.; Ellis, J.T. High-frequency measurements of aeolian saltation flux: Field-based methodology and applications. Aeolian Res. 2018, 30, 97–114. [Google Scholar] [CrossRef] [Green Version]
  2. Valenzuela, A.; Olmo, F.J.; Lyamani, H.; Antón, M.; Quirantes, A.; Alados-Arboledas, L. Aerosol radiative forcing during african desert dust events (2005–2010) over southeastern Spain. Atmos. Chem. Phys. 2017, 12, 10331–10351. [Google Scholar] [CrossRef] [Green Version]
  3. Kosmopoulos, P.G.; Kazadzis, S.; Taylor, M.; Athanasopoulou, E.; Speyer, O.; Raptis, P.I.; Marinou, E.; Proestakis, E.; Solomos, S.; Gerasopoulos, E.; et al. Dust impact on surface solar irradiance assessed with model simulations, satellite observations and ground-based measurements. Atmos. Meas. Tech. 2017, 10, 2435–2453. [Google Scholar] [CrossRef] [Green Version]
  4. Schepanski, K. Transport of Mineral Dust and Its Impact on Climate. Geosciences 2018, 8, 151. [Google Scholar] [CrossRef] [Green Version]
  5. Yoshioka, M.; Mahowald, N.M.; Conley, A.J.; Collins, W.D.; Fillmore, D.W.; Zender, C.S.; Coleman, D.B. Impact of Desert Dust Radiative Forcing on Sahel Precipitation: Relative Importance of Dust Compared to Sea Surface Temperature Variations, Vegetation Changes, and Greenhouse Gas Warming. J. Clim. 2007, 20, 1445–1467. [Google Scholar] [CrossRef]
  6. Li, X.; Zhang, H.S. Size distributions of mineral aerosols and dust emission flux observed over Horqin Sandy Land area in northern China. Atmos. Chem. Phys. 2013, 13, 2671–2693. [Google Scholar] [CrossRef]
  7. McTainsh, G.; Strong, C. The role of aeolian dust in ecosystems. Geomorphology 2007, 8, 39–54. [Google Scholar] [CrossRef]
  8. Yang, X.; He, Q.; Ali, M.; Huo, W.; Liu, X. Near-surface sand-dust horizontal flux in Tazhong-the hinterland of the Taklimakan Desert. J. Arid Land 2013, 5, 199–206. [Google Scholar] [CrossRef] [Green Version]
  9. Dong, Z.B.; Man, D.Q.; Luo, W.Y.; Qian, G.Q.; Wang, J.H.; Zhao, M.; Liu, S.Z.; Zhu, G.Q.; Zhu, S.J. Horizontal aeolian sediment flux in the Minqin area, a major source of Chinese dust storms. Geomorphology 2010, 116, 58–66. [Google Scholar] [CrossRef]
  10. Luo, F.M.; Gao, J.L.; Liu, F.; Li, X.L.; Huang, Y.R.; Gegen, B.; Duan, R.B.; Xin, Z.M. Variation Characteristics Analysis of Near-Surface Dust Horizontal Flux and Dust Fall Amount in Northeast of Ulan Buh Desert. J. Agric. Sci. Technol. 2019, 21, 163–169. [Google Scholar] [CrossRef]
  11. Sofue, Y.; Hoshino, B.; Demura, Y.; Kai, K.; Baba, K.; Nduati, E.; Kondoh, A.; Sternberg, T. Satellite Monitoring of Vegetation Response to Precipitation and Dust Storm Outbreaks in Gobi Desert Regions. Land 2018, 7, 19. [Google Scholar] [CrossRef] [Green Version]
  12. Yang, X.; Zhou, C.; Yang, F.; Meng, L.; Huo, W.; Mamtimin, A.; He, Q. Saltation Activity on Non-Dust Days in the Taklimakan Desert, China. Remote Sens. 2022, 14, 2099. [Google Scholar] [CrossRef]
  13. Hu, T.F.; Wu, F.; Song, Y.P.; Liu, S.X.; Duan, J.; Zhu, Y.Q.; Cao, J.J.; Zhang, D.Z. Morphology and mineralogical composition of sandblasting dust particles from the Taklimakan Desert. Sci. Total Environ. 2022, 834, 155315. [Google Scholar] [CrossRef] [PubMed]
  14. Francis, D.; Chaboureau, J.P.; Nelli, N.; Cuesta, J.; Alshamsi, N.; Temimi, M.; Pauluis, O.; Xue, L. Summertime dust storms over the Arabian Peninsula and impacts on radiation, circulation, cloud development and rain. Atmos. Res. 2020, 250, 105364. [Google Scholar] [CrossRef]
  15. Kaveh, M.; Alireza, R.; Maurizio, S.; Dimitris, G.K.; Ali, D.B. A statistical approach for identification of dust-AOD hotspots climatology and clustering of dust regimes over Southwest Asia and the Arabian Sea. Atmos. Pollut. Res. 2022, 13, 101395. [Google Scholar] [CrossRef]
  16. Li, Y.; Song, Y.; Kaskaoutis, D.G.; Zhang, X.; Shukurov, N.; Chen, X.; Orozbaev, R. Atmospheric dust dynamics over Central Asia: A perspective view from loess deposits. Gondwana Res. 2022, 109, 150–165. [Google Scholar] [CrossRef]
  17. Wang, F.; Zhao, X.; Gerlein, S.C.; Mu, Y.; Wang, D.; Lu, Q. Global sources, emissions, transport and deposition of dust and sand and their effects on the climate and environment: A review. Front. Environ. Sci. Eng. 2017, 11, 13. [Google Scholar] [CrossRef]
  18. Chepil, W.S.; Woodruff, N.P. Sedimentary characteristics of dust storms 2, visibility and dust concentration. Am. J. Sci. 1957, 255, 12–22. [Google Scholar] [CrossRef]
  19. Gillette, D.A.; Fryrear, D.W.; Xiao, J.B.; Stockton, P.; Ono, D.; Helm, P.J.; Gill, T.E.; Ley, T. Large-scale variability of wind erosion mass flux rates at Owens Lake: 1. Vertical profiles of horizontal mass fluxes of wind-eroded particles with diameter greater than 50 μm. J. Geophys. Res. 1997, 102, 25977–25987. [Google Scholar] [CrossRef]
  20. Shao, Y.; Leslie, L.M. Wind erosion prediction over the Australian continent. J. Geophys. Res. Atmos. 1997, 102, 30091–30105. [Google Scholar] [CrossRef] [Green Version]
  21. Offer, Z.Y.; Goossens, D. Thirteen years of aeolian dust dynamics in a desert region (Negev desert, Israel): Analysis of horizontal and vertical dust flux, vertical dust distribution and dust grain size. J. Arid. Environ. 2004, 57, 117–140. [Google Scholar] [CrossRef]
  22. Zhang, Z.C.; Dong, Z.B.; Zhao, A.G. Variation characteristics of near-surface dust horizontal flux and deposition amount with height in the southeastern Tengger Desert. Res. Environ. Sci. 2010, 23, 165–169. [Google Scholar] [CrossRef]
  23. Chepil, W.S. Dynamics of wind erosion: V. Cumulative intensity of soil drifting across eroding fields. Soil Sci. 1946, 61, 257–263. [Google Scholar] [CrossRef]
  24. Fryrear, D.W. Soil losses by wind erosion. Soil Sci. Soc. Am. J. 1991, 59, 668–672. [Google Scholar] [CrossRef]
  25. Stout, J.E.; Zobeck, T.M. The wolfforth field experiment: A wind erosion study. Soil Sci. 1996, 161, 616–632. [Google Scholar] [CrossRef]
  26. Bagnol, R.A. The Physics of Blown Sand and Desert Dunes; Chapman and Hall Ltd. 1974: London, UK, 1941; p. 265. Available online: https://link.springer.com/content/pdf/bfm%3A978-94-009-5682-7%2F1.pdf (accessed on 15 April 2022).
  27. Chepil, R.A. Dynamics of wind erosion: Nature of movement of soil by wind. Soil Sci. 1945, 60, 305–320. Available online: https://journals.lww.com/soilsci/Citation/1945/10000/DYNAMICS_OF_WIND_EROSION__I__NATURE_OF_MOVEMENT_OF.4.aspx (accessed on 16 April 2022). [CrossRef]
  28. Williams, G. Some aspects of the eolian saltation load. Sedimentology 1964, 3, 257–287. [Google Scholar] [CrossRef]
  29. Fryrear, D.W.; Saleh, A. Field wind erosion: Vertical distribution. Soil Sci. 1993, 155, 294–300. Available online: https://journals.lww.com/soilsci/Abstract/1993/04000/Field_Wind_Erosion__Vertical_Distribution.8.aspx (accessed on 11 April 2022). [CrossRef]
  30. Greeley, R.; Blumberg, D.G. Field measurement of the flux and speed of wind-blown sand. Sedimentology 1996, 43, 41–52. [Google Scholar] [CrossRef]
  31. Nalpanis, P.; Hunt, G.C. Saltating particles over flat beds. J. Fluid Mech. 1993, 251, 661–685. [Google Scholar] [CrossRef]
  32. Nickling, W.G. Eolian sediment transport during duststorms: Slims River Valley, Yukon Territory. Can. J. Earth Sci. 1978, 15, 1069–1084. [Google Scholar] [CrossRef]
  33. Karpov, A.V.; Gorchakov, G.I.; Gushchin, R.A.; Datsenko, O.I. Vertical turbulent dust-aerosol fluxes. Izv. Atmos. Ocean. Phys. 2021, 57, 495–503. [Google Scholar] [CrossRef]
  34. Zhang, J.; Zhou, C.H.; Gui, H.L.; Zhang, X.Y. Biological crust in sand and dust storm source areas of asia and its impact on dust emission. Adv. Clim. Chang. Res. 2021, 12, 395–408. [Google Scholar] [CrossRef]
  35. Gebhardt, C.; Abuelgasim, A.; Fonseca, R.M.; Martín-Torres, J.; Zorzano, M.-P. Characterizing dust radiation feedback and refining the horizontal resolution of the marswrf model down to 0.5 degree. J. Geophys. Res. Planets 2021, 126, e2020JE006672. [Google Scholar] [CrossRef]
  36. Noh, S.Y.; Ji, J.H.; Kim, H.S.; Yook, S.J. Measurement of re-suspended road dust emission factor using mobile laboratory and flux tower. J. Mech. Sci. Technol. 2022, 36, 2611–2618. [Google Scholar] [CrossRef]
  37. Yang, L.; Hu, Z.; Huang, Z.; Wang, L.; Han, W.; Yang, Y.; Tao, H.; Wang, J. Detection of a Dust Storm in 2020 by a Multi-Observation Platform over the Northwest China. Remote Sens. 2021, 13, 1056. [Google Scholar] [CrossRef]
  38. Hu, Z.; Huang, J.; Zhao, C.; Jin, Q.; Ma, Y.; Yang, B. Modeling dust sources, transport, and radiative effects at different altitudes over the Tibetan Plateau. Atmos. Chem. Phys. 2020, 20, 1507–1529. [Google Scholar] [CrossRef] [Green Version]
  39. Zhao, M.; Zhan, K.J.; Yang, Z.H.; Fang, E.T.; Qiu, G.Y.; Wang, Q.Q.; Zhang, Y.C.; Guo, S.J.; Li, A.D.; Zhang, J.C. Characteristics of the lower layer of sandstorms in the Minqin desert-oasis zone. Sci. China Earth Sci. 2011, 41, 234–242. [Google Scholar] [CrossRef]
  40. Zhang, Z.C.; Dong, Z.B.; Zhao, A.G. The characteristics of aeolian sediment flux profiles in the south-eastern Tengger Desert. Sedimentology 2011, 58, 1884–1894. [Google Scholar] [CrossRef]
  41. Yang, X.; He, Q.; Ali, M.; Wen, H.; Strake, M. A Field Experiment on Dust Emission by Wind Erosion in the Taklimakan Desert. Acta Meteorol. Sin. 2012, 26, 241–249. [Google Scholar] [CrossRef]
  42. Yang, X.; Shen, S.; Yang, F.; He, Q.; Ali, M.; Huo, W.; Liu, X. Spatial and temporal variations of blowing dust events in the Taklimakan Desert. Theor. Appl. Climatol. 2015, 125, 669–677. [Google Scholar] [CrossRef]
  43. Luo, F.M.; Xin, Z.M.; Gao, J.L.; Hao, Y.G.; Ge, G.B.; Li, X. Characteristics of near-surface wind speed and sand-dust flux at northeast edge of Ulan Buh Desert. Trans. Chin. Soc. Agric. Eng. 2016, 32, 147–151. [Google Scholar] [CrossRef]
  44. Kaveh, M.; Maurizio, S.; Dimitris, G.K.; Alireza, R. Classification of synoptic weather clusters associated with dust accumulation over southeastern areas of the Caspian Sea (Northeast Iran and Karakum desert). Aeolian Res. 2022, 54, 100771. [Google Scholar] [CrossRef]
  45. Kaskaoutis, D.G.; Rashki, A.; Francois, P.; Dumka, U.C.; Houssos, E.E.; Legrand, M. Meteorological regimes modulating dust outbreaks in southwest Asia: The role of pressure anomaly and Inter-Tropical Convergence Zone on the 1–3 July 2014 case. Aeolian Res. 2015, 18, 83–97. [Google Scholar] [CrossRef]
  46. Xi, X.; Sokolik, I.N. Dust interannual variability and trend in Central Asia from 2000 to 2014 and their climatic linkages. J. Geophys. Res. Atmos. 2015, 120, 12175–12197. [Google Scholar] [CrossRef] [Green Version]
  47. Chen, S.Y.; Huang, J.P.; Kang, L.T.; Wang, H.; Ma, X.J.; He, Y.L.; Yuan, T.G.; Yang, B.; Huang, Z.W.; Zhang, G.L. Emission, transport, and radiative effects of mineral dust from the Taklimakan and Gobi Deserts: Comparison of measurements and model results. Atmos. Chem. Phys. 2017, 17, 1–43. [Google Scholar] [CrossRef] [Green Version]
  48. Liu, C.; Zhao, T.; Yang, X.; Liu, F.; Han, Y.; Luan, Z.; He, Q.; Rood, M.; Yuen, W. Observational study of formation mechanism, vertical structure, and dust emission of dust devils over the taklimakan desert, China. J. Geophys. Res. Atmos. 2016, 121, 3608–3618. [Google Scholar] [CrossRef] [Green Version]
  49. Meng, L.; Yang, X.H.; Zhao, T.L.; He, Q.; Lu, H.; Mamtimin, A.; Huo, W.; Yang, F.; Liu, C. Modeling study on three-dimensional dimensional distribution of dust aerosols during a dust storm over the Tarim Basin, Northwest China. Atmos. Res. 2019, 218, 285–295. [Google Scholar] [CrossRef]
  50. Zhang, X.Y.; Arimoto, R.; An, Z.S. Dust emission from Chinese desert sources linked to variations in atmospheric circulation. J. Geophys. Res. Atmos. 1997, 102, 28041–28047. [Google Scholar] [CrossRef]
  51. Yang, F.; He, Q.; Huang, J.P.; Ali, M.; Yang, X.H.; Huo, W.; Zhou, C.L.; Liu, X.C.; Wei, W.S.; Cui, C.X.; et al. Desert environment and climate observation network over the Taklimakan Desert. BAMS 2021, 102, 1–53. [Google Scholar] [CrossRef]
  52. Huo, W.; He, Q.; Yang, X.H.; Liu, X.C.; Ding, G.F.; Chen, Y.J. The research on grain size characteristic of desert in north of China. Res. Soil Water Conserv. 2011, 18, 6–11. [Google Scholar] [CrossRef]
  53. You, L.G.; Ma, P.M.; Chen, J.H.; Li, K. A case study of the aerosol characteristics in the lower troposphere during a dust storm event. J. App. Meteorol. Sci. 1991, 2, 13–21. (In Chinese) [Google Scholar]
  54. Genthon, C. Simulations of desert dust and sea-salt aerosols in Antarctica with a general circulation model of the atmosphere. Tellus. B. Chem. Phys. Meteorol. 1992, 44, 371–389. [Google Scholar] [CrossRef]
  55. Gillette, D.A. Environmental factors affecting dust emission by wind. In Sahara Dust; Morales, C., Ed.; Wiley: Chichester, UK, 1979; pp. 71–91. Available online: https://scope.dge.carnegiescience.edu/SCOPE_14/SCOPE_14_2.4_Gillette.pdf (accessed on 16 April 2022).
  56. Lin, Y.C.; Mu, G.J.; Chen, L.L.; Wu, C.N.; Xu, L.S. Sorting characteristics and its implication of the grain size of modern atmospheric dust deposition near the surface of the Cele Oasis, Xinjiang, China. J. Desert Res. 2022, 42, 139–146. [Google Scholar] [CrossRef]
  57. Huo, W.; He, Q.; Yang, F.; Yang, X.H.; Yang, Q.; Zhang, F.Y.; Ali, M.; Liu, X.C.; Wang, M.Z.; Zhao, Y.; et al. Observed Particle Sizes and Fluxes of Aeolian Sediment in the Near Surface Layer during Sand-Dust Storms in the Taklimakan Desert. Theor. Appl. Climatol. 2016, 130, 735–746. [Google Scholar] [CrossRef]
Figure 1. Locations and images of XT station and TZ station in the Taklamakan Desert (Star in the figure represents the position of TZ and XT stations).
Land 11 00959 g001
Figure 2. Monthly and annual accumulation of D and Q in XT and TZ from August 2017 to August 2018.
Land 11 00959 g002
Figure 3. Interval distribution of dust particle size (in %) for the dust particles collected in XT and TZ during the dust storm events on 27 April (a), 7 May (b), 24 May (c), and 31 May 2018 (d).
Land 11 00959 g003
Figure 4. Correlation analysis for D and Q in XT (a) and TZ (b) from August 2017 to August 2018.
Land 11 00959 g004
Figure 5. Correlation analysis for D and Q in XT monthly from August 2017 to August 2018.
Land 11 00959 g005
Figure 6. Q, D, and maximum wind speed (WS) profiles (in g or m/s, respectively) at each level at the XT (XT) and TZ (TZ) stations during the dust storm events on 27 April (a), 7 May (b), 24 May (c), and 31 May 2018 (d).
Land 11 00959 g006
Table 1. Introduction to observation systems at XT (100 m) and TZ (80 m).
Station Name (Observation System)Height/Depth (m)Observation VariablesSensorAcquisition Frequency (min)
XT
(100 m gradient observation system)
1, 2, 5, 10, 24, 32, 47, 63, 80, 100Gradient of the dust depositionsIOS Sand Sampler (Truwel, China)Collected once after each sandstorm process or once per month
Gradient of the horizontal dust fluxesBSNE Sand Sampler (Truwel, China)
Gradient of the wind speed and direction2-D Sonic Anemometer (Gill, UK)1 min
TZ
(80 m gradient observation system)
1, 2, 5, 8, 16, 24, 32, 47, 63, 80Gradient of the dust depositionsIOS Sand Sampler (Truwel, China)Collected once after each sandstorm process or once per month
Gradient of the horizontal dust fluxesBSNE Sand Sampler (Truwel, China)
Gradient of the wind speed and direction2-D Sonic Anemometer (Gill, UK)1 min
Publisher’s Note: MDPI stays neutral with regard to jurisdictional claims in published maps and institutional affiliations.

