Article

Identification of Urban Functional Areas and Their Mixing Degree Using Point of Interest Analyses

1
School of Geography and Tourism, Chongqing Key Laboratory of GIS Application, Chongqing Normal University, Chongqing 401331, China
2
Chongqing Jinfo Mountain Karst Ecosystem National Observation and Research Station, Chongqing Engineering Research Center for Remote Sensing Big Data Application, School of Geographical Sciences, Southwest University, Chongqing 400715, China
*
Author to whom correspondence should be addressed.
These authors contributed equally to this work.
Land 2022, 11(7), 996; https://doi.org/10.3390/land11070996
Submission received: 31 May 2022 / Revised: 24 June 2022 / Accepted: 27 June 2022 / Published: 30 June 2022

Abstract

:
With the rise of smart cities and geographic big-data applications, the refined identification of urban functional areas is of great significance for decision-makers to formulate scientific and reasonable urban planning. In this paper, a random forest algorithm was adopted to analyze Point of Interest (POI) data, with the aim of identifying the functional zoning of Chongqing’s central urban area and to quantify the functional mixing degree by combining POI data with Open Street Map (OSM) road networks. The main conclusions include: (1) Due to the topography and previous urban planning strategies, the central urban area of Chongqing has a significant cluster development that radiates outward from the center of each district. Mixed functional areas account for about 40% of the total area, excluding non-functional areas. The land-use intensity of the central urban area is significant. (2) The mixing degree of the inner ring is generally high, while the aggregation characteristics of the outer ring are weaker. The functions of catering and transportation are dispersed and are mutually exclusive from other functions. (3) The identification of residential service and green spaces and squares was the best, while the identification of catering service areas was slightly less accurate. The overall identification accuracy of the single-function areas was 82%. The results of functional zoning provide valuable information for understanding the downtown area of Chongqing and represent a new method for the study of urban structures in the future.

1. Introduction

With the rapid development of China’s economy and continuous urbanization, multiple elements are gathering and diffusing in space, forming functional zoning at different regional scales [1,2]. The urban spatial structure is the projection of urban functional areas and their connections on a regional scale [3]. The spatial distribution of urban functions is an important factor to measure urban development, but the evolution of regional functions may be inconsistent with urban planning and development. Therefore, the study of urban functional zones is of great significance for effective functioning [4], the rational allocation of spatial elements [5], economic development, and the livability of a city. Information about urban functional zones is important for urban planning management and future development for relevant decision-making departments [6]. Traditional manual surveys, remote sensing images, and other data were important sources for the identification and division of urban functional areas in the past [7,8]. These methods can accurately divide urban functional areas and contribute to land use management. However, urban planning requires the analysis of large amounts of data, and these traditional methods are subjective and require a lot of manpower, material resources, and financial expense, meaning they are not suitable for routine monitoring or longitudinal comparisons [9]. With the integration of urban regional planning and management, obtaining timely information describing urban development is urgent. The rapid and accurate identification of urban functional areas is a necessary condition for improving urban planning and management [10].
The division of functional areas is one of the basic steps of urban planning and management [5,11]. The advent of the big-data era has led to the development of new methods for the study of urban spatial patterns. Novel geographical datasets represented by mobile phone signaling, POI data, and floating vehicle tracking have the advantages of large sample sizes, fast processing speeds, simple and convenient acquisition, and a diverse range of sources [12], providing new information for quantifying urban functional areas and the possibility for refined research. Jiao et al. visualized mixed functional areas by using the RGB color addition method [13] and were the first scholars in China to study urban functional zoning using POI data. Miao et al. analyzed urban spatial structures by using microblog check-in data, OSM road network data, and a spatial clustering method. This study found that using a street view segmentation method to describe urban heterogeneity was more effective than a uniform grid method [14]. Long et al. found that using online data, such as OSM and POI, could generate similar results to traditional manual methods and concluded that the integrity of OSM road network data in big cities is far better than that in small cities [9]. Yu took the traffic community as the minimum research unit to verify the effectiveness of combining floating car tracking data and POI data to identify urban functional areas [15]. Yang et al. used mobile phone signaling data as a supplement to the day–night intensity of urban population heat to better quantify the space–time characteristics of urban functional areas [16].
The majority of these previous studies used POI data and other large geographical datasets [17,18] and proved the rationality of using the OSM road network to divide research units. Mobile phone signaling data and floating car track data have strong confidentiality and high investment capital. In contrast, POI data have the advantages of simple acquisition and convenient processing, meaning that POI data are widely used in geographical research. At present, the research on POI mainly focuses on a recommendation model [19,20,21] and urban functional zoning [22], and the research on POI itself mainly focuses on automatic classification [23] and classification accuracy by using machine learning. Nak introduced POI into eye-tracking data analysis [24], making the research scope of POI broader.
POI data mainly describe the spatial location and attribute information of geographical entities [25] and exclude information about the scale of land use. The function is the social attribute undertaken by geographical entities [26]. The urban functional area is composed of a series of geographical entities in the region, which are the result of the long-term development process of the city [27,28] and have always been named according to the dominant function. In the study of the urban functional area, many previous studies have assigned weights to POI data by taking public awareness and surface area as influencing factors to improve the accuracy [29]. These weights are mainly determined by questionnaires and expert evaluation, which can mean that this method can be inefficient or cause biased results [30].
The random forest model is one of the most suitable machine learning methods [31] for describing the importance of features that cannot be explained using manual data analysis [32]. Zhao et al. identified the production–living–ecological spatial pattern of Zhengzhou [33] and introduced the random forest model to assign weight values to POI data. These new methods and large geographic datasets promote research to better characterize urban functional areas. Most scholars have improved the sample bias by coupling multi-source data, and there is a lack of in-depth research on the data itself [16]. The classification of various data combinations can differ, and there is no method to test the accuracy of the results. The development of machine learning has made scholars pay more attention to the development of POI data accuracy. Word2vec and Block2vec have been used to study the relationship between POI categories [10,34] improve the classification accuracy of POI, and pay more attention to the applicability of the data [35], but there is currently a lack of research on POI weighting.
To address the subjectivity, complexity, and lack of accuracy of weight assignments in previous POI studies and considering the irrationality of directly quoting plain city data in mountainous cities, this paper adopts the random forest method to assign POI weights. We then use an urban functional area calculation model, combined with the POI and OSM road network data from the central urban area of Chongqing in 2020, to identify its functional area and quantify the mixing degree of the internal functions [1]. Google satellite map and Baidu Street view map are used to verify the recognition results. In addition, the sensitivity of the model is tested by data thinning to make the research results more practical for urban planning. The findings of this study allow for a better characterization of regional development, provide a reference for adjusting the regional functional structure [36], and improve the role of the Chongqing city center in the Chengdu–Chongqing economic circle.

2. Materials and Methods

2.1. Study Area

Chongqing, located inland in southwest China, is the only municipality directly under the central government in western China. Chongqing is an important city for the modern national manufacturing industry, which plays a unique and important role in national development and the pattern of opening to the outside world. This paper takes the central urban area of Chongqing as the research area and includes nine groups: Yuzhong group, Yubei group, Dadukou group, Jiangbei group, Shapingba group, Jiulongpo group, Nanan group, Beibei group, and Banan group. The central urban area is a zone of high-quality development within Chongqing and is important for the development of the city and surrounding areas. According to the seventh National census, Chongqing has a permanent population of 3,054,200, a GDP of 25,279 billion yuan, and a total area of 82,400 square kilometers. The population, GDP, and spatial extent of the central urban area account for 32.27%, 39.5%, and 7% of the whole city total, respectively. The central urban area has a considerable population and a solid economic foundation. The study focuses on the downtown area of Chongqing to study the development characteristics of mountainous cities. A diagram of the urban structure of central Chongqing is shown in Figure 1.

2.2. Data Sources and Processing

2.2.1. POI Data

POI data were collected from AmAP in 2020 and included a total of 573,461 items. The POI attributes included latitude and longitude, address, name, type and administrative region, which reflect the human activities carried by geographical entities and their correlation with geographical locations [37]. First, the original POI data were pre-processed by de-weighting and data cleaning. Next, the POI types were reclassified according to the Standard for Urban Land Classification and Planning and Construction Land (GB50137-2011) [38] to obtain 10 categories, including residential services, financial insurance, and life service. These categories were then further subdivided into 16 sub-categories.

2.2.2. Plot Data

OSM road network data are part of a popular Volunteer Geographic Information project (VGI) [39] and are characterized by high positioning accuracy, regular updates, and free access. The OSM is an internal segmentation of urban land use [40] and is suitable for the study of urban functional areas [41]. OSM road network data include 10 road types, including expressways, national roads, provincial roads, pedestrian roads, and subways. Subways and pedestrian roads were deleted as they are not important and do not affect the results. GIS spatial technology was used to preprocess the road data. A block is a planar unit that constitutes residents’ lives and the urban environment [42], and is the basic unit of urban structure, urban function, and urban management [43]. Chen discussed four methods of urban land segmentation and concluded that the method combining OSM road network data and LSMS segmentation was the optimal land segmentation method [44] and most accurately preserved the block morphology. This paper used this method to divide the minimum research unit, resulting in the research area being divided into 38,015 plots.

2.3. Methodology

The main steps to identify urban functional areas were as follows (Figure 2): (1) use the random forest model to determine POI weights; (2) use the urban function calculation model to identify single dominant functional areas; (3) use information entropy to calculate the mixing degree of urban functions; and (4) use visual interpretation to conduct accuracy verification.

2.3.1. Random Forest Algorithm

The Random Forest algorithm is a parallel integrated learning method based on multiple decision trees proposed by Breiman [45] in 2001, which uses modern classification and regression technology. The random forest method can classify and regress data sets, analyze the importance of variables, detect singular values, and interpolate missing data [46,47]. Variable importance estimation is one of the key advantages of the Random Forest algorithm [48]. In this paper, the importance function of the Random Forest program was used in Rstudio software to calculate the weight of various POI. The main parameters that determine the growth of the decision tree are the node value (Mtry) and the decision number (Ntree). The optimal solution of these parameters is obtained using the out-of-bag estimation error (OOB) [49]. MeanDecreaseAccuracy can indicate the importance of POI class. The calculation is expressed as follows [50]:
M D A v = 1 n T r e e s t = 1 n T r e e s ( e r r O O B t e r r O O B t )
where MDA (v) represents the average accuracy reduction value of the RF classifier feature V; nTrees represents the number of decision trees; errOOBt represents the out-of-bag error of decision tree T; and errOOB’t represents the out-of-bag error of decision tree T after the out-of-bag sample data are randomly scrambled.

2.3.2. Identification of Dominant Functional Areas

After determining the weight of the POI, the study area was divided and demarcated by the OSM road network and LSMS. The total score of the POI weight contained by different functions in the plot was statistically summarized to identify the urban function. This paper adopted the calculation model of urban function recognition constructed for a certain land unit [51]. This calculation expression is as follows:
D i j = k = 1 n N k × w k l = 1 m N l × w l × 100 %
where Dij is the total weight score of the J-class function in the i-th plot, which represents the proportion of the sum of all POI weight scores of the function in the plot relative to the total weight score of all POI in the plot; K is the number of Class K POI belonging to class J function in the plot; Nk is the number of Class K POI belonging to class J function in the plot; Wk is the weight of class K POI belonging to class J function in the plot; m is the total number of all POI categories existing in the plot; l is class L POI in the plot; Nl is the number of Class L POI in the plot; and Wl assigns the weight of class L POI in the plot. The total score set of various functional weights of plot I was calculated, denoted by Dij = Max. If Dij ≥ 50%, the functional partition represented by Dij of plot I was identified. Otherwise, the plot I was identified as having a mixed function.

2.3.3. The Mixing Degree of Urban Functions

A relatively fine spatial scale is required to study the degree of urban functional mixing. The method of plot division in this paper not only retains the shape of blocks in the study area but also achieves the appropriate accuracy to characterize the degree of functional mixing. Referring to the information entropy calculation, the mixing degree of various types of POI is measured by calculating the diversity of POI types within a single plot [52]. The calculation expression is as follows:
H m n = i = 1 n P i × ln P i
where Hmn represents the functional mixing degree of POI in row m and column n of the plot and n is the total number of POI types. Pi is the proportion of class I POI relative to all POI in the plot. The POI functional mixing degree of each plot in the study area was calculated using this method. The larger the value, the more types of POI functions there are within that area and the smaller the difference between the number of function types.

3. Results

3.1. POI Weight Determination Based on the Random Forest Model

In this paper, the functional zoning map of Chongqing developed by Professor Gong Peng’s team at Tsinghua University [40] was adopted to carry out the geographical calibration between the functional zoning map and POI data, and to obtain the weighted proportion of each POI. After several attempts, 60% of the data were taken as the training set, mtry = 10, ntree = 800, to give the lowest out of bag estimation error (29.16%). We then used the MDA in the Importance function to calculate the relative importance of the different POI categories (Figure 3).
The MDA value was standardized according to the total score of 100 points and was combined with the POI types to obtain the POI weight index classification table (Table 1).

3.2. Identification of Single Dominant Functional Areas

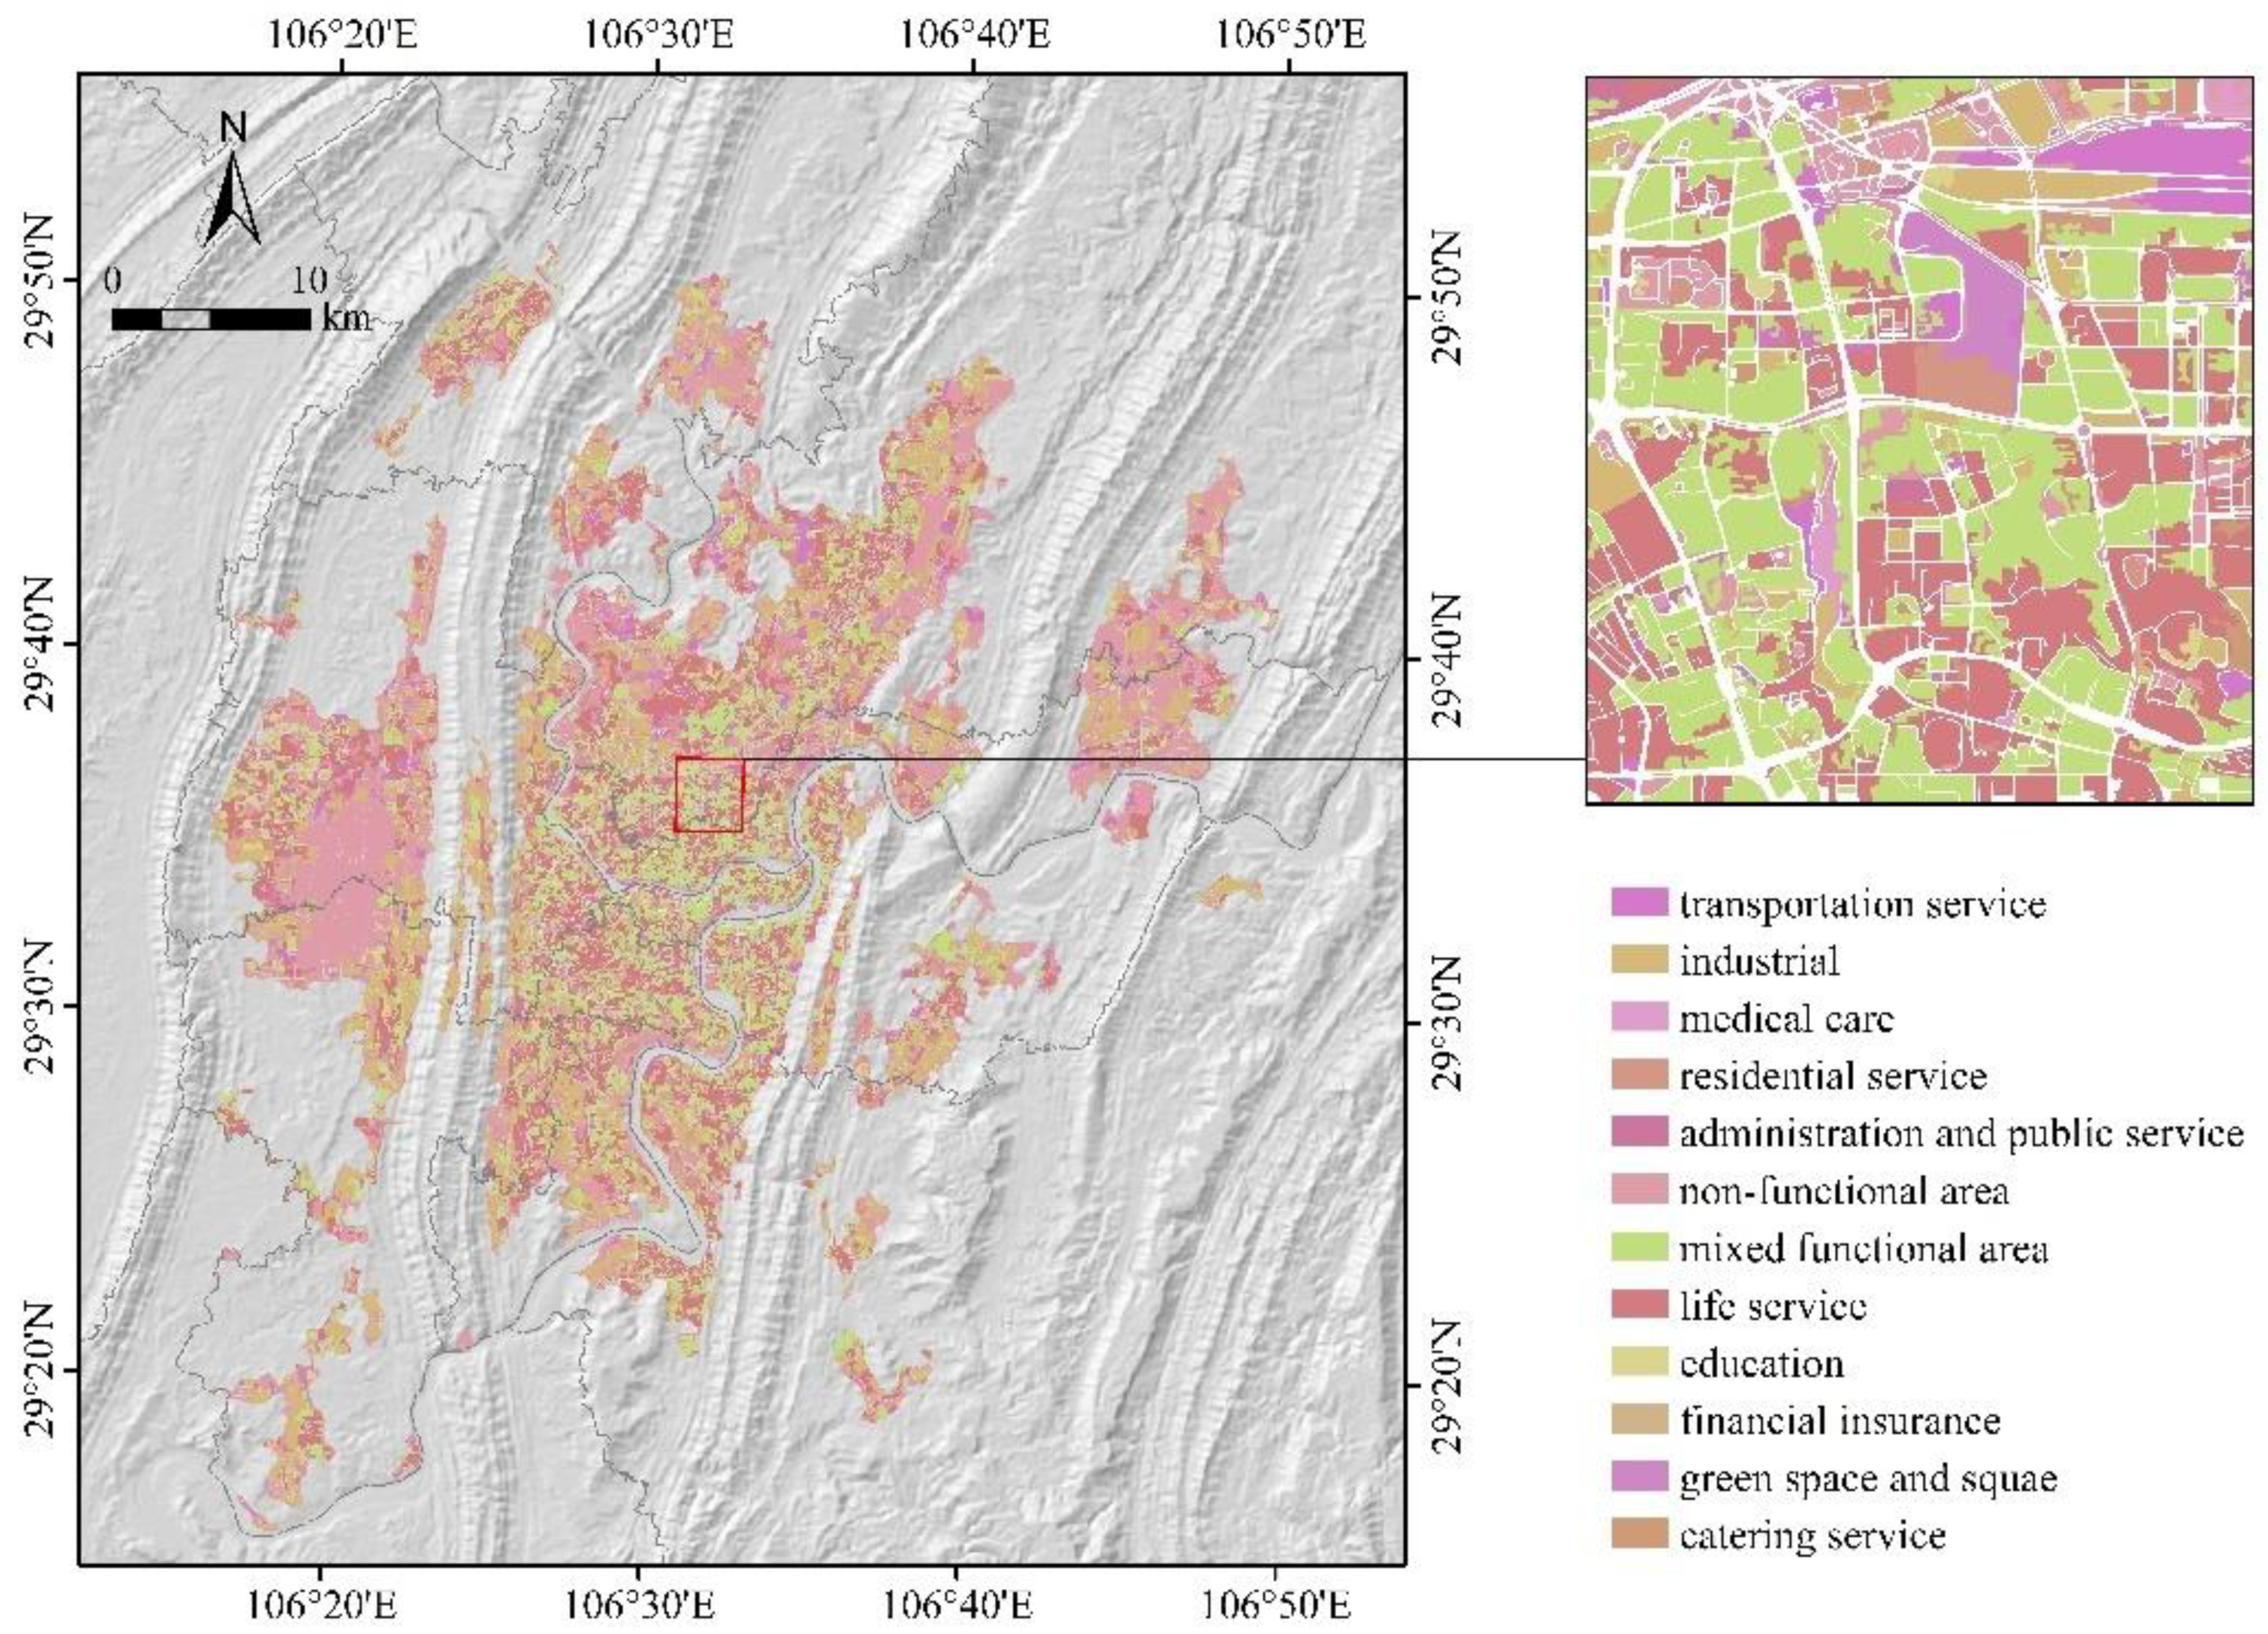
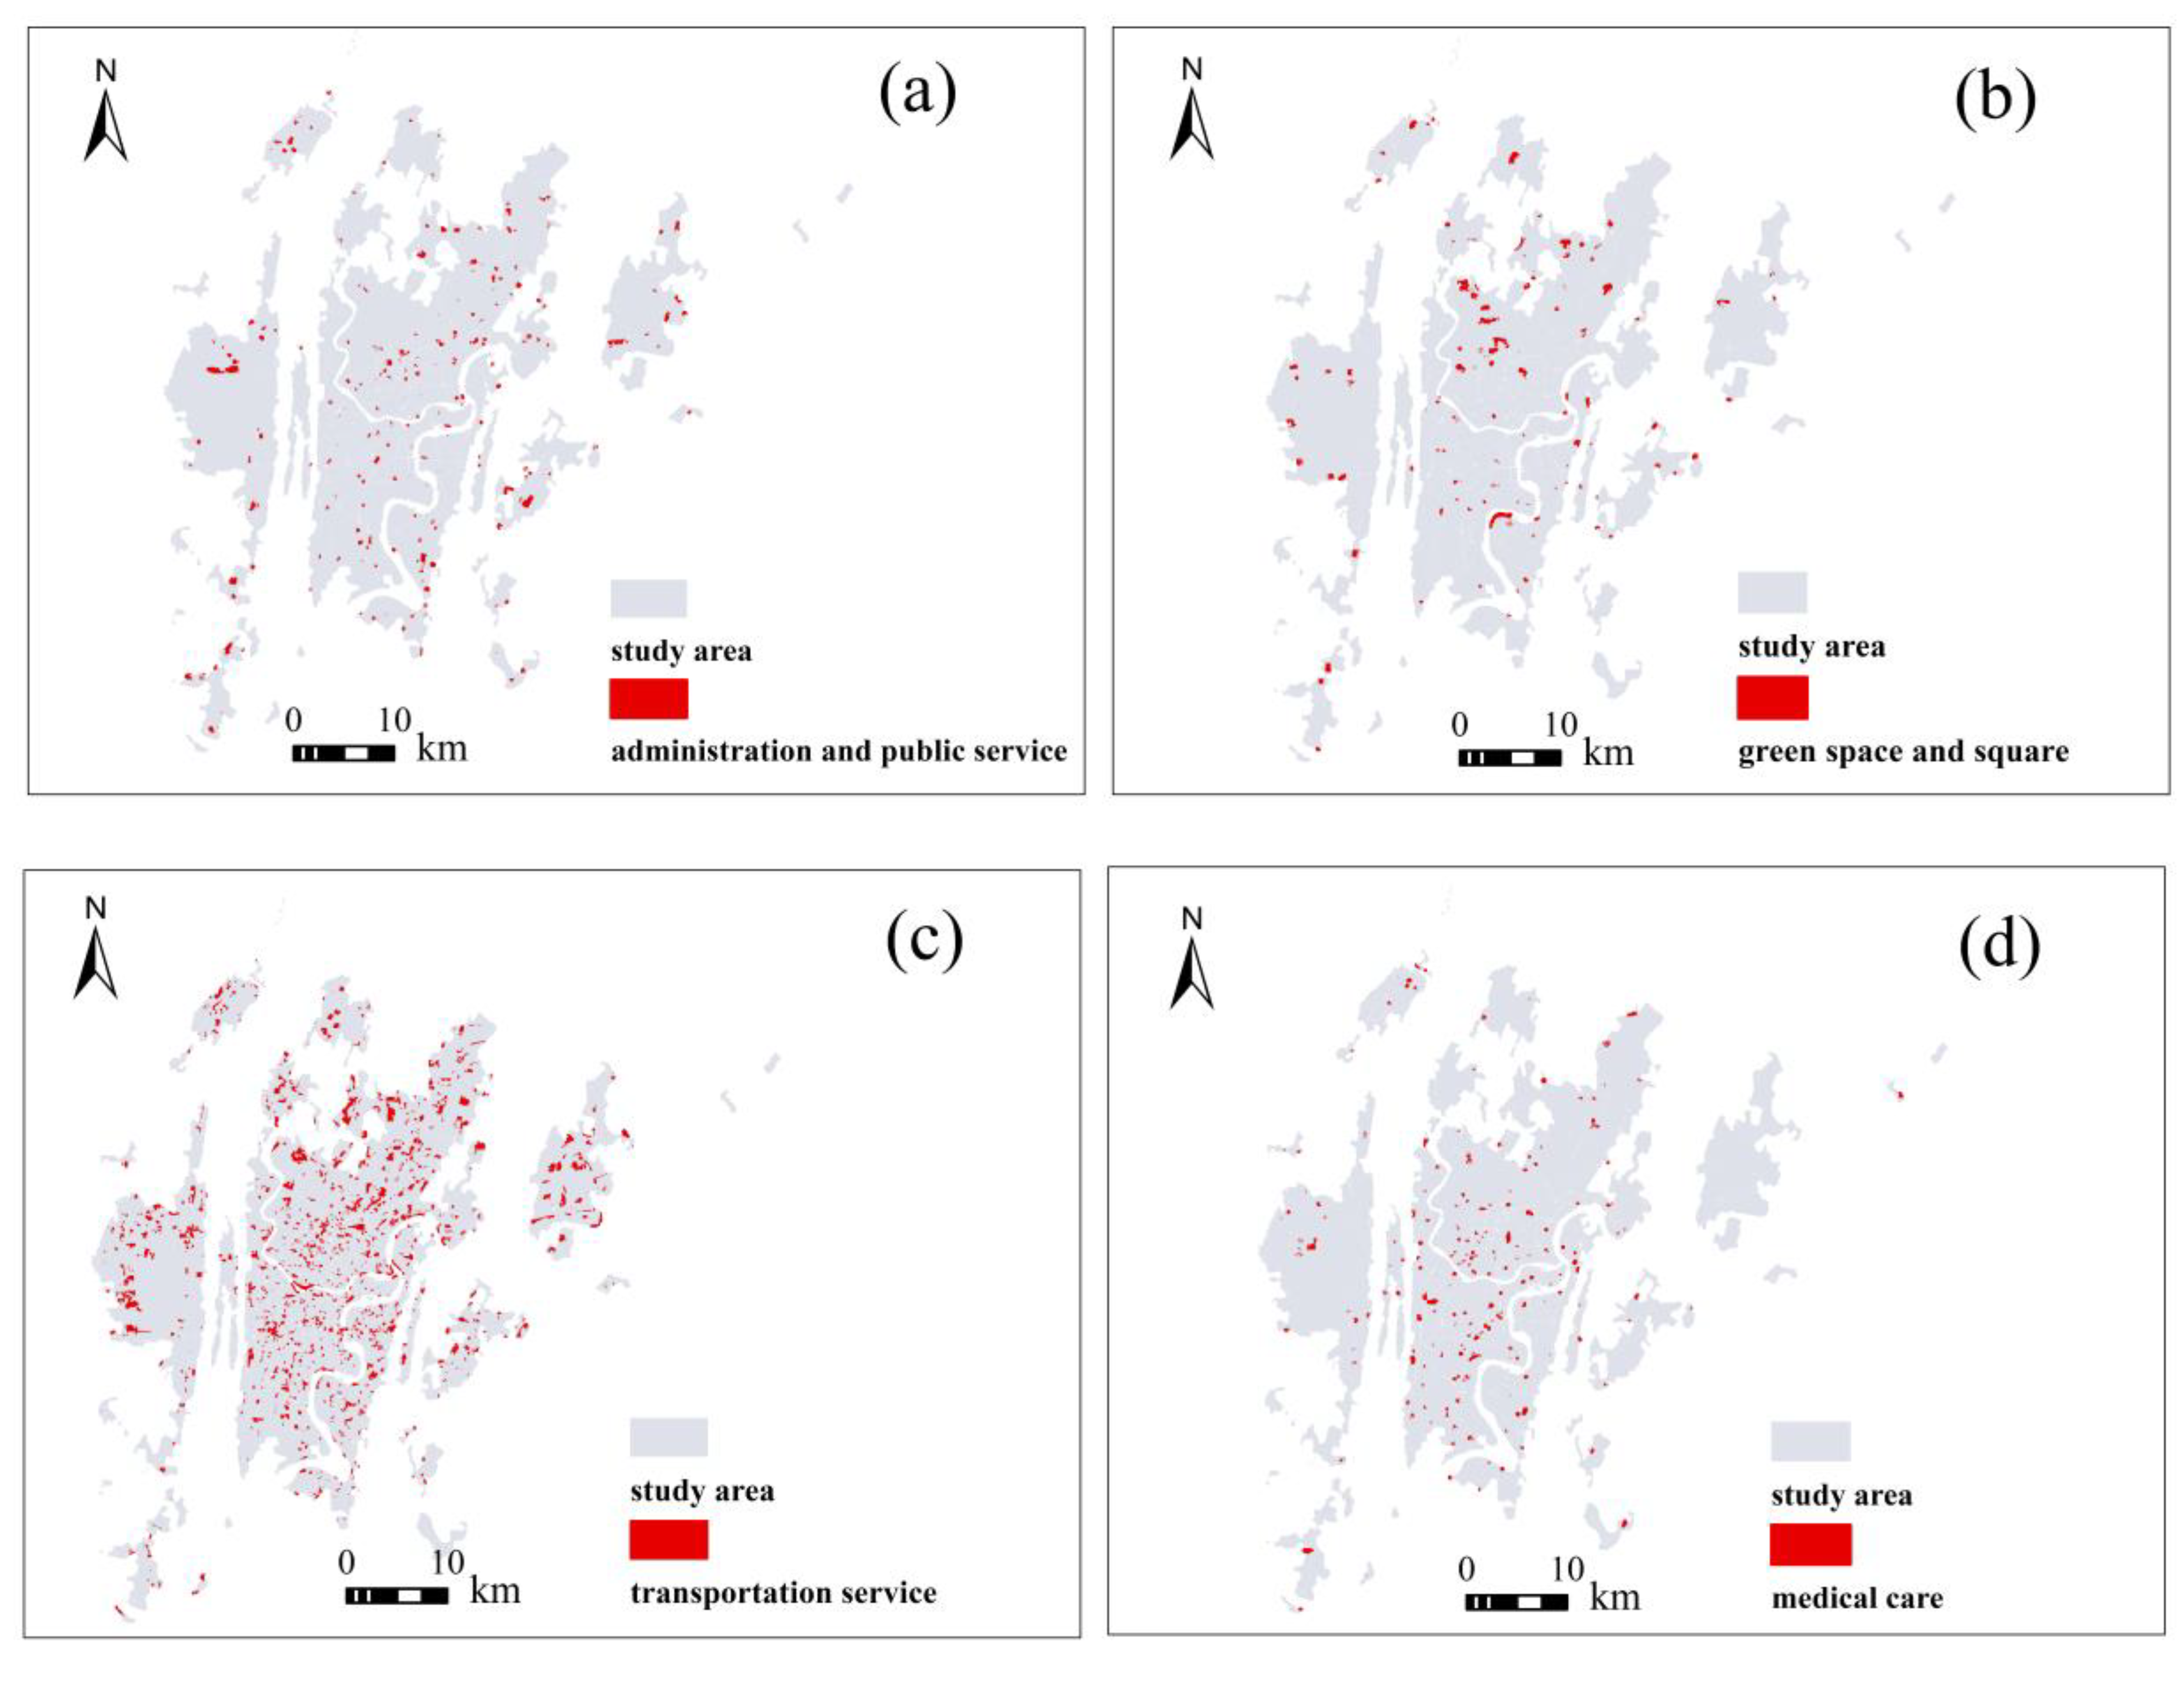
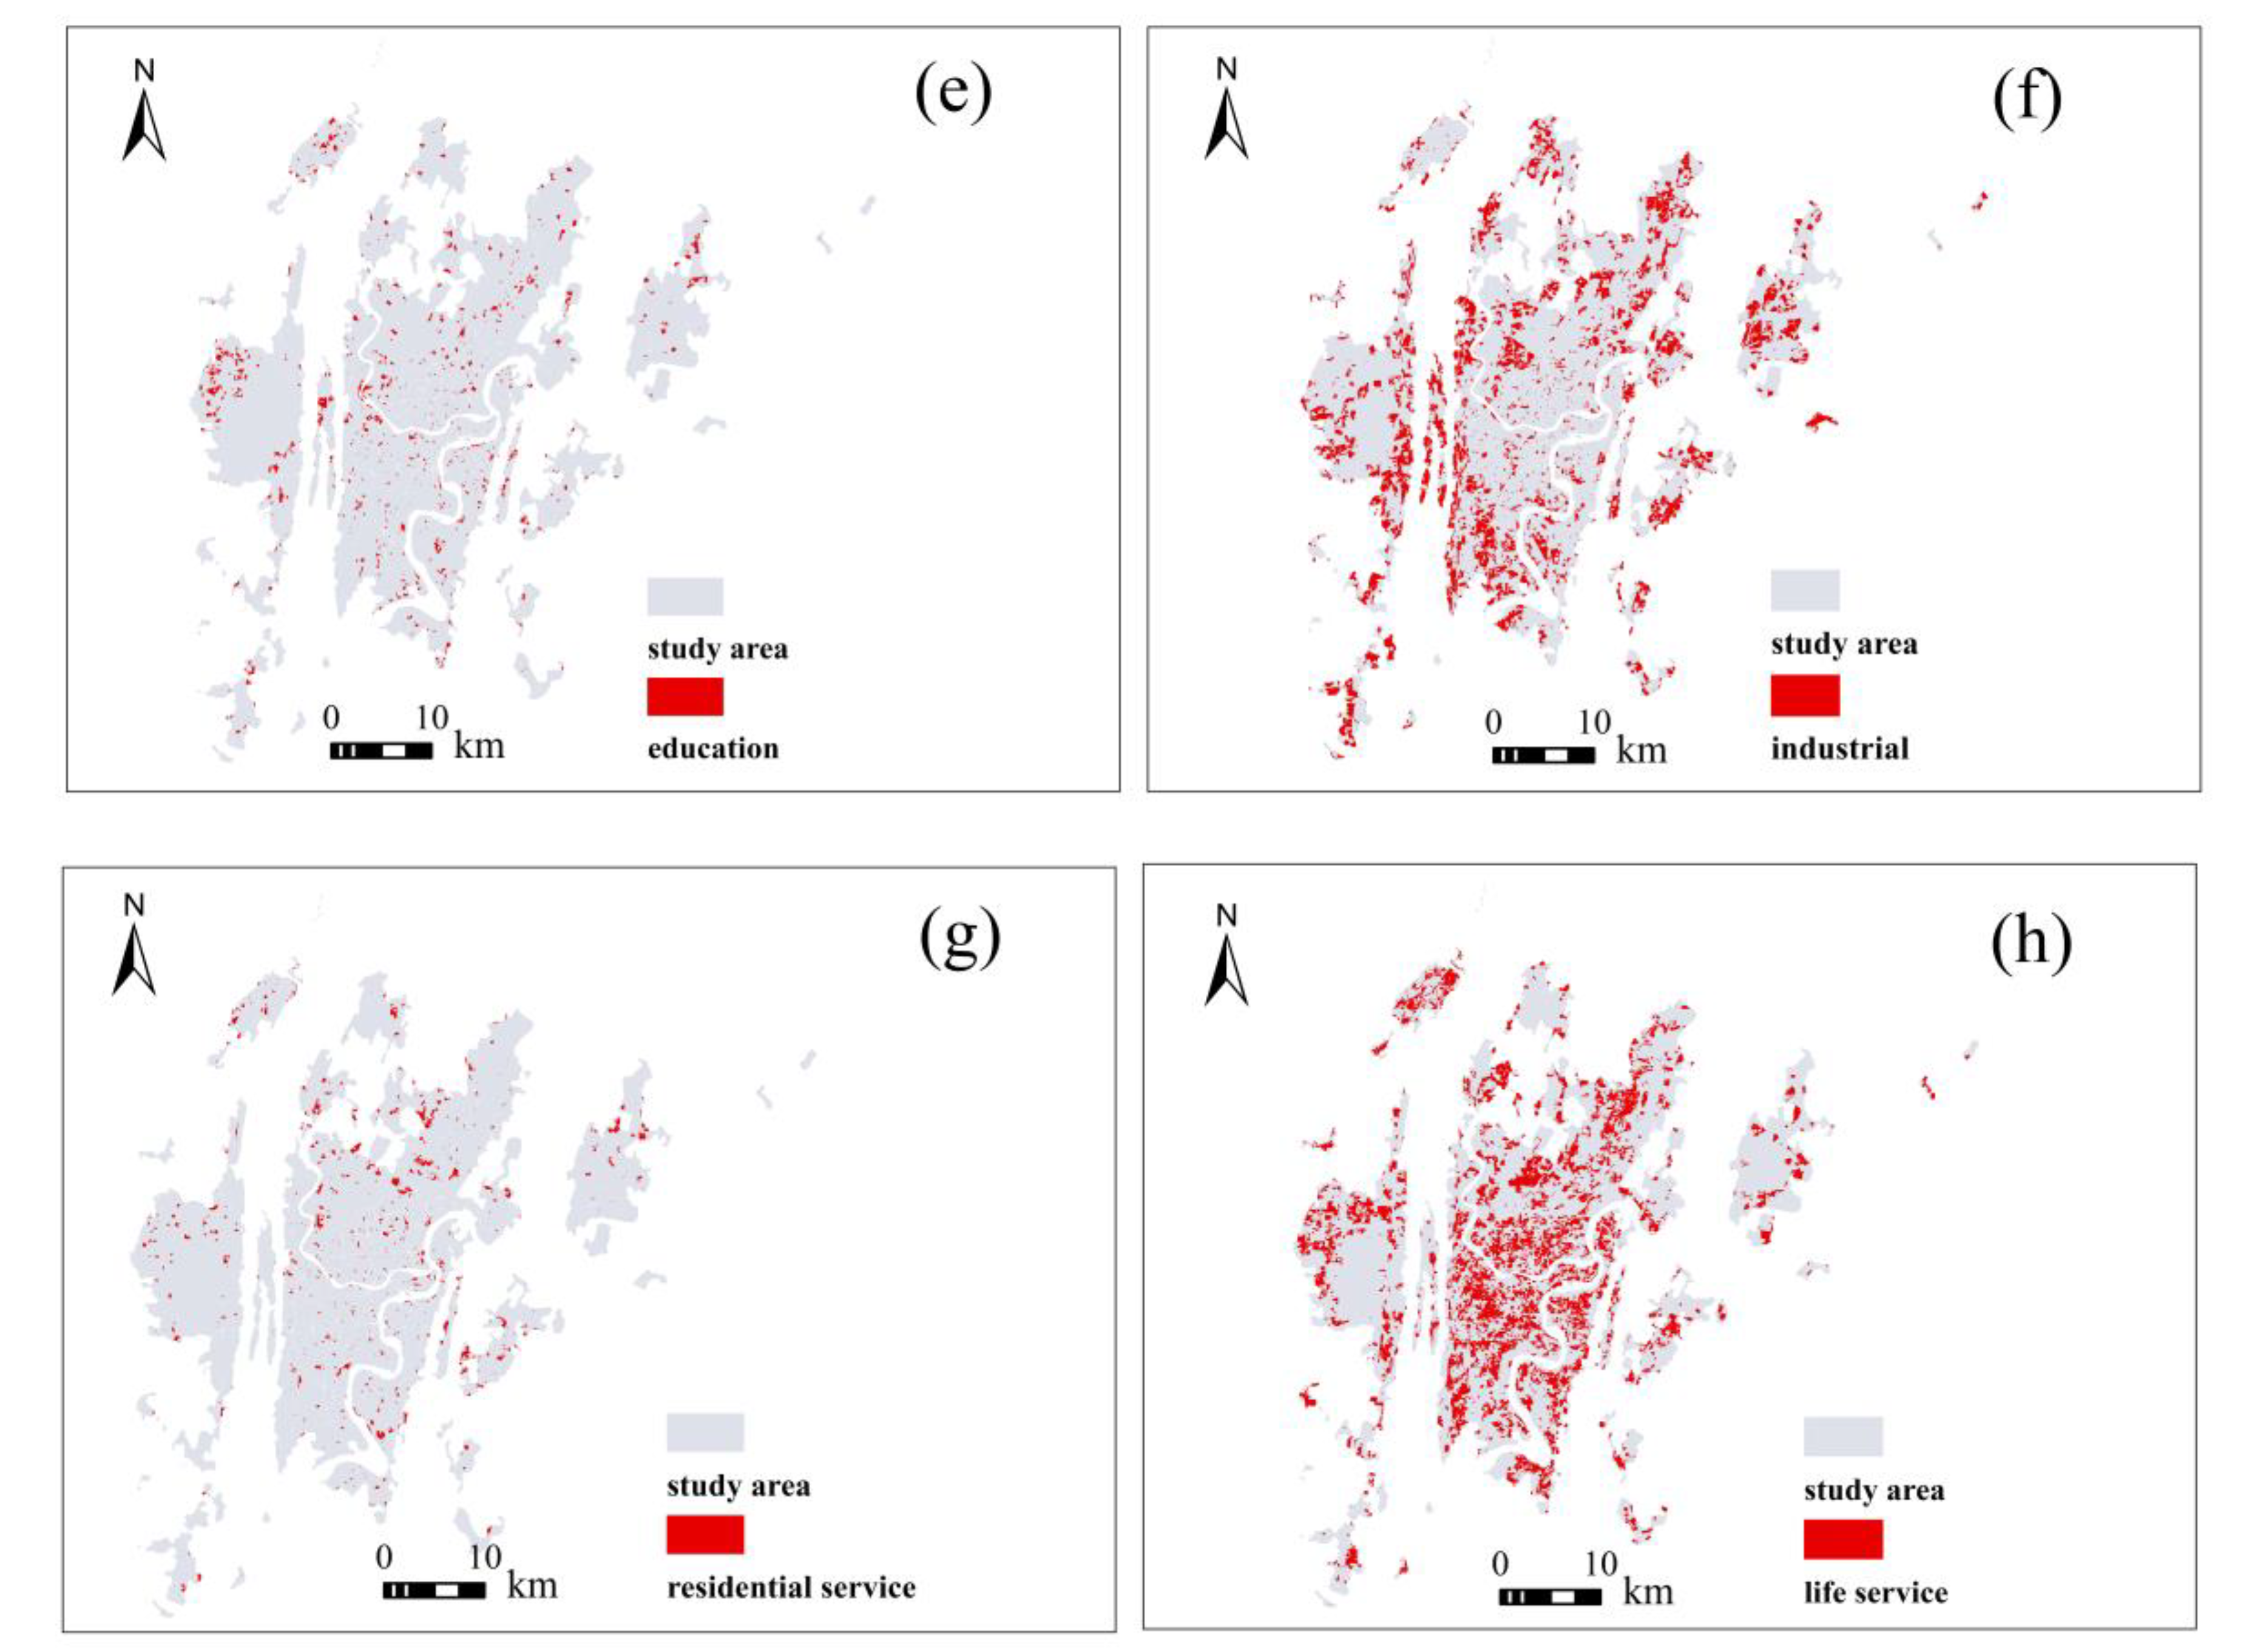
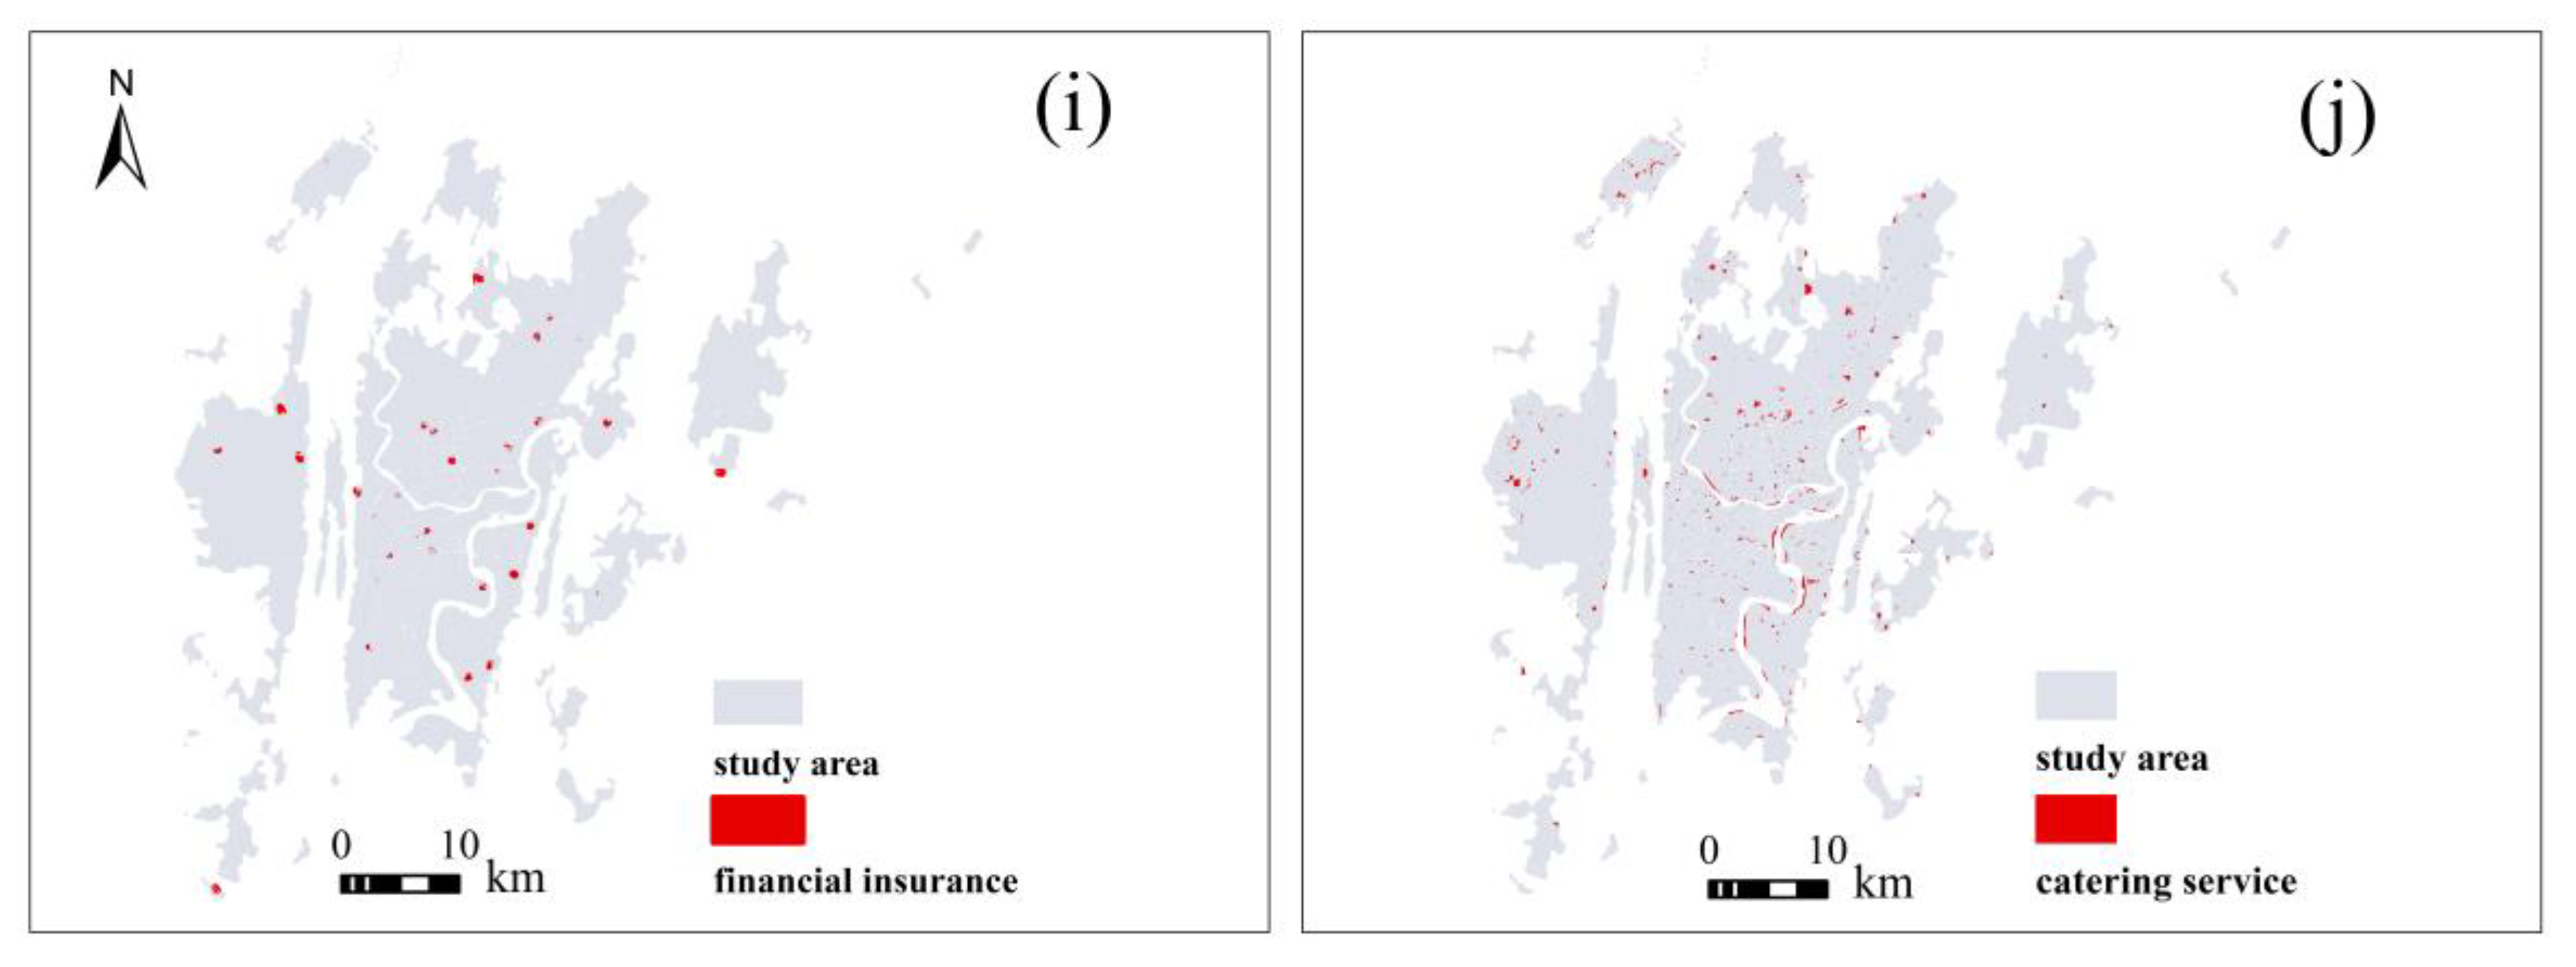
GIS spatial technology was used to identify urban functional areas and to quantify the central urban area of Chongqing. Different types of POI data were spatially connected with the plot data, and the single dominant functional areas with a fraction of more than 50% in each plot were identified and visualized (Figure 4). Based on the street scale, this paper identified 1636 traffic service functional areas, 3968 industrial functional areas, 233 medical care functional areas, 777 residential service functional areas, 240 administration and public services functional areas, 7915 life service functional areas, 1010 education functional areas, 32 financial and insurance functional areas, 129 green spaces and squares functional areas, and 585 catering service functional areas. The top three categories were life services, industrial services, and transportation services. There were many non-functional areas, which were mainly distributed in the Gele and Zhongliang mountainous areas, due to the small-scale division of the study area.
Life service accounted for the largest area and had a wide distribution, mainly in the Guanyinqiao group in the southwest of Jiangbei District, the Shapingba group in the southeast of Shapingba District and the University City area, the Dayangshi group in the southeast of Jiulongpo District and the Nanping group in the west of Nan’an District. Life service covered the majority of Guanyinqiao, Jiefangbei, Shapingba and other major business districts in the central urban area.
The distribution of industrial functional zones was uniform, including in the Airport group in Yubei District, the Yuzui group in Jiangbei District, and the Xipeng group in Jiulongpo District, but less in Banan and Beibei Districts. Transportation is given priority in these areas, with numerous road facilities, vehicle maintenance and repair services. Due to Jiangbei International Airport, Chongqing North Station and other air transport hubs and industrial parks, the transportation service function has an obvious aggregation in the Yubei District. There is also a relatively concentrated traffic function in Shapingba District due to Chongqing West Railway Station, Shapingba Station, and West New Town Passenger Station. In other central urban areas, the transportation function is dispersed to serve daily commuters.
Catering services are needed in people’s daily lives, and their distribution is consistent with the location of companies and education facilities. Residential service functional areas are distributed evenly throughout the central city and are concentrated on the periphery of the business circle. Accommodation services that are close to the business circle mainly serve tourists. The number of green spaces and squares is much lower compared with other functional areas, and scenic spots such as Lijia Wisdom Park and Zhaomu Mountain Park can be clearly identified. Education functional areas are concentrated in the Shapingba District. There are some clusters of education functional areas in the vicinity of Southwest University and Chongqing University of Technology. There is a lower distribution of education areas near the business zone of each district, which is consistent with the distribution of residential functional areas.
As a special function, the administration and public service function area occupies a relatively small amount of land and is scattered in all municipal districts. By checking the government address of each district, the effect of recognition was found to be good. However, the plot division was too fine, and so it is not obvious in the figure. The number of financial insurance functional areas is the lowest of all categories, except for in Yuzhong District, although each district does have a distribution of financial and insurance functional areas. The number of medical care functional areas is also small, and these areas are generally far from the center of each city district. This result is consistent with the large area and quiet environment required by medical and health care construction.
In conclusion, the distribution of single dominant functional areas (Figure 5) in the central urban area of Chongqing conforms to the location conditions required by the construction of various functions. This finding shows the different development characteristics of plain areas, and its distribution is consistent with the spatial structure of “one main area, six sub-areas, multi-centers and groups” in Chongqing planning. A previous study found that 200 × 200 is more suitable for the study of single functional areas compared with 500 × 500 [53]. The research scale of this paper was close to 200 × 200, but the single functional area obtained was still less than 2/3rds of the total area, indicating that the overall mixing degree of functional areas in central urban Chongqing is high.

3.3. Evaluation of the Mixing Degree of Functional Areas

Chongqing, as a typical mountain city, has attracted a lot of recent attention as the “8D Magic city”. Three-dimensional transportation is the embodiment of comprehensive land use, and mountains and waters are important factors causing the polycentric pattern of Chongqing [54]. It was found that there are 4510 mixed functional areas. This paper used information entropy to identify the mixing degree of mixed functional areas (Figure 6). The maximum value of the functional mixing degree was 2.02, the standard deviation was 0.22, and the average value was 1.38. In general, the functional mixing degree is affected by the mountainous terrain and has a polycentric distribution. Medium and high mixing degree areas are mainly distributed in the center of each administrative region. Yuzhong District has the highest overall mixing degree, with the maximum street mixing degree reaching 2.02 in Lianglukou street. Caiyuanba Station and Chongqing North Railway Station have low values, and the surrounding buildings have more room for improvement. Shapingba, Jiulongpo, Nanan, and Banan are characterized by a low overall mixing degree, inadequate comprehensive urban development, and inefficient land use. In general, the mixing degree of the inner ring region is generally high, and the aggregation characteristics of the outer ring region are weaker.
To study the 4510 plots with mixed functions, GIS spatial technology was used to identify mixed-function zones dominated by two functions and comprehensive functional zones with three or more functions (Figure 7). There are 3068 mixed plots with both residential and catering services, which are mainly distributed in the central business circle of each administrative region. As shown in Figure 7, the distribution of single-function areas in these regions is also concentrated, reflecting the intensification of land use in Chongqing. The mixed-function areas dominated by additional functions mainly contain industrial, transportation, and life services. There are a total of 117 plots that have a comprehensive functional area. By checking their properties, we found that there are a certain number of various POIs, mainly for residential and transportation services.
Through further study of mixed-function areas, it can be seen that POIs with small volumes and large spatial extents have the characteristics of comprehensive utilization. The mixed-function areas are still distributed as a group, and the multi-center features of the mixing degree are more significant than for single-function areas.

3.4. Verifying the Accuracy of the Results

Some previous researches have studied urban functional zoning without verifying the accuracy of their results [4,7,16,43,51,52,55]. In addition, some scholars have verified the accuracy by comparing their findings with planning maps [13,14], which deviates from the purpose of studying the function of urban development in this paper. Therefore, Google satellite and Baidu Street View maps were selected in this paper to judge the identification accuracy of single functional areas. ArcGIS was used to generate random points, select test samples, and overlay shapefiles on the Google satellite and Baidu Street View maps to test the recognition effect of single functional areas. A total of 682 sample plots were randomly selected as detection objects. POI partitioning results were compared with Google satellite and Baidu Street View maps to judge the correctness of the POI partitioning results. Sampling accuracy was used to estimate the recognition effect, and a confusion matrix was established to evaluate the accuracy of the results (Table 2).
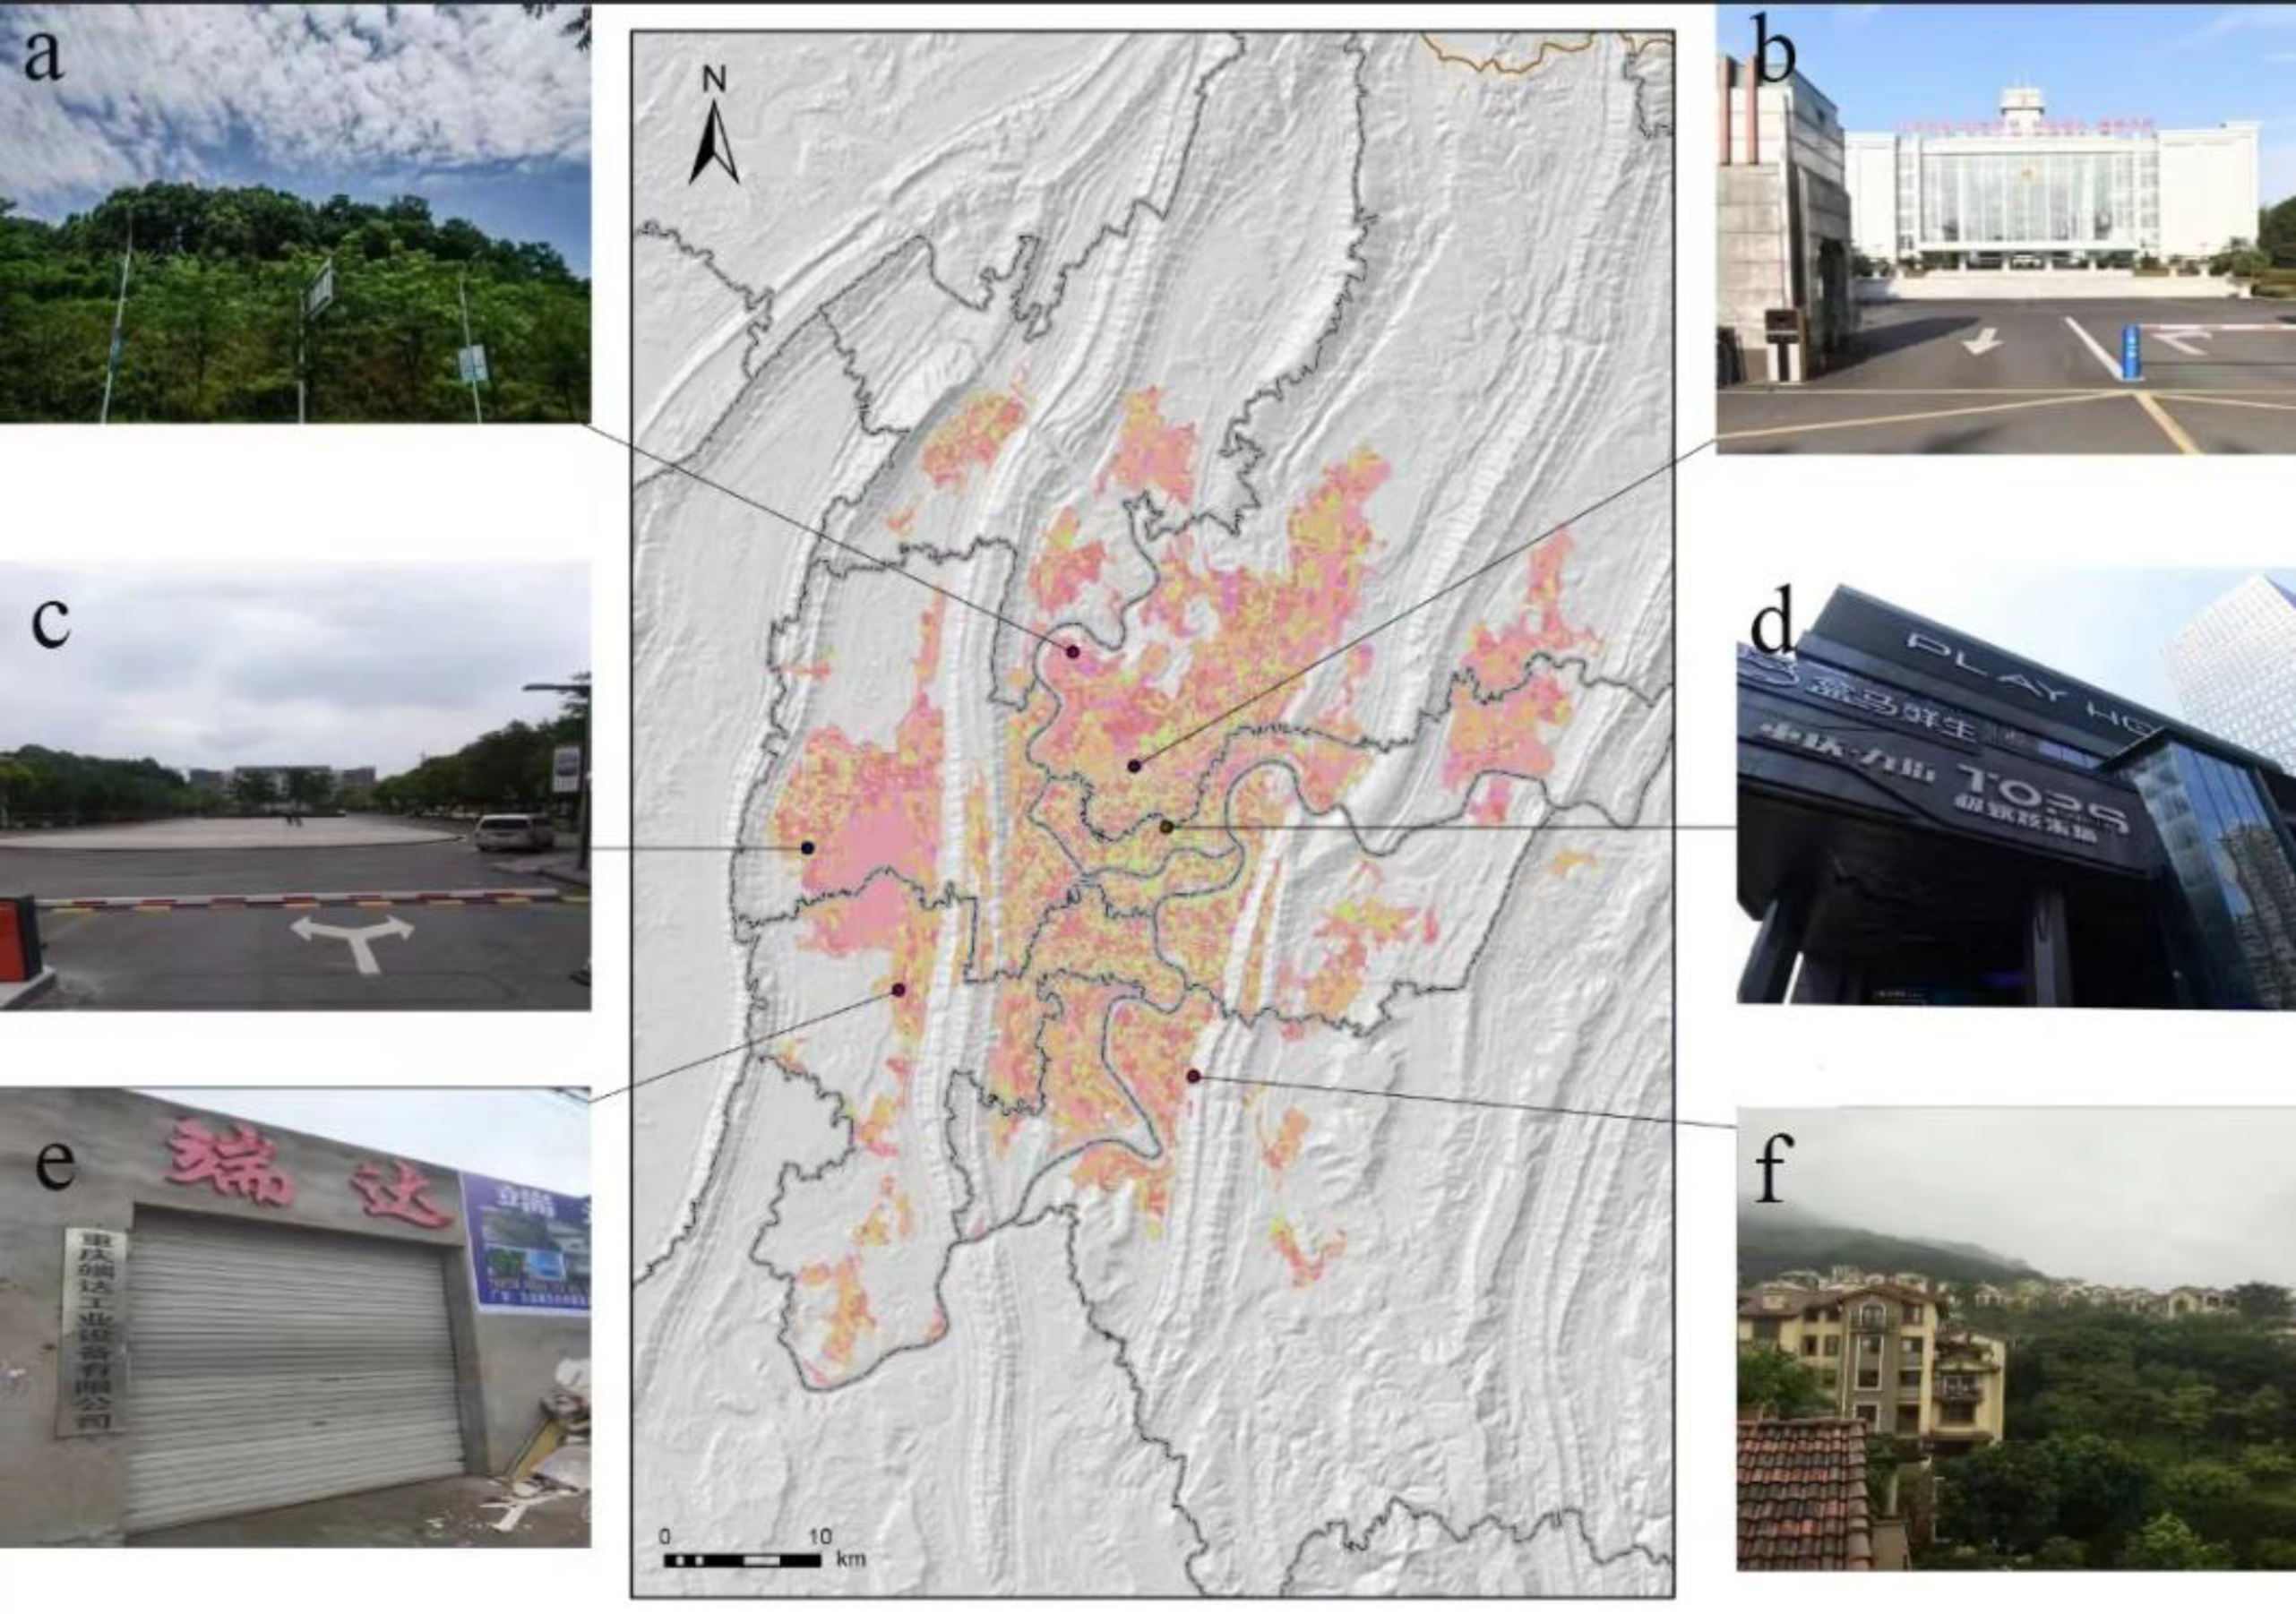
Comparing the functional areas with the Google satellite and Baidu Street View maps (Figure 8), the identification of residential services and green spaces and squares was the best, with an accuracy of 94%. The recognition of catering services was not as accurate. Of the 50 samples, 36 were accurate. Most of the sample plots that failed to meet the standard were open residential areas, with downstairs catering and upstairs living. A residential building upstairs is usually represented by one point, while the catering downstairs can be represented by multiple points [17], allowing a large number of catering POIs to be included in the catering area. Compared with Google satellite and Baidu Street View maps, the POI identification results using single-source data had an overall accuracy of 82% and a Kappa coefficient of 0.80, indicating a high consistency of identification accuracy. The identification accuracy was better than that of Ding Yanwen et al. (81.3%), which verified the accuracy of both single and mixed functional areas using planning maps [56].

4. Discussion

4.1. Analysis of Model Sensitivity

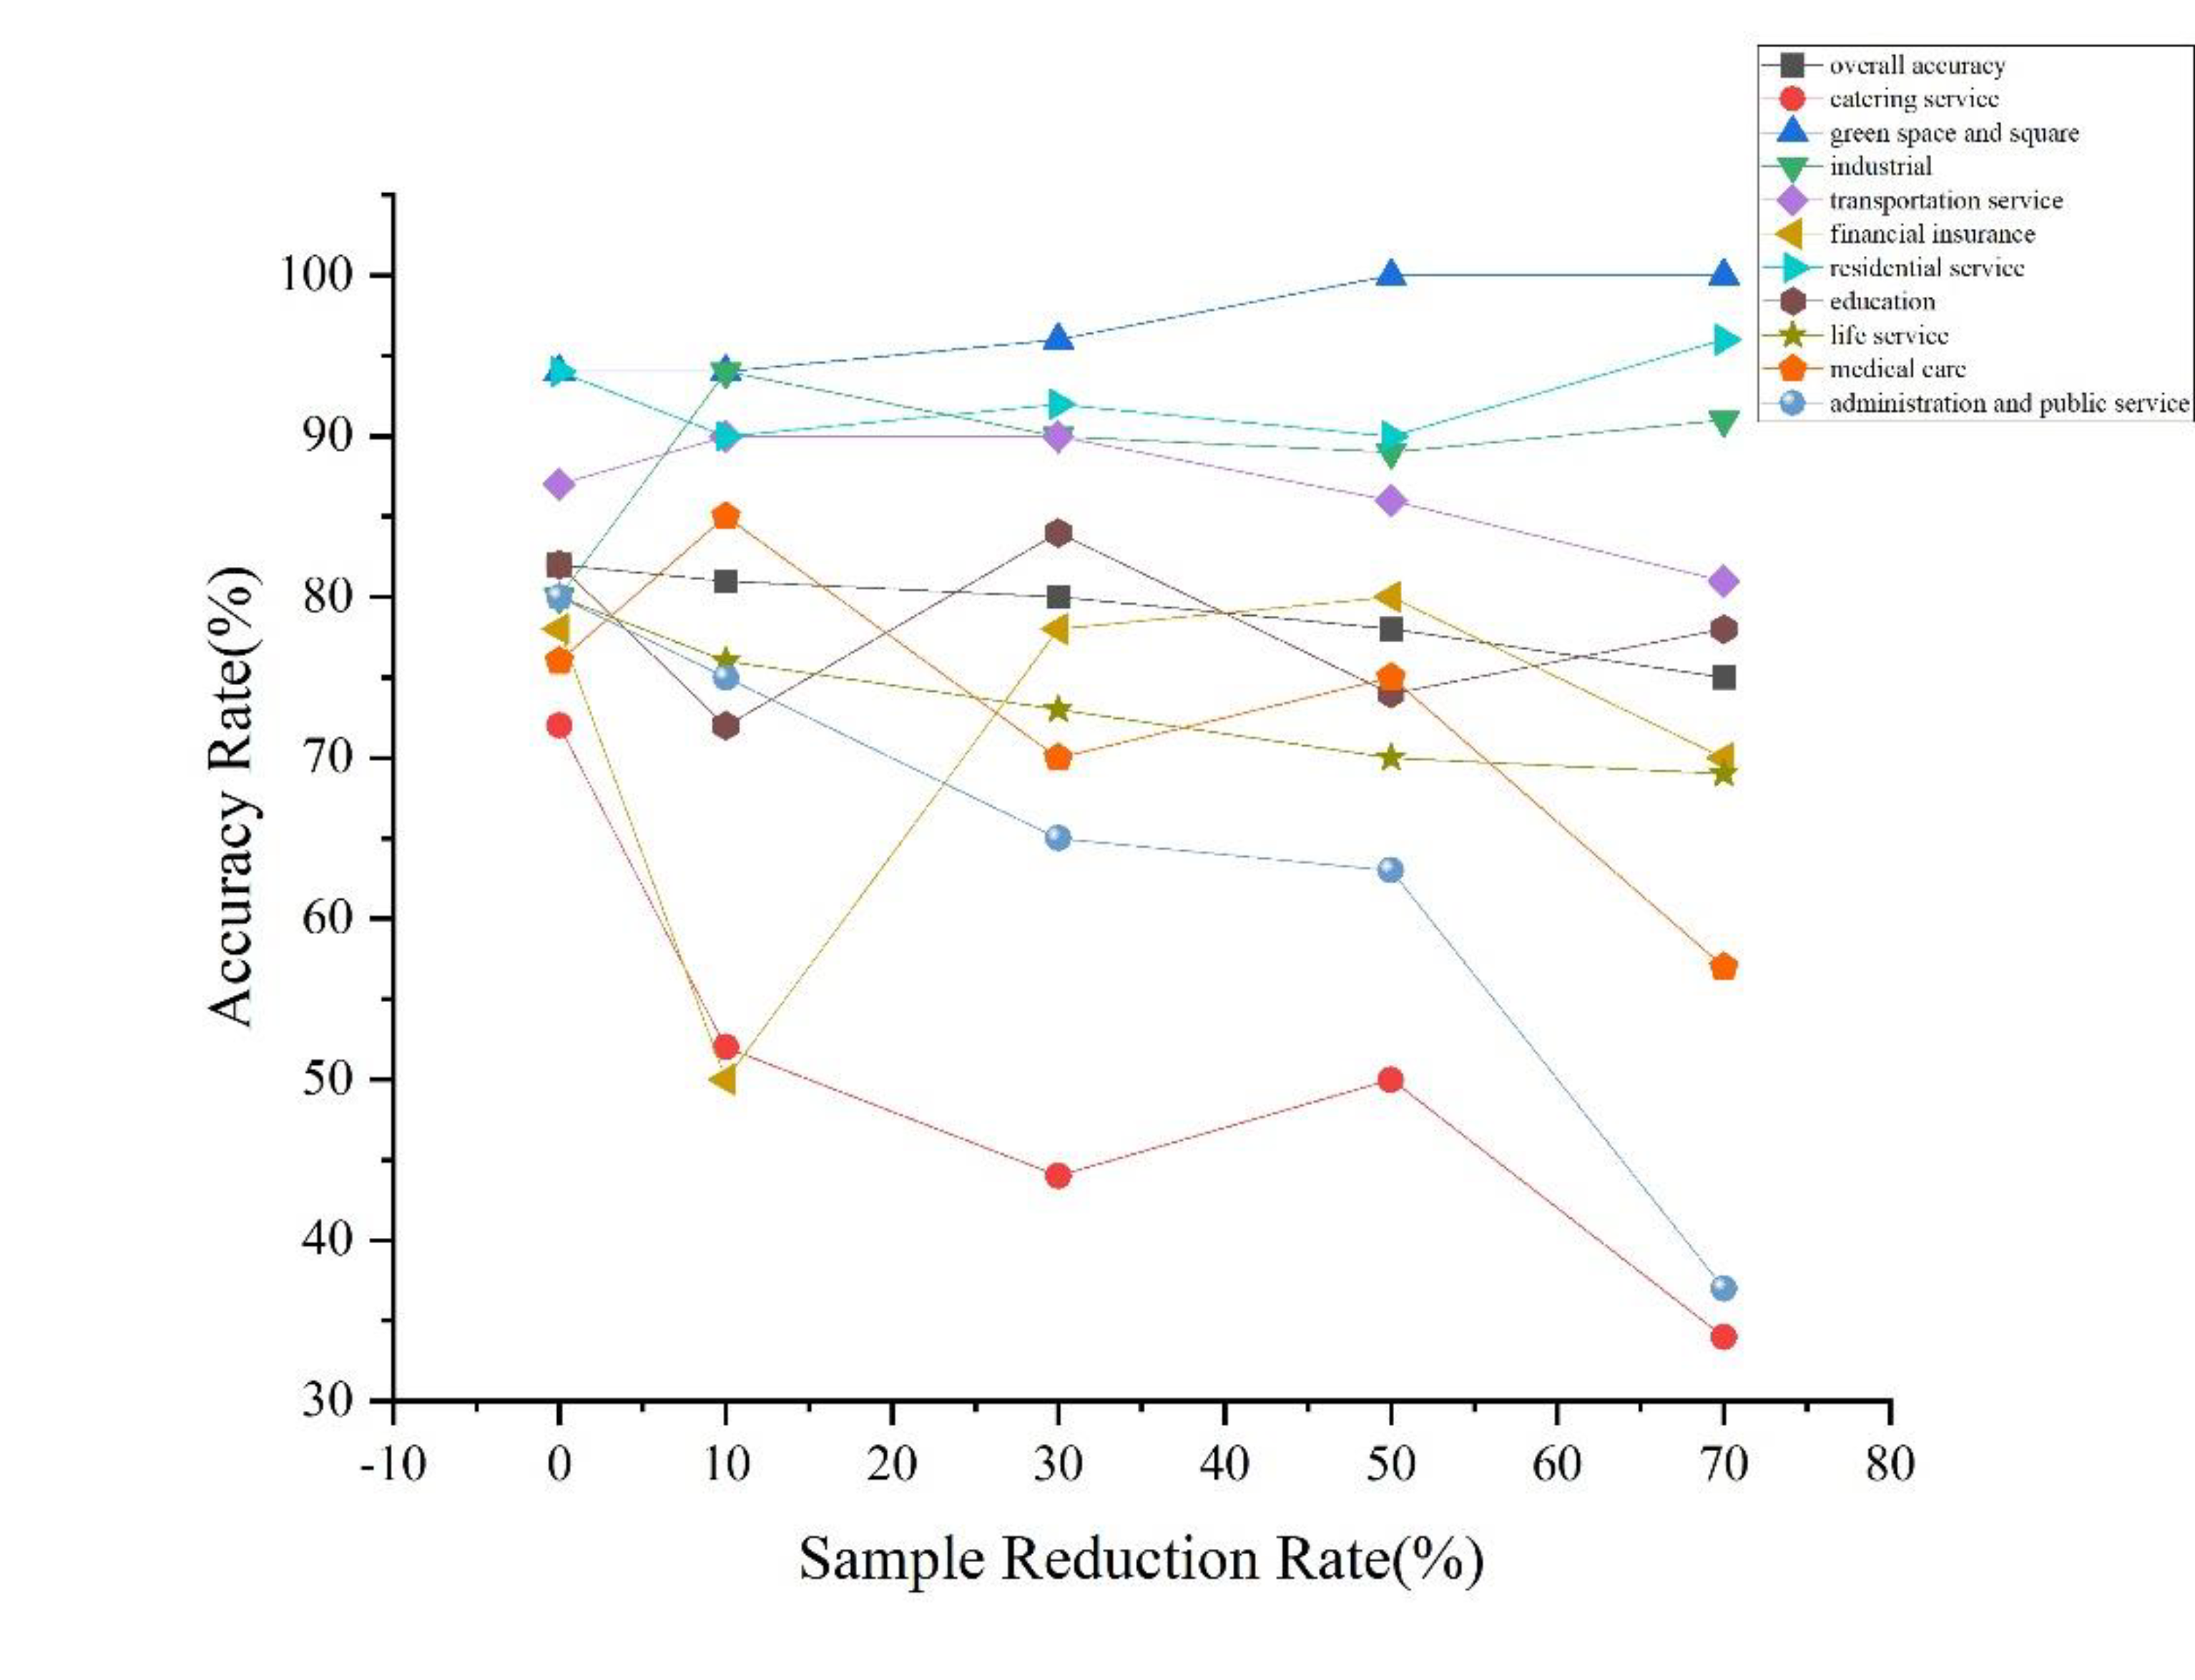
This paper used GIS to thin various POI data and randomly select 90%, 70%, 50%, and 30% of the original data to study the sensitivity of the model. After using the thinning data to re-identify the functional areas, 614, 573, 525, and 524 sample plots were randomly selected for accuracy verification to obtain the corresponding accuracy. It can be seen from Figure 9 that the overall accuracy of the model was correlated with the amount of data. A reduction of less than 50% of the amount of data had little influence on the accuracy, and the overall stability of the model was relatively high. For each single-function area, the accuracy rate of green spaces and squares and residential service areas was stable and showed an overall upward trend. The accuracy of catering services, administration and public services, and financial insurance functional areas fluctuated significantly and were the decisive factors affecting the accuracy of the model.

4.2. Analysis of Recognition Results

In single dominant function areas, the Banan company function distribution was lower. This result is likely because these areas were the location of the first development in Chongqing, and the infrastructure is relatively old, meaning that it is more difficult to meet the geographical requirements of new companies. In addition, because there is abundant natural vegetation in the south of Yudong (due to ecological protection laws), it is proposed in the development plan that large-scale development and construction will not be carried out. The number of POIs of the company is dense in the Yubei Airport Group, which mainly benefits from the airport industrial park, which was put into operation in 2011 and has experienced stable development.
The Yuzui Group in Jiangbei District is positioned in the eastern industrial new town of Chongqing and is an important part of the eastern new town development in the central city. In this group, companies and industrial parks are widely distributed, and the POI visualization is obvious. Jiulongpo District has a solid industrial foundation, and the industrial park of Xipeng also assumes the responsibilities of the “Aluminum processing Capital of China”, meaning the corporate functional area of Jiulongpo is more significant than its life service. The distribution of corporate functional zones is consistent with the planning and development of downtown Chongqing.
The distribution of residential functional areas is small. This result reflects that the land use in Chongqing is complex and mostly adopts compound buildings due to the mountainous terrain. The inexact overlap between residential and corporate functional areas reflects the separation of work and residence in the downtown area of Chongqing, which is also an important factor leading to traffic congestion. In the planning of “one master and six sub-centers”, the Shapingba District is positioned as the municipal science, education, and culture center, and so contains the most concentrated distribution of science and educational services. The nine districts of the main city all have obvious education functional areas. The area of educational services in Yubei district is the largest, and the distribution of education functions is the most extensive, which reflects the uniform distribution of educational resources in Chongqing.
Among the mixed functional areas dominated by the two functions, areas with both residential and catering services account for the largest proportion. This result is because residential and catering services both show spatially discrete distributions, lower mutual exclusivity with other functions, and can have a vertical spatial distribution. The combination of these two kinds of POI is not only related to the daily life of residents but also reflects the development of tourism in Chongqing. The mixing degree of Banan District and Jiulongpo District is relatively low, and these districts still have a lot of space available.

4.3. Innovations and Shortcomings

In this paper, the random forest algorithm was used to calculate the POI weight, which avoids the subjectivity of social recognition and has the advantage of efficient quantification. The form of OSM road networks and LSMS were combined to divide the minimum research unit, which is more consistent with the actual situation of the block. The results of urban function identification were accurate, which proves that it is reasonable to use the random forest algorithm to calculate the weight of the POI and small-scale division of research units to identify the urban function area. Based on the identification of single functional areas and mixed functional areas, this paper identified and discussed mixed functional areas dominated by two functions and comprehensive functional areas dominated by three or more functions. Finally, the recognition results were verified by visual interpretation, which is of significance compared to existing research [51,52,53,54].
Due to the unique topography and related policies, the group development mode of Chongqing’s downtown area is relatively mature and is consistent with the development plan. As part of the Chengdu–Chongqing economic circle, the territory development plan of Chongqing proposes to build a “multi center, multi-level and multi node” network city, which means that the center in Chongqing urban development model will transition from group to cities in the network. How to undertake this transformation smoothly and steadily poses new challenges for the internal spatial structure planning of the central urban area. The identification of urban functional areas is helpful to further understand the development of central Chongqing. In addition, the study of the mixing degree of urban functions can help show potential problems with urban planning and development and provide a valuable reference for future planning strategies.
This study provides a simple and reproducible way to assign POI weights, and the precision of verification was mainly due to visual interpretation, which took a lot of time. If the third national land resource survey data can be obtained, then deep learning can be used for verification, and the accuracy of verification will be more powerful and convenient. However, the latest round of the investigation was completed on 26 August 2021; given that data acquisition is difficult, the recent time period means that the data can be used in future studies.
In addition, the paper mainly considered objectivity when assigning weight to POI. Expert evaluations, questionnaire surveys, and other information could be added in future research to combine subjective and objective methods to quantify the weight of POI and promote POI accuracy. The present study of POI represents the description of spatial entity information and classifications using the Standard of Urban Land Classification and Planning Construction Land which lacks detailed and accurate standards. With the development of information technology such as machine learning, some scholars have studied the semantic relationship between POIs to obtain a more objective classification system without manual annotation. Interdisciplinary subjects provide opportunities for deepening the research content [50,57]. Questions about how to further explore the internal information of POI data remain a key difficulty for future research.

5. Conclusions

In this paper, POI data were analyzed, and the random forest algorithm was used to assign weight to POIs and to plot minimum research units to identify green spaces and squares, industrial, catering service, life service, residential service, transportation, administration and public service, education, medical care and financial insurance areas in the center in Chongqing. A total of 10 kinds of functional areas were identified, and their distribution characteristics were investigated. The functional mixing degree of the central urban area was studied, and the following conclusions were drawn:
(1) The spatial distribution of mountains and water in Chongqing makes the polycentric development obvious. This pattern of development mainly radiates outward from the business circle of each administrative region, and the land use is intensive. Excluding non-functional areas, single functional areas account for 60% of all functional areas and are mainly residential service areas. Mixed-function areas account for about 40% of the total area and are mainly composed of residential and catering services;
(2) The inner ring of the functional mixing degree is relatively high, while the outer ring is relatively low. The maximum value is located on Lianglukou street. In the interior of the plot, the functions of residential, catering, and industrial services are highly dependent on each other and have little mutual exclusivity with other functions. However, administration and public services, green spaces and squares, and other functions have strong exclusivity, resulting in many single functional areas of these categories in downtown Chongqing;
(3) The identification of residential service and green spaces and squares were the best, with a sampling accuracy of 94%. The identification of catering services was a little worse, with an overall identification accuracy of 82% and a Kappa coefficient of 0.80. Overall, these results show that the model has a good consistency and a high stability.

Author Contributions

Conceptualization, Y.L. (Ya Li), C.L. and Y.L. (Yuechen Li); methodology, Y.L. (Ya Li) and C.L.; validation, C.L., Y.L. (Ya Li) and Y.L. (Yuechen Li); formal analysis, Y.L. (Ya Li) and Y.L. (Yuechen Li); data curation, C.L. and Y.L. (Yuechen Li); writing—original draft preparation, Y.L. (Ya Li), C.L. and Y.L. (Yuechen Li); writing—review and editing, Y.L. (Yuechen Li), Y.L. (Ya Li) and C.L. All authors have read and agreed to the published version of the manuscript.

Funding

This research was funded by the Fundamental Research Funds for the Central University, grant number SWU021003; the National Natural Science Foundation of China, grant number 41571419; and the National Social Science Fund of China, grant number 19XGL027.

Institutional Review Board Statement

Not applicable.

Informed Consent Statement

Not applicable.

Data Availability Statement

No new data were created or analyzed in this study. Data sharing is not applicable to this article.

Acknowledgments

Thanks to the anonymous reviewers and editors for their valuable comments and suggestions.

Conflicts of Interest

The authors declare no conflict of interest.

References

  1. Wang, Z.; Ma, D.; Sun, D.; Zhang, J. Identification and analysis of urban functional area in Hangzhou based on OSM and POI data. PLoS ONE 2021, 16, e0251988. [Google Scholar] [CrossRef] [PubMed]
  2. Chen, Y.; Chen, X.; Liu, Z.; Li, X. Understanding the spatial organization of urban functions based on co-location patterns mining: A comparative analysis for 25 Chinese cities. Cities 2020, 97, 102563. [Google Scholar] [CrossRef]
  3. Xue, B.; Xiao, X.; Li, J.Z.; Xie, X. Analysis of spatial economic structure of northeast China cities based on points of interest big data. Sci. Geogr. Sin. 2020, 40, 691–700. [Google Scholar]
  4. Li, Q.; Zheng, X.Q.; Chao, Y. Research on function identification and distribution characteristics of Wuhan supported by big data. Sci. Surv. Mapp. 2020, 45, 119–125. [Google Scholar]
  5. Li, J.; Xie, X.; Zhao, B.; Xiao, X.; Qiao, J.; Ren, W. Identification of urban functional area by using multisource geographic data: A case study of Zhengzhou, China. Complexity 2021, 2021, 8875276. [Google Scholar] [CrossRef]
  6. Zheng, Z.J.; Zheng, R.B.; Xu, J.Y.; Wang, J.Q. Identification of Urban Functional Regions Based on POI Data and Place2vec Model. Geogr. Geo Inf. Sci. 2020, 36, 48–56. [Google Scholar]
  7. Yang, J.; Li, C.; Liu, Y. Urban functional area identification method and its application combined OSM road network data with POI data. Geomat. World 2020, 27, 1–6. [Google Scholar]
  8. Chen, Y.; Liu, X.; Li, X.; Liu, X.; Yao, Y.; Hu, G.; Xu, X.; Pei, F. Delineating urban functional areas with building-level social media data: A dynamic time warping (DTW) distance based k-medoids method. Landsc. Urban Plan. 2017, 160, 48–60. [Google Scholar] [CrossRef]
  9. Long, Y.; Liu, X. Automated identification and characterization of parcels (AICP) with OpenStreetMap and Points of Interest. Environ. Plan. B 2013, 43, 498–510. [Google Scholar]
  10. Sun, Z.; Jiao, H.; Wu, H.; Peng, Z.; Liu, L. Block2vec: An Approach for Identifying Urban Functional Regions by Integrating Sentence Embedding Model and Points of Interest. Int. J. Geo Inf. 2021, 10, 339. [Google Scholar] [CrossRef]
  11. Liu, H.; Xu, Y.; Tang, J.; Deng, M.; Huang, J.; Yang, W.; Wu, F. Recognizing urban functional zones by a hierarchical fusion method considering landscape features and human activities. Trans. GIS 2020, 24, 1359–1381. [Google Scholar] [CrossRef]
  12. Jia, F.X.; Yan, J.F.; Tian, W. Research on scoring evaluation model and functional regions indentification constructed by big data. Sci. Surv. Mapp. 2021, 46, 172–178. [Google Scholar]
  13. Chi, J.; Jiao, L.M.; Dong, T.; Gu, Y.Y.; Ma, Y.L. Quantitative identification and visualization of urban functional area based on POI data. J. Geomat. 2016, 41, 68–73. [Google Scholar]
  14. Miao, R.; Wang, Y.; Li, S. Analyzing Urban Spatial Patterns and Functional Zones Using Sina Weibo POI Data: A Case Study of Beijing. Sustainability 2021, 13, 647. [Google Scholar] [CrossRef]
  15. Yu, B.; Wang, Z.; Mu, H.; Sun, L.; Hu, F. Identification of Urban Functional Regions Based on Floating Car Track Data and POI Data. Sustainability 2019, 11, 6541. [Google Scholar] [CrossRef] [Green Version]
  16. Yang, Z.S.; Su, J.H.; Yang, H.; Zhao, Y.H. Exploring urban functional areas based on multi-source data: A case study of Beijin. Geogr. Res. 2021, 40, 477–494. [Google Scholar]
  17. Lan, T.; Shao, G.; Xu, Z.; Tang, L.; Sun, L. Measuring urban compactness based on functional characterization and human activity intensity by integrating multiple geospatial data sources. Ecol. Indic. 2021, 121, 107177. [Google Scholar] [CrossRef]
  18. Jiang, S.; Alves, A.; Rodrigues, F.; Ferreira, J.J.; Pereira, F.C. Mining point-of-interest data from social networks for urban land use classification and disaggregation. Comput. Environ. Urban Syst. 2015, 53, 36–46. [Google Scholar] [CrossRef] [Green Version]
  19. Kefalas, P.; Manolopoulos, Y. A time-aware spatio-textual recommender system. Expert Syst. Appl. 2017, 78, 396–406. [Google Scholar] [CrossRef]
  20. Massimo, D.; Ricci, F. Tourism, Popularity, novelty and relevance in point of interest recommendation: An experimental analysis. Inf. Technol. 2021, 23, 473–508. [Google Scholar]
  21. Rahmani, H.A.; Aliannejadi, M.; Baratchi, M.; Crestani, F. A Systematic Analysis on the Impact of Contextual Information on Point-of-Interest Recommendation. ACM Trans. Inf. Syst. 2021, 34, 88. [Google Scholar] [CrossRef]
  22. Niu, H.; Silva, E.A. Delineating urban functional use from points of interest data with neural network embedding: A case study in Greater London. Comput. Environ. Urban Syst. 2021, 88, 101651. [Google Scholar] [CrossRef]
  23. Rodrigues, F.; Pereira, F.C.; Alves, A.; Jiang, S.; Ferreira, J. Automatic classification of points-of-interest for land-use analysis. In Proceedings of the Geoprocessing: The Fourth International Conference on Advanced Geographic Information Systems, Valencia, Spain, 30 January–4 February 2012. [Google Scholar]
  24. Rim, N.W.; Choe, K.W.; Scrivner, C.; Berman, M.G. Introducing Point-of-Interest as an alternative to Area-of-Interest for fixation duration analysis. PLoS ONE 2021, 16, e0250170. [Google Scholar] [CrossRef] [PubMed]
  25. Zhang, J.Q.; Shi, W.B.; Xiu, C.L. Urban research using Points of Interest data in China. Sci. Geogr. Sin. 2021, 41, 140–148. [Google Scholar]
  26. Brezzi, M.; Veneri, P. Assessing Polycentric Urban Systems in the OECD: Country, Regional and Metropolitan Perspectives. Eur. Plan. Stud. 2014, 23, 1128–1145. [Google Scholar] [CrossRef]
  27. Śleszyński, P. Problemy delimitacji miejskich obszarów funkcjonalnych w Polsce. Rozw. Reg. Polit. Reg. 2015, 29, 37–53. [Google Scholar] [CrossRef] [Green Version]
  28. Kudełko, J.; Musiał-Malago, M. The diversity of demographic potential and socioeconomic development of urban functional areas—Evidence from Poland. Cities 2022, 123, 103516. [Google Scholar] [CrossRef]
  29. Zhao, W.F.; Li, Q.Q.; Li, B.J. Extracting hierarchical landmarks from urban POI data. J. Remote Sens. 2011, 15, 973–988. [Google Scholar]
  30. Wu, S.Y. Urban Functional Area Identification Based on Remote Sensing Images and User Visit Data. Ph.D. Thesis, Beijing University of Civil Engineering and Architecture, Beijing, China, 2021. [Google Scholar]
  31. Wu, H.; Lin, A.; Xing, X.; Song, D.; Li, Y. Identifying core driving factors of urban land use change from global land cover products and POI data using the random forest method. Int. J. Appl. Earth Obs. Geoinf. 2021, 103, 102475. [Google Scholar] [CrossRef]
  32. Zhang, L.; Wang, L.L.; Zhang, X.D.; Liu, S.R.; Sun, P.S.; Wang, T.L. The basic principle of random forest and its application in ecology: A case study 0f Pinus yunnanensis. Acta Ecol. Sin. 2014, 34, 650–659. [Google Scholar]
  33. Zhao, H.B.; Wei, J.C.; Sun, D.Q.; Liu, Y.X.; Wang, S.; Tan, J.T.; Miao, C.H. Recognition and spatio-temporal evolution analysis of productionliving-ecological spaces based on the random forest model: A case study of Zhengzhou city, China. Geogr. Res. 2021, 40, 945–957. [Google Scholar]
  34. Yao, Y.; Li, X.; Liu, X.P.; Liu, P.H.; Liang, Z.T.; Zhang, J.B.; Mai, K. Sensing spatial distribution of urban land use by integrating points-of-interest and Google Word2Vec model. Int. J. Geogr. Inf. Sci. 2016, 31, 825–848. [Google Scholar] [CrossRef]
  35. Jonietz, D.; Zipf, A. Defining Fitness-for-Use for Crowdsourced Points of Interest (POI). ISPRS Int. J. Geo Inf. 2016, 5, 149. [Google Scholar] [CrossRef] [Green Version]
  36. Cao, Y.H.; Liu, J.P.; Wang, Y.; Wang, L.J.; Wu, W.Z.; Su, F.Z. A Study on the Method for Functional Classification of Urban Buildings by Using POI Data. J. Geo Inf. Sci. 2020, 22, 1339–1348. [Google Scholar]
  37. Xue, B.; Li, J.Z.; Xiao, X.; Xie, X.; Lu, C.P.; Ren, W.X.; Jiang, L. Overview of man-land relationship research based on POI data: Theory, method and application. Geogr. Geo Inf. Sci. 2019, 35, 51–60. [Google Scholar]
  38. Ministry of Housing and Urban–Rural Development of the People’s Republic of China. National Standards of the People’s Republic of China; Code for Classification of Urban Land Use and Planning Standards of Development; China Planning Press: Beijing, China, 2012. [Google Scholar]
  39. Zhao, Y.C.; Zhang, Y.; Wang, H.Y.; Du, X.; Li, Q.Z.; Zhu, J. Intraday variation mapping of population age structure via urban-functional-region-based Scaling. Remote Sens. 2021, 13, 805. [Google Scholar] [CrossRef]
  40. Gong, P.; Chen, B.; Li, X.; Liu, H.; Xu, B. Mapping Essential Urban Land Use Categories in China (EULUC-China): Preliminary results for 2018. Sci. Bull. 2019, 65, 182–187. [Google Scholar] [CrossRef] [Green Version]
  41. Hong, Y.; Yao, Y. Hierarchical community detection and functional area identification with OSM roads and complex graph theory. Int. J. Geogr. Inf. Sci. 2019, 33, 1569–1587. [Google Scholar] [CrossRef]
  42. Xiao, L. The Research on Urban Block. Ph.D. Thesis, Tongji University, Shanghai, China, 2006. [Google Scholar]
  43. Kang, Y.H.; Wang, Y.Y.; Xia, Z.J.; Chi, J.; Jiao, L.M.; Wei, Z.W. Identification and classification of Wuhan urban districts based on POI. J. Geomat. 2018, 43, 81–85. [Google Scholar]
  44. Chen, A.X. Research on Classification of Essential Urban Land Use Categories (EULUC) in the Central City of Chongqing; Chongqing Normal University: Chingqing, China, 2021. [Google Scholar]
  45. Breiman, L. Random forest. Mach. Learn. 2001, 45, 5–32. [Google Scholar] [CrossRef] [Green Version]
  46. Nicodemus, K.K. Letter to the Editor: On the stability and ranking of predictors from random forest variable importance measures. Brief. Bioinform. 2011, 12, 369–373. [Google Scholar] [CrossRef] [PubMed] [Green Version]
  47. Han, H.; Guo, X.; Yu, H. Variable selection using mean decrease accuracy and mean decrease gini based on random forest. In Proceedings of the 2016 7th IEEE International Conference on Software Engineering and Service Science (ICSESS), Beijing, China, 26–28 August 2016. [Google Scholar]
  48. Pu, D.C.; Wang, G.Z.; Zhang, Z.M.; Niu, X.F.; He, G.J.; Long, T.F.; Yin, R.Y.; Jiang, W.; Sun, J.Y. Urban Area Extraction based on Independent Component Analysis and Random Forest Algorithm. J. Geo Inf. Sci. 2020, 22, 1597–1606. [Google Scholar]
  49. Chen, M.J.; Wang, X.Q.; Wu, S.Y. Importance analysis of soil erosion influencing factors based on random forest. J. Nat. Disasters 2019, 28, 209–219. [Google Scholar]
  50. Zhao, P.J.; Cao, Y.S. Identifying metro trip purpose using multi-source geographic big data and machine learning approach. J. Geo Inf. Sci. 2020, 22, 1753–1765. [Google Scholar]
  51. Hu, X.M.; Li, X.L.; Wei, F. A POI data- based study of the urban functional areas of Chongqing and their mix degree recognition. J. Southwest Univ. Nat. Sci. Ed. 2021, 43, 164–173. [Google Scholar]
  52. Li, M.Y.; Ma, Y.; Sun, X.M.; Wang, J.Y.; Dang, A.R. Application of spatial and temporal entropy based on multi-source data for measuring the mix degree of urban functions. City Plan. Rev. 2018, 42, 97–103. [Google Scholar]
  53. Luo, S.H.; Liu, Y.; Du, M.Y.; Gao, S.Y.; Wang, P.F.; Liu, X.Y. The influence of spatial grid division on the layout analysis of urban functional areas. Int. J. Geo Inf. 2021, 10, 189. [Google Scholar] [CrossRef]
  54. Duan, Y.M.; Liu, Y.; Liu, X.H.; Wang, H.L. Identification of polycentric urban structure of central Chongqing using points of interest big data. J. Nat. Resour. 2018, 33, 788–800. [Google Scholar]
  55. Yu, W.; Ai, T. The visualization and analysis of POI features under network space supported by kernel density estimation. Acta Geod. Cartogr. Sin. 2015, 44, 82–90. [Google Scholar]
  56. Ding, Y.W.; Xu, H.W.; Wang, C.H. Research on urban functional area recognition integrating OSM road network and POI data. Geogr. Geo Inf. Sci. 2020, 36, 57–63. [Google Scholar]
  57. Liu, K.; Yin, L.; Lu, F.; Mou, N. Visualizing and exploring POI configurations of urban regions on POI-type semantic space. Cities 2020, 99, 102610. [Google Scholar] [CrossRef]
Figure 1. The study area of central Chongqing. (a) Map of China: it was obtained from the Ministry of Natural Resources of the People’s Republic of China website (http://bzdt.ch.mnr.gov.cn/browse.html?picId=%224o28b0625501ad13015501ad2bfc0480%22, accessed on 20 June 2022), Drawing review NO:GS(2020)4619, (b) map of Chongqing, (c) map of study area: Chongqing Urban and Rural Master Plan (2007–2020): A, Shuitu group; B, Caijia group; C, Yuelai group; D, airport group; E, Lijia group; F, Renhe group; G, Tangjiatuo group; H, Shapingba group; I, Guanyinqiao group; J, Yuzhong group; K, Nanping group; L, Dayangshi group; M, Dadukou group; N, Lijiatuo group; O, Beibei group; P, Xiyong group; Q, Xipeng group; R, Longxing group; S, Yuzui group; T, Chayuan group; U, Jieshi group.
Land 11 00996 g001
Figure 2. Logical framework diagram.
Land 11 00996 g002
Figure 3. The importance ranking of influencing factors.
Land 11 00996 g003
Figure 4. Functional area identification diagram.
Land 11 00996 g004
Figure 5. Distribution diagram of the functional mixing degree. (a) administration and public service, (b) green spaces and squares, (c) transportation service, (d) medical care, (e) education, (f) industrial, (g) residential service, (h) life service, (i) financial insurance, (j) catering service.
Land 11 00996 g005aLand 11 00996 g005bLand 11 00996 g005c
Figure 6. Distribution diagram of the functional mixing degree.
Land 11 00996 g006
Figure 7. Distribution of mixed functional areas. A–K in the Figure represent: A, life service; B, industrial; C, transportation service; D, catering service; E, residential service; F, green spaces and squares; G, education; H, administration and public service; I, financial insurance; J, medical care; K, comprehensive functional area.
Land 11 00996 g007
Figure 8. Baidu Street view of some single functional areas. (a) Baiyunzhai Park (green spaces and squares), (b) Fire Brigade (administration and public service), (c) Chongqing City Management College (education), (d) Paradise walk (life service), (e) Ruida industry (industrial), (f) Villa (residential service).
Land 11 00996 g008
Figure 9. Sensitivity analysis of the sample reduction and accuracy rate.
Land 11 00996 g009
Table 1. Weight index classification table of POI.
Functional Area ClassificationType of POIMDAMDA Standardized Value
Green Spaces and SquaresGreen Spaces and Squares26.653.61
IndustrialCompany156.0621.14
Industrial Park11.271.53
Catering ServiceCatering Service55.267.49
Life ServiceShopping Service98.9113.40
Life Service32.634.42
Residential ServiceResidence33.694.56
Accommodation Service36.654.96
Transportation ServiceCar Service44.926.08
Transportation Facilities39.305.32
Administration and Public ServiceGovernment Agencies10.621.44
Communal Facilities21.772.95
EducationEducation28.903.91
Sports and Leisure42.675.78
Medical CareMedical Care84.7111.47
Financial InsuranceFinancial Insurance14.231.93
Table 2. Recognition results of the confusion matrix.
ClassABCDEFGHIJTotalConsumer’s Accuracy
A80711110000010080%
B2806064200010080%
C0187084000010087%
D021364700005072%
E010047200005094%
F000024710005094%
G0920428210010082%
H030033140005080%
I030020112503278%
J140016000385076%
Total831109737887587422538682
Producer’s accuracy96%73%90%97%53%63%94%95%100%100%
Overall accuracy82%
Kappa coefficient0.80
Note: A–J in the table represent as Figure 7.
Publisher’s Note: MDPI stays neutral with regard to jurisdictional claims in published maps and institutional affiliations.