Article

Dynamic Evolution and Quantitative Attribution of Soil Erosion Based on Slope Units: A Case Study of a Karst Plateau-Gorge Area in SW China

1
School of Karst Science, Guizhou Normal University, Guiyang 550001, China
2
State Engineering Technology Institute for Karst Desertification Control, Guiyang 550001, China
3
Institute of Science and Technology Information, Guizhou Academy of Agriculture Sciences, Guiyang 550006, China
*
Author to whom correspondence should be addressed.
Land 2022, 11(8), 1134; https://doi.org/10.3390/land11081134
Submission received: 10 June 2022 / Revised: 14 July 2022 / Accepted: 20 July 2022 / Published: 24 July 2022
(This article belongs to the Special Issue Karst Land System and Sustainable Development)

Abstract

:
Exploring the dynamics of soil erosion and identifying its driving mechanisms is key to understanding soil erosion processes, particularly in karst areas. In this study, the RUSLE model, optimized on the basis of rocky desertification factors, was used to estimate soil erosion in a karst plateau gorge area in SW China. The spatial and temporal dynamics of soil erosion in the region over the past 20 years were analyzed on the basis of slope units, while the relationship between soil erosion and elevation, slope, fractional vegetation cover (FVC), karst rocky desertification (KRD), rainfall, and land use cover/change (LUCC) was identified quantitatively by the geographical detector on the basis of spatial heterogeneity. The results showed that: (1) The no erosion area decreased from 2000 to 2020, with the highest proportion of light to medium erosion and an increasing trend of soil erosion. (2) Soil erosion conversion mainly occurred between no erosion, slight erosion, and light erosion. (3) The hotspots of erosion occurred in high slope–low elevation and high slope–high elevation units, while the coldspots of erosion occurred in low slope–low elevation units. (4) Soil erosion was positively correlated with FVC and slope, and negatively correlated with KRD. (5) The dominant factor of soil erosion changed from KRD-slope to LUCC-slope and finally to elevation-slope, while the q value of rainfall-elevation had the most significant increase throughout the study period. This study will help to advance the goal of sustainable development of soil and water conservation in karst areas.

1. Introduction

Soil erosion is considered to be the greatest threat to land degradation, seriously affecting terrestrial ecosystem security [1,2]. Soil erosion disrupts the soil agglomeration structure [3], resulting in the redistribution of soil nutrients [4], which changes soil carbon transport [5] and affects soil ecological service functions [6]. Soil erosion also reduces soil resources, exacerbates the scarcity of land resources [3], affects vegetation growth [7] and food security, and hinders sustainable socio-economic development [8]. To effectively control soil erosion and its negative socio-environmental impacts, the formation process, dynamic evolution, and hazards of soil erosion must be robustly assessed [9,10]. China is one of the countries most severely affected by soil erosion in the world, especially in the karst region of southwestern China [11]. Soil erosion leading to rock desertification has become a major environmental disaster limiting people’s production and development [12]. In recent years, numerous studies have focused on soil erosion in karst areas, including erosion processes, spatial and temporal evolution, driving mechanisms [13], dynamic modeling [14], sensitivity evaluation [15], and control measures [16]. However, constrained by the highly heterogeneous geographical environment and complex erosion patterns [17], many research methods are difficult to perform and apply in karst areas, and little is known about soil erosion processes and drivers in karst areas. These analyses are fundamental requirements for combating soil erosion, and in particular, understanding the long-term dynamic evolution of soil erosion and its interactive drivers is essential for land managers to assess soil erosion changes and formulate soil and water conservation policies.
With the increasing abundance of environmental data, scientists have developed several mathematical models to emulate soil erosion processes at different spatial and temporal scales on the basis of topographic, climatic, soil, land use, and vegetation cover data [18,19]. Among the existing erosion models, the RUSLE model [16], the SWAT model [20], and the WEPP model [21] have been proven to be applicable at different spatial scales. They are widely used in complex topographic units due to their simple structure and GIS compatibility [22], such as in the karst areas of southwest China [23] or Cuba [24]. However, many studies have not considered the control of soil erosion by karst conditions and the direct use of the RUSLE model may overestimate soil erosion in karst areas [25]. Karst landscapes have a double-layer structure of surface and subsurface. Large exposures of carbonate rocks on the surface alter surface runoff velocity and flow patterns and intercept sediment runoff; secondary pore spaces are developed underground and contribute to the rapid transport of runoff sediment. Dai found a correlation coefficient of −0.076 (p < 0.01) between soil erosion and bedrock exposure on the basis of an artificially designed soil trough device with a double-layer spatial structure and simulated rock desertification [26]. Gao and Wang optimized the RUSLE model by introducing the rock desertification factor on this basis [23], and the results showed that the simulation accuracy of the RUSLE model was significantly improved after optimization. Therefore, this study used the RUSLE optimized to estimate soil erosion in karst areas.
Appropriate study units are an important prerequisite for scientific spatial analysis. In current soil erosion studies, the common study units are administrative units, grid units, and geographical feature units. However, the assessment results based on these study units are difficult to meet the requirements for fine-grained soil erosion assessment or control, which may make it difficult to carry out accurate soil and water conservation work. The slope cell, proposed by Carrara, is a topographic unit cut by a combination of ridgelines, valley lines, terrace boundaries, and valley bottom boundaries [27]. Slope units are constructed according to hydrological processes, ensuring maximum homogeneity within the unit and maximum heterogeneity between different units [28], and are currently widely used in the spatial distribution of landslides [29], sensitivity analysis [30], and prediction studies [31], among others, with the slope unit being a more sophisticated unit than traditional units. Compared with traditional units, the slope unit has higher classification performance and more stable estimation coefficients, which better reflect the actual geographical environment and reduce the uncertainty of control factors [32]. Using slope units as a basis for analyzing soil erosion can help in the analysis of dominant factors of soil erosion.
In this study, we aimed to investigate the long-term soil erosion evolution patterns in karst areas and the interaction of their driving forces. To achieve the objectives, the following analyses were made: (1) simulation of soil erosion by the RUSLE model optimized by the rocky desertification factor; (2) analysis of the long-term spatial and temporal dynamic evolution pattern of soil erosion; (3) identification of the dominant and interacting factors of soil erosion evolution. The results of the study can provide a scientific reference for determining suitable soil erosion control schemes in karst areas, and this contribution will also help to advance the sustainable development goals of soil and water conservation in karst areas.

2. Materials and Methods

2.1. Study Area

The karst zone of southwest China, centered on Guizhou, is the largest continuous zone of karst and has the most typical and complex karst landscape in the world. The study area (105°34′59″~105°43′06″ E, 25°37′18″~25°42′37″ N) was selected in southwest Guizhou, south of Guanling County and north of Zhenfeng County, on both sides of the Beipanjiang River Gorge, with a total area of 51.6197 km2 (Figure 1). The altitude range of the area is between 443 and 1366 m a.s.l., which is a typical plateau canyon landform. The region is under a dry and hot southern subtropical river valley climate, with warm and dry winters and springs, and high temperatures and rain in summer and autumn [33]. Meteorological data show no significant increase or decrease in temperature or precipitation, both varied within regular ranges from 2000 to 2020. The average annual temperature is 18.4 °C, and the average annual precipitation is 1100 mm, with May to October accounting for more than 80% of the total annual precipitation. The lithology is mainly Middle Tertiary limestone and dolomite, and the soil is calcareous [34].
The research region is characterized by a rocky desert landscape, with fragmented and shallow soils, being prone to soil erosion in the presence of water, and having an extremely fragile ecological environment. Coupled with extensive deforestation and agricultural activities, the region has been caught in a vicious cycle of “environmental fragility–resource shortage-poverty, resource plunder–environmental degradation–further poverty” [35]. Since the beginning of the 21st century, the study area has been designated as a model area for the integrated management of karstic desertification ecology and environment, implementing natural restoration measures such as returning farmland to forest and grass. Therefore, the selected study area is typical, representative, and exemplary in the management of karst soil erosion.

2.2. Data

The data required for this study included remote sensing images, rainfall data, land use data, topographic and geomorphological data, and soil type data. The consistency and reliability of all data were strictly checked and controlled by the data production department.
(1) Remote sensing images and topographic data were obtained from the Geospatial Data Cloud (http://www.gscloud.cn (accessed on 7 October 2020)), with a resolution of 30 m. Remote sensing images without clouds in the study area were selected as the data source. (2) Rainfall data were obtained from the China Meteorological Data Network (http://data.cma.cn (accessed on 15 October 2020)), using ArcGIS10.2 to spatially interpolate and rasterize the rainfall dataset of the meteorological stations. (3) Land use data were obtained in two parts: The data from 2000 and 2005 were obtained from remote sensing images as the source data due to the long period and accuracy problems, and the initial land use data were obtained through supervised classification and manual interpretation at a later stage. The data from 2010 to 2020 were obtained through remote sensing image interpretation and correction by the research team through long-term field investigation. (4) Soil type data were obtained from the Resource and Environment Science and Data Centre of the Chinese Academy of Sciences (http://www.resdc.cn (accessed on 15 October 2020)) and calibrated concerning the 1:50,000 soil type map of Guizhou Province and the results of the team’s field soil sample collection.

2.3. Methods

2.3.1. RUSLE Model

The RUSLE model is a modified version of the Universal Loss Equation (USLE). Due to its simple structure and ease of operation, scholars worldwide widely use it to estimate soil erosion. Its equation is as follows:
A = R × K × L × S × C × P
where A is the average annual soil erosion (t·ha−1·a−1), which means the average annual soil loss from fine gully or inter-gully erosion on slopes caused by rainfall and runoff. R is the rainfall erosivity factor (MJ·mm·ha−1·h−1·a−1), K is the soil erodibility factor (t·ha·h·MJ−1·mm−1·ha−1), L is the slope length factor (dimensionless), S is the slope gradient factor (dimensionless), C is the vegetation cover and management factor (dimensionless), and P is the soil and water conservation measures factor (dimensionless).
Gao modified the RUSLE model based on the correlation coefficients between exposed bedrock and surface sediments [23], with the following expressions:
A = (1 − 0.0762 × α) R × K × L × S × C × P
where α is a correction factor whose value is determined by the average of the bedrock exposure rates for the different rocky desertification classes (Table 1). Different equations were chosen to simulate soil erosion depending on the lithology of the study area. Equation (1) was selected for non-karst regions, and Equation (2) was selected to simulate soil erosion in karst regions.
The K factor is a measure of soil erosion resistance and reflects the sensitivity of the soil to erosion. The K factor is calculated using the erosion-productivity impact calculator (EPIC) model (Equation (3)) developed by Williams [36].
K = { 0.2 + 0.3 exp [ 0.0256 S A N ( 1 S I L 100 ) ] } ( S I L C L A + S I L ) 0.3 [ 1.0 0.25 C C + exp ( 3.72 2.95 ) ] [ 1.0 0.7 S N 1 S N 1 + exp ( 5.51 + 22.9 S N 1 ) ]
where K is the soil erodibility factor in t·hm2·h·MJ−1·mm−1·hm−2. S A N is the sand content;   S I L is the silt content; C L A is the clay content; C is the organic carbon content, S N 1 = 1 S A N / 100 .
The R factor is the driving force behind soil erosion and reflects the potential for soil loss through precipitation. As there are no weather stations in the study area, the nearest weather station to the study area was selected and the R factor for the study area was obtained by interpolation using the rainfall erosion equation (Equation (4)) created by Arnoldus [37]. The equation is as follows:
R = i = 1 12 1.735 10 [ 1.5 log ( P i 2 P ) 0.8188 ]
where R is the rainfall erosion factor, P i is the monthly rainfall (mm), and P is the annual rainfall (mm).
The L factor and S factor are closely related to topography and accumulated flow, and L factor and S factor together reflect the influence of topographic features on soil erosion. LS represents the ratio of soil loss on a given slope length and gradient to soil loss on a typical slope in a standard runoff plot, all other things being equal, and the LS value is proportional to soil loss, playing an accelerating role in soil erosion [38]. We chose to calculate the L factor [39] and S factor [40] by applying the formulae to the soil and rocky mountainous areas of southwest China as follows:
L = ( λ 22.13 ) m
m = β β + 1
β = ( s i n θ / 0.0896 ) / [ 3 ( s i n θ ) 0.8 + 0.56 ]
S = { 10.80 s i n θ + 0.03   ( θ < 5 ° ) 16.80 s i n θ 0.50   (   5 ° θ 10 ° ) 20.204 s i n θ 1.2404   ( 10 ° θ > 25 ° ) 29.585 s i n θ 5.6079   ( θ > 25 ° )
where λ is the sum of the slope lengths in the horizontal direction, m is the slope length factor, β is a factor related to the slope value, and θ is the slope angle extracted on the basis of the digital elevation.
C factor refers to the ratio of soil loss under a particular crop or vegetation cover to that of continuous recreational land after cultivation, all other factors being equal, and this factor measures the inhibitory effect of vegetation cover and management on soil erosion [41,42]. Currently, there are two forms for obtaining C factor values, equation calculation and assigning values on the basis of land use type. In this paper, the formula created by Durigon [43] was chosen to calculate the C value as follows:
C = N D V I + 1 2
where N D V I is the normalized vegetation index, calculated from the near-infrared band and visible red band in remote sensing imagery.
P factor refers to the ratio of soil erosion with soil conservation measures to soil erosion with down-slope planting, and its value is distributed between 0 and 1. When p = 1, it means that no water conservation measures are taken in the unit area; when p = 0, it means that no soil erosion will theoretically occur in the unit area, such as water bodies, construction sites, etc. The p-values were obtained by summarizing the results of previous authors in the karst region of southern China [23,44,45]. The results are presented in the Table 2.

2.3.2. Geographical Detector
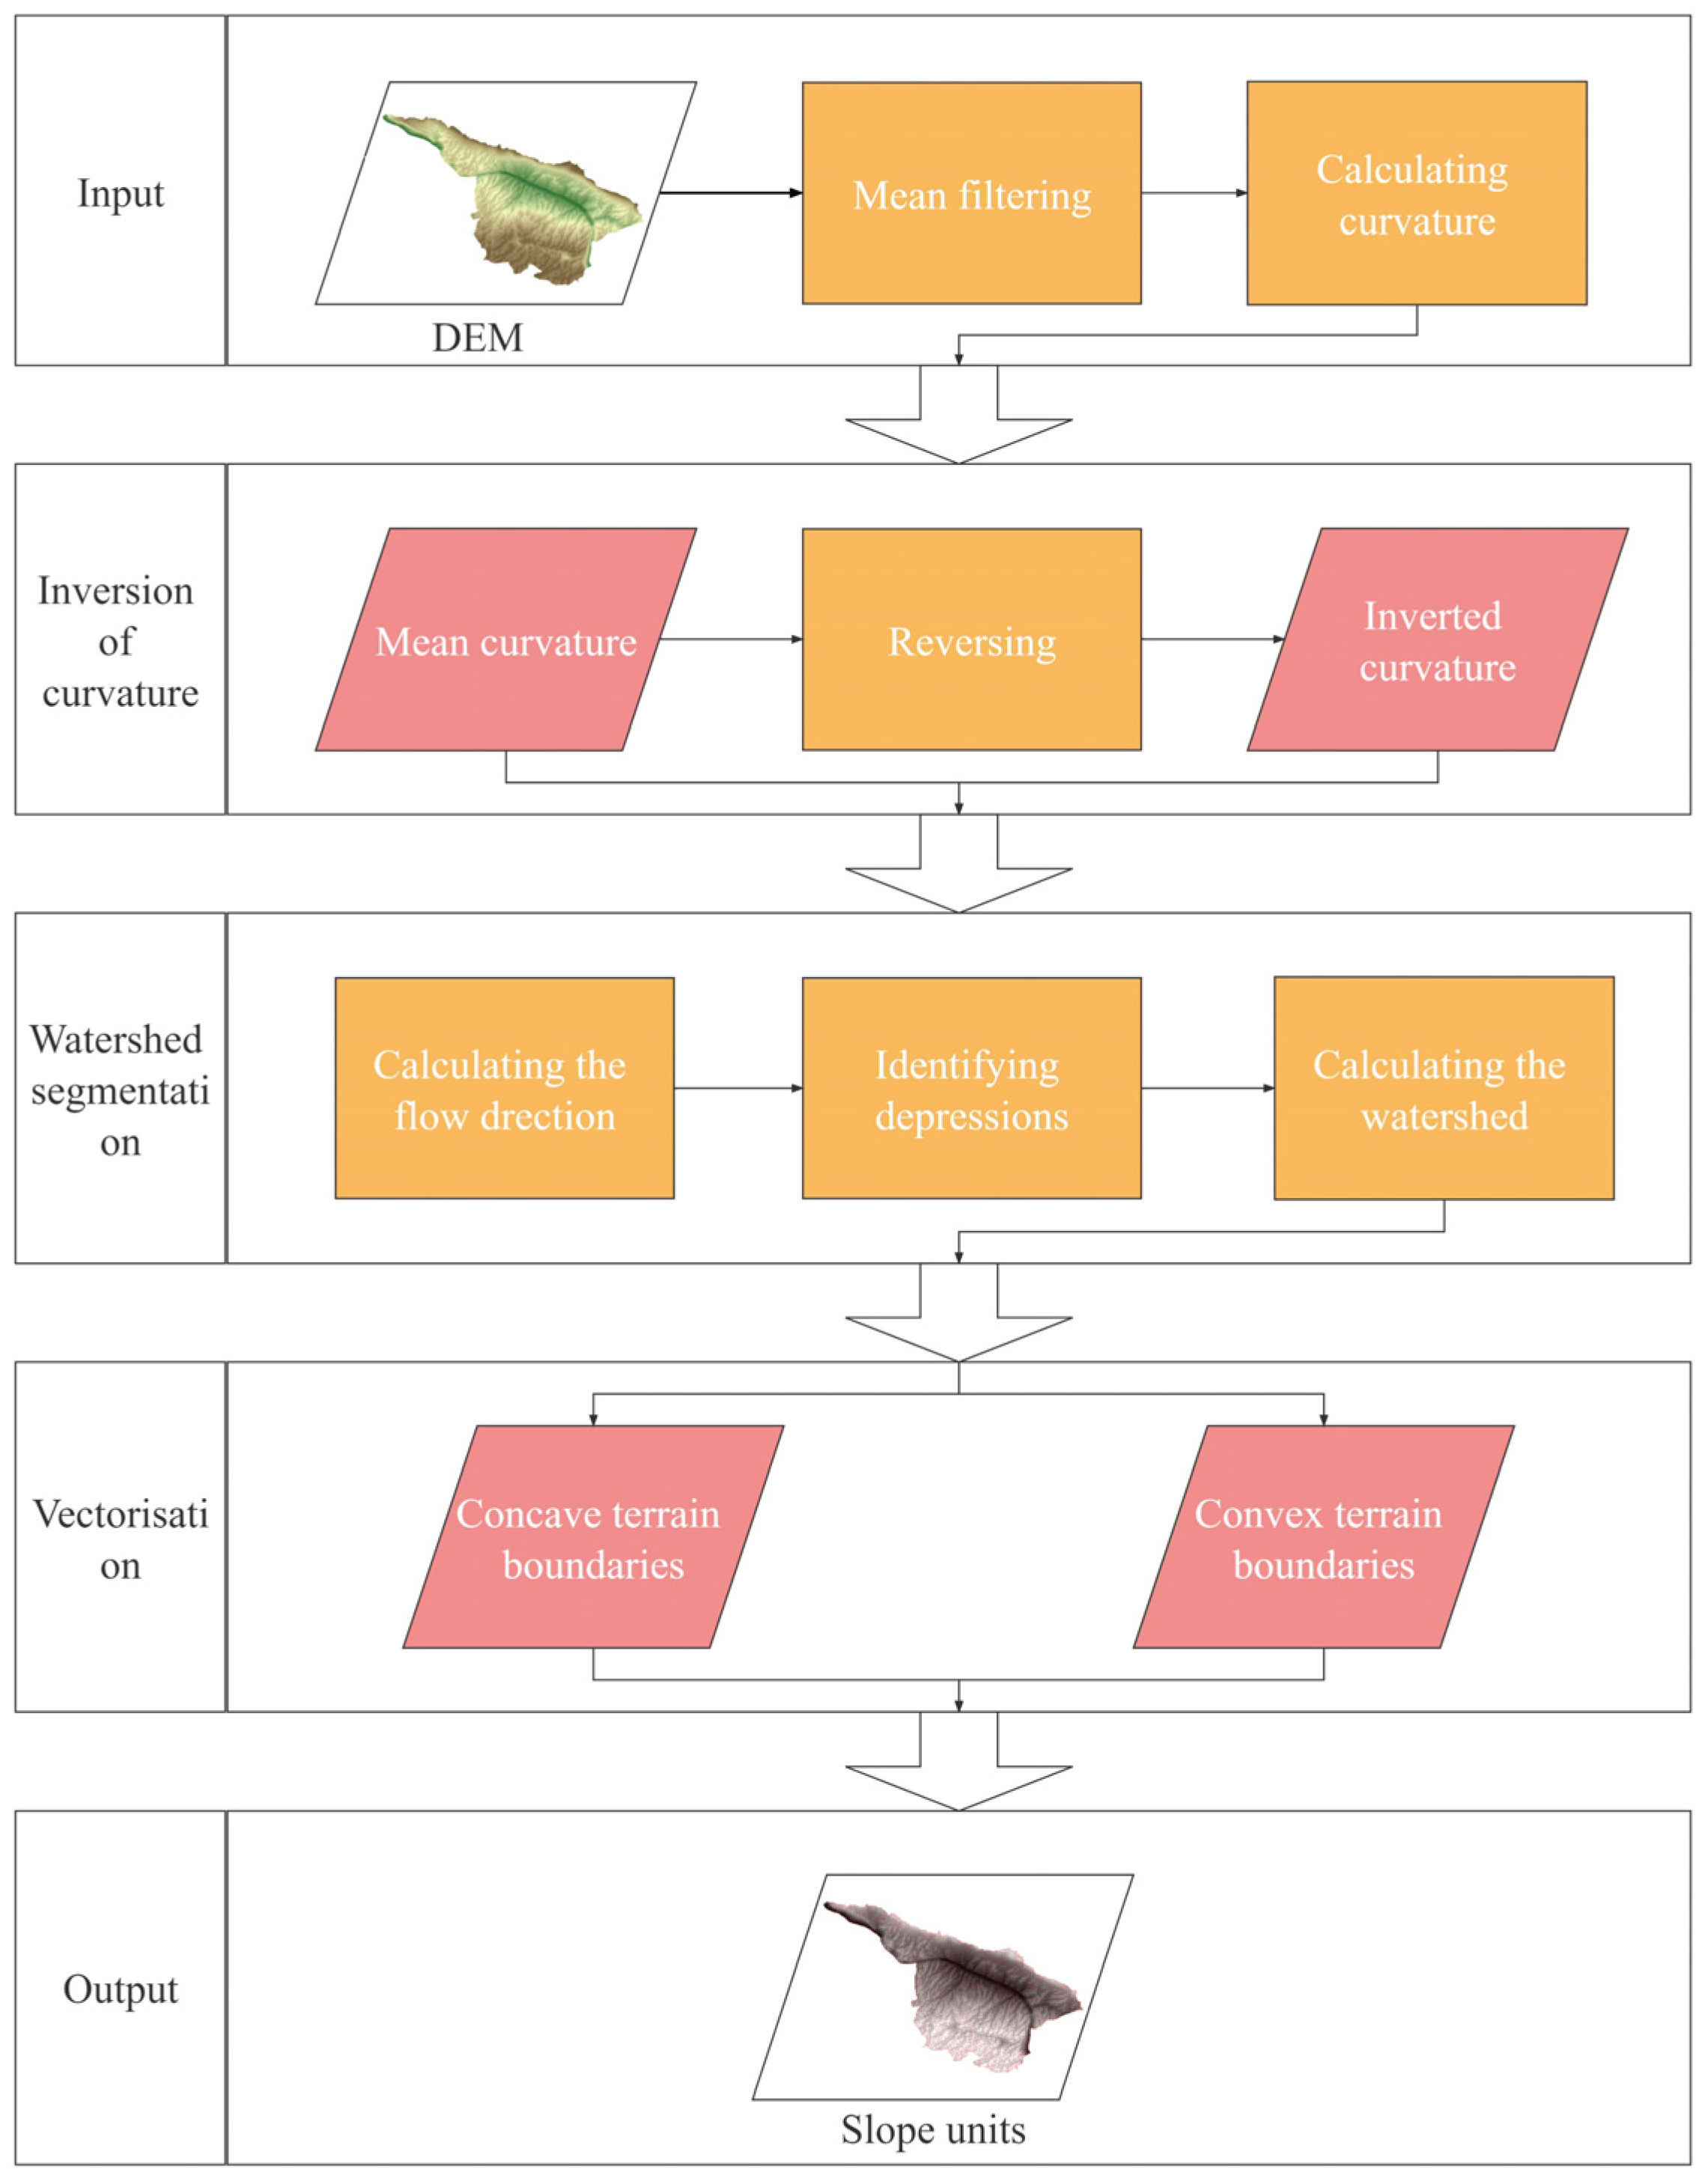
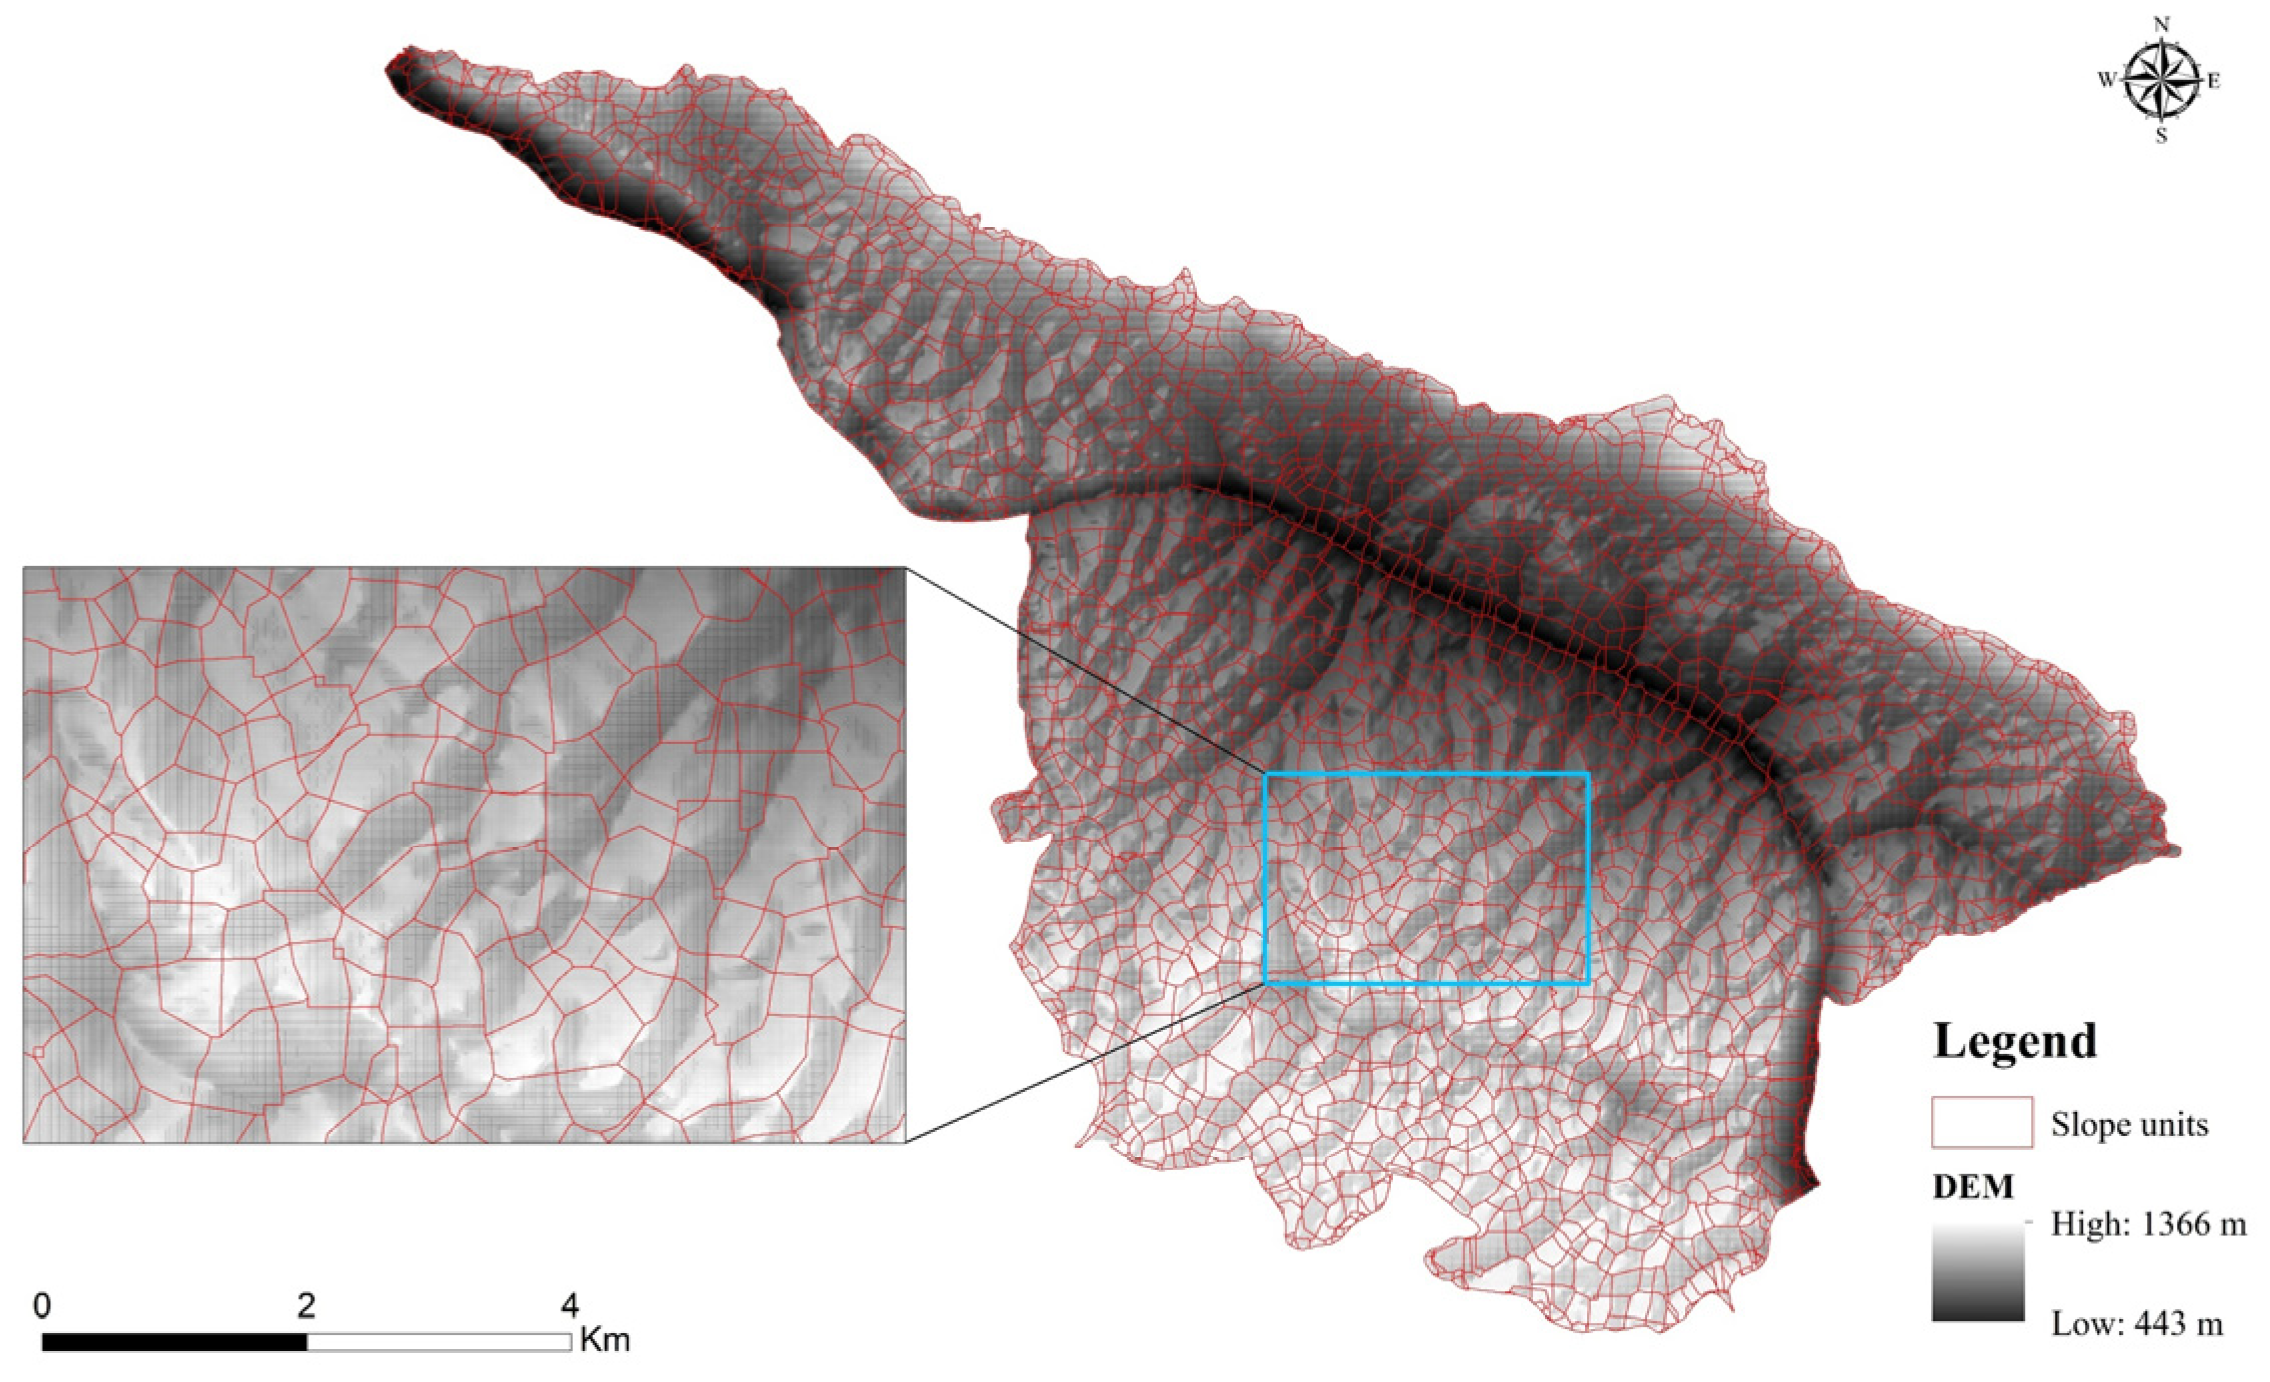
The geographical detector is a statistical method that allows for the exploration of spatial dissimilarity and its drivers [46]. The principle of the geographical detector is based on the idea that if the independent variable has a significant effect on the dependent variable, then there should be some similarity in the spatial distribution of the two [47]. It consists of four models, namely, factor detector, interaction detector, risk detector, and ecological detector. In this paper, we analyzed the spatial heterogeneity with the factor detector, interaction detector, and risk detector.
The factor detector detects the extent to which the independent variable can explain the spatial divergence of the dependent variable, and the q value can measure the extent of explanation with the following expression:
q = 1 S S W S S T
S S W = h = 1 L N h σ h 2 ,   S S T = N σ 2
where h = 1,2,..., L is the partition of the independent and dependent variables; N h and N are the number of cells in stratum h and all partitions; σ h 2 and σ 2 are the variances of the dependent variables in stratum h and all partitions. S S W and S S T are the sum of the within-stratum variances and the total variance of all partitions, respectively. q has a value of [0,1], with larger values indicating that the independent variable explains more of the dependent variable.
The interaction detector can be used to detect the interaction between factors X S , i.e., the change in the degree of explanation of the dependent variable Y when X 1 and X 2 act together. The principle is to calculate the q values of X 1 and X 2 separately, then to calculate the new layer q ( X 1 X 2 ) values by superimposing the X 1 and X 2 layers and comparing them among the three. The comparison between the two factors can be divided into the following results: non-linearly diminished, one-factor non-linearly diminished, two-factor enhanced, independent, and non-linearly enhanced.
The risk detector can be used to count the mean values of attributes between sub-regions of a single factor and to determine whether the heterogeneity between sub-regions is significant. The mean attribute results are expressed as numerical data, while whether the means are significantly different is expressed as ‘N/Y’ binary data.

2.3.3. Slope Units

The slope cell delineation method based on the principle of curvature-based watershed segmentation [48] proceeds as follows (Figure 2).

3. Results

3.1. Spatial and Temporal Dynamics of Soil Erosion

The research region contains both karstic and non-karstic areas. Therefore, the rationalized RUSLE model was used to estimate soil erosion in karst areas, and the conventional RUSLE model was used for soil erosion in non-karst areas. Soil erosions in the study area were 6.11, 9.35, 7.49, and 8.88 t·ha−1·a−1 in 2000, 2005, 2010, 2015, and 2020, respectively. This result was close to the average soil erosion in the Beipanjiang basin for the last 20 years published in the Guizhou Water Resources Bulletin (http://mwr.guizhou.gov.cn/ (accessed on 28 October 2020)) of 5.29 t·ha−1·a−1.
On the basis of the Standards for Classification and Gradation of Soil Erosion (SL190-2007) issued by the Ministry of Water Resources of the People’s Republic of China, soil erosion in the study area was classified into seven classes: no erosion (construction land, water, and exposed bedrock), slight, light, medium, strong, very strong, and severe (Figure 3). The no erosion zone was the most widespread, accounting for approximately 50% of the total area, and was mainly located in the central, western, and north-western parts of the study area. Starting in 2010, there was a significant decrease in no erosion in the west and north-west, with no erosion mainly in the central region. This was followed by slight erosion and light erosion, accounting for about 40% of the total area, which was more evenly distributed in the study area. Medium erosion and strong erosion were less frequent and were mainly distributed along the southeastern edge, northwestern edge, and northern edge of the study area. Very strong and severe erosion accounted for less than 1% of the study area, with almost no extreme or severe erosion occurring in the research region.
As shown in Table 3, regional soil erosion fluctuated and increased during the study period, with the highest percentage of light and medium soil erosion overall, and the most extensive area with no erosion and light erosion. The ratio of different intensities of erosion showed an increase in medium, strong, and very strong erosion, with the greatest increase in intensity and extreme intensity in 2005, with 23.39% and 8.77% increases, respectively, compared to 2000. The amount of light erosion decreased, especially by 31.2% in 2005, compared to 2000. The area of no erosion showed the greatest variation in the different intensities of erosion, with a general trend of increasing and then decreasing; the area of no erosion increased by 7.26% from 2000 to 2005, while it decreased by 21.28% from 2005 to 2020. Unlike the erosion-free area, the erosion area ratio generally tended to increase at all other intensities over the study period. In addition, we found that in 2005, the area without erosion was the most extensive, while the total soil erosion was the highest, with medium and strong erosion accounting for more than 60% of the total regional erosion, and the area with strong erosion increased by 3.72% compared to 2000.

3.2. Regional Differentiation Based on Different Slope Units

The study area was divided into 2491 slope units on the basis of hydrological processes (Figure 4). The minimum cell size was 1.17 × 10² m2, while the maximum cell size was 9.72 × 10⁴ m2 with an average cell size of 2.07 × 10⁴ m2.

3.2.1. Soil Erosion Class Transfer Based on Slope Units

The mean soil erosion values in terms of slope units are available in six classes: no erosion, slight, mild, medium, strong, and very strong. To further understand the quantitative changes in soil erosion in the region, we produced soil erosion grade transfer maps for four time periods: 2000–2005, 2005–2010, 2010–2015, and 2015–2020 (Figure 5). The result shows that the transfer in soil erosion levels during the study period occurred mainly between no erosion, slight erosion, and light erosion, with medium, strong, and very strong erosion remaining relatively stable. We found that 17.5% and 9.8% of no erosion changed to slight and light erosion, respectively, during 2000–2005. Slight erosion converted mainly to no erosion and light erosion by 18.66% and 31.9%, respectively. From 2005 to 2010, 37.87% and 24.56% of no erosion transformed to minor and minor erosion, respectively. Slight and medium erosion moved mainly to light erosion, with 27.81% and 71.65% transfers, respectively. Soil erosion transferred in a similar direction for both the 2010–2015 and 2015–2020 periods. The soil erosion classes were relatively stable, except for some of the slight erosion transferring to light erosion, with soil erosion transition occurring mainly between the same soil erosion grade.

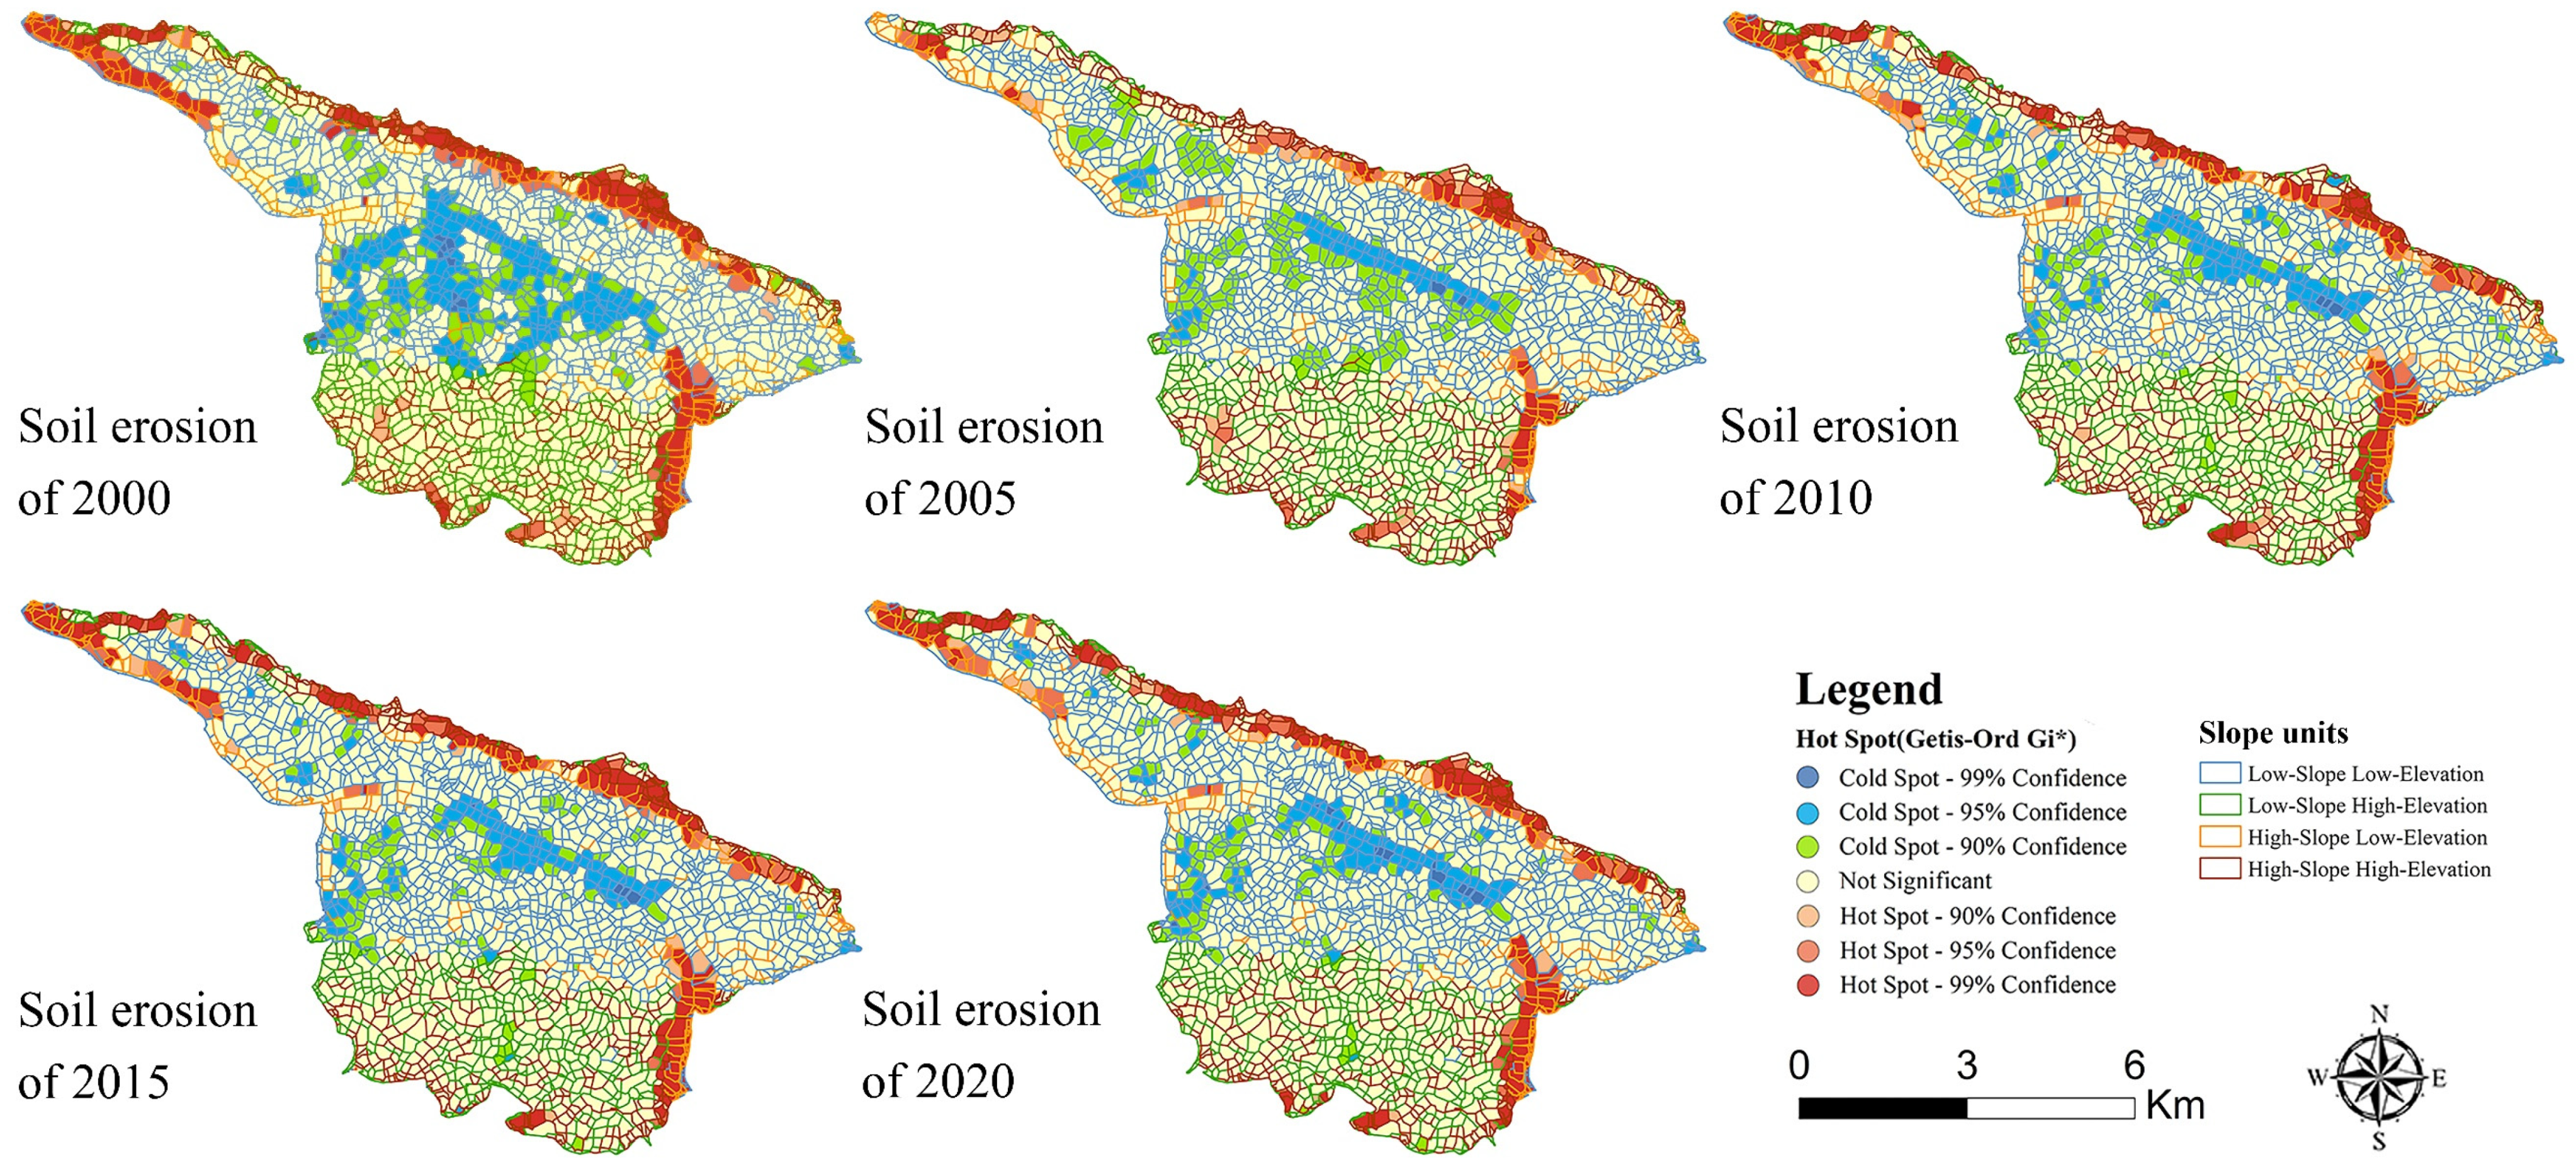
3.2.2. Hotspot Analysis Based on Different Types of Slope Units

We used a slope of 25° and an elevation of 896 m as the distinction. If the slope was less than or equal to 25°, then it was defined as low slope, and otherwise as high slope. An elevation less than or equal to 896 m was defined as low elevation, otherwise as high elevation. The slope units were divided into four unit types: low slope–low elevation, low slope–high elevation, high slope–low elevation, and high slope–high elevation. The four unit types were overlaid with the results of the soil erosion hotspot analysis as shown in Figure 6. The result shows that the hotspots of erosion remained relatively stable and the erosion coldspots decreased significantly during the study period. In general, erosion hotspots were mainly located in the high slope–low elevation and high slope–high elevation units along the northern, north-western, and south-eastern edges of the study area, with a few erosion hotspots also located in the high slope–high elevation units in the south. Coldspot areas of erosion were mainly found in the central and western low slope–low elevation units. From 2000 to 2020, the erosion coldspots decreased from the central and western low slope–low elevation units to the central low slope–low elevation units, and the erosion cold point confidence level decreased from 95% to 90%.

3.3. Quantitative Attribution of Soil Erosion Variability

The mean values of soil erosion and the dominant values of the environmental factors within each cell were assigned to the corresponding cell. The contribution of each environmental factor to soil erosion (q) was quantified with the help of the geographical detector, and the results showed significant (p < 0.05) confidence in the q values for all factors.

3.3.1. Soil Erosion Risk Analysis

The risk detector of the geographical detector can detect potential relationships between factor variation and soil erosion risk by analyzing the mean soil erosion values for each interval within the factor. As shown in Figure 7, the differences in soil erosion risk under each factor sub-interval were significant. There was no significant pattern in the mean soil erosion values within the rainfall intervals, and the differences in soil erosion risk were not significant. Soil erosion risk increased with increasing vegetation cover, but the trend of increasing soil erosion risk decreased after the vegetation cover exceeded 80%, and the maximum soil erosion value did not exceed 15 t·ha−1·a−1. The risk of soil erosion increased and then decreased with increasing altitude. When the elevation was below 1170 m a.s.l., the risk of soil erosion increased as elevation increased. When the elevation was higher than 1170 m a.s.l., the risk of soil erosion decreased as the elevation increased. Soil erosion risk was graded between different land use zones, with soil erosion risk ranked as grassland > wood land > utilized land > water > arable land > construction land. The risk of soil erosion gradually changed from high to low from no rocky desertification to heavy rocky desertification. The average soil erosion was 11.76 t·ha−1·a−1 in areas without rocky desertification and 6.46 t·ha−1·a−1 in areas with heavy rocky desertification. The soil erosion risk increased with slope, and the growth of increase in soil erosion risk increased when the slope increased, with a maximum value of 38.57 t·ha−1·a−1.

3.3.2. Single-Factor Analysis

Elevation, rainfall, slope, fractional vegetation cover (FVC), karst rocky desertification (KRD), and land use cover/change (LUCC) were analyzed by the geographic detector. As shown in Figure 8, the overall contribution of the six individual factors to soil erosion results during the study period was slope > LUCC > KRD > FVC > rainfall > elevation, but there were minor differences between years. The q value of KRD gradually decreased but also contributed to the spatial diversity of soil erosion only less than slope and LUCC. In 2000, the q value for KRD was 0.15, which was only lower than the slope. From 2005 onwards, the contribution of KRD to soil erosion results was lower than that of LUCC. LUCC was the environmental factor that had the greatest influence on soil erosion results apart from the slope, with a relatively stable q value. From 2000 to 2005, the q value for FVC decreased from 0.1 to 0.03. Moreover, from 2005 to 2020, the q value for FVC increased from 0.03 to 0.05. The contribution of rainfall to soil erosion results in the study area was low, but in individual years, it had an important influence. For example, the q value for rainfall in 2020 was as high as 0.08, contributing more to the soil erosion results than LUCC, KRD, and FVC. The effect of elevation alone on soil erosion results was not significant.

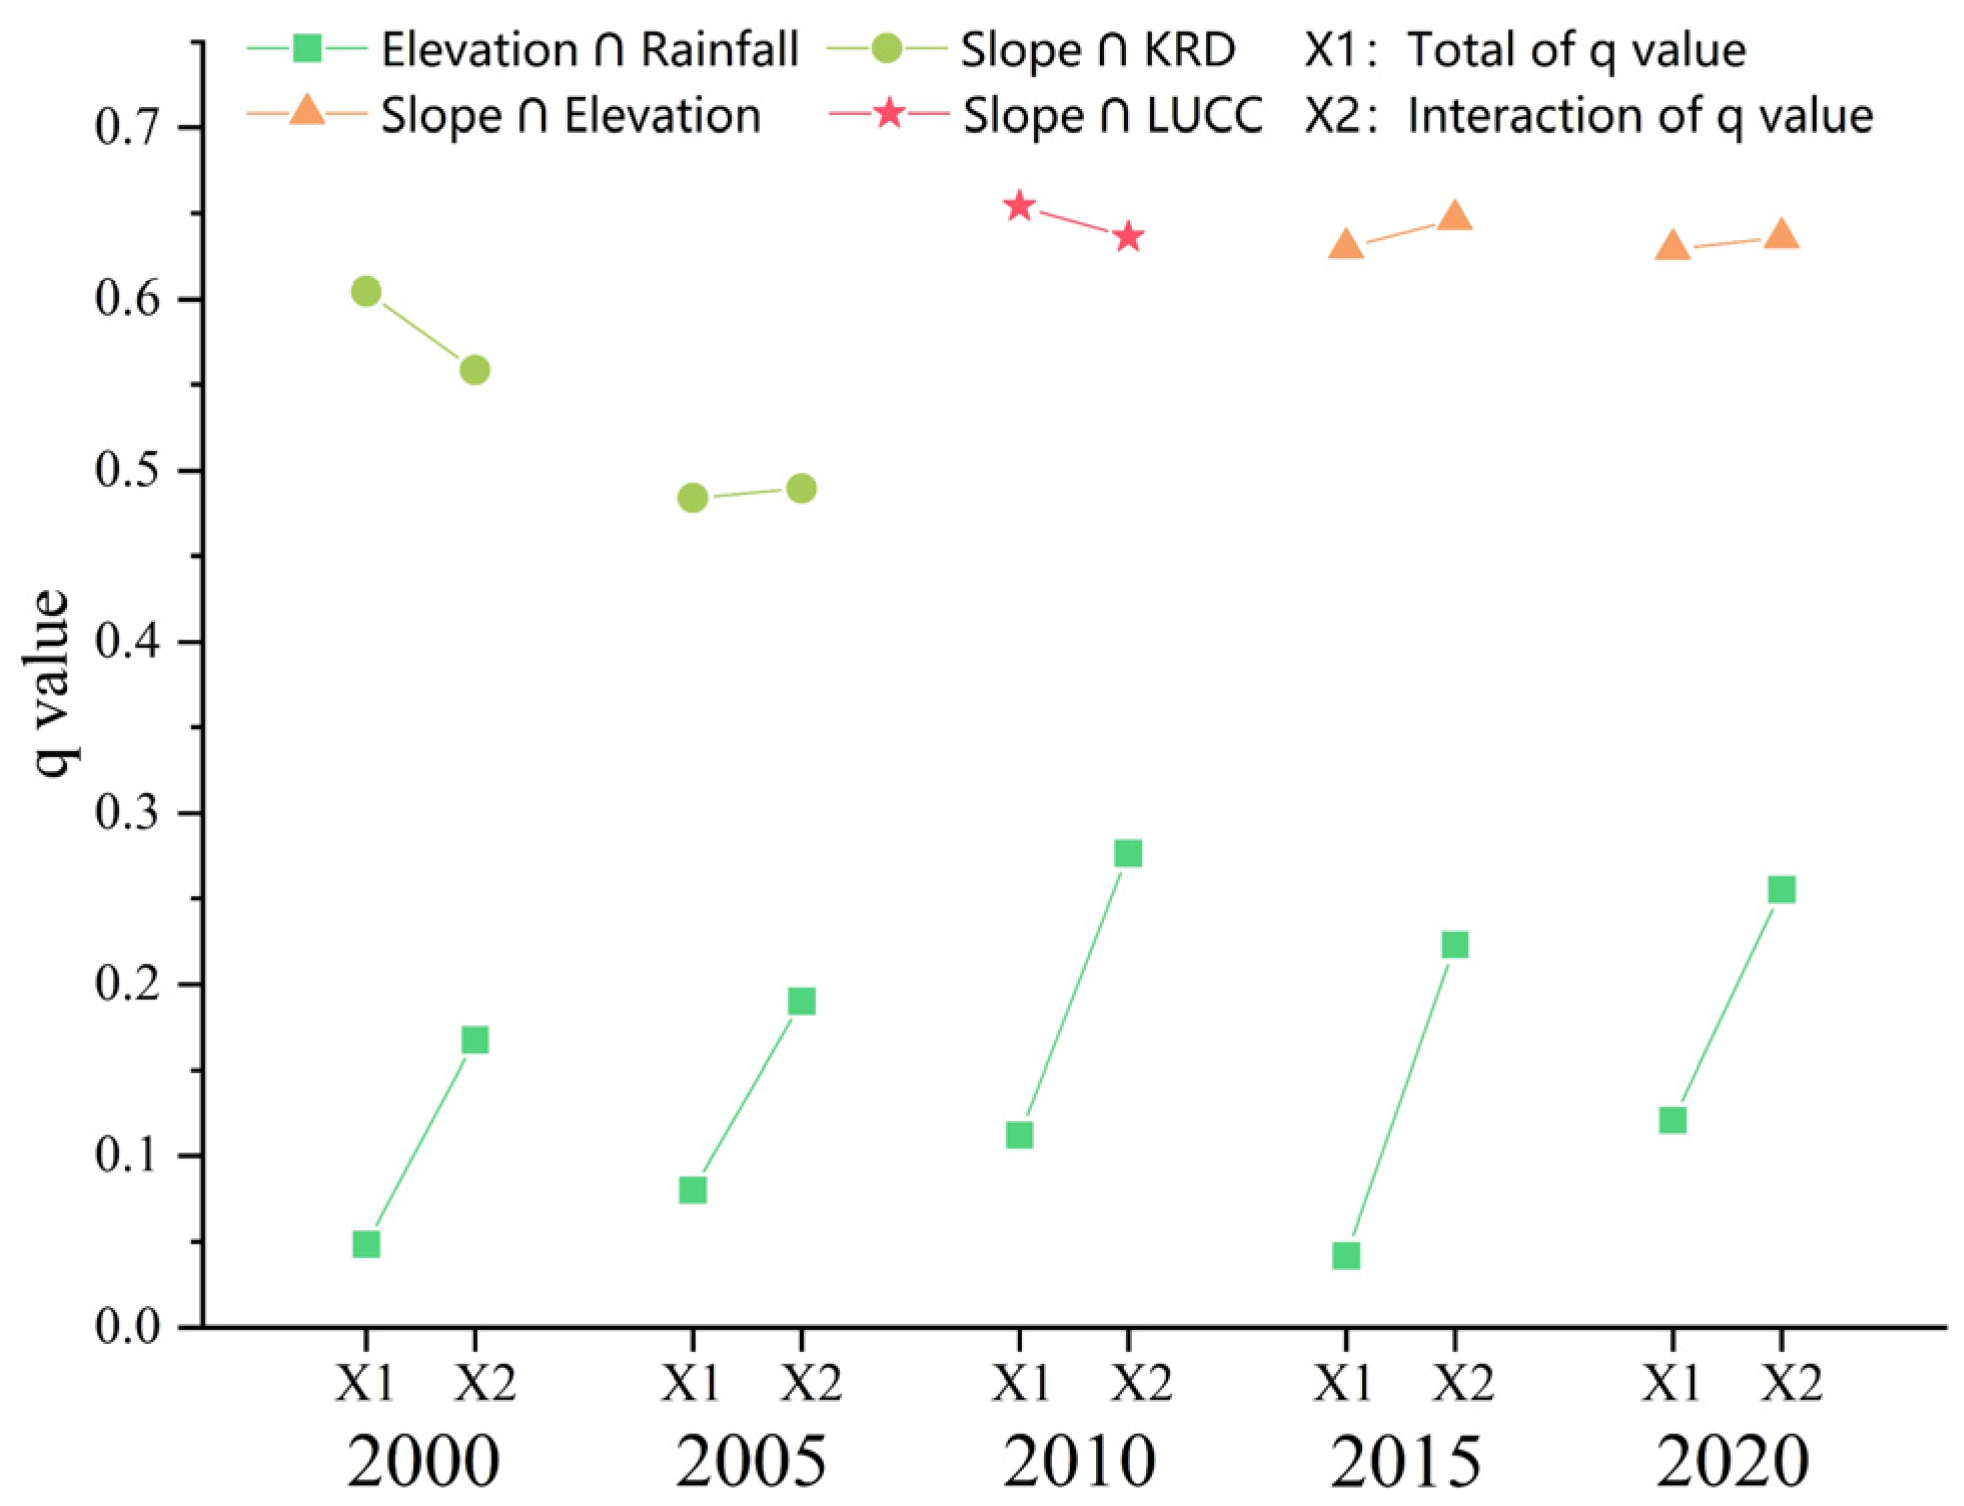
3.3.3. Factor Interaction Analysis

The interaction results showed a decreasing trend in the q values of the interaction of KRD with the other four factors, except the slope factor. Their contribution to the spatial divergence of soil erosion gradually decreased. The interaction of rainfall with slope, elevation, and LUCC, which had a very low q value, increased the q value significantly and had a weaker and stronger effect on the spatial variation of soil erosion. The interactions of both LUCC-slope and vegetation-slope also gradually increased. In 2000 and 2005, the interactions of KRD-slope, elevation-slope, and rainfall-slope were the main influencing factors on the spatial variation of soil erosion. However, from 2010 to 2020, the interaction of slope-KRD was not significant and was replaced by slope-LUCC. The factor combinations with the highest q values in each period and the most significant increase in q values compared to the sum of the q values of the single factors were selected and are shown in Figure 9. X1 was the sum of the q values of the two factors and X2 was the q value after the factor interaction. The dominant factor influencing soil erosion varied between years. The years 2000 and 2005 were KRD-slope, explaining 60% and 49% of the spatial distribution of soil erosion, respectively. The year 2010 was for LUCC-slope, with a q value of 0.64. Meanwhile, the years 2015 and 2020 were for elevation-slope, and the q values after the interaction were higher than the sum of the single factors. In comparison with the sum of the q values of the individual factors, the q value of the interaction between elevation and rainfall increased most significantly throughout the whole period.

4. Discussion

Soil erosion processes and driving mechanisms in karst areas are not yet understood due to the special karst structure and complex erosion patterns. Most of the existing modeling studies do not take into account the grade of rocky desertification, leading to large errors in results. In addition, the current soil erosion results based on administrative divisions and raster networks can hardly meet the requirements of refined soil erosion control. In this study, soil erosion in karst areas was estimated using an optimized RUSLE model with the karst rocky desertification factor. On this basis, the spatial and temporal dynamics of soil erosion in the study area in the last two decades were studied on the basis of slope units, while the soil erosion driving factors were quantitatively identified with the geographic detector.

4.1. Spatial and Temporal Dynamics of Karst Soil Erosion

Understanding the dynamic evolution of soil erosion is not only the basis and prerequisite for the prevention and control of soil erosion but also has great significance in the conservation of soil resources and ecological restoration. In this study, the erosion area of the study area was mainly no erosion or light erosion, while medium erosion and strong erosion were less. It differs from Guizhou as a whole, which is predominantly light to medium. This difference may be influenced by the level of rocky desertification development at different study scales. The limited erodible soil sources in the medium-intensity rocky desertification area constrain the development of soil erosion. There is a need for small-scale studies in karst areas with highly heterogeneous geography, and the results of these studies are important in tailoring soil and water conservation efforts to local conditions. The no erosion area decreased during the study period, with the highest proportion of light to medium erosion. The reduction of no erosion area was the ecological restoration effect of the national implementation of the comprehensive rocky desertification management project [49]. The highest percentage of light to medium erosion shows that controlling light to medium erosion is the key to effectively managing soil erosion in the region. The high proportion of light erosion is mainly due to the large proportion of light erosion areas, and it is recommended to reduce unreasonable human actions to allow the natural ecosystem to repair itself. The small area of moderate erosion or high erosion required soil and water conservation measures to maintain the stability of the soil in the area.
Soil erosion fluctuated and increased in the last two decades, unlike the findings of some karst areas where soil erosion had been decreasing. This difference might reflect the unreasonable human activities in the early part of the research area and the good management effect of the later management project. Soil erosion tended to increase, but the natural ecosystem developed benignly. The area was ecologically fragile and had low agricultural productivity. In the early years, people plundered land resources, causing massive soil loss, and eventually there was not even soil left to erode. In the later period, with the rocky desertification control project, soil resources gradually recovered. The highest soil erosion in 2005 was related to the high number of heavy rainfall events in that year. Extreme precipitation is often considered to be an important factor influencing erosion processes. Soil erosion under extreme precipitation conditions may account for the majority of annual soil erosion [50]. This is also confirmed on the basis of the proportion of sediment produced during the 3 and 10 largest erosion events [51].
The conversion in soil erosion classes over the whole period occurred mainly between no erosion, slight erosion, and light erosion. The conversion from no erosion to slight erosion and light erosion was related to the decrease in the area of rock desertification and the increase in eroded soil sources as described above. The reciprocal transfer between slight and light erosion may have been influenced by long-term rocky desertification management projects. The high slope unit is a susceptible area for soil erosion, and the local government should coordinate with multiple departments to implement the following to restore agricultural land to forest, alleviate the ecological carrying capacity, and reduce soil erosion. The erosion cold spot areas occurred in the low slope-low elevation unit, mainly because the soil resources were lost due to unreasonable human activities in the early years, and it was difficult to restore the soil resources in the short term. The progression of the erosion cold spot confidence level from 95% to 90% is evidence of the effectiveness of ecological restoration over time. In the case of meeting human needs, it is appropriate to convert the low-slope units into terraces; strengthen agroforestry cultivation [52], which can increase the harvested area of arable land [53]; and meet living needs while enhancing water and soil conservation measures.

4.2. Soil Erosion Impact Driver Analysis

Determining the driving factors of soil erosion helps to elucidate the driving mechanisms behind changes in soil erosion and is a key link for researchers to formulate soil protection policies scientifically and rationally. In the new form of synergistic economic and ecological development, the driving mechanism of soil erosion in karst areas has also changed.
The risk detector indicates that there is no trend correlation between rainfall intervals and soil erosion. Rainfall heterogeneity is not significant at small scales, and spatial heterogeneity of soil erosion is mainly influenced by other factors. Soil erosion in karst tends to increase with increasing vegetation cover but does not exceed a maximum of 15 t·ha−1-a−1. Erodible soil sources are extremely limited in exposed karst areas and increase with increasing vegetation cover. With 80% vegetation cover, the erosive power of rainfall and runoff on the soil is significantly reduced. The risk of soil erosion becomes less after an altitude of more than 1170 m a.s.l. and is related to the extent of human activity. Middle- and low-altitude areas are rich in water and heat resources and have a significant impact on soil erosion due to the concentration of human activities [54]. Higher altitudes have limited hydrothermal conditions and constrained human activities, which do not have a significant impact on soil erosion. Other studies have found that soil erosion in cropland > grassland > woodland. However, in this research area, it is grassland > woodland > cropland [54]. The plant roots formed a root–soil compound with the surrounding soil, which reduced soil erosion [55]. The low risk of soil erosion on arable land is due to the significant loss of soil resources caused by early over-farming. Despite recent efforts to combat soil erosion, soil resources in karst areas are difficult to recover in the short term [56]. The risk of soil erosion on arable land may appear to be low. However, once soil erosion has occurred on arable land, it would become a serious threat to the security of agricultural production. The gradual restoration of arable soil resources and the reduction of soil erosion from arable land should be the long-term goal of soil and water conservation work. The intensity of rocky desertification is negatively correlated with the risk of soil erosion. Similarly, a low risk of soil erosion does not mean a low hazard. On the contrary, the risk of erosion is much higher than that of light rocky desertification. Long-term natural restoration measures such as returning farmland to forests and grasses also aim to control soil erosion in areas of mild rocky desertification and to restore soil resources in areas of intense rocky desertification. Soil erosion risk is positively correlated with slope, and the higher the slope, the greater the increase in soil erosion risk. It is recommended to increase the vegetation cover on steep slopes to improve the stability of the soil.
The factor detector shows that slope explains 60% of the spatial variation in soil erosion. Effective measures to control soil erosion for different slopes can solve most of the soil problems. Some studies have found that sediment is mainly from sloping land [57], suggesting that sloping land above 25° should be converted to woodland. We recommend that conversion of land use be accompanied by the establishment of soil erosion protection zones because soils in disturbed soils are highly susceptible to erosion and soils in karst areas are difficult to recover effectively in the short term. The q value between LUCC and KRD gradually decreases but still plays a major role in the spatial differentiation of soil erosion. It can be seen that the impact of KRD and LUCC on soil erosion is far-reaching and long-lasting. Both karst rock desertification and soil erosion are closely related to human activities. Effectively improving people’s production and living standards is also an important means of combating soil erosion. The role of vegetation cover in soil erosion shows a decreasing and then increasing trend, indicating that the rocky desertification control project in the last 20 years has achieved remarkable results. With continued ecological management, we infer that the role of vegetation cover will outweigh that of rocky desertification and land use in the coming decades. The insignificant effect of rainfall and elevation alone on regional soil erosion is related to the small scale of the study.
The results of the interaction of the factors show that the q value increases significantly after the interaction such as slope-rainfall and LUCC-rainfall. Rainfall is a direct driver of soil erosion occurrence and an important influencing factor for soil erosion [58]. The weak influence of rainfall alone in this study is mainly restricted by the scale of the study. The interaction of slope and rainfall increases the flow rate of the slope surface created by rainfall, intensifying scour and increasing erosion. Land use destroys the natural soil structure and weakens the soil’s resistance to erosion. Land use also disturbs stable slope flow, which in combination with rainfall increases soil erosion. During the study period, the dominant factor in soil erosion changed from KRD-slope to LUCC-slope, and finally to elevation-slope. From 2000 to 2005, karst rocky desertification was very serious and was second only to slope in its impact on soil erosion, so the interaction of KRD and slope was the dominant factor in soil erosion. As the area of rocky desertification decreased, the influence of KRD diminished. Therefore, the dominant factor became LUCC-slope. In the course of long-term natural ecological restoration, the land use structure is optimized and the dominant factor changes again to elevation-slope. In comparison with the sum of the q values of the individual factors, the q values of the interaction between elevation-rainfall increased most significantly throughout the study period. The study area is a typical plateau valley landscape with a relative elevation difference of 923 m. Differences in altitude provide a potential energetic base for rainfall runoff and therefore increase the ability to erode the soil [59].

4.3. Challenges and Perspectives

The RUSLE model, based on the elements of topography, soil, and vegetation, can simulate regional soil erosion effectively. However, the model should be modified according to the actual environment. Considering the unique rocky desertification phenomenon in the karst area, the RUSLE model with the introduction of rocky desertification factors was chosen for an attempt. However, there are still shortcomings and further research needs to be strengthened. Factors such as data accuracy, the algorithm of each factor within the model, and the karst environment all add to the uncertainty of the model simulation and subsequent analysis. In this paper, the results of RUSLE calculations for the rocky desertification factors introduced due to data limitations could not be compared with the results of field surveys. To reduce the uncertainty of RUSLE models in karst areas, the following aspects should receive attention in future studies. Firstly, the study of soil erosion should be analyzed dynamically with local economies, national strategies [60], and climate change [61]. Secondly, there are biases in the results of each factor of the RUSLE model due to different algorithms, and different sets of equations have been developed by scholars in different regions [62]. Analysis of equation factor algorithms should be strengthened in future research to select the most appropriate algorithm for the study area. Finally, there are both surface loss and subsurface leakage in karst areas, and future research could focus on subsurface leakage.

5. Conclusions

This paper used a modified RUSLE model to estimate soil erosion in the karst plateau-gorge area over the past 20 years. The spatial and temporal evolution of soil erosion was quantified on the basis of slope units, and the influence of single and interactive factors on soil erosion was investigated using the geographical detector.
Soil erosion determined on the basis of slope units can more accurately reflect soil erosion in the actual environment and provide better decision support for regional erosion control and management. In 2000–2020, regional soil erosion showed an increasing trend. The results of this study further confirm the significant effect of the regional perennial rocky desertification control project. Soil erosion is serious in the high slope–low elevation and high slope–high elevation units, and relevant authorities should pay more attention to these areas to improve soil erosion control.
The contribution of the six factors to soil erosion fluctuates, but in the last 20 years, the pattern was slope > LUCC > KRD > FVC > rainfall > elevation. Slope played a dominant role in soil erosion differentiation on the karst plateau, while rock desertification and land use, which are closely related to human activities, also had a stronger influence on soil erosion. The influence of multiple factors on soil erosion is significantly stronger than that of single factors, and the dominant interaction factor varies with changes in rock desertification and land use. The dominant combination of soil erosion changed from KRD-slope (2000,2005) to LUCC-slope (2010) and finally to elevation-slope (2015, 2020). On the basis of this study, we recommend adjusting unreasonable human activities, insisting on natural restoration measures such as returning farmland to forest, and at the same time establishing soil consolidation projects for areas where the soil is gradually recovering.

Author Contributions

Conceptualization, C.S. and K.X.; methodology, T.S.; software, C.S.; formal analysis, C.S.; resources, T.S.; data curation, C.S. and T.S.; writing—original draft preparation, C.S.; writing—review and editing, C.S., K.X., and T.S.; visualization, C.S.; supervision, K.X.; project administration, K.X.; funding acquisition, K.X. All authors have read and agreed to the published version of the manuscript.

Funding

This research was supported by the Key Science and Technology Program of Guizhou Provence: Poverty Alleviation Model and Technology demonstration for Ecoindustries Derivated from the karst desertification control (no. 5411 2017 QianKehe Pingtai Rencai), the World Top Discipline Program of Guizhou Provence: “Karst Eco-environment Science (no. 125 2019 Qianjiao Keyan Fa), and the China Overseas Expertise Introduction Program for Discipline Innovation: Overseas Expertise Introduction Center for South China Karst Eco-environment Discipline Innovation (D17016).

Institutional Review Board Statement

Not applicable.

Informed Consent Statement

Not applicable.

Data Availability Statement

Not applicable.

Conflicts of Interest

The authors declare no conflict of interest.

References

  1. Chen, M.Y.; Ma, L.; Shao, M.G.; Wei, X.R.; Jia, Y.H.; Sun, S.C.; Zhang, Q.Y.; Li, T.C.; Yang, X.; Gan, M. Chinese zokor (Myospalax fontanierii) excavating activities lessen runoff but facilitate soil erosion—A simulation experiment. Catena 2021, 202, 105248. [Google Scholar] [CrossRef]
  2. Teng, M.J.; Huang, C.B.; Wang, P.C.; Zeng, L.X.; Zhou, Z.X.; Xiao, W.F.; Huang, Z.L.; Liu, C.F. Impacts of forest restoration on soil erosion in the Three Gorges Reservoir area, China. Sci. Total Environ. 2019, 697, 134164. [Google Scholar] [CrossRef] [PubMed]
  3. Lin, J.K.; Guan, Q.Y.; Tian, J.; Wang, Q.Z.; Li, Z.J.; Wang, N. Assessing temporal trends of soil erosion and sediment redistribution in the Hexi Corridor region using the integrated RUSLE-TLSD model. Catena 2020, 195, 104756. [Google Scholar] [CrossRef]
  4. Munodawafa, A. Assessing nutrient losses with soil erosion under different tillage systems and their implications on water quality. Phys. Chem. Earth Parts A/B/C 2007, 32, 1135–1140. [Google Scholar] [CrossRef]
  5. Luo, X.L.; Bai, X.Y.; Tan, Q.; Ran, C.; Chen, H.; Xi, H.P.; Chen, F.; Wu, L.H.; Li, C.J.; Zhang, S.R.; et al. Particulate organic carbon exports from the terrestrial biosphere controlled by erosion. Catena 2022, 209, 105815. [Google Scholar] [CrossRef]
  6. Li, Y.F.; Wang, Z.G.; Zhao, J.L.; Lin, Y.M.; Chen, A. Characterizing soil losses in China using data of 137Cs inventories and erosion plots. Catena 2021, 203, 105296. [Google Scholar] [CrossRef]
  7. Zhang, S.R.; Bai, X.Y.; Zhao, C.W.; Tan, Q.; Luo, G.J.; Cao, Y.; Deng, Y.H.; Li, Q.; Li, C.J.; Wu, L.H.; et al. Limitations of soil moisture and formation rate on vegetation growth in karst areas. Sci. Total Environ. 2022, 810, 151209. [Google Scholar] [CrossRef]
  8. Sirjani, E.; Sameni, A.; Moosavi, A.A.; Mahmoodabadi, M.; Laurent, B. Portable wind tunnel experiments to study soil erosion by wind and its link to soil properties in the Fars province, Iran. Geoderma 2018, 333, 69–80. [Google Scholar] [CrossRef]
  9. Rahman, M.R.; Shi, Z.H.; Cai, C.F. Soil erosion hazard evaluation—An integrated use of remote sensing, GIS and statistical approaches with biophysical parameters towards management strategies. Ecol. Modell. 2009, 220, 1724–1734. [Google Scholar] [CrossRef]
  10. Selmy, S.A.H.; Al-Aziz, S.H.A.; Jiménez-Ballesta, R.; Garcí a-Navarro, F.J.; Fadl, M.E. Modeling and Assessing Potential Soil Erosion Hazards Using USLE and Wind erosion in Integration with GIS Technique: Dakhla Oasis, Egypt. Agriculture 2021, 11, 1124. [Google Scholar] [CrossRef]
  11. Karalis, S.; Karymbalis, E.; Mamassis, N. Effects of lithology and geomorphology on sediment yield in karst mountainous catchments. Geomorphology 2019, 343, 119–128. [Google Scholar]
  12. Cao, Z.H.; Zhang, K.L.; He, J.H.; Yang, Z.C.; Zhou, Z.L. Linking rocky desertification to soil erosion by investigating changes in soil magnetic susceptibility profiles on karst slopes. Geoderma 2021, 389, 114949. [Google Scholar] [CrossRef]
  13. Wang, M.; Wang, H.S.; Jiang, C.; Sun, J.X. Spatial Soil Erosion Patterns and Quantitative Attribution Analysis in Southwestern China Based on RUSLE and Geo-Detector Model. J. Basic Sci. Eng. 2021, 29, 1386. [Google Scholar]
  14. Zhang, X.Q.; Hu, M.C.; Guo, X.Y.; Yang, H.; Zhang, Z.K.; Zhang, K.L. Effects of topographic factors on runoff and soil loss in Southwest China. Catena 2018, 160, 394–402. [Google Scholar] [CrossRef]
  15. Feng, T.; Chen, H.S.; Polyakov, V.O.; Wang, K.L.; Zhang, X.B.; Zhang, W. Soil erosion rates in two karst peak-cluster depression basins of northwest Guangxi, China: Comparison of the rusle model with 137cs measurements. Geomorphology 2016, 253, 217–224. [Google Scholar] [CrossRef]
  16. Li, Y.C.; Liu, C.X.; Zhao, C.Y.; Wang, C.J.; Zhang, H.; Ming, J.; Wang, Y. Assessment and spatial differentiation of sensitivity of soil erosion in Three Gorges Reservoir area of Chongqing. Acta Ecol. Sin. 2009, 29, 788–796. [Google Scholar]
  17. Zhu, Z.; Wang, J.X.; Hu, M.G.; Jia, L. Geographical detection of groundwater pollution vulnerability and hazard in karst areas of Guangxi Province, China. Environ. Pollut. 2018, 245, 627–633. [Google Scholar] [CrossRef]
  18. Morgan, R.P.C.; Nearing, M.A. Handbook of Erosion Modelling; Blackwell Publishing Ltd.: Hoboken, NJ, USA, 2011. [Google Scholar]
  19. Nearing, M.A. Soil erosion and conservation. In Environmental Modelling: Finding Simplicity in Complexity, 2nd ed.; Wiley: Hoboken, NJ, USA, 2013; pp. 365–378. [Google Scholar]
  20. Tian, Y.C.; Wang, S.J.; Bai, X.Y.; Luo, G.J.; Yan, X. Trade-offs among ecosystem services in a typical Karst watershed, SW China. Sci. Total Environ. 2016, 566, 1297–1308. [Google Scholar] [CrossRef]
  21. Long, M.Z.; Wu, K.H.; Xiong, K.N. Assessment of the applicability of the WEPP model(Hill slope Version) for soil erosion in karst rock desertification area, Guizhou Province. Carsol. Sin. 2014, 33, 201–207. [Google Scholar]
  22. Qin, W.; Guo, Q.K.; Cao, W.H.; Zhe, Y.; Yan, Q.H.; Shan, Z.J.; Zheng, F.L. A new RUSLE slope length factor and its application to soil erosion assessment in a Loess Plateau watershed. Soil Tillage Res. 2018, 182, 10–24. [Google Scholar] [CrossRef]
  23. Gao, J.B.; Wang, H. Temporal analysis on quantitative attribution of karst soil erosion: A case study of a peak-cluster depression basin in Southwest China. Catena 2019, 172, 369–377. [Google Scholar] [CrossRef]
  24. Febles-Gonzalez, J.M.; Vega-Carreno, M.B.; Tolon-Becerra, A.; Lastra-Bravo, X. Assessment of soil erosion in karst regions of Havana, Cuba. Land Degrad. Dev. 2012, 23, 465–474. [Google Scholar] [CrossRef]
  25. Xu, Y.Q.; Shao, X.M.; Kong, X.B.; Peng, J.; Cai, Y.L. Adapting the RUSLE and GIS to model soil erosion risk in a mountains karst watershed, Guizhou Province, China. Environ. Monit. Assess. 2008, 141, 275–286. [Google Scholar] [CrossRef]
  26. Dai, Q.H.; Peng, X.D.; Yang, Z.; Zhao, L.S. Runoff and erosion processes on bareslopes in the karst rocky desertification area. Catena 2017, 152, 218–226. [Google Scholar] [CrossRef]
  27. Carrara, A.; Cardinali, M.; Detti, R.; Guzetti, F.; Pasqui, V.; Reichenbach, P. GIS techniques and statistical models in evaluating landslide hazard. Earth Surf. Process. Landforms 1991, 16, 427–445. [Google Scholar] [CrossRef]
  28. Jia, N.; Mitani, Y.; Xie, M.W.; Tong, J.X.; Yang, Z.H. GIS deterministic model-based 3d large-scale artificial slope stability analysis along a highway using a new slope unit division method. Nat. Hazards 2015, 76, 873–890. [Google Scholar] [CrossRef]
  29. Wang, K.; Xu, H.; Zhang, S.J.; Weri, F.Q.; Xie, W.L. Identification and Extraction of Geomorphological Features of Landslides Using Slope Units for Landslide Analysis. ISPRS Int. J. Geo-Inf. 2020, 9, 274. [Google Scholar] [CrossRef] [Green Version]
  30. Ba, Q.Q.; Chen, Y.M.; Deng, S.S.; Yang, J.X.; Li, H.F. A comparison of slope units and grid cells as mapping units for landslide susceptibility assessment. Earth Sci. Inform. 2018, 11, 373–388. [Google Scholar] [CrossRef]
  31. Tanyas, H.; Rossi, M.; Alvioli, M.; van Westen, C.J.; Marchesini, I. A global slope unit-based method for the near real-time prediction of earthquake-induced landslides. Geomorphology 2019, 327, 126–146. [Google Scholar] [CrossRef]
  32. Jacobs, L.; Kervyn, M.; Reichenbach, P.; Rossi, M.; Marchesini, I.; Alvioli, M.; Dewitte, O. Regional susceptibility assessments with heterogeneous landslide information: Slope unit vs. pixel-based approach. Geomorphology 2020, 356, 107084. [Google Scholar] [CrossRef]
  33. Li, Y.; Liu, Z.Q.; Liu, G.H.; Xiong, K.N.; Cai, L.L. Dynamic variations in soil moisture in an epikarst fissure in the karst rocky desertification area. J. Hydrol. 2020, 591, 125587. [Google Scholar] [CrossRef]
  34. Legrain, X.; Berding, F.; Dondeyne, S.; Schad, P.; Chapelle, J. World Reference Base for Soil Resources 2014: International Soil Classification System for Naming Soils and Creating Legends for Soil Maps; FAO: Rome, Italy, 2014. [Google Scholar]
  35. Hu, F.; An, Y.L.; Xu, J. Preliminary discussion on concept and landscape features of “Semi-Karst”: A case study of Guizhou Province. Geogr. Res. 2015, 34, 1569–1580. [Google Scholar]
  36. Williams, J.R.; Jones, C.A.; Kiniry, J.R.; Spanel, D.A. The EPIC Crop Growth Model. Trans. ASAE 1989, 32, 0497–0511. [Google Scholar] [CrossRef]
  37. Arnoldus, H.M.J. An Approximation of the Rainfall Factor in the Universal Soil Loss Equation; John Wiley and Sons Ltd.: Hoboken, NJ, USA, 1980; pp. 127–132. [Google Scholar]
  38. Renard, K.G.; Foster, G.R.; Weesies, G.A.; McCool, D.; Yoder, D. Predicting soil erosion by water: A guide to conservation planning with the revised universal soil loss equation (RUSLE). In Agriculture Handbook; United States Government Printing: Washington, DC, USA, 1997; pp. 110–135. [Google Scholar]
  39. Liu, B.Y.; Nearing, M.A.; Shi, P.J.; Jia, Z.W. Slope Length Effects on Soil Loss for Steep Slopes. Soil Sci. Soc. Am. J. 2000, 64, 1759–1763. [Google Scholar] [CrossRef] [Green Version]
  40. Liu, B.T.; Song, C.F.; Shi, Z.; Tao, H.P. Correction Algorithm of Slope Factor in Universal Soil Loss Equation in Earth-Rocky Mountain Area of Southwest China. Soil Water Consevation China 2015, 8, 49–51. [Google Scholar]
  41. Jong, S.M.D. Derivation of vegetative variables from a landsat tm image for modelling soil erosion. Earth Surf. Proc. Land 1994, 19, 165–178. [Google Scholar] [CrossRef]
  42. Patil, R.J.; Sharma, S.K. Remote Sensing and GIS based modeling of crop/cover management factor (C) of USLE in Shakker river watershed. In Proceedings of the International Conference on Chemical, Agricultural and Medical Sciences (CAMS-2013), Kuala Lumpur, Malaysia, 29–30 December 2013; pp. 29–30. [Google Scholar]
  43. Durigon, V.L.; de Carvalho, D.F.; Antunes, M.A.H.; Oliveira, P.T.; Fernandes, M.M. NDVI time series for monitoring RUSLE cover management factor in a tropical watershed. Int. J. Remote Sens. 2014, 35, 441–453. [Google Scholar] [CrossRef]
  44. Li, Y.; Bai, X.Y.; Zhou, Y.C.; Qin, L.Y.; Tian, X.; Tian, Y.C.; Li, P.L. Spatial–temporal evolution of soil erosion in a Typical mountainous karst basin in SW China, based on GIS and RUSLE. Arab. J. Sci. Eng. 2016, 41, 209–221. [Google Scholar] [CrossRef]
  45. Zeng, C.; Wang, S.J.; Bai, X.Y.; Li, Y.B.; Tian, Y.C.; Yue, L.; Wu, L.H.; Luo, G.J. Soil erosion evolution and spatial correlation analysis in a typical karst geomorphology using RUSLE with GIS. Solid Earth 2017, 8, 721–736. [Google Scholar] [CrossRef] [Green Version]
  46. Wang, J.F.; Li, X.H.; Christakos, G.; Liao, Y.L.; Zhang, T.; Gu, X.; Zheng, X.Y. Geographical detectors-based health risk assessment and its application in the neural tube defects study of the Heshun region, China. Int. J. Geogr. Inf. Sci. 2010, 24, 107–127. [Google Scholar] [CrossRef]
  47. Wang, J.F.; Xu, C.D. Geodetector: Principle and prospective. Acta Geogr. Sin. 2017, 72, 116–134. [Google Scholar]
  48. Yan, Y.J.; Dai, Q.H.; Yuan, Y.F.; Peng, X.D.; Zhao, L.S.; Yang, J. Effects of rainfall intensity on runoff and sediment yields on bare slopes in a karst area, SW China. Geoderma 2018, 330, 30–40. [Google Scholar] [CrossRef]
  49. Xiong, K.N.; Zhu, D.Y.; Peng, T.; Yu, L.F.; Xue, J.H.; Li, P. Study on Ecological industry technology and demonstration for Karst rocky desertification control of the Karst Plateau-Gorge. Acta Ecol. Sin. 2016, 36, 7109–7113. [Google Scholar]
  50. Estrany, J.; Garcia, C.; Batalla, R.J. Hydrological response of a small mediterranean agricultural catchment. J. Hydrol. 2010, 380, 180–190. [Google Scholar] [CrossRef]
  51. Gonzalez-Hidalgo, J.; Batalla, R.; Cerdà, A.; De Luis, M. Contribution of the largest events to suspended sediment transport across the USA. Land Degrad. Dev. 2010, 21, 83–91. [Google Scholar] [CrossRef]
  52. Karamage, F.; Zhang, C.; Kayiranga, A.; Shao, H.; Fang, X.; Ndayisaba, F.; Nahayo, L.; Mupenzi, C.; Tian, G. USLE-based assessment of soilerosion by water in the Nyabarongo River catchment, Rwanda. Int. J. Environ. Res. Public Health 2016, 13, 835. [Google Scholar] [CrossRef] [Green Version]
  53. Song, F.J.; Wang, S.J.; Bai, X.Y.; Wu, L.H.; Wang, J.F.; Li, C.J.; Chen, H.; Luo, X.L.; Xi, H.P.; Zhang, S.R.; et al. A new indicator for global food security assessment: Harvested area rather than cropland area. Chin. Geogr. Sci. 2022, 32, 204–217. [Google Scholar] [CrossRef]
  54. Gao, J.B.; Wang, H.; Zuo, L. Spatial gradient and quantitative attribution of karst soil erosion in Southwest China. Environ. Monit. Assess. 2018, 190, 730. [Google Scholar] [CrossRef]
  55. Fu, J.T.; Li, G.Y.; Hu, X.T.; Li, Q.Z.; Yu, D.M.; Zhu, H.L.; Hu, X.G. Research status and development tendency of vegetation effects to soil reinforcement and slope stabilization. J. Eng. Geol. 2014, 22, 1135–1146. [Google Scholar]
  56. Xiong, K.N.; Li, J.; Long, M.Z. Features of soil and water loss and key issues in demonstration areas for combating karst rocky desertification. Acta Geogr. Sin. 2012, 67, 878–888. [Google Scholar]
  57. Gan, Y.X.; Dai, Q.H.; Fu, W.B.; Yan, Y.J.; Peng, X.D. Characteristics of soil erosion on Karst slopes under the artificial rainfall experiment conditions. Chin. J. Appl. Ecol. 2016, 27, 2754–2760. [Google Scholar]
  58. Xiong, K.N.; Chi, Y.K. The problems in southern China karst ecosystem in southern of China and its countermeasures. Ecol. Econ. 2015, 31, 23–30. [Google Scholar]
  59. Jiang, Y.; Gao, J.; Yang, L.; Wu, S.; Dai, E. The interactive effects of elevation, precipitation and lithology on karst rainfall and runoff erosivity. CATENA 2021, 207, 105588. [Google Scholar] [CrossRef]
  60. Zhang, S.R.; Bai, X.Y.; Zhao, C.W.; Tan, Q.; Luo, G.J.; Wu, L.H.; Xi, H.P.; Li, C.J.; Chen, F.; Ran, C.; et al. China’ s carbon budget inventory from 1997 to 2017 and its challenges to achieving carbon neutral strategies. J. Clean. Prod. 2022, 347, 130966. [Google Scholar] [CrossRef]
  61. Zhang, S.R.; Bai, X.Y.; Zhao, C.W.; Tan, Q.; Luo, G.J.; Wang, J.F.; Li, Q.; Wu, L.H.; Chen, F.; Li, C.J.; et al. Global CO2 consumption by silicate rock chemical weathering: Its past and future. Earth’s Futur. 2021, 9, e2020EF001938. [Google Scholar] [CrossRef]
  62. Ghosal, K.; Bhattacharya, S.D. A review of RUSLE model. J. Indian Soc. Remote Sens. 2020, 48, 689–707. [Google Scholar] [CrossRef]
Figure 1. Location and elevation of the study area.
Land 11 01134 g001
Figure 2. Flow chart of slope unit division.
Land 11 01134 g002
Figure 3. Spatial and temporal characteristics of soil erosion in 2000–2020.
Land 11 01134 g003
Figure 4. Division of slope units.
Land 11 01134 g004
Figure 5. Soil erosion class transfer.
Land 11 01134 g005
Figure 6. Hotspot analysis under different slope units.
Land 11 01134 g006
Figure 7. Factor classification and mean soil erosion values.
Land 11 01134 g007
Figure 8. Single-factor trends.
Land 11 01134 g008
Figure 9. Factor interaction variation. X1 is the sum of the two-factor q values. X2 is the q value of the interaction of the two-factor.
Land 11 01134 g009
Table 1. α values for different karst rocky desertification classes.
Rocky DesertificationNonePotentialLightModerateHighSevere
Bedrock exposure rate (%)20<20–3030–5050–7070–90>90
α102540608090
Table 2. Land use types and p-value.
Land UseArable LandGarden LandWood LandShrub LandGrass LandBare LandConstruction LandWaterBare Rock
p-value0.40.71111000
Table 3. The proportion of soil erosion characteristics.
20002005201020152020
Erosion RatioArea RatioErosion RatioArea RatioErosion RatioArea RatioErosion RatioArea RatioErosion RatioArea Ratio
No erosion0%59.12%0%66.38%0%46.29%0%45.37%0%45.10%
Slight3.39%8.04%0.94%3.58%4.81%13.84%5.06%14.24%3.34%11.29%
Light54.99%25.58%23.79%15.15%48.20%30.18%50.81%31.43%45.61%31.72%
Medium36.64%6.80%37.36%9.77%38.75%8.71%36.72%8.08%40.16%10.38%
Strong3.80%0.40%27.19%4.12%6.85%0.90%6.27%0.80%8.93%1.37%
Very strong0.86%0.05%9.63%0.96%0.80%0.06%0.92%0.06%1.42%0.13%
Severe0.32%0.01%1.09%0.04%0.59%0.02%0.22%0.01%0.54%0.02%
Total soil erosion
(t·a−1)
327,735.00501,600.55410,090.06401,732.04475,961.02
Publisher’s Note: MDPI stays neutral with regard to jurisdictional claims in published maps and institutional affiliations.

