Article

Could Purposefully Engineered Native Grassland Gardens Enhance Urban Insect Biodiversity?

by
Christina A. Breed
1,*,
Agata Morelli
2,
Christian W. W. Pirk
2,
Catherine L. Sole
2,
Marié J. Du Toit
3 and
Sarel S. Cilliers
3
1
Department of Architecture, School of the Built Environment, Faculty of Engineering, Built Environment and Information Technology, Hatfield Campus, University of Pretoria, Pretoria 0028, South Africa
2
Department of Zoology and Entomology, Faculty of Natural and Agricultural Sciences, University of Pretoria, Pretoria 0028, South Africa
3
Unit for Environmental Sciences and Management, School of Biological Sciences: Botany, Faculty of Natural and Agricultural Sciences, Potchefstroom Campus, North-West University, Potchefstroom 2531, South Africa
*
Author to whom correspondence should be addressed.
Land 2022, 11(8), 1171; https://doi.org/10.3390/land11081171
Submission received: 30 April 2022 / Revised: 24 June 2022 / Accepted: 3 July 2022 / Published: 27 July 2022
(This article belongs to the Special Issue Landscape Architecture: Design for Urban Transformation)

Abstract

:
Progress is required in response to how cities can support greater biodiversity. This calls for more research on how landscape designers can actively shape urban ecologies to deliver context-specific empirical bases for green space intervention decisions. Design experiments offer opportunities for implemented projects within real-world settings to serve as learning sites. This paper explores preliminary ecological outcomes from a multidisciplinary team on whether purposefully engineered native grassland gardens provide more habitat functions for insects than mainstream gardens in the City of Tshwane, South Africa. Six different sites were sampled: two recently installed native grassland garden interventions (young native), two contemporary non-native control gardens (young non-native) on the same premises and of the same ages as the interventions, one remnant of a more pristine native grassland reference area (old native), and one long-established, non-native reference garden (old non-native). Plant and insect diversity were sampled over one year. The short-term findings suggest that higher plant beta diversity (species turnover indicating heterogeneity in a site) supports greater insect richness and evenness in richness. Garden size, age, and connectivity were not clear factors mediating urban habitat enhancement. Based on the preliminary results, the researchers recommend high native grassland species composition and diversity, avoiding individual species dominance, but increasing beta diversity and functional types when selecting garden plants for urban insect biodiversity conservation in grassland biomes.

1. Introduction

Urbanization and climate change are resulting in an unprecedented loss of biodiversity [1]. The Convention on Biological Diversity established firm goals on the integration of biodiversity into existing and proposed urban development [2]. Purposefully planned and designed urban green infrastructure (UGI) networks can lessen negative urban impacts and optimize the multifunctionality of limited open spaces [3,4]. Yet, critical and real progress is required with regard to how UGI can support greater urban biodiversity [1,5]. Urban biodiversity is defined as the variety and richness of living organisms (including genetic variation) and habitat diversity that is dependent on scale and process, and is found in and on the edge of human settlements [1,6]. Although studies exist that demonstrate that cities can host viable populations of rare or endangered species [7], geographic and taxonomic biases make generalization difficult [8]. This is exacerbated by a scarcity of ecological information specific to geographic areas of a smaller scale [9]. Insects are often used as a biodiversity indicator [10,11] since they make a large contribution to overall terrestrial diversity. Together with other invertebrates, they play an important role in ecosystem processes, such as seed dispersal, predation, and decomposition [12].
Built environment professionals, such as landscape architects, architects, urban designers and planners should purposefully contribute to the provision of ecosystem services, wellbeing, and awareness about biodiversity [3,13]. However, more specific and locally tested guidelines are needed [14,15] to enhance the conservation potential of green spaces [16]. Urban environments often create intensively managed, homogenous landscapes with distinct intensities and combinations of selective stresses [17] and management preferences [13]. This results in the local extinction of many specialist species, which are replaced by a few generalist species. This process is referred to as biotic homogenization [18]. The restoration of remnant habitats inside urban centers has traditionally held more interest for biodiversity conservation [19]. This paper proposes the construction of small natural vegetation habitats that could hold potential, but have no guarantee to attract all parts of the natural biological community [17].

1.1. Literature Review

While purposefully designed (and engineered) green space interventions might increase urban biodiversity, it remains challenging for landscape architects, horticulturalists and designers to draw any definite conclusions on green space design for conservation purposes across species. Primary production in urban areas through vegetation preservation, restoration, reconstruction, and disturbance is directly linked to human decisions and socioeconomic factors [20], yet these become directed by more unintentional determinants at higher trophic levels [17]. We present here a short review of studies that have indicated vegetation qualities and other factors that influence urban insect biodiversity, deemed relevant to our study.
In non-urban areas with less human influence, studies have argued that different vegetation characteristics are responsible for the insect species observed, e.g., plant species composition [21], vegetation height, density, and cover [22], plant functional groups [23], or plant beta diversity [24]. Habitat patch parameters from traditional conservation biology have shown the importance of size, structure, and connectivity in urban areas [25,26,27]. General insect habitat guidelines for urban vegetation include biotic complexity, temporal and spatial heterogeneity (configuration and composition), and unique habitats across landscape mosaics [5,16]. While habitat patch age is generally positively correlated with insect diversity, sealed surfaces and intense management are negatively correlated with these factors [28]. Yet, even small patches of green space have demonstrated value for certain insects, while rare insect species have shown a preference for native vegetation [5]. Insect taxa are therefore considered a useful way of measuring biodiversity [10], especially at a small spatial scale.
Shwartz et al. [8] found that 75% of urban biodiversity research was conducted on large green spaces (over 2 ha), despite studies that show the potential of small patches [15,29,30]. Further research on small habitat patches could shed light on the design and management requirements of a connecting matrix to support the connectivity and function of habitats [29]. Since urban green space is mostly fragmented, this is typically the kind of green space with which landscape designers work. Small patches thus generally provide fewer resources and fail to support species diversity through time [17]. Fragmentation leads to changes in behavioral and ecological interactions and processes. It also influences the presence and relative abundance of species [17], yet could be overcome by insects with tolerance and high colonization potential [28].
The importance of using native plant species in UGI needs greater clarity [31,32]. The relationship between ecological integrity and native species is mostly presented as positive and is traditionally favored in restoration projects, but the relationship between ecosystem services and native status remains contested [19,32]. Despite the legacy of landscape architects such as McHarg [33] in applying the theories and principles of ecological landscape design to urban areas, the relevance of using native species is often debated in the landscape design industry [34,35]. Authors question the effectiveness of native species in providing an optimum habitat for biodiversity, their ability to thrive in urban areas, and their effectiveness and efficiency in terms of maintenance, risk, and economics [36]. These debates, arguably underpinned by value-laden conceptions of nature [37] that go beyond the scope of this paper, are kindled by diverse ecological research narratives and findings [13].
Recent Global North studies that compared native and non-native plantings in urban environments in terms of insect habitat show that native plants support greater abundance [38] and species richness [39]. Yet, both social and ecological studies agree that non-native plants offer ecological value in urban settings [38,40], for example, extended flowering periods [31]. A new emphasis on native species has resulted from a greater uptake of “wilder” urban spaces. These are argued to be more resilient in the provision of ecosystem services, provide improved habitat, and shape human preference [39,41]. However, all urban green space needs planning and management to balance the trade-offs between ecosystem “services and disservices” (so perceived by people).
Built environment designers can influence the functioning of urban ecological aspects and how people perceive them [13,14]. Design experiments that are informed by ecological knowledge and adapted to local conditions can lead to workable local examples that are monitored and adjusted over time [3,13,14]. Here, we report the first results of the Biodiversity and Ecosystem Services for Tshwane (BEST) project that investigates landscape design guidelines to enhance urban biodiversity.
The objectives of the greater project are to study the role of biodiversity and, specifically, native species in providing ecosystem functions and services, and to consider how city dwellers’ experience of biodiversity and its services influences their perceptions.

1.2. Local Perspective on Urban Biodiversity

South Africa includes three global biodiversity hotspots and is among the 13 most megadiverse countries in the world, yet largely makes use of reactive conservation strategies [42]. Although the study area of this research is not in a biodiversity hotspot, it is situated in one of the two most species-rich primary grasslands in the world (with over 2000 plant taxa), occurring in the most urbanized province in South Africa [43]. The impact of urbanization is expected to increase as the country’s urban population of 66.4% in 2018 reaches the projected 79.8% in 2050 [44]. The majority of urbanization takes place in the form of informal settlements, where people are living in poverty and where basic facilities and services are lacking [45]. Apartheid planning resulted in a scarcity of quality urban green space in marginalized areas, with negative perceptions of often vast, unmaintained, and unsafe green spaces [46,47]. Furthermore, a dominance of Eurocentric plant species, nature forms, and green space activities prevails [47].
As a result, urban green spaces are not always appreciated or perceived as beneficial in South Africa. Crime is often associated with urban trees and vegetation, yet residents derive provisioning services such as firewood and shelter [48], as well as food and medicine, and cultural services such as recreation, aesthetic value, and social cohesion from the same urban trees and vegetation [49]. A unique relationship has contextually developed with urban nature, which has only been partially studied (see refs. [50,51,52]). Efforts are required from designers to use more local plants in food gardens and to reflect local values and world views [47]. This could foster a greater appreciation of and attachment to the native environment and native species.

1.3. Objectives

A growing number of studies have considered urban green space conditions and interventions to improve urban biodiversity conservation (e.g., refs. [16,27,28,53,54]). This paper builds on these former efforts with a stronger landscape design and multi- and interdisciplinary focus. The paper illustrates the first year of findings (January 2019 to July 2020) on whether purposefully designed native grassland plant assemblages in urban green spaces provide habitat functions for biodiversity, as measured through insect activity. The authors concur with Van Schalkwyk et al. [55] that understanding how plant diversity reflects insect diversity is important for conservation that is compositionally and functionally representative. The research specifically aims to answer the following three questions:
i.
What is the plant species richness, plant species composition, and site heterogeneity (measured through beta diversity) of the intervention sites (young and native) in comparison to the control (young and non-native) and reference sites (old and native, and old and non-native)?
ii.
What differences in ground-dwelling insect species assemblages can be observed between these different sites?
iii.
What correlations could be drawn between plant species characteristics and observed insect species diversity?
By answering the above questions, the authors hope to shed light on the question posed in the title of this paper. Although the empirical work is in its infant stages, the often short-term duration and constant transformation of urban gardens, synchronized with rapid urbanization and the advances of climate change, indicate the need to consider interim results.

2. Method

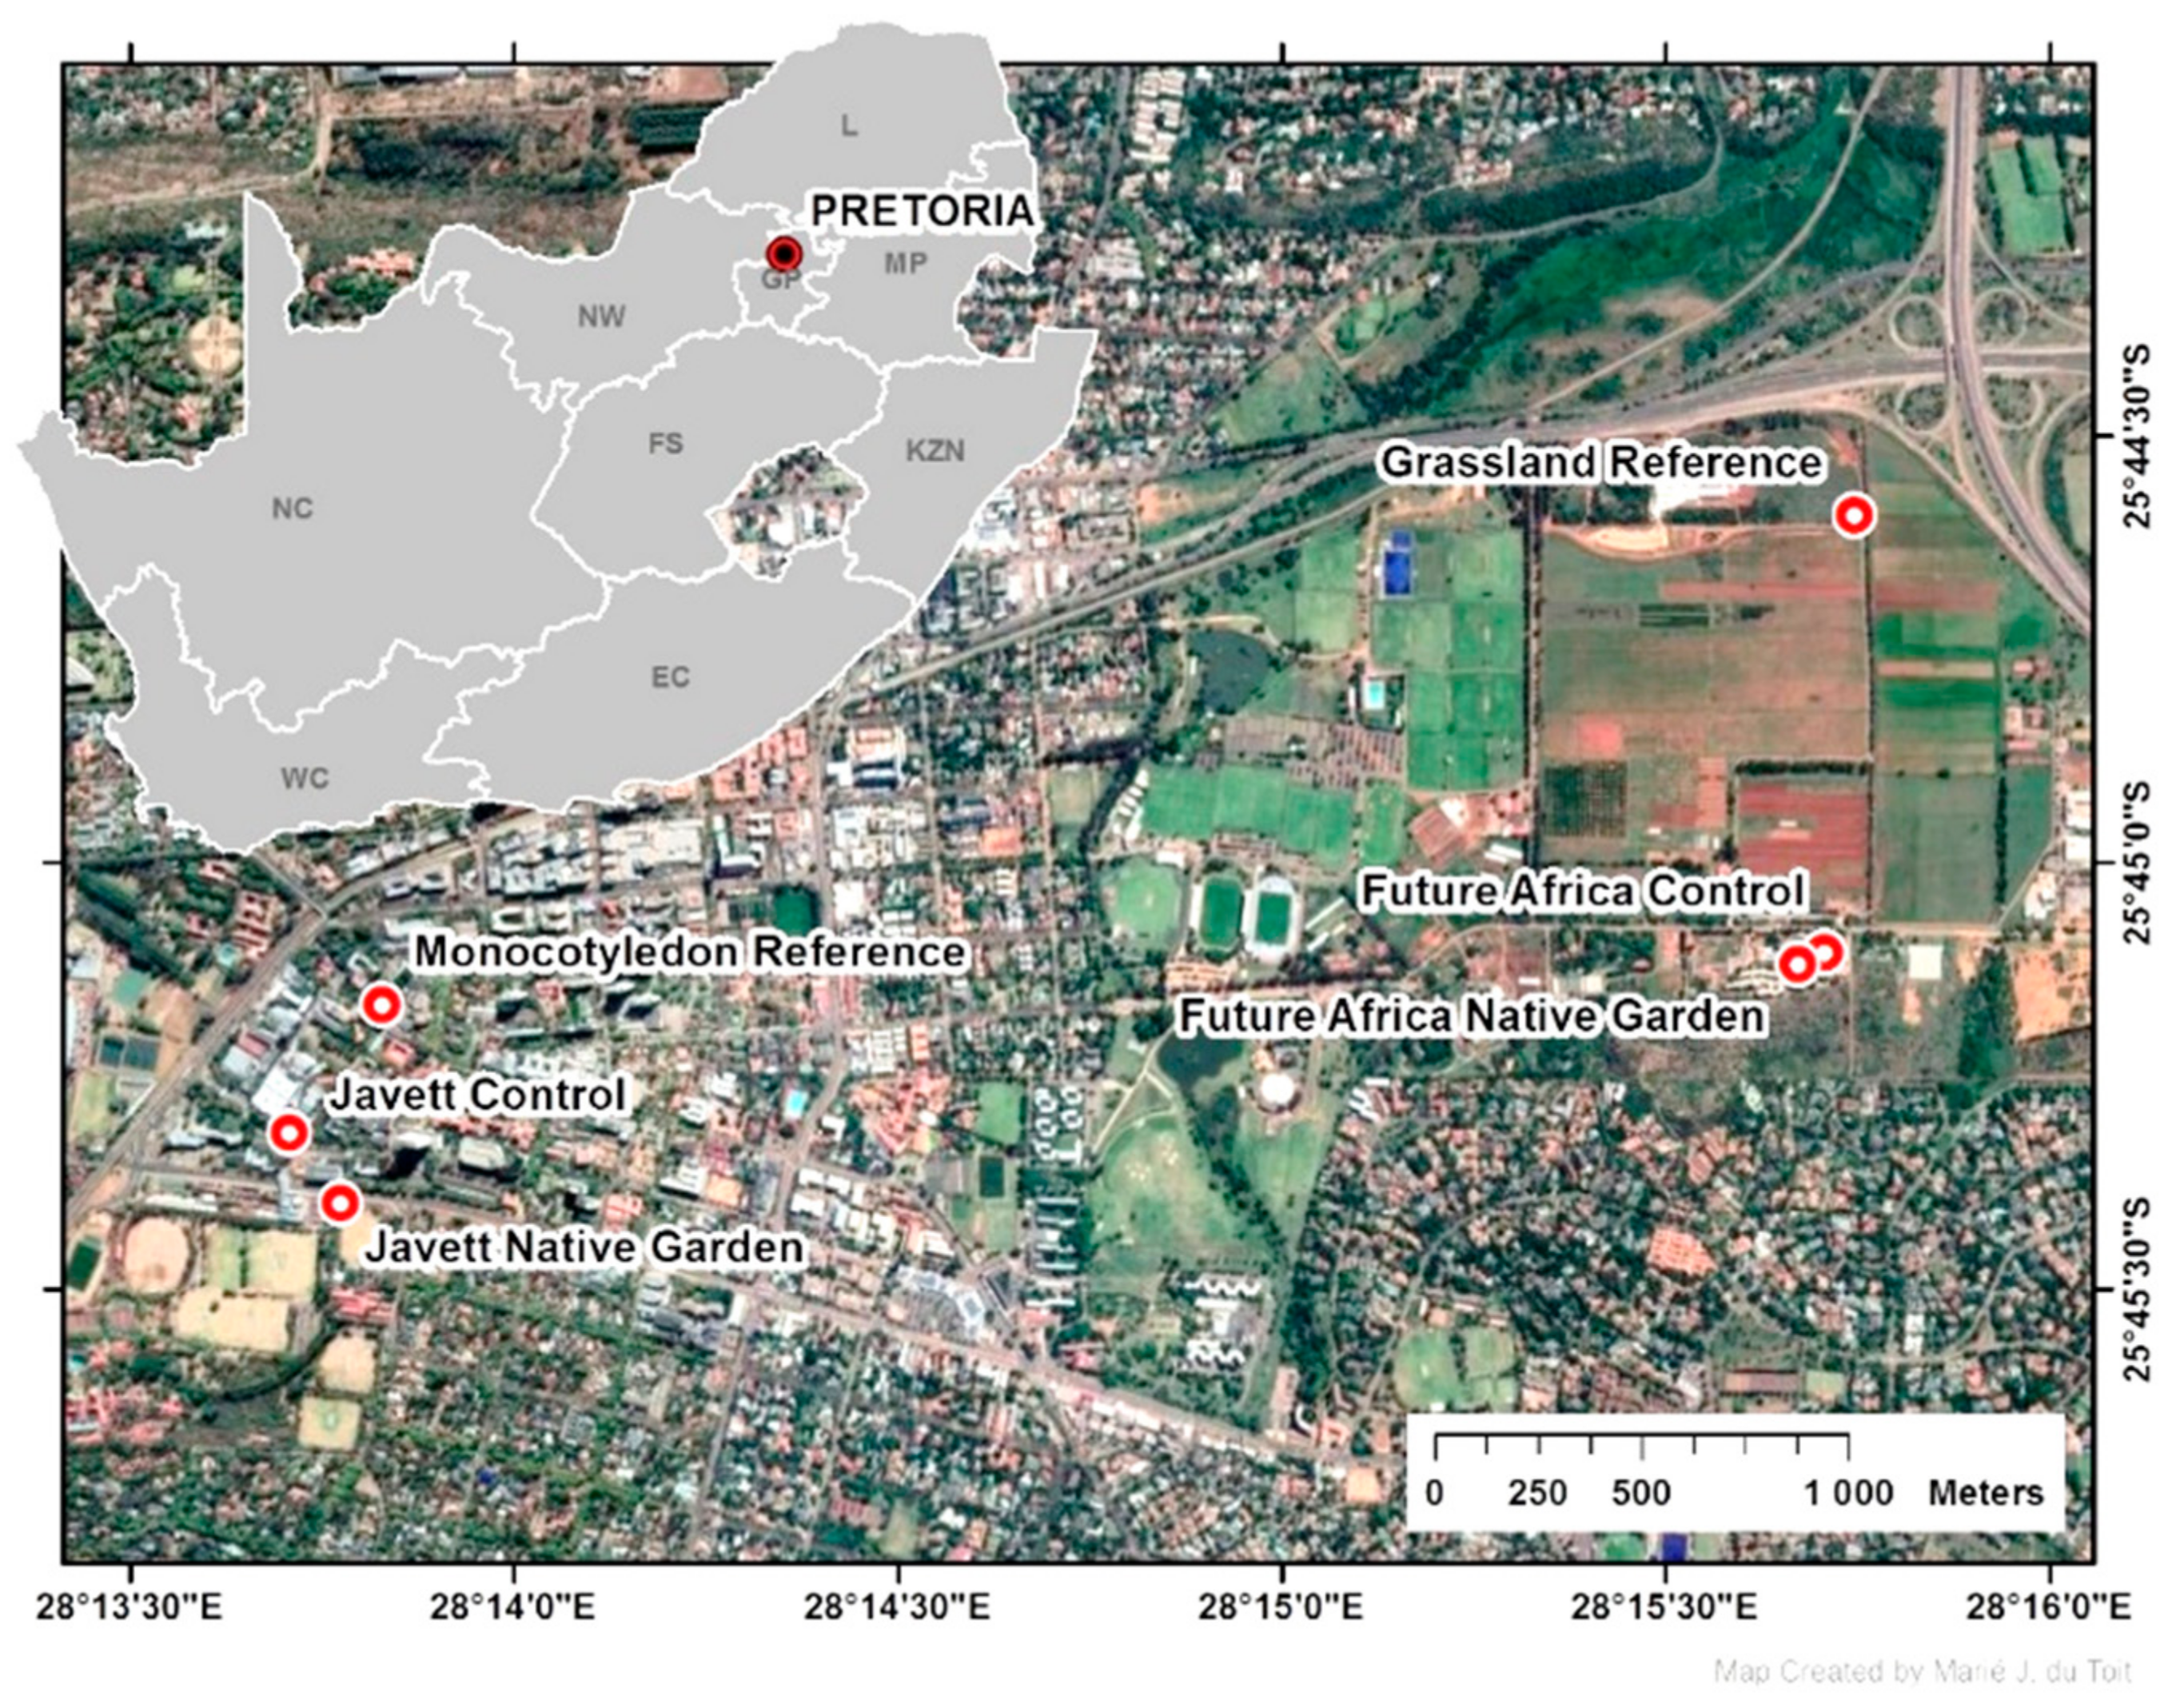
2.1. Study Area and Study Sites

Gauteng is the economic hub of South Africa—the smallest, most densely populated province, rich in biodiversity, but pressured by development and rapid urbanization [43]. The City of Tshwane metropolitan area lies within a summer rainfall area between the grassland and savanna biomes, and contains vegetation comprising high levels of endemism [56]. The six areas monitored for this study would once have been covered by the “Moot Plains Bushveld” [56], but also contain grassland vegetation that resembles the Rocky Highveld Grassland vegetation type, of which only 1.38% is conserved [57]. After fynbos, grassland is the second-most diverse vegetation type in South Africa [56]. The temperate grassland comprises plant communities of grasses and forbs that reappear on an annual basis from below-ground storage organs [58]. Woody plants are rare. The plant biomass is attributed to the grass component, whereas species richness is attained primarily through the forb component [58].
Green spaces vary greatly in terms of their insect conservation value according to their history, size, functional connectivity, heterogeneity and vegetation type, structure, and volume [5]. For similar urban history and functional connectivity, all six gardens were within a 2 km radius of one another (see Figure 1). Situated on the century-old campuses of the University of Pretoria, which is located 6 km from the city center, the area is considered representative of the age and urban development of the city (see Figure 1). The University’s grounds provide for the ownership, continued access, and management of the interventions/gardens.
To undertake this research, purposefully engineered green space interventions had to be implemented. Funding was procured and the interventions’ plants were purposefully selected. The positions of the “research gardens” (intervention sites) were negotiated as part of the University’s infrastructure development projects that occurred at the time, namely the Future Africa Campus and the Javett Art Center. Since perception studies were planned (not reported in this paper), these premises, which were under development, were selected as they provide access and use by the general public.
The research team selected two control areas, controlling for the effect of native species or not, on the same premises and of the same installation ages as the two intervention sites to account for contextual and environmental factors that cannot be held constant. Intervention area(s) refer to the young native gardens. Control area(s) refer to the young non-native gardens. Note that the landscape design consultants determined the plant species composition and abundance of the controls and the greater infrastructure development projects, representing mainstream tendencies in the local green space design industry without any focus on biodiversity conservation. These included a succulent garden (the Javett control) and an edible garden (the Future Africa control). Two additional older reference sites were added to serve as benchmarks for typical local urban habitats: an old non-native monocot garden and an old native grassland. These older and presumably less disturbed areas were deemed good reference habitats for insect species encountered in the city. Habitat patch age is generally positively correlated with insect diversity, while intense management is negatively correlated [28]. The monocotyledon reference garden contained typical commercial indigenous species that have been popularly used in garden design in South Africa, while the remnant grassland (the grassland reference) represented a fairly pristine native grassland area. It was important to select control and reference areas without trees to enable similar vegetation structures [59] among the gardens.
The patch conditions of the areas are summarized in Table 1. In an attempt to standardize patch sizes and structures [26], the plot sizes were selected to range from 70 to 200 m2 in area, determined by the size of the intervention gardens, with a perimeter length between 60 and 40 m. The degree of built-up and non-pervious surfaces surrounding the two intervention sites was not the same, which potentially influenced connectivity [26], but for each intervention site, there was one control and one reference site with similar urban conditions, but different plant assemblages of similar and older ages (see site details in Table 1 and Figure 1).

2.2. Plant Species Composition and Species Diversity

The plant species composition for the intervention sites was purposefully selected, with assistance from native plant growers, to test the species’ urban survival and ability to enhance biodiversity.
From commercial stock available, several regional evergreen species, flowering forbs and dwarf shrubs were included for socially aesthetic reasons, since many native grass and forb species are deciduous or dormant in winter. The plant species were selected to mimic natural plant compositions, allow for overlapping flowering periods [60], and include plant functional types [23] and structural diversity [59], which could positively influence insect diversity and abundance.
The plant species richness, abundance and cover were measured by means of stratified random quadrat sampling conducted in May and July 2020. Originally planned for April, but postponed due to the COVID-19 lockdown restrictions, the summer sampling took place in the beginning of May. Due to warmer urban conditions and irrigation in the gardens, the sampling was considered representative of the maximum summer growth and cover for grassland species. The July sampling is representative of the lowest temperatures with no irrigation in the native gardens, encouraging winter forb, geophyte (including several woody rootstock species) and grass dormancy and change in species cover dominance. Circular quadrats with a 1 m radius (3.14 m2) were randomly placed in representative habitat conditions found in each garden patch—with differences in the topography, the presence of rocks, and variances in species composition. The plant species found in each quadrat were identified and cover percentage was physically measured. The functional types (in accordance with [61]), permanence, and origin (native range) of each species were also recorded.
Significant differences between species richness, family richness, and functional types in the study sites were tested using the Kruskal–Wallis analysis of variance (ANOVA) and median test, where multiple comparisons of mean ranks for species richness, family richness, and functional types were generated. In addition, pairwise comparisons were conducted. The sites were compared in terms of their species composition and cover for the two sampling periods. Data were square root transformed and compared with the Bray–Curtis similarity test before being ordinated through non-metric multidimensional scaling (NMDS) and analyzed through SIMPER to identify the species responsible for (dis)similarity using Primer v6 [62]. The Sørensen coefficient was calculated to determine and compare the unstructured heterogeneity in species composition [63] using the beta diversity values, which indicate the species turnover between quadrats for each of the sites.

2.3. Insect Diversity and Sampling

The insect diversity in each garden was assessed through pitfall [16]. Ground-dwelling insects were considered representative of the small-scale vegetation refuge function. Sampling was conducted for a week in March, July, and October 2019 to account for seasonal variation [64]. Pitfall traps were inserted in each garden and checked every morning for the duration of the sampling weeks. They were lined with a standard 50:50 mixture of water and propylene glycol [65]. The traps were arranged at even distances apart and placed to account for the different plant types and microhabitats present in each garden.
After the specimens from each site had been collected, they were preserved in ethanol and identified to their lowest classification possible with the aid of specialist taxonomists. Once identified, species abundance (the total number of individuals found in each garden) and richness (the total number of different species represented in each garden) [16] were calculated. Diversity indices were also calculated for each garden. The Shannon Diversity Index accounts for both the richness and evenness of the species present, but is sensitive to changes in species richness. It assumes that all species are represented in a sample and that they are randomly sampled [66]. The Simpson Diversity Index reflects the species richness and equitability within communities. It accounts for the proportion of species present in a sample and gives more weight to common or dominant species [67].
The effect of garden type and age on species abundance and richness, as well as Shannon and Simpson diversity, was tested using the Kruskal–Wallis ANOVA and median test, where multiple comparisons of mean ranks for all groups were generated. The effect of garden age [28] on the biodiversity variables was also determined by categorizing each garden into three age categories: youngest (the Javett gardens, which were about a month old when the experiment commenced), young (the Future Africa (FA) gardens, which were less than a year old), and old (the grassland and monocotyledon references, which were over 20 years of age). The data were processed using the Statistica (Version 64) software package. The significance level was set at α = 0.05.

2.4. Plant and Insect Sampling Correlations

The differences and/or similarities in plant assemblages and insect diversity and abundance between the two experimental intervention sites, two controls, and two reference sites were described using the Spearman correspondence analysis. For the plant and insect variables, the seasonal totals were used. For the Simpson and Shannon diversity indices, Sørensen coefficient, and percentage of native plant cover, the seasonal averages for each garden site were used. The data were processed using the XLSTAT Version 2021.1.1.1088 software package.

3. Results

3.1. Plant Assemblages and Dominant Garden Type Qualities

3.1.1. Plant Species, Family and Functional Type Richness

A total of 93 plant species were recorded from all six sites (list available in Supplementary Data). Table 2 presents the results from the quadrat sampling in the two seasonal periods. The gardens are arranged from old (left) to young (right). Sites with native species dominance are indicated in grey.
The differences in plant species richness (Kruskal–Wallis test: H (5, N = 40) = 25.662, p < 0.001) (Figure 2a), plant family richness (Kruskal–Wallis test: H (5, N = 40) = 21.481, p < 0.001) (Figure 2b), and number of plant functional types (Kruskal–Wallis test: H (5, N = 40) = 22.087, p < 0.001) (Figure 2c) across seasons between the gardens (per quadrat) were statistically analyzed. The Javett control, FA native garden, grassland reference, and Javett native garden had comparable species and family richness per quadrat. The monocotyledon reference and FA control had lower species and family richness. The FA control showed significantly lower species richness (p = 0.008) and family richness (p = 0.001) than the FA native garden per quadrat.
The following eight functional types were recorded among the sites: annual/perennial forbs; geophytes; succulents; annual/perennial graminoids (including grasses and sedges); dwarf shrubs; and woody shrubs. The Javett, FA control, and grassland reference contained only an average of two to three functional types per quadrat, compared to the FA and Javett native gardens and the monocotyledon reference, which contained between four and five each. The Javett control had significantly fewer functional types than both the FA (p = 0.004) and Javett (p = 0.008) native gardens. The functional types in the Javett control were perennial forbs and succulents only. The grassland reference had significantly fewer functional types than the FA native garden (p = 0.035). The grassland contained annual/perennial forbs, geophytes, and annual/perennial graminoids, but no dwarf shrubs or woody shrubs. Notably, only the FA and Javett native gardens had different dominant functional types between seasons (Table 2).

3.1.2. Plant Species Composition and Cover

The grassland reference, FA, and Javett native gardens have more than 80% native plant cover, which decreases in winter due to plant dormancy. The FA control garden has approximately 40% native species cover. The Javett control and monocotyledon references have a dominant cover of 40 to 50% indigenous species across seasons (see Table 2). The Javett control fluctuates the least in cover between seasons due to the highest percentage of evergreen (and succulent) cover, with the monocotyledon reference in second place (Table 2). The FA and Javett native gardens are the only gardens with different species cover dominance between the main growing seasons. The FA native garden is the only garden with different dominant families between full summer cover and extreme winter cover conditions, alternating between Asteraceae and Poaceae. Noteworthy is that the grassland reference has 78% grass cover (Poaceae family) throughout the year. The Javett control is dominated by a single species coverage of 37% and more throughout the year, the popular succulent creeper Carpobrotus edulis, while the grassland reference is dominated by a single species coverage of 50% and more throughout the year, namely the grass Themeda triandra (Table 2).
Tests were conducted to compare the sites in terms of the plant species composition and cover of all the quadrats in both seasons. With similar patterns in the two tests, the species cover results, deemed more representative than the species composition, are discussed here. The stress level was under 0.1 and therefore indicated a good fit. The NMDS results show that the monocotyledon reference was so compositionally different to the rest that the remaining sites clustered tightly together (Figure 3a). Note that the one quadrat of the monocotyledon reference (6.3) was totally dissimilar to the other two (6.1–6.2), which showed some overlap. By removing the outliers, the monocotyledon reference (6.1–6.3) and one of the FA control quadrats (2.3 that contained edible exotic species), the differences between the remaining sites could be investigated (Figure 3b,c). In both seasons, the grassland (except for one quadrat, 3.2–3.5) and Javett control (5.1–5.2) showed significant overlap and clustering of quadrats, indicating that they are more similar in species composition for each site. The proximity of the remaining two quadrats (more similar) of the FA control (2.1–2.2) suggests some homogeneity in species composition. Both the FA (1.1–1.4) and Javett (4.1–4.3) native garden showed a widespread arrangement in quadrats (more dissimilar), indicative of the heterogeneity in species composition between these gardens.
A SIMPER analysis was conducted where the contributions of individual species to the separation of the groups could be examined. The analysis revealed that there was quite a high dissimilarity between all the sites (80% and higher). For the highly clustered grassland reference, two species contributed more than 80% to a 45% similarity, the grasses Themeda triandra and Eragrostis chloromelas. In the clustered Javett control, Carpobrotus edulis contributed 25% to a 72% similarity. The FA control (with the one quadrat removed) had a 40% similarity with two species contributing 99%, namely Hypoxis hemerocallidea and Melinis nerviglumis. The monocotyledon reference had an internal similarity of 20% (reduced by one very dissimilar quadrat containing Strelitzea reginae and Strelitzea juncea shrubs only); four species contributed roughly 20% to this similarity, namely Crinum bulbispermum, Agapanthus praecox “blue ice” and two exotic weeds, Bidens Pilosa and Pennisetum clandestinum. The FA and Javett native gardens had an internal similarity of 18% and 14%, respectively.

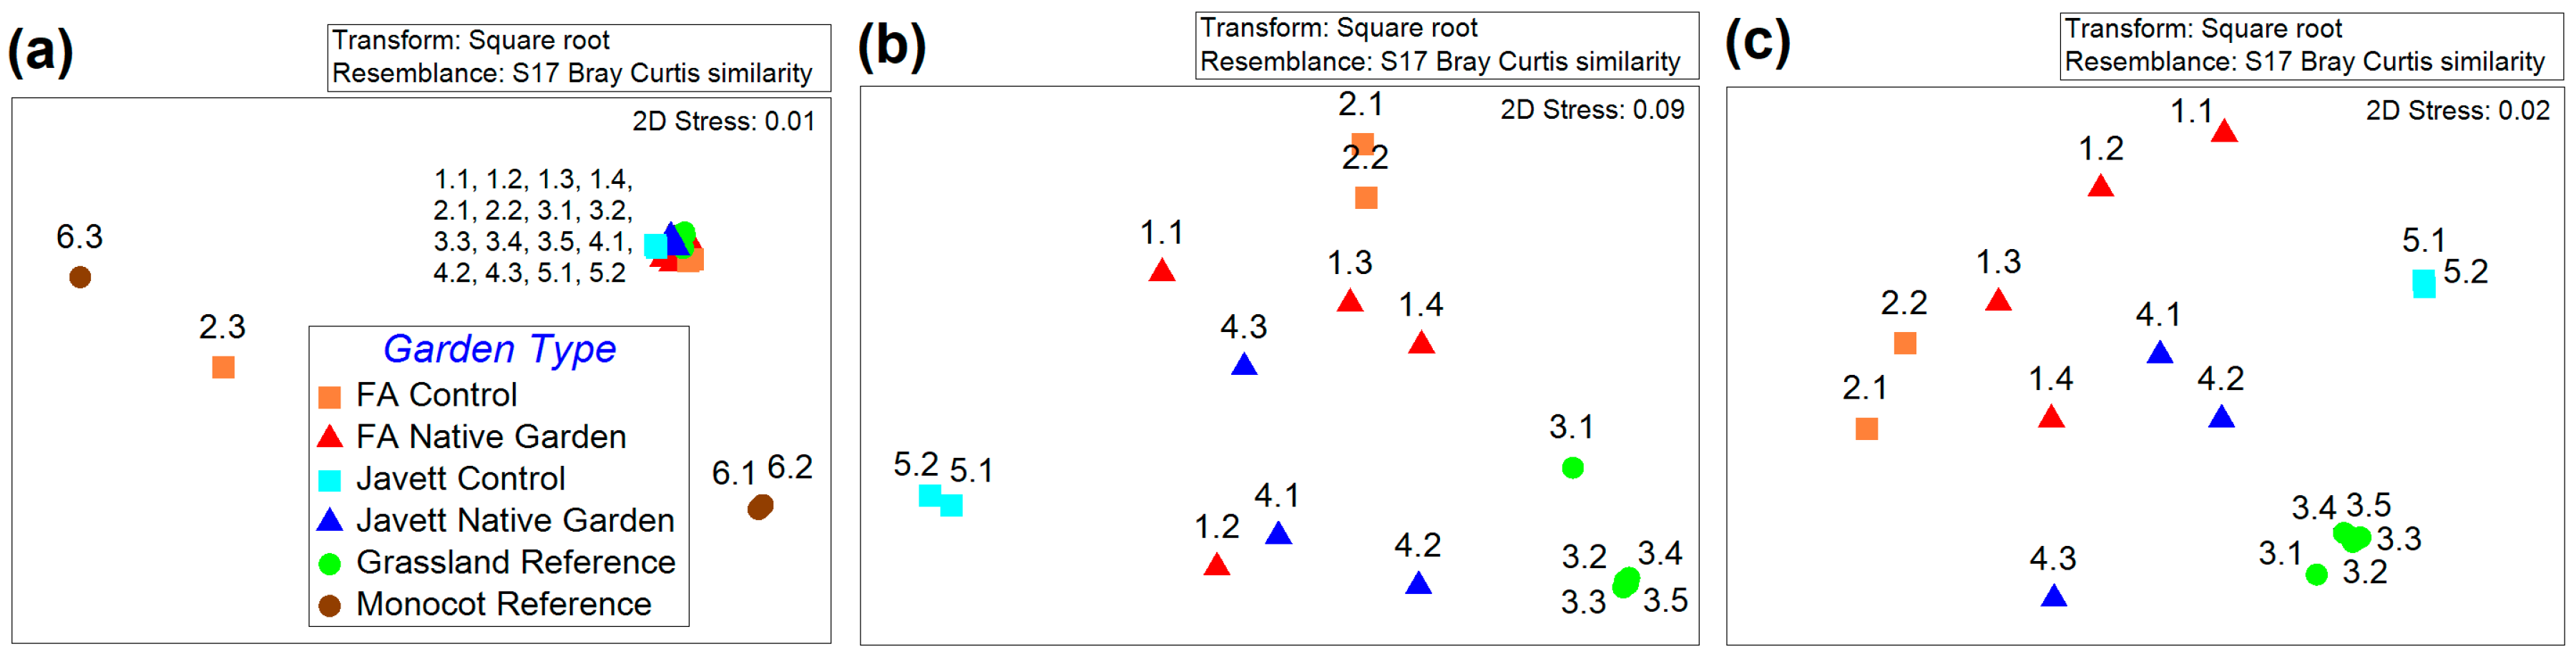
3.1.3. Plant Beta Diversity (Species Turnover)

The average species turnover (or beta diversity) between quadrats inside each site was calculated using the Sørensen coefficient and was reflective of the patterns observed in the NMDS of plots. The Javett control garden showed very high levels of similarity in species in summer at 73%. The grassland reference was in second place at 40%. Both gardens showed even higher similarity in winter at 85% and 68%, respectively (Table 2). The FA native garden showed the highest beta diversity with a low similarity of 13% and 15% in winter, followed by the FA control at 19% in summer and 13% in winter (note this position due to one very dissimilar quadrat), the Javett native garden at 24% across seasons, and the monocotyledon reference at 28% and 27% (note that this position was due to one very dissimilar quadrat). To reflect the average beta diversity of the FA control and monocotyledon reference more accurately, the two extreme outlier plots (2.3 and 6.3) were removed and beta diversity (Sørensen coefficient) recalculated (Sørensen outliers removed). The FA control subsequently showed a similarity of species at 57% in summer and 40% in winter, while the monocotyledon reference showed a similarity of 80% in summer and 83% in winter (see Table 2).

3.2. Insect Diversity and Abundance

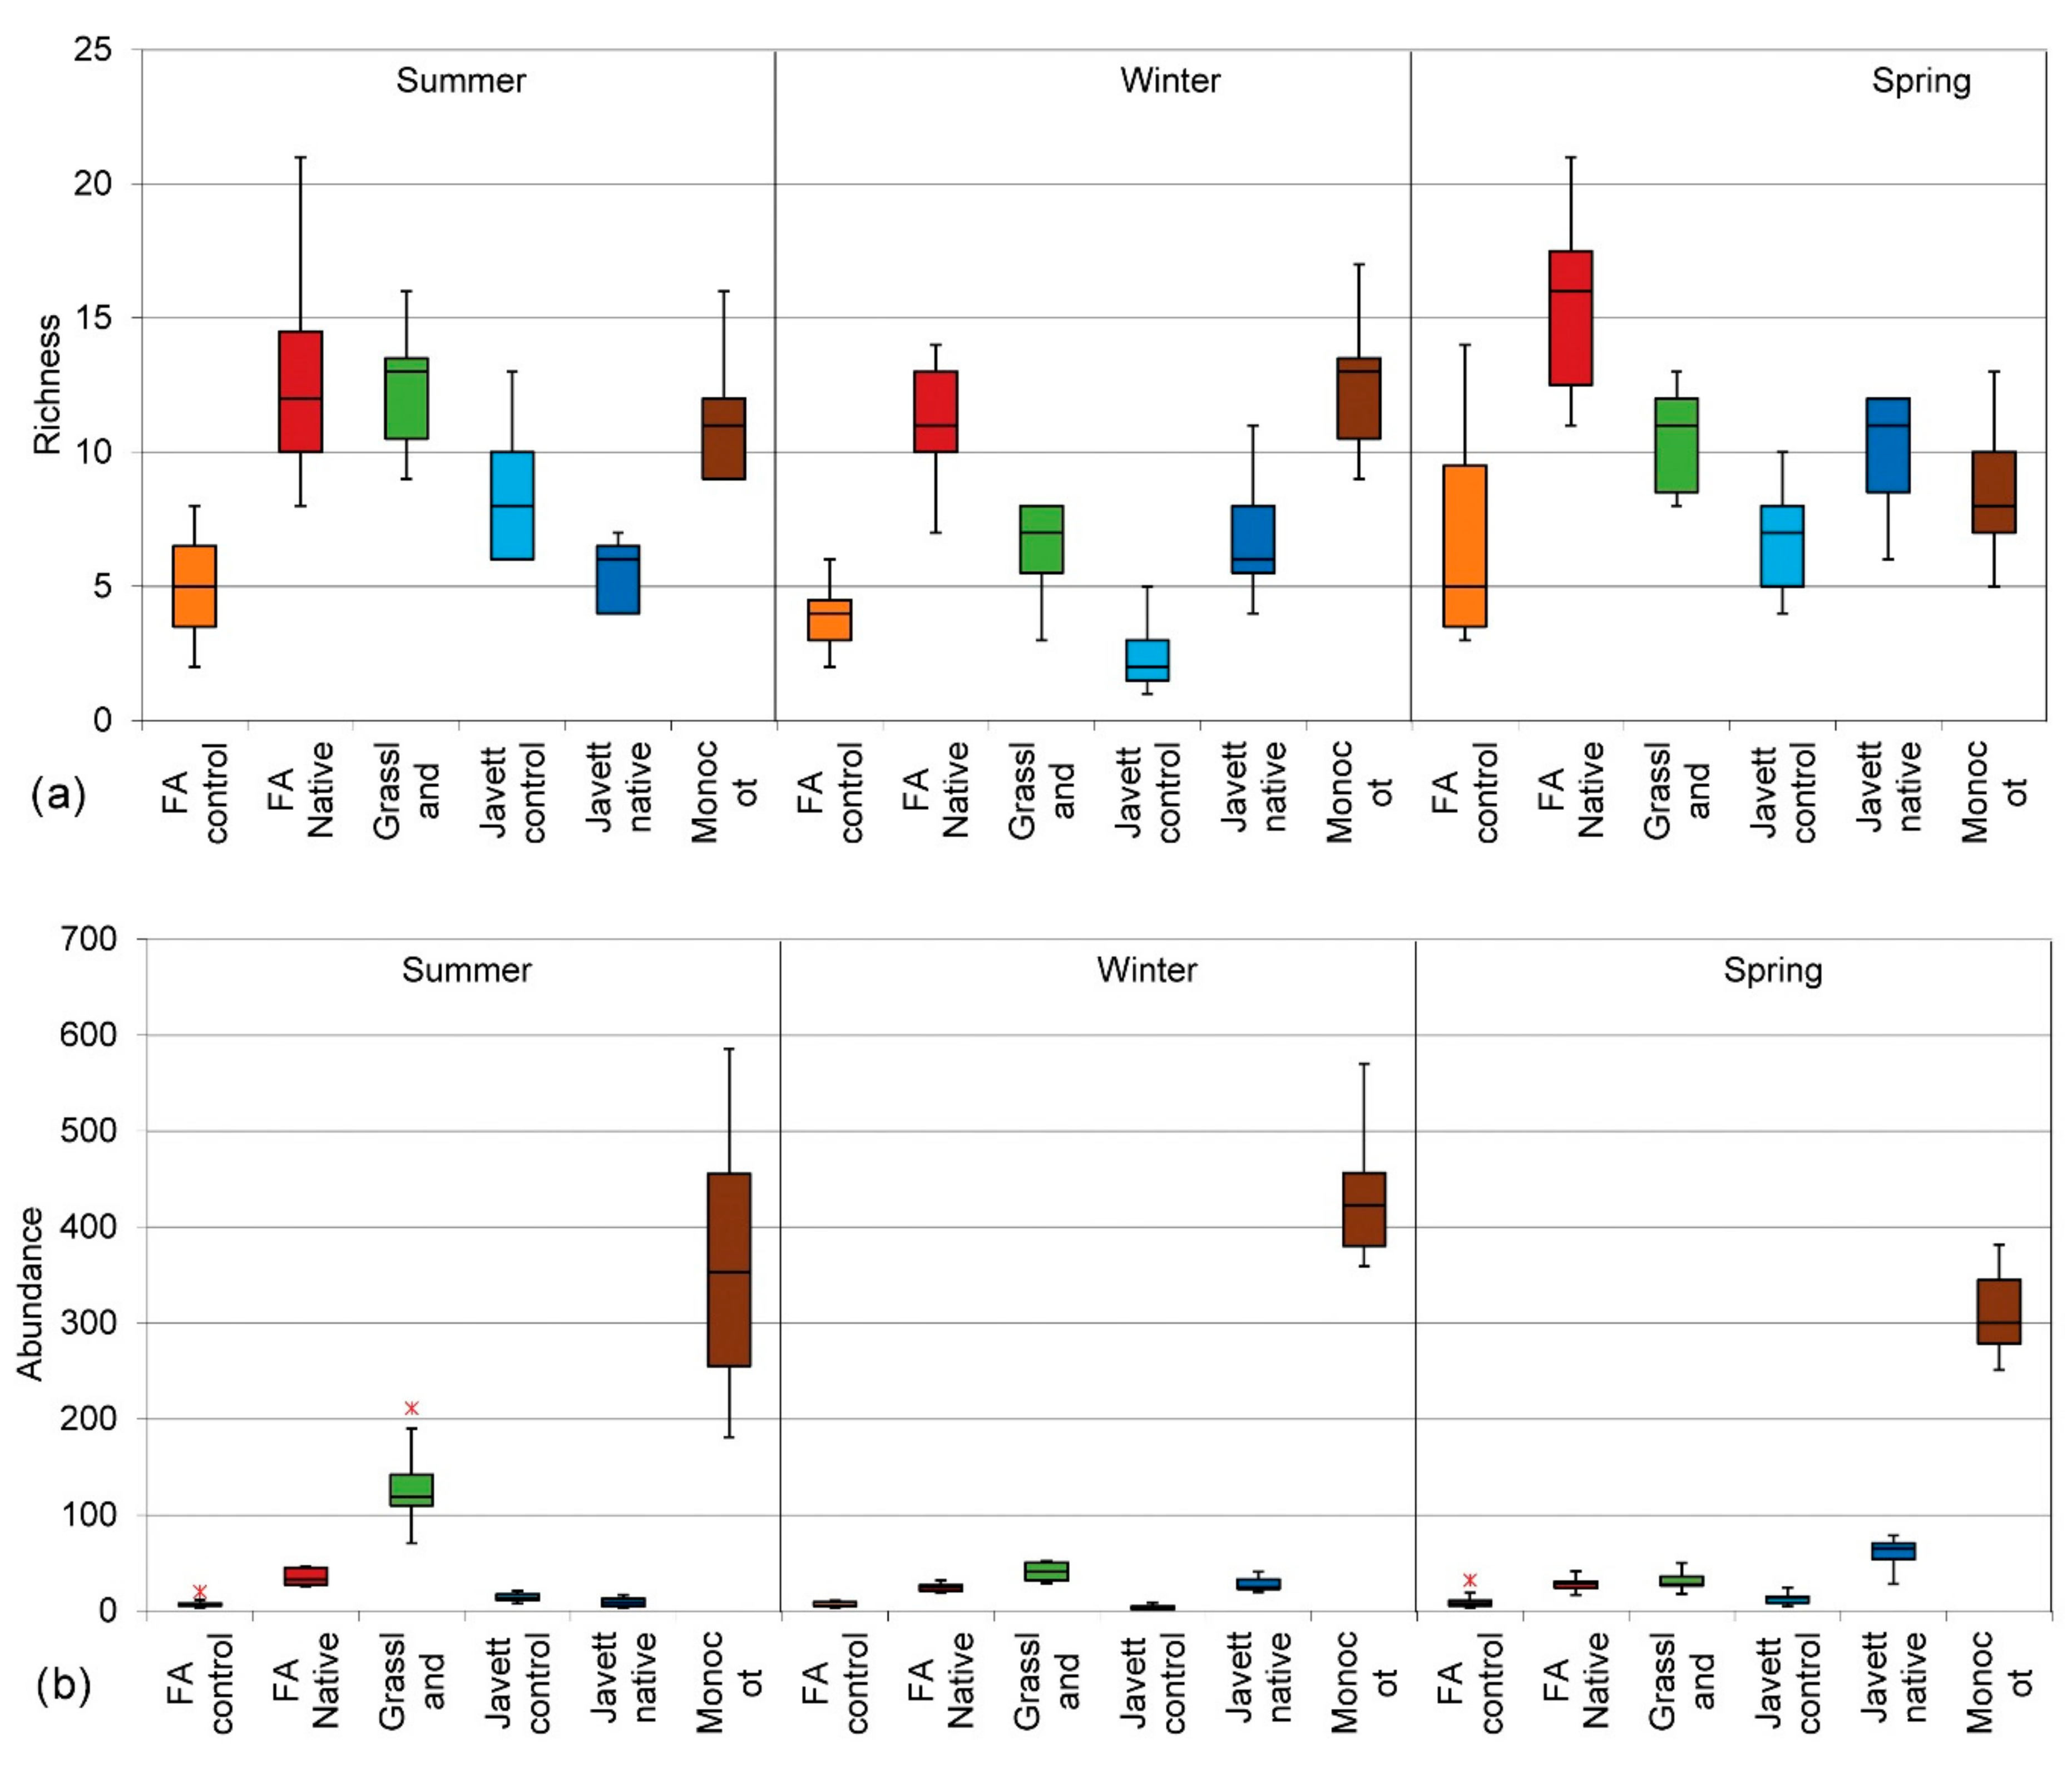
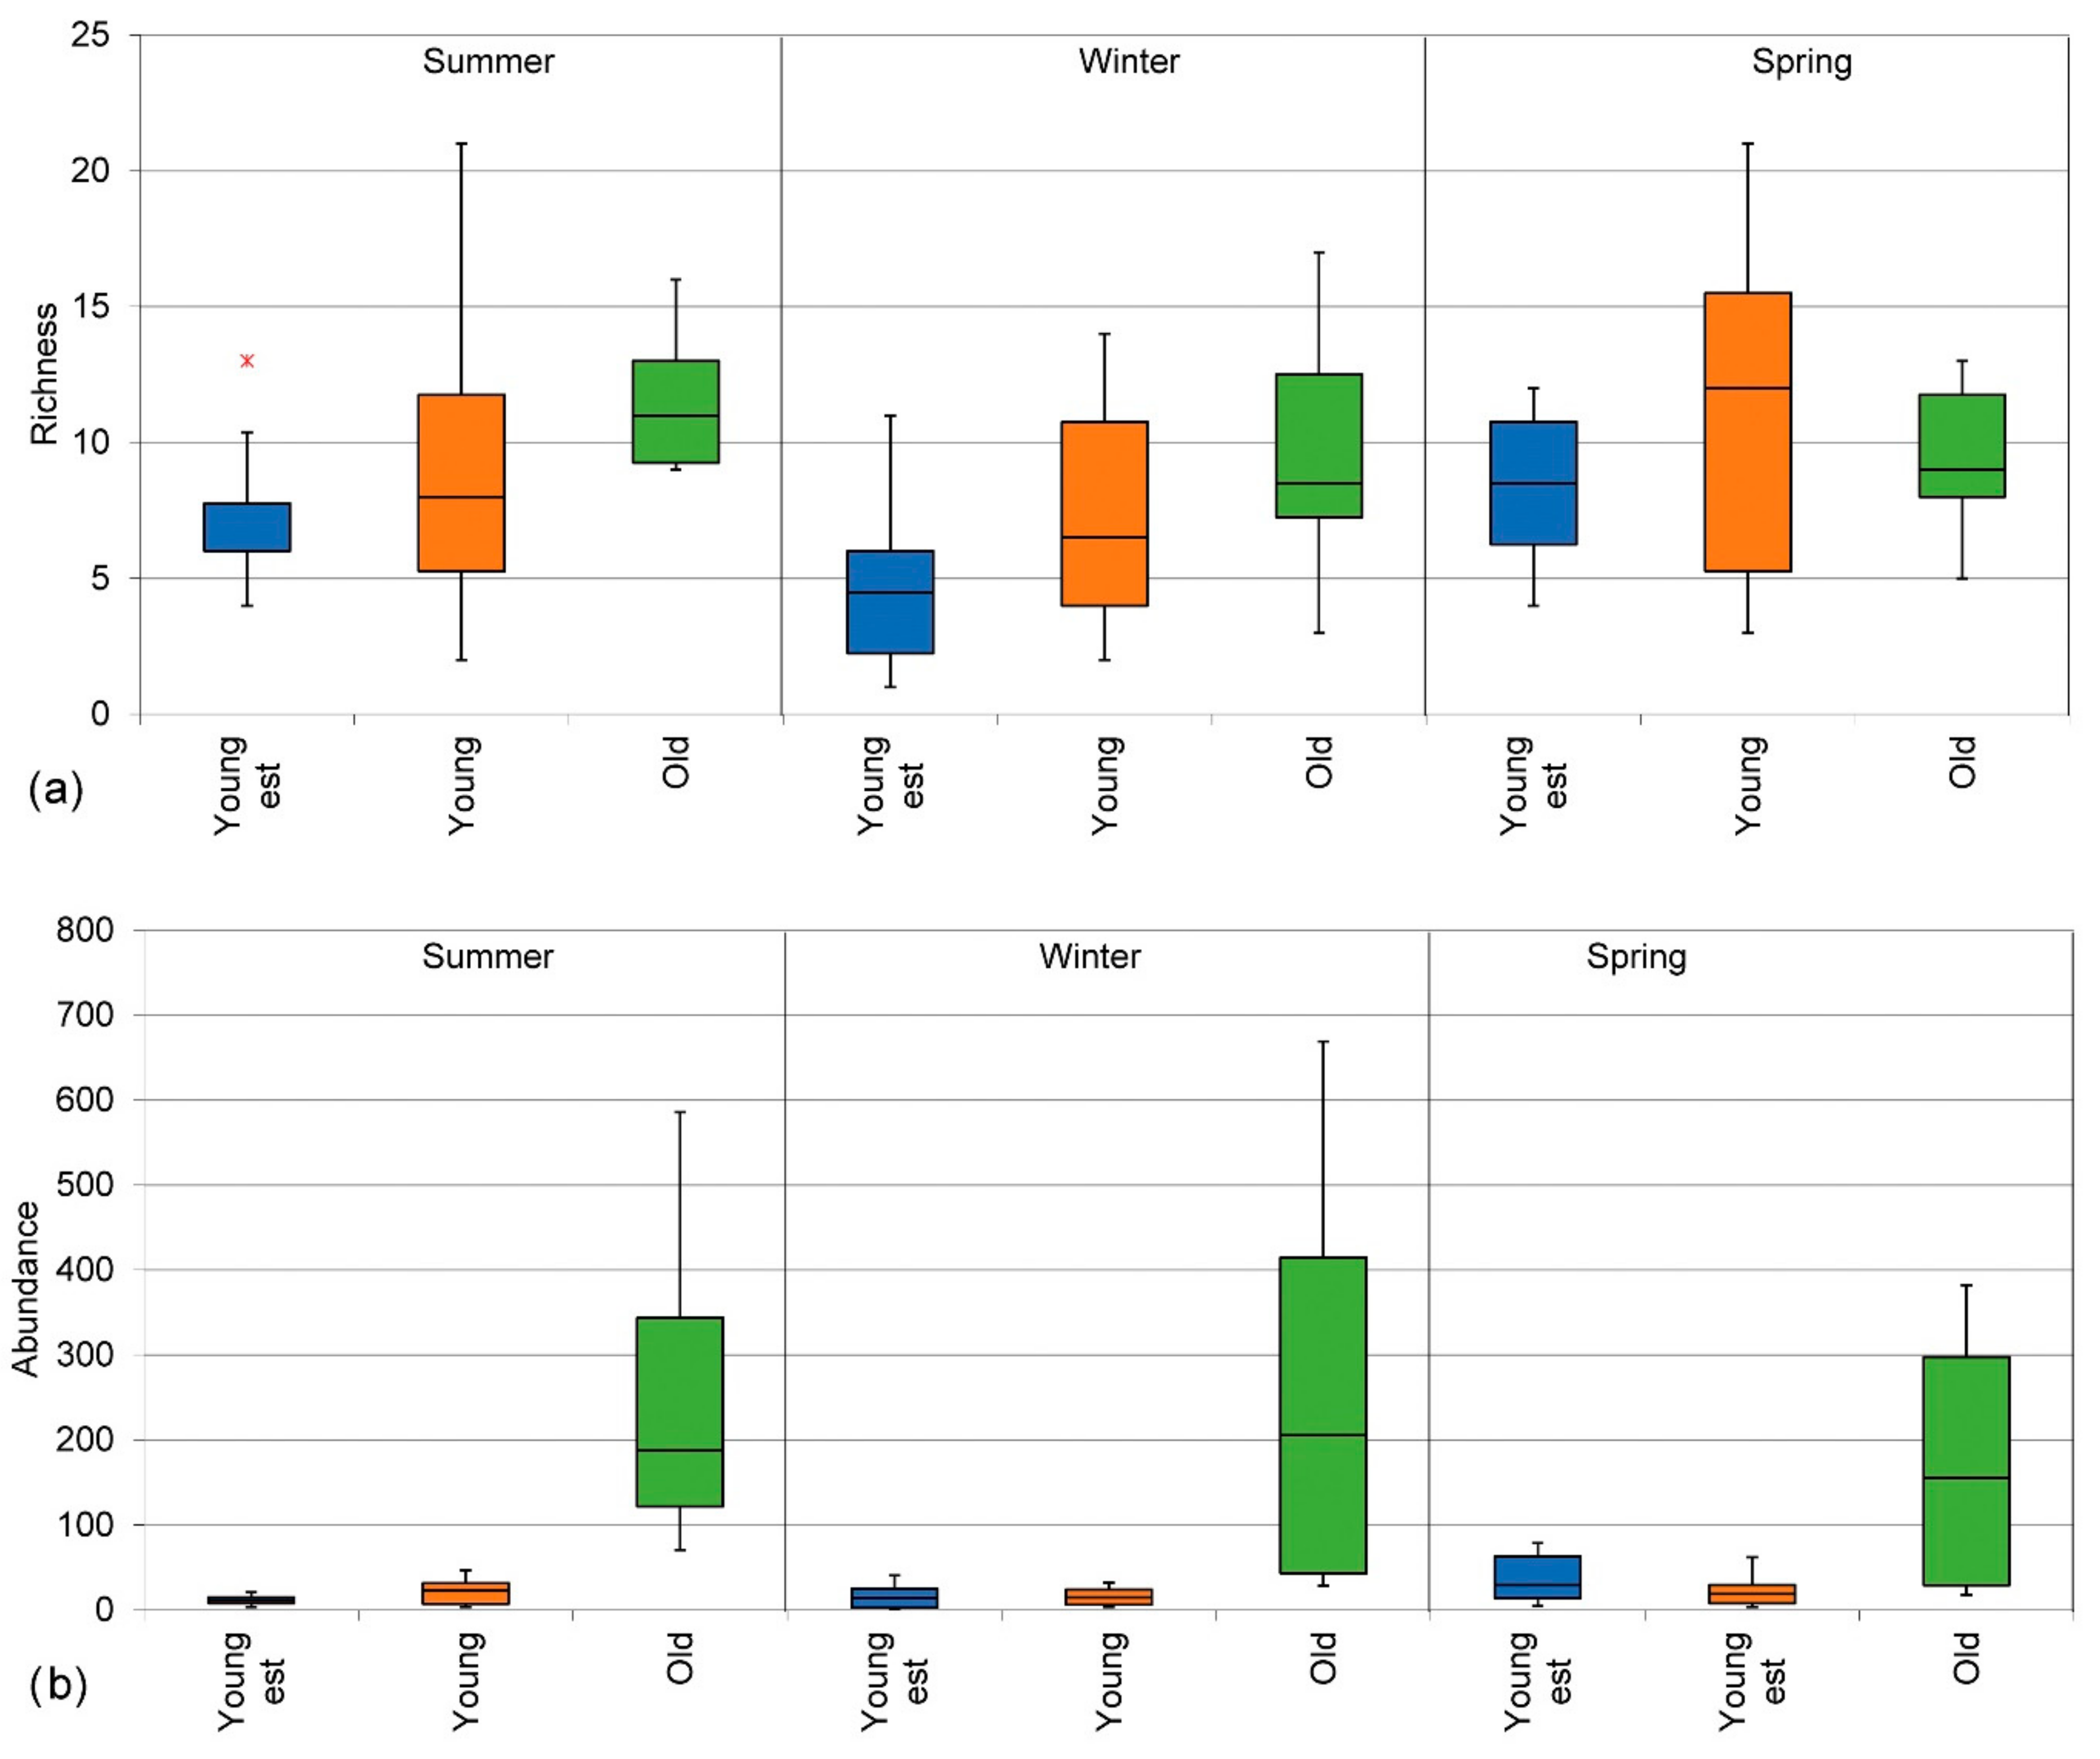
3.2.1. Insect Species Richness

A total of 230 insect taxa were sampled from ten orders across the seasons in the six areas (see Supplementary Data for species list). The orders samples included Blattodea, Coleoptera, Dermaptera, Diptera, Hemiptera, Hymenoptera, Lepidoptera, Mantodea, Orthoptera, and Thysanoptera.
Garden type had a significant effect on species richness in summer (H (5, N = 42) = 27.78, p < 0.001), winter (H (5, N = 42) = 32.11, p = 0.0001), and spring (H (5, N = 42) = 18.08, p = 0.0028) (see Figure 4, top panel). Species richness was slightly higher in spring (an average of 58 species in total) than in summer (55 species) and was lowest in winter (43 species). The FA native garden had the highest average and total species richness across seasons, followed by the monocotyledon and the grassland references. The FA control and monocotyledon reference, comparatively, maintained slightly higher species richness numbers in winter, while the other gardens all dropped in richness. The Javett native garden increased significantly in species richness towards springtime, while the monocotyledon reference dropped in richness. The grassland reference showed the highest species richness in summer. The FA native garden showed a significantly higher insect species richness than the FA control in summer (p = 0.006251), winter (p = 0.011446), and spring (p = 0.009765), and the Javett native garden showed a significantly higher insect species richness in summer (p = 0.010574).
The monocotyledon and grassland references both showed greater species richness than the Javett native garden in summer (p = 0.045724; p = 0.007363), but not in spring.

3.2.2. Insect Species Abundance

Garden type had a significant effect on total insect abundance in summer (H (5, N = 42) = 36.57, p < 0.001) (Figure 4a), winter (H (5, N = 42) = 37.00, p < 0.001), and spring (H (5, N = 42) = 31.37, p < 0.001) (Figure 4b). The highest insect abundance across gardens was sampled in summer. The monocotyledon reference showed a far greater abundance than the other gardens, with an average of more than 300 specimens across seasons, and the greatest numbers in winter. This abundance was significantly greater than the FA control (p < 0.001 in summer, winter, and spring) and the Javett control (p < 0.001 in winter, spring, and summer, p = 0.009765). The grassland reference was in second place, followed by the FA native garden with an average of between 25 and 33 specimens across seasons. It is, however, important to note that, in both the grassland and monocotyledon references, of the species encountered, 85% in summer and more than 90% in winter were Formicidae (ant) species (with as much as 42% in other gardens). The grassland reference obtained a significantly higher average abundance in summer (119 specimens) and the Javett native garden obtained a significantly higher average abundance in spring (65 specimens), more than double the abundance they had in the other seasons. The lowest overall average abundance was obtained by the Javett and FA control (between three and 14 specimens each season).

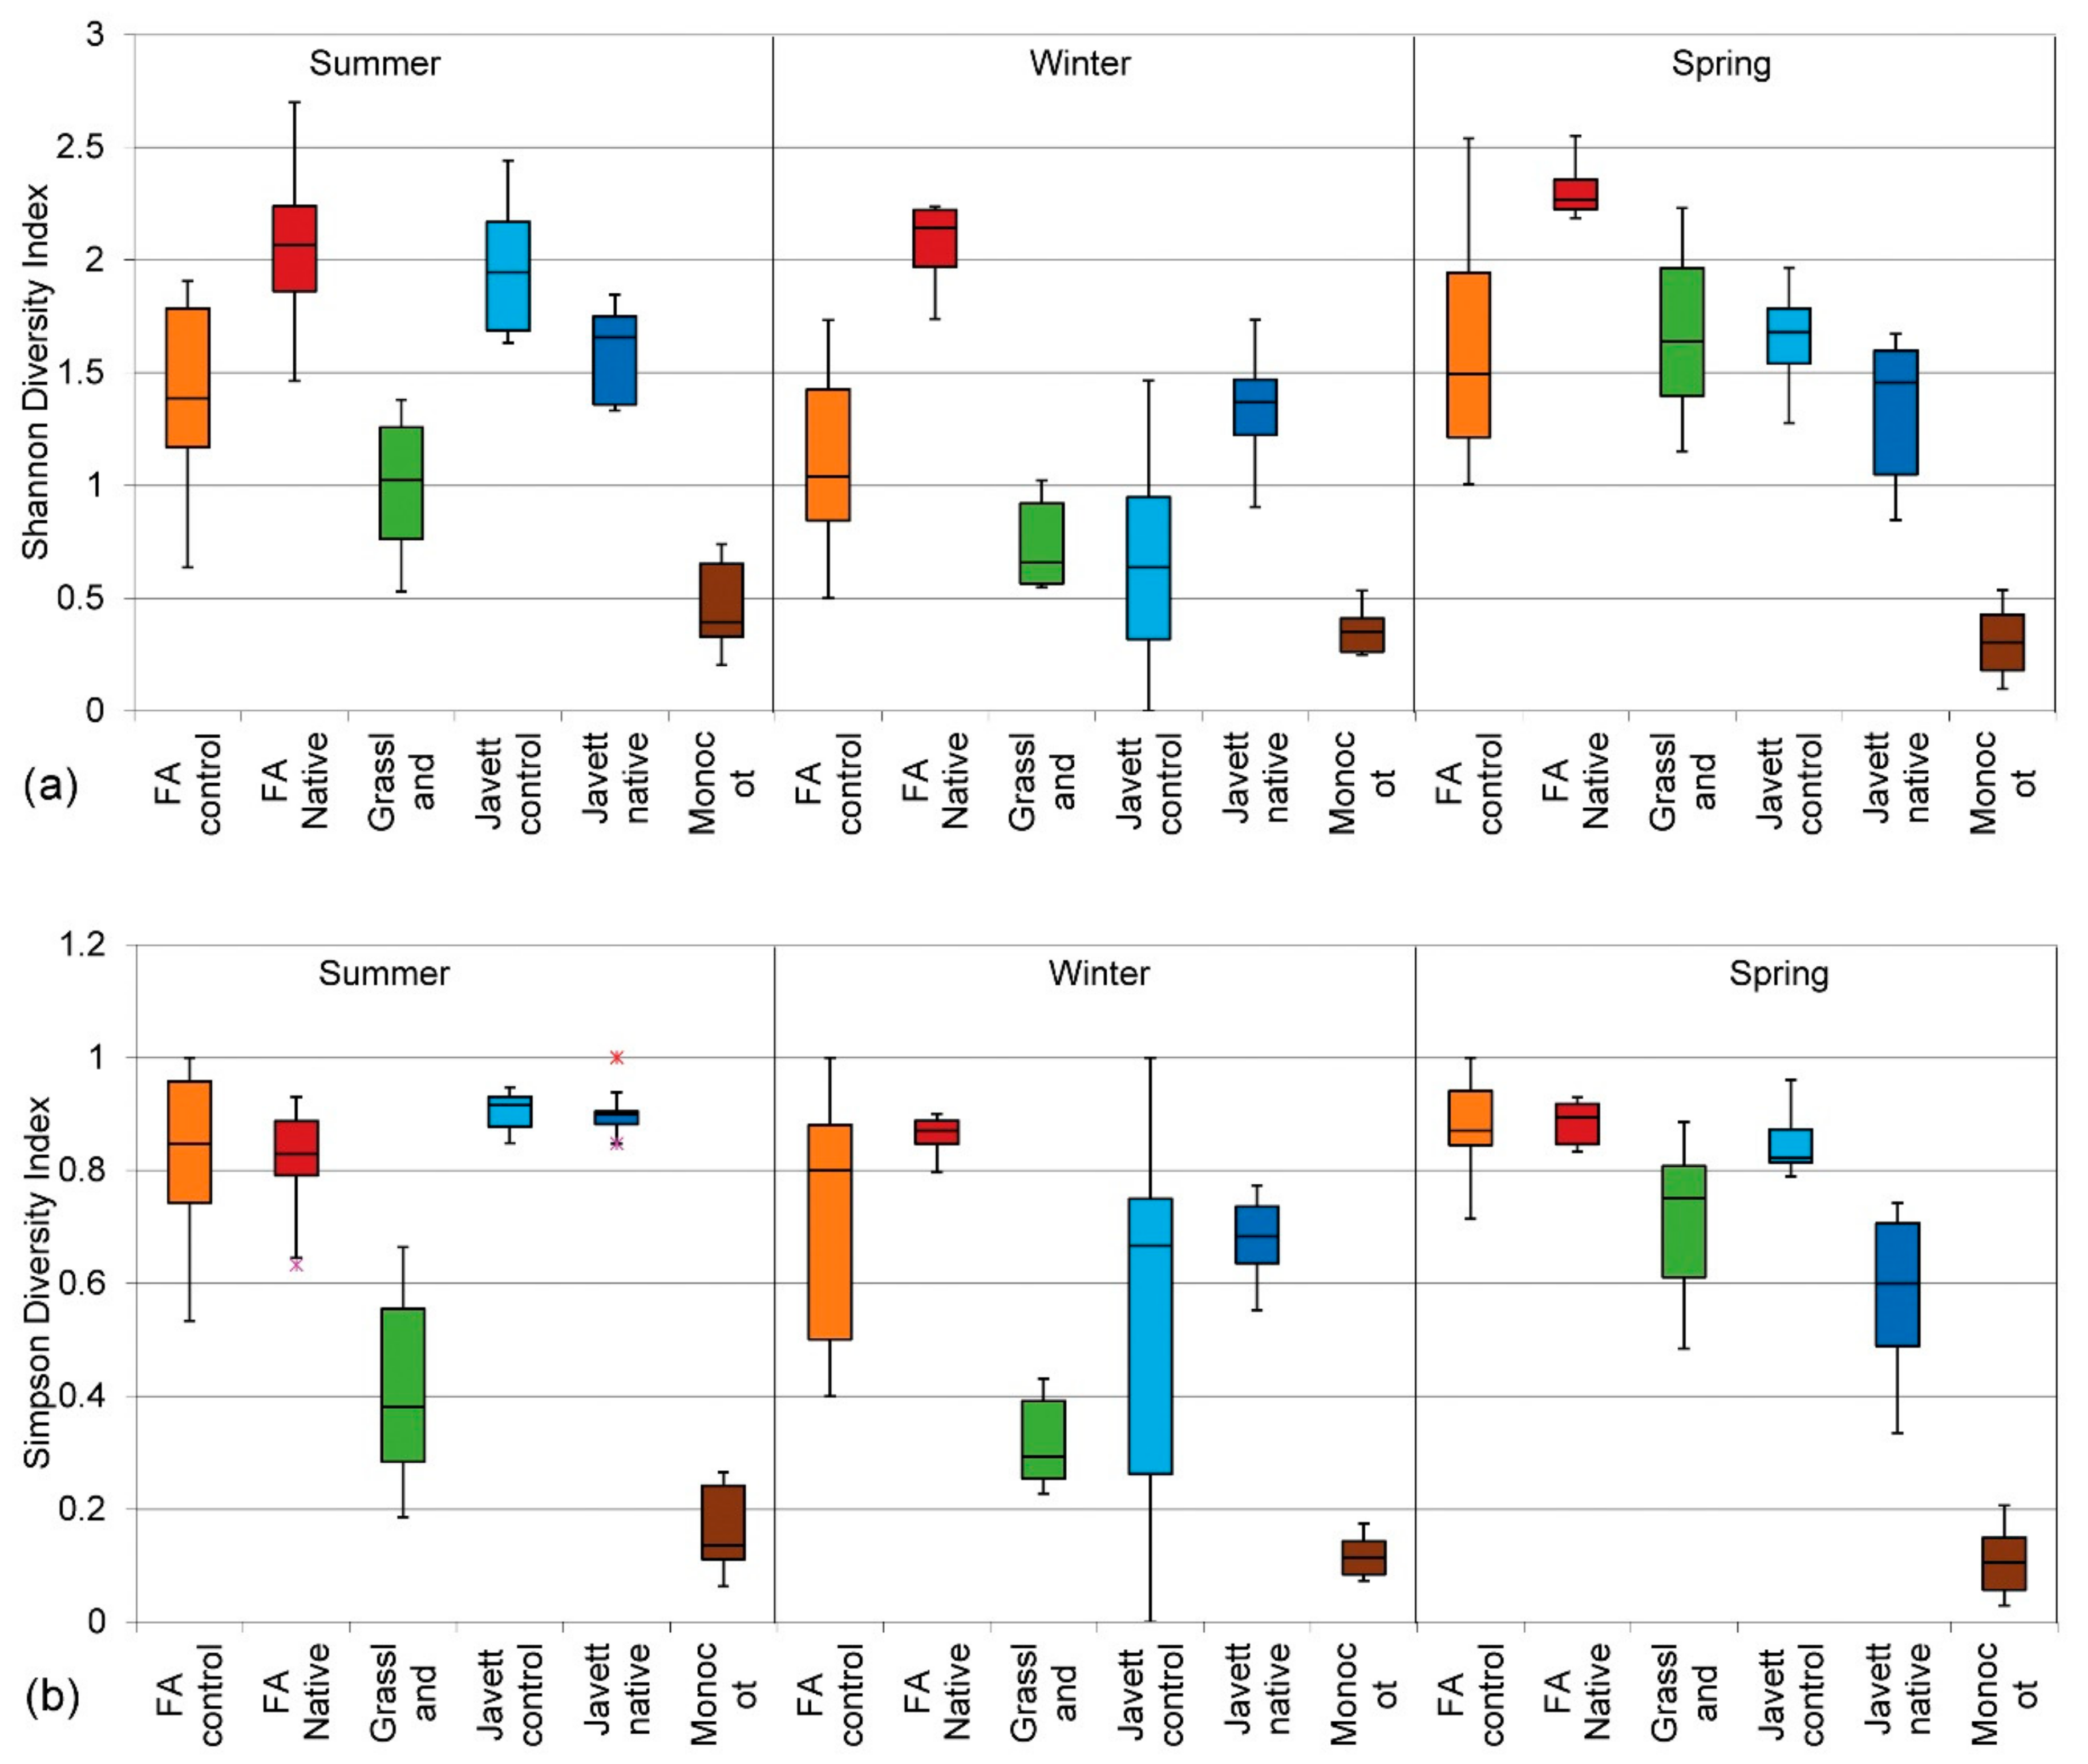
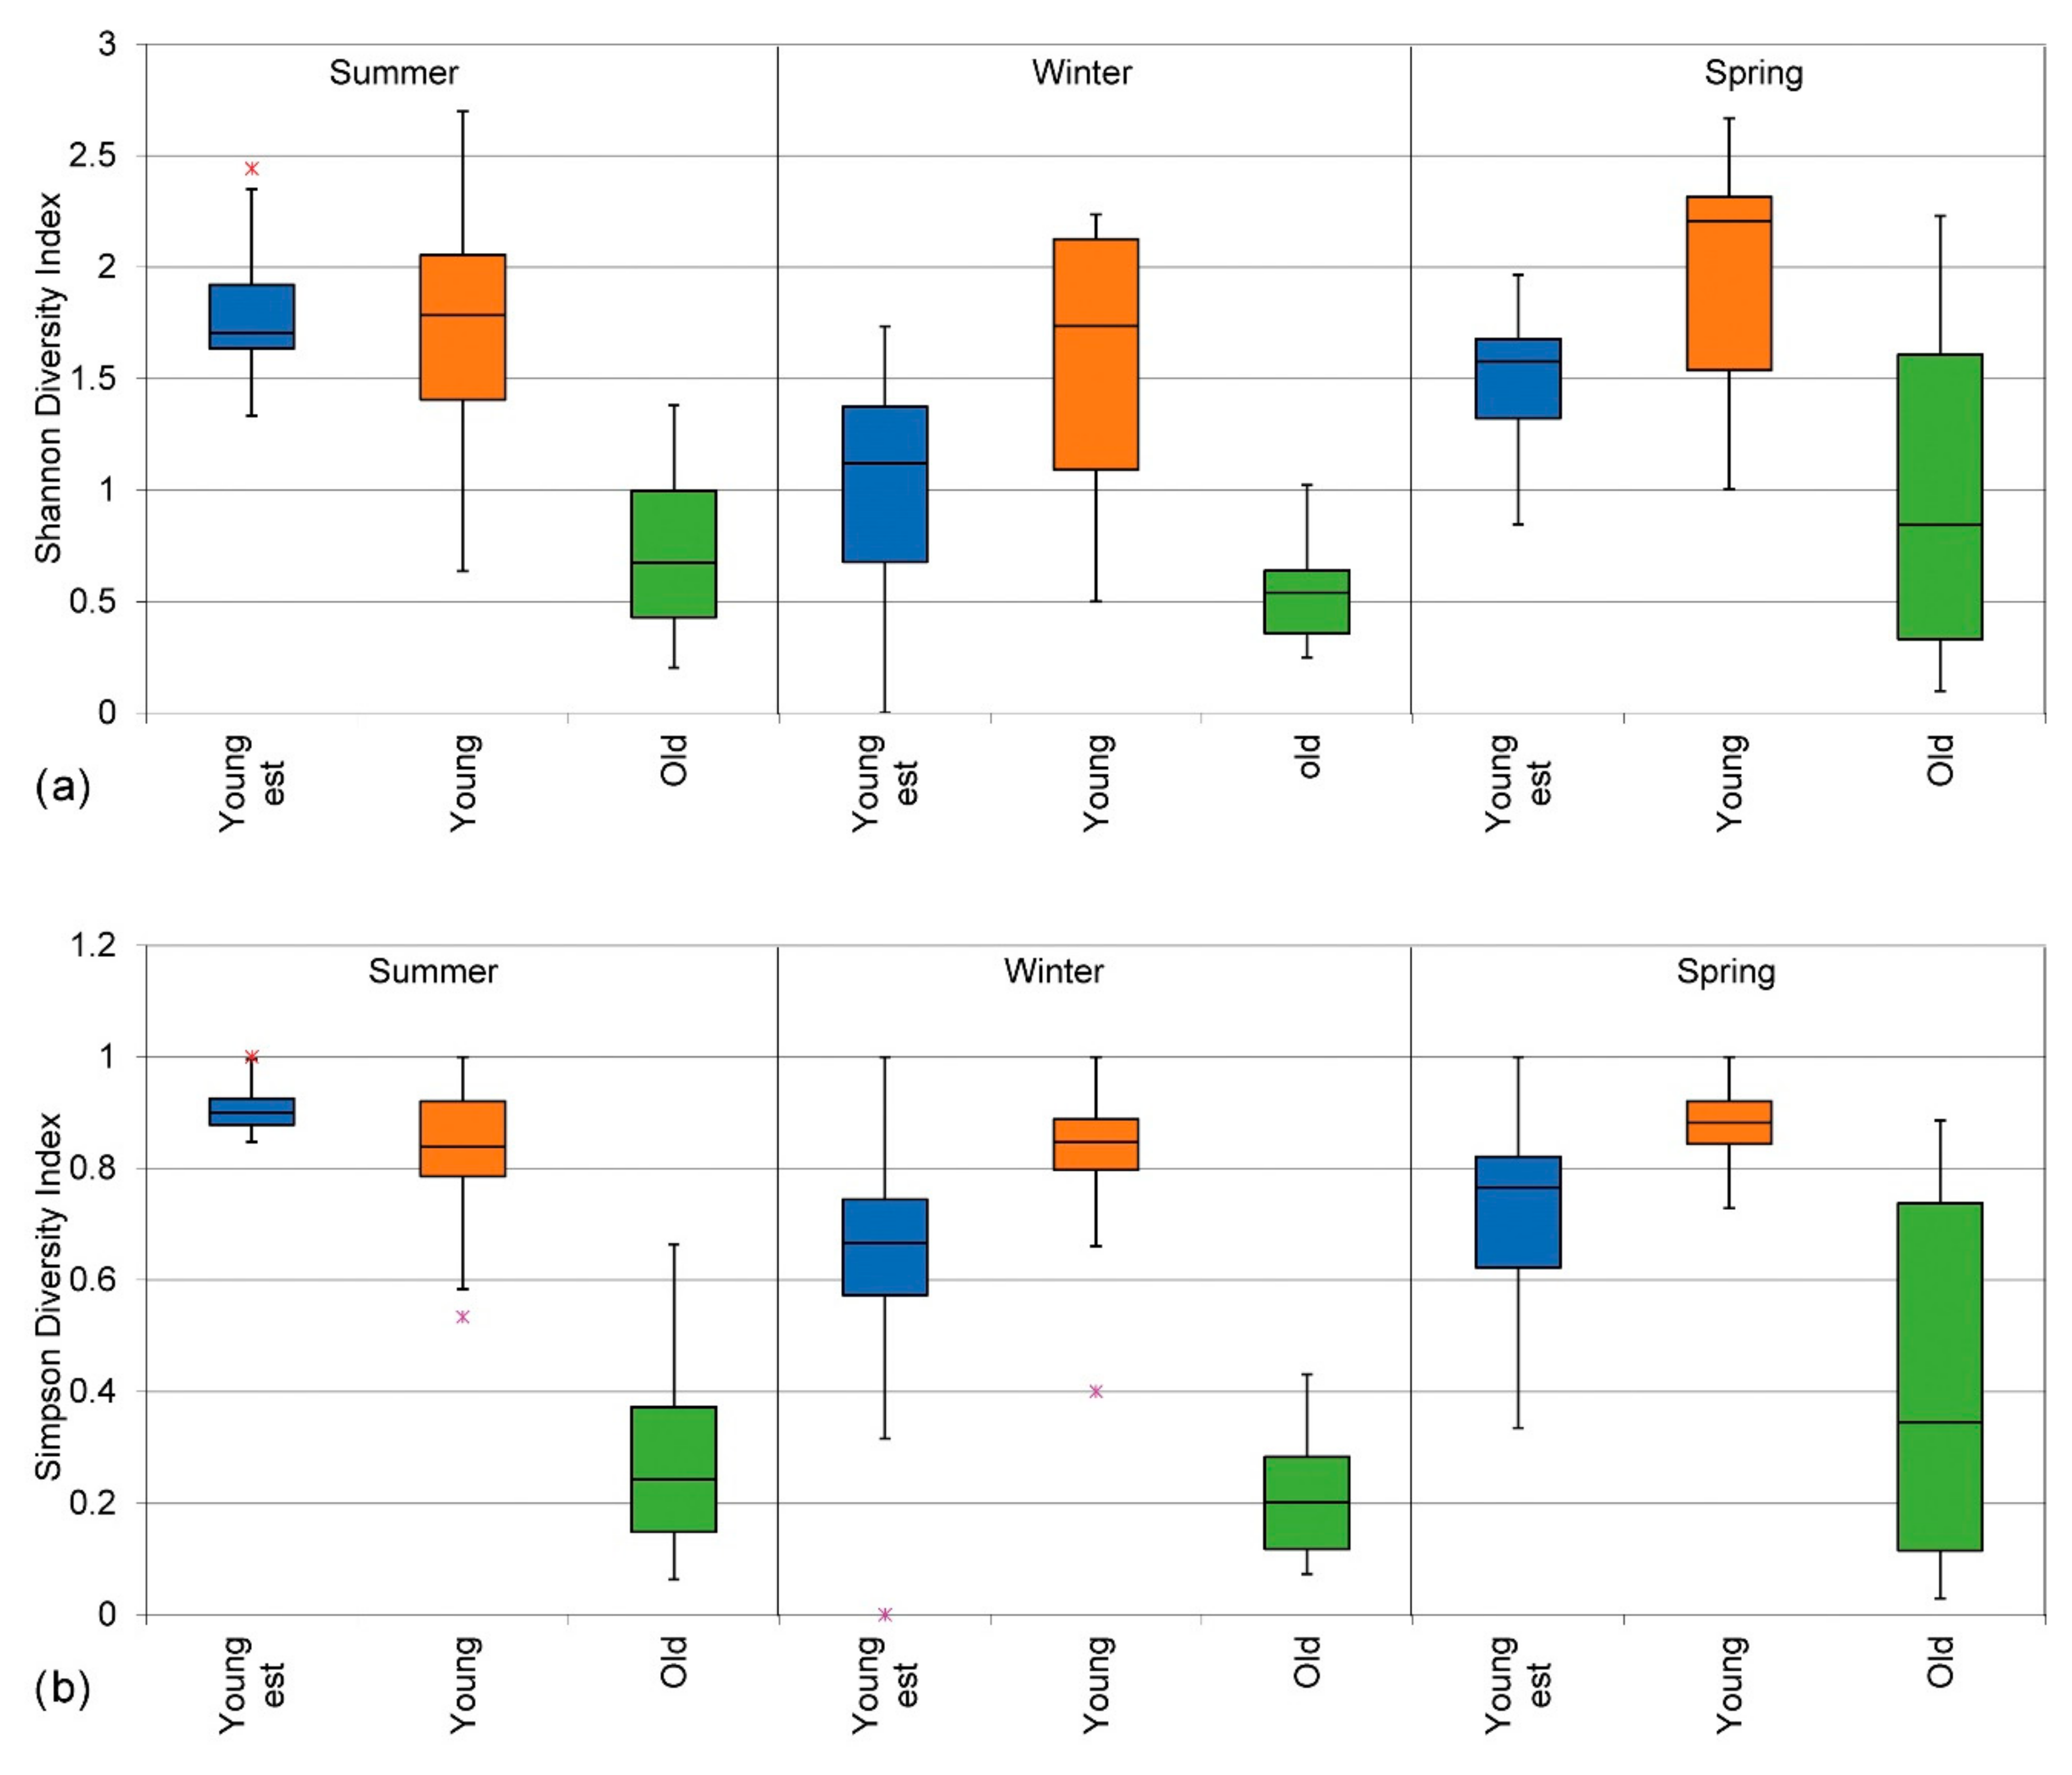
3.2.3. Shannon Diversity Index (H)

There was an overall effect on insect diversity, as indicated by the Shannon Diversity Index, in summer (H (5, N = 42) = 29.96, p < 0.001), winter (H (5, N = 42) = 30.93, p < 0.001), and spring (H (5, N = 42) = 27.92, p < 0.001) (Figure 5a). The FA native garden demonstrated a significantly greater Shannon Diversity Index across seasons and the monocotyledon reference consistently demonstrated the lowest Shannon Diversity Index across seasons. Where the other gardens were quite constant across seasons, the grassland and Javett controls fluctuated the most, both having a notably lower diversity index in winter. The FA native garden showed a significantly greater diversity index than the monocotyledon reference in summer, spring (p = 0.001), and winter (p < 0.001), and the grassland reference showed a significantly greater diversity index in summer (p = 0.011002) and winter (p = 0.009382).

3.2.4. Simpson Diversity Index (D)

There was an overall effect on insect diversity, as indicated by the Simpson Diversity Index, in summer (H (5, N = 42) = 29.21, p < 0.001), winter (H (5, N = 42) = 26.22, p < 0.001), and spring (H (5, N = 42) = 31.18, p < 0.001) (Figure 5b). The monocotyledon reference maintained a significantly lower Simpson Diversity Index across seasons. The FA and Javett native gardens and their controls maintained a fairly consistent diversity index across seasons. The grassland reference had the second-lowest diversity index in summer and winter, but rose in spring to overtake the Javett native garden. The Javett native garden and its control showed significantly greater diversity indices in summer than the grassland (p = 0.041098; p = 0.016257) and the monocotyledon references (p = 0.001382; p < 0.001). The FA native garden showed a higher diversity index than the grassland (p = 0.010162, winter) and monocotyledon (p = 0.001, winter; p < 0.00, spring) controls and the Javett native garden (p = 0.027561, spring).

3.2.5. Effect of Patch Age

Age had an influence on species richness in summer (H (2, N = 42) = 12.51, p = 0.0019) and winter (H (2, N = 24) = 8.07, p = 0.0177), but not in spring (H (2, N = 42) = 2.22, p = 0.3294) (Figure 6a). The older gardens (monocotyledon and grassland references) had a significantly greater species richness than the youngest gardens (Javett native and its control) in summer (p = 0.001584) and winter (p = 0.006353), but only slightly greater than the young gardens (FA native and its control), and not in spring. The young and youngest gardens showed the greatest richness towards spring and the old gardens in summer.
Garden age impacted on total species abundance in summer (H (2, N = 42) = 28.12, p < 0.001), winter (H (2, N = 24) = 14.57, p = 0.0007), and spring (H (2, N = 42) = 12.22, p = 0.0022) (Figure 6b), but was highly influenced by Formicidae species. The young and youngest gardens obtained a significantly lower abundance than the old gardens (p < 0.001; p < 0.001) in summer and winter. In spring only, the young gardens obtained a significantly lower abundance than the old gardens (p = 0.001776). The youngest gardens had a greater abundance in spring, and the young gardens had a greater abundance in summer compared to the other seasons. The old gardens had their lowest abundance in spring and their highest in winter.
Age impacted on overall insect diversity, as indicated by the Shannon Diversity Index in summer, winter, and spring (H (2, N = 42) = 23.33, p < 0.001; H (2, N = 24) = 11.29, p = 0.0035; H (2, N = 42) = 12.13, p = 0.0023) (Figure 7a). During summer, the old gardens obtained a Shannon Diversity Index that was significantly lower than both the young (p = 0.001) and youngest (p < 0.001) gardens. In winter (p < 0.001) and spring (p = 0.001584), the old gardens illustrated a significantly lower Shannon Diversity Index than the young gardens.
In summer, winter, and spring, age had a significant effect on insect diversity, as shown by the Simpson Diversity Index (H (2, N = 42) = 28.04, p < 0.001; H (2, N = 24) = 13.76, p = 0.001; H (2, N = 42) = 20.57, p < 0.001) (Figure 7b). In summer and winter, the older gardens illustrated a significantly lower Simpson Diversity Index than the young and youngest gardens. In spring, the young gardens attained a significantly greater diversity than the youngest (p = 0.030283) and old (p < 0.001) gardens.

3.3. Plant and Insect Sampling Correlations

This study investigated the correlations that could be drawn between plant species characteristics and observed insect species diversity. The winter correlations are regarded as being more significant than the summer correlations due to the better seasonal overlap of the sampling period. Interpretation is subject to the low number of data points (number of sites). The results of strong and significant correlations will therefore be used as potential patterns in the data.
For the summer period, no variables indicated strong correlations between plant and insect data for the sites. Two plant variables showed strong and significant correlations across seasons, plant functional type and beta diversity (Sørensen coefficient—including all plots) in summer and winter (rs (4) = −0.9710, p = 0.0028, −0.8827, p = 0.0333, Table 3) and with beta diversity (Sørensen coefficient—outlier plots removed) in winter (−0.9710, p = 0.0028). The plant species richness had a strong correlation with the plant family richness across seasons (p = 0.0333).
For the winter period, there was a strong and significant correlation between plant beta diversity (Sørensen coefficient—outlier plots removed) and the average Shannon Diversity Index of insects (p = 0.0167). The plant functional types had a medium-high correlation with the average Shannon Diversity Index (p = 0.0583).
The strong correlations (not statistically significant) that were found between plant variables between some of the different study sites (Table 3) confirm that the plants’ species composition and cover in the interventions, controls, and references were very different, as indicated in the ordinations. Species-rich gardens were also family-rich, while functional-type-rich gardens also had high beta diversity (see Table 2). Native range could not be specifically scrutinized due to the design of the experiment, yet native cover shows a relationship with beta diversity.
The findings suggest that the high beta diversity (species turnover) between the quadrats of some of the gardens indicates a heterogeneity in habitats that will influence a greater number of insect taxa to be present, and the individuals in the community are distributed more equally among these species.

4. Discussion

The combined findings indicate that the Future Africa native garden (intervention site) had the highest plant species richness and beta diversity, along with the highest plant family and functional type richness (Table 2). This garden showed the greatest consistency in drawing insect diversity throughout the three seasons. It had the highest insect richness throughout, along with a high evenness according to both the Shannon and Simpson diversity indices. The grassland reference, with a high native plant species richness, had high dominance in grass species in both abundance and cover, lower plant functional type richness, and lower beta diversity (being more homogenous). The grassland reference still had a general high insect richness and a higher comparative abundance, yet it demonstrated less evenness in richness for both diversity indices. These findings suggest that purposefully engineered native grassland gardens could enhance urban insect diversity.
The exciting prospect for landscape designers is that some of the aspects that drew insects to the Future Africa native garden, such as varied functional plant types, might also appeal to people in general. Dwarf shrubs, bulbs, and forbs, for example, form conspicuous flowers that are aesthetically pleasing (see Figure 8). Potentially more challenging aesthetic aspects of grassland plants are that some species, such as geophytes, disappear underground in winter, while many grass species become dry and brown in color, and need to be cut short in early spring (see Figure 8, right).
To respond to the overall question posed in the title and the introduction of this paper, the authors propose guidelines in each subsection that follows, for grassland plant selection that enhances urban insect biodiversity conservation. Since the results only account for one year of monitoring, we specifically discuss them in this regard, resolving ambiguities in the light of supporting evidence from other studies.

4.1. Plant Beta Diversity (Species Turnover)

Guideline 1: Select a diverse composition (>40) of native plant species.
Guideline 2: Group plant species in very different combinations, in clusters throughout the garden area.
A definite correlation that could be drawn was that higher beta plant diversity attracted a greater number of insect species and produced a more equitable distribution among the insect species present (Table 3). However, this correlation was high when the outlier plant plots were removed from the beta diversity calculation. The same outlier plot data could not be identified and removed from the insect data. Regardless, this relationship suggests that plant species composition and diversity need to be consistent, not merely anecdotal occurrences, to affect insect richness equitably across taxa.
These findings correspond with recommendations by Kessler et al. [68], who advocate for the measurement of species richness and beta diversity in different landscape elements (as well as between landscape elements) to advance our understanding of the role of beta diversity in shaping overall diversity patterns. The importance of plant beta diversity for dung beetle alpha diversity (measures of species richness) was confirmed by the local findings of Pryke et al. [24] in pine plantations with remnant native grassland and forest fragments. High grassland beta diversity was associated with high insect alpha diversity (although larger between-element patterns were also found). Although these inquiries were at a larger scale, the findings illustrate the importance of high heterogeneity measured through beta diversity for biodiversity conservation. The findings of this research suggest that the selected grassland species, quantities, and groupings (creating heterogeneity) inside the Future Africa native garden were favorable on a small scale and in the short term for insect urban conservation, exceeding those of remnant native vegetation patches.

4.2. Plant Species Composition and Functional Types

Guideline 3: Select plants from many different families.
Guideline 4: Select plants with a highly diverse (>4) functional structure (geophytes, forbs, graminoids, succulents, and dwarf or woody shrubs).
Guideline 5: Avoid large areas (>25%) dominated by a single plant species or family across seasons.
The Future Africa native garden attained a higher insect taxa richness and abundance than its control garden throughout the year, and the Javett native garden surpassed its control in winter and spring. These findings, corroborated by those of Botha et al. [22], suggest that the greater diversity of native plants, families, and functional types is more desirable for larger quantities and varieties of insects, and that the introduction of specific plant species and their composition may be more valuable than large gardens with less-preferred plants. Moolman et al. [69] found that a large proportion of insects may be host-specific and therefore likely vegetation-specific because of these relationships. European studies have shown that the composition of local plant species is the most effective predictor of insect assemblage composition, even more so than vegetation structure and environmental conditions [21]. Symstad et al. [23] found that insect groups were associated with particular plant assemblages in grasslands, with certain insect orders responding positively to the increase in specif69 plant functional groups.
Although the grassland reference attracted a higher insect abundance than the Future Africa native garden, and a high insect richness in general, it fared much poorer in the Shannon and Simpson diversity indices. A possible reason for this is that the grassland reference area contains a significantly lower number of functional plant types than the Future Africa native garden. The grassland reference had a very high dominance of grass species from the Poaceae family (78% across seasons) and a single grass species dominance of 50%, which is typical in natural grasslands [58]. Comparatively, the Future Africa native garden had a 19% coverage of grass species, with a high dominance of Asteraceae plants and other flowering forb families. Several studies confirm the importance of vegetation heterogeneity (structure and composition) for insect diversity [5,16]. Notably, the Javett control garden (succulent garden) also has very few functional types and a single species dominance of at least 37% across seasons (Table 2). This seems to explain the lower presence of insects in terms of richness in the Javett control garden.

4.3. Garden Microclimate and Age

Guideline 6: Create small-scale, ecologically distinct landscape features (rocks, dead wood, ponds, and drier and wetter areas) and varied topography in the garden.
Guideline 7: Even a garden of only a few months old that adheres to guidelines 1 to 6 could attract a great diversity of insects.
In addition to plants in the Future Africa native garden, the landscape heterogeneity and variance in microclimate may have played a supporting role in creating favorable insect habitats. Plants significantly affect microclimates by influencing light intensity, temperature, and humidity [70]. For insects, the most important climatic factors are temperature and water availability [71]. The fact that the grassland reference was never irrigated, and the native gardens were not irrigated in winter, could have influenced the insect species sampled to some extent [72]. For maximizing the numerical and taxonomic diversity of insects, Clark and Samways [16] recommend small-scale, ecologically distinct landscape features (ecotopes) and varied topography. The ecotopes and topographical variances apply to the Future Africa and Javett native gardens, but not to the control and reference areas. The native gardens are on a slight north-facing and west-facing slope, respectively, and both include clusters of rock.
The Javett native garden is the youngest garden, together with the Javett control garden. The Javett native garden had the second-highest beta diversity of all the sites (once outlier plots were removed from the calculations). Noteworthy is that it fared better than its control in terms of attracting insect richness and abundance in winter and spring. For the Shannon and Simpson diversity indices, it only surpassed its control in winter, but had constantly higher indices compared to the monocotyledon reference, and similar or higher indices than the grassland reference site.
The two older reference sites, the grassland and monocotyledon sites combined, showed greater abundance and richness in insects than the younger and youngest gardens. However, during spring, the greater richness pattern was not maintained. This could be an effect of the rapid establishment period of the younger gardens, with an increase in species structure and the related microclimate climatic adaptations driving the increase in insect richness. In general, arthropod species richness declines in cities due to the invasion and dominance of generalist species [17,18]. However, Sattler et al. [28] found that insect species richness increased with the age of urban settlements. Some ecological succession could occur with urban habitat age to create more niches for different species to inhabit, as well as to allow a higher influx of communities from surrounding areas [73]. The results of this study are therefore interesting with regard to showing the highest taxa richness in young gardens in spring. Since the native gardens and their non-native counterparts are extremely novel, with insect sampling commencing when the youngest gardens were a month old, the effect of patch age will need further monitoring.
The abundance of insects was by far the greatest in the older monocotyledon and grassland reference gardens, consisting mostly of ant species. Ants are regarded as being highly competitive due to their invasion ecology [74] and because they have broad ecological niches [75]. The age of the monocotyledon and grassland reference sites seems to present plausible explanations for the upsurge in ant abundance.

4.4. Garden Size and Connectivity

Guideline 8: Even a small garden (±200 m2) that adheres to guidelines 1 to 6 could attract a great diversity of insects.
Although patch sizes were standardized for sampling, the Future Africa native garden is the largest recently planted patch. Garden size could potentially play a role in insect diversity because the larger the garden, the less disturbed the refugia, with potential for a greater habitat and microclimate effect [30]. The large percentage of surrounding green space at Future Africa, which includes manicured and semi-pristine areas (see Table 1), could further increase the richness of regional insect species, where impervious surfaces would be unfavorable [5,26,28].
However, size and green space proportion do not explain the insect richness and diversity found. Both the grassland reference area and the Future Africa control garden are on the same premises as the Future Africa native garden (only a couple of meters away from each other), denoting similar meso-greenspace proportions (see Table 1). The Future Africa control fared poorer in some seasons in attracting both insect richness and abundance than both these gardens. The ratio of impervious surface to green space, which negatively affects insects [26,28], is less favorable around the Javett native and control gardens (youngest), which are also half the size of the Future Africa native garden (Table 1). This could have contributed to the poorer performance of the youngest gardens in terms of insect richness and abundance. However, habitat size and connectivity do not provide explanations for the insects that were sampled in this study.

5. Conclusions

This paper specifically aimed to verify the value of introducing purposefully designed native grassland gardens in urban green areas to support a greater number of insects. Comparisons between the different sites (each with several sampling plots) in terms of plant species composition, plant beta diversity, and insect diversity indicated clear patterns. Although Spearman correlations between some of the plant and insect data were strong and significant, they only indicate potential patterns due to the small number of sites. These correlation results are, however, corroborated by other studies that propose the significance of high plant beta diversity to maintain insect species richness and evenness in richness. Furthermore, the results confirm that small intervention gardens that are purposefully planned and designed could rapidly transform urban conditions and provide opportunities for improved habitats, even compared to remnant native vegetation patches.
For cities in grassland biomes, we propose guidelines for plant selection for urban insect conservation (for detail, see the Section 4): select native grassland species with a diverse composition; create a high difference in plant species used in clusters between different parts of the garden; select species from numerous families; select several different plant functional types to provide a varied structural strata; avoid individual species and family dominance; and create varied microclimates by manipulating the topography, natural features, and levels of humidity/wetness. If the above guidelines are applied, even small young gardens could make a significant contribution. It is further recommended to consider principles from traditional restoration ecology in conjunction with the guidelines provided here. For example, it is important to acknowledge that the inclusion of invader weeds and exotic plant species in a garden could have a positive influence on plant beta diversity, but might contradict other ecological restoration goals and ambitions.
The authors believe that this study has created a precedent that must be replicated in other cities worldwide as a combined effort to assist landscape designers to enhance urban biodiversity in their local geographical context. The complexity of urban environments and the many factors that could influence the results of this study illustrate the importance of other types of interventions, longer-term monitoring, and the comparison of multiple results to further develop guidelines for more sustainable urban landscapes that enhance biodiversity conservation. In our study, we focused on ground-dwelling insects only, while the importance of insect pollinators justifies studies that include a wider variety of insect sampling techniques.
The ability of native gardens to cope with urban conditions in the long term and their potential to serve as carbon offsets are aspects that need further research. In the experience of the authors, the intervention (native grassland) gardens need less watering and fertilizing than mainstream gardens, but they are not fully self-sustainable. Special care must be taken to keep invader plant species and weeds under control, while parts of the garden are bare towards winter and spring. These qualities might create negative perceptions of native gardens among some people.
Since all gardens need initiative, financing, maintenance, and care, the authors recommend the combination of current ecological studies with social perception studies. The intervention gardens provide local alternatives to mainstream green space practices and can provide several ecosystem services, of which aesthetics is but one. However, aesthetic alternatives are important since they can influence the general acceptance and uptake of native species. The many possible value relations attached to native species could foster human sentiments of belonging and care for nature. These human sentiments are imperative for sustainable and long-term biodiversity conservation.

Supplementary Materials

The following supporting information can be downloaded at: https://www.mdpi.com/article/10.3390/land11081171/s1.

Author Contributions

Conceptualization, C.A.B.; methodology, C.A.B., C.W.W.P., C.L.S. and S.S.C.; software, C.A.B., A.M., C.W.W.P. and M.J.D.T.; validation, C.A.B., A.M. and C.W.W.P.; formal analysis, C.A.B., A.M., C.W.W.P. and M.J.D.T.; investigation, C.A.B. and A.M.; resources, C.A.B., C.W.W.P. and C.L.S.; data curation, C.A.B. and A.M.; writing—original draft preparation, C.A.B. and A.M.; writing—review and editing, C.A.B., A.M., C.W.W.P. and S.S.C.; visualization, C.A.B. and M.J.D.T.; supervision, C.W.W.P., C.L.S. and S.S.C.; project administration, C.A.B., C.W.W.P. and C.L.S.; funding acquisition, C.A.B., C.W.W.P. and C.L.S. All authors have read and agreed to the published version of the manuscript.

Funding

National Research Foundation: Incentive funding; University of Pretoria: University Capacity Development Program; Research Development Program.

Conflicts of Interest

The authors declare no conflict of interest.

References

  1. Cardoso, P.; Barton, P.S.; Birkhofer, K.; Chichorro, F.; Deacon, C.; Fartmann, T.; Fukushima, C.S.; Gaigher, R.; Habel, J.C.; Hallmann, C.A.; et al. Scientists’ warning to humanity on insect extinctions. Biol. Conserv. 2020, 242, 108426. [Google Scholar] [CrossRef]
  2. Müller, N.; Werner, P.; Kelcey, J.G. (Eds.) Urban Biodiversity and Design; Wiley and Blackwell: Oxford, UK, 2010. [Google Scholar]
  3. Ahern, J.; Cilliers, S.S.; Niemelä, J. The concept of ecosystem services in adaptive urban planning and design: A framework for supporting innovation. Landsc. Urban Plan. 2014, 125, 254–259. [Google Scholar] [CrossRef] [Green Version]
  4. McEwan, K.; Ferguson, F.J.; Richardson, M.; Cameron, R. The good things in urban nature: A thematic framework for optimising urban planning for nature connectedness. Landsc. Urban Plan. 2020, 194, 103687. [Google Scholar] [CrossRef]
  5. Samways, M.J.; Barton, P.S.; Birkhofer, K.; Chichorro, F.; Deacon, C.; Fartmann, T.; Fukushima, C.S.; Gaigher, R.; Habel, J.C.; Hallmann, C.A.; et al. Solutions for humanity on how to conserve insects. Biol. Conserv. 2020, 242, 108427. [Google Scholar] [CrossRef]
  6. Lindenmayer, D.B.; Fischer, J. Habitat Fragmentation and Landscape Change: An Ecological and Conservation Synthesis; Island Press: Washington, DC, USA, 2006. [Google Scholar]
  7. Derby Lewis, A.; Bouman, M.J.; Winter, A.M.; Hasle, E.A.; Stotz, D.F.; Johnston, M.K.; Klinger, K.R.; Rosenthal, A.; Czarnecki, C.A. Does nature need cities? Pollinators reveal a role for cities in wildlife conservation. Front. Ecol. Evol. 2019, 7, 1–8. [Google Scholar] [CrossRef] [Green Version]
  8. Shwartz, A.; Turbé, A.; Julliard, R.; Simon, L.; Prévot, A.C. Outstanding challenges for urban conservation research and action. Glob. Environ. Chang. 2014, 28, 39–49. [Google Scholar] [CrossRef]
  9. McDonnell, M.J.; Hahs, A.K. The future of urban biodiversity research: Moving beyond the ‘low-hanging fruit’. Urban Ecosyst. 2013, 16, 397–409. [Google Scholar] [CrossRef]
  10. McGeoch, M.A. The selection, testing and application of terrestrial insects as bioindi-cators. Biol. Rev. Camb. Philos. Soc. 1998, 73, 181–201. [Google Scholar] [CrossRef]
  11. Helden, A.J.; Stamp, G.C.; Leather, S.R. Urban biodiversity: Comparison of insect assemblages on native and non-native trees. Urban Ecosyst. 2012, 15, 611–624. [Google Scholar] [CrossRef]
  12. Weisser, W.W.; Siemann, E. Insects and Ecosystem Function; Springer: Berlin/Heidelberg, Germany, 2007. [Google Scholar]
  13. Aronson, M.F.; Lepczyk, C.A.; Evans, K.L.; Goddard, M.A.; Lerman, S.B.; MacIvor, J.S.; Nilon, C.H.; Vargo, T. Biodiversity in the city: Key challenges for urban green space management. Front. Ecol. Environ. 2017, 15, 189–196. [Google Scholar] [CrossRef] [Green Version]
  14. Felson, A.J.; Bradford, M.A.; Terway, T.M. Promoting earth stewardship through urban design experiments. Front. Ecol. Environ. 2013, 11, 362–367. [Google Scholar] [CrossRef]
  15. Brunbjerg, A.K.; Hale, J.D.; Bates, A.J.; Fowler, R.E.; Rosenfeld, E.J.; Sadler, J.P. Can patterns of urban biodiversity be predicted using simple measures of green infrastructure? Urban For. Urban Green. 2018, 32, 143–153. [Google Scholar] [CrossRef] [Green Version]
  16. Clark, T.E.; Samways, M.J. Sampling arthropod diversity for urban ecological landscaping in a species-rich southern hemisphere botanic garden. J. Insect Conserv. 1997, 1, 221–234. [Google Scholar] [CrossRef]
  17. Faeth, S.H.; Bang, C.; Saari, S. Urban biodiversity: Patterns and mechanisms. Ann. N. Y. Acad. Sci. 2011, 1223, 69–81. [Google Scholar] [CrossRef] [PubMed] [Green Version]
  18. McKinney, M.L.; Lockwood, J.L. Biotic homogenization: A few winners replacing many losers in the next mass extinction. Trends Ecol. Evol. 1999, 14, 450–453. [Google Scholar] [CrossRef]
  19. Standish, R.J.; Hobbs, R.J.; Miller, J.R. Improving city life: Options for ecological restoration in urban landscapes and how these might influence interactions between people and nature. Landsc. Ecol. 2013, 28, 1213–1221. [Google Scholar] [CrossRef] [Green Version]
  20. Millennium Ecosystem Assessment (MEA). Ecosystems and Human Wellbeing, Synthesis; Island Press: Washington, DC, USA, 2005.
  21. Knuff, A.K.; Staab, M.; Frey, J.; Helbach, J.; Klein, A.-M. Plant composition, not richness, drives occurrence of specialist herbivores. Ecol. Entomol. 2019, 44, 833–843. [Google Scholar] [CrossRef]
  22. Botha, M.; Siebert, S.J.; Van Den Berg, J. Do arthropod assemblages fit the grassland and savanna biomes of South Africa? S. Afr. J. Sci. 2016, 112, 9–10. [Google Scholar] [CrossRef] [Green Version]
  23. Symstad, A.J.; Siemann, E.; Haarstad, J. An experimental test of the effect of plant functional group diversity on arthropod diversity. Oikos 2000, 89, 243–253. [Google Scholar] [CrossRef] [Green Version]
  24. Pryke, J.S.; Roets, F.; Samways, M.J. Importance of habitat heterogeneity in remnant patches for conserving dung beetles. Biodivers. Conserv. 2013, 22, 2857–2873. [Google Scholar] [CrossRef]
  25. Collinge, S.K. Effects of grassland fragmentation on insect species loss, colonization, and movement patterns. Ecology 2000, 81, 2211–2226. [Google Scholar] [CrossRef]
  26. Beninde, J.; Veith, M.; Hochkirch, A. Biodiversity in cities needs space: A meta-analysis of factors determining intra-urban biodiversity variation. Ecol. Lett. 2015, 18, 581–592. [Google Scholar] [CrossRef] [PubMed]
  27. Norton, B.A.; Evans, K.L.; Warren, P.H. Urban biodiversity and landscape ecology: Patterns, processes and planning. Curr. Landsc. Ecol. Rep. 2016, 1, 178–192. [Google Scholar] [CrossRef] [Green Version]
  28. Sattler, T.; Duelli, P.; Obrist, M.K.; Arlettaz, R.; Moretti, M. Response of arthropod species richness and functional groups to urban habitat structure and management. Landsc. Ecol. 2010, 25, 941–954. [Google Scholar] [CrossRef] [Green Version]
  29. Goddard, M.A.; Dougill, A.J.; Benton, T.G. Scaling up from gardens: Biodiversity conservation in urban environments. Trends Ecol. Evol. 2010, 25, 90–98. [Google Scholar] [CrossRef]
  30. Jaganmohan, M.; Vailshery, L.S.; Nagendra, H. Patterns of insect abundance and distribution in urban domestic gardens in Bangalore, India. Diversity 2013, 5, 767–778. [Google Scholar] [CrossRef]
  31. Salisbury, A.; Armitage, J.; Bostock, H.; Perry, J.; Tatchell, M.; Thompson, K. Enhancing gardens as habitats for flower-visiting aerial insects (pollinators): Should we plant native or exotic species? J. Appl. Ecol. 2015, 52, 1156–1164. [Google Scholar] [CrossRef]
  32. Conway, T.M.; Almas, A.D.; Coore, D. Ecosystem services, ecological integrity, and native species planting: How to balance these ideas in urban forest management? Urban For. Urban Green. 2019, 41, 1–5. [Google Scholar] [CrossRef]
  33. McHarg, I.L. Design with Nature; Wiley: New York, NY, USA, 1969. [Google Scholar]
  34. Kendle, A.D.; Rose, J.E. The aliens have landed! What are the justifications for ‘native only’ policies in landscape plantings? Landsc. Urban Plan. 2000, 47, 19–31. [Google Scholar] [CrossRef]
  35. Özgüner, H.; Kendle, A.D.; Bisgrove, R.J. Attitudes of landscape professionals towards naturalistic versus formal urban landscapes in the UK. Landsc. Urban Plan. 2007, 81, 34–45. [Google Scholar] [CrossRef]
  36. Zeunert, J. Challenging assumptions in urban restoration ecology. Landsc. J. 2013, 32, 231–242. [Google Scholar] [CrossRef]
  37. Lennon, M. Moral-material ontologies of nature conservation: Exploring the discord between ecological restoration and novel ecosystems. Environ. Values 2017, 26, 5–29. [Google Scholar] [CrossRef] [Green Version]
  38. Salisbury, A.; Al-Beidh, S.; Armitage, J.; Bird, S.; Bostock, H.; Platoni, A.; Tatchell, M.; Thompson, K.; Perry, J. Enhancing gardens as habitats for plant-associated invertebrates: Should we plant native or exotic species? Biodivers. Conserv. 2017, 26, 2657–2673. [Google Scholar] [CrossRef]
  39. Tallamy, D.W.; Shropshire, K.J. Ranking lepidopteran use of native versus introduced plants. Conserv. Biol. 2009, 23, 941–947. [Google Scholar] [CrossRef]
  40. Hoyle, H.; Hitchmough, J.; Jorgensen, A. Attractive, climate-adapted and sustainable? Public perception of non-native planting in the designed urban landscape. Landsc. Urban Plan. 2017, 164, 49–63. [Google Scholar] [CrossRef]
  41. Threlfall, C.; Kendal, D. The distinct ecological and social roles that wild spaces play in urban ecosystems. Urban For. Urban Green. 2018, 29, 348–356. [Google Scholar] [CrossRef]
  42. Brooks, T.M.; Mittermeier, R.A.; Da Fonseca, G.A.B.; Gerlach, J.; Hoffmann, M.; Lamoreux, J.F.; Mittermeier, C.; Pilgrim, J.D.; Rodrigues, A.S.L. Global biodiversity conservation priorities. Science 2006, 313, 58–61. [Google Scholar] [CrossRef] [Green Version]
  43. Pfab, M.F.; Compaan, P.C.; Whittington-Jones, C.A.; Engelbrecht, I.; Dumalisile, L.; Mills, L.; West, S.D.; Muller, P.; Masterson, G.P.R.; Nevhutalu, L.S.; et al. The Gauteng Conservation Plan: Planning for biodiversity in a rapidly urbanising province. Bothalia Afr. Biodivers. Conserv. 2017, 47, 1–16. [Google Scholar] [CrossRef] [Green Version]
  44. United Nations. World urbanization prospects: The 2018 Revision. United Nations, Department of Economic and Social Affairs, Population Division (UN/DESA/PD). 2018. Available online: https://population.un.org/wup/Download/ (accessed on 10 October 2020).
  45. Pauleit, S.; Lindley, S.; Cilliers, S.; Shackleton, C. Urbanisation and ecosystem services in sub-Saharan Africa: Current status and scenarios. Landsc. Urban Plan. 2018, 180, 247–248. [Google Scholar] [CrossRef]
  46. Breed, C.; Mehrtens, H. Using “live” public sector projects in design teaching to transform urban green infrastructure in South Africa. Land 2022, 11, 45. [Google Scholar] [CrossRef]
  47. Shackleton, C.M.; Gwedla, N. The legacy effects of colonial and apartheid imprints on urban greening in South Africa: Spaces, species and suitability. Front. Ecol. Evol. 2021, 8, 579813. [Google Scholar] [CrossRef]
  48. Shackleton, S.; Chinyimba, A.; Hebinck, P.; Shackleton, C.; Kaoma, H. Multiple benefits and values of trees in urban landscapes in two towns in northern South Africa. Landsc. Urban Plan. 2015, 136, 76–86. [Google Scholar] [CrossRef]
  49. Cilliers, S.; Siebert, S.J.; Du Toit, M.J.; Barthel, S.; Mishra, S.; Cornelius, A.; Davoren, E. Health clinic gardens as nodes of social-ecological innovation to promote garden ecosystem services in sub-Saharan Africa. Landsc. Urban Plan. 2018, 180, 294–307. [Google Scholar] [CrossRef]
  50. Cocks, M.; Alexander, J.; Mogano, L.; Vetter, S. Ways of belonging: Meanings of “nature” among Xhosa-speaking township residents in South Africa. J. Ethnobiol. 2016, 36, 820–841. [Google Scholar] [CrossRef]
  51. Makakavhule, K.; Landman, K. Towards deliberative democracy through democratic governance and design of public spaces in the South African capital city, Tshwane. Urban Des. Int. 2020, 25, 280–292. [Google Scholar] [CrossRef]
  52. Breed, C.A. Value negotiation and professional self-regulation—environmental concern in the design of the built environment. Urban For. Urban Green. 2022, 74, 127626. [Google Scholar] [CrossRef]
  53. Norton, B.A.; Thomson, L.J.; Williams, N.S.G.; McDonnell, M.J. The effect of urban ground covers on arthropods: An experiment. Urban Ecosyst. 2014, 17, 77–99. [Google Scholar] [CrossRef]
  54. Threlfall, C.G.; Mata, L.; Mackie, J.A.; Hahs, A.K.; Stork, N.E.; Williams, N.S.G.; Livesley, S.J. Increasing biodiversity in urban green spaces through simple vegetation interventions. J. Appl. Ecol. 2017, 54, 1874–1883. [Google Scholar] [CrossRef] [Green Version]
  55. Van Schalkwyk, J.; Pryke, J.S.; Samways, M.J.; Gaigher, R. Congruence between arthropod and plant diversity in a biodiversity hotspot largely driven by underlying abiotic factors. Ecol. Appl. 2019, 29, e01883. [Google Scholar] [CrossRef]
  56. Mucina, L.; Hoare, D.B.; Lötter, M.C.; Du Preez, P.J.; Rutherford, M.C.; Scott-Shaw, C.R.; Kose, L. Grassland biome. In The Vegetation of South Africa, Lesotho and Swaziland; Mucina, L., Rutherford, M.C., Eds.; South African National Biodiversity Institute: Pretoria, South Africa, 2006; Volume 19, pp. 348–437. [Google Scholar]
  57. Grobler, C.H.; Bredenkamp, G.J.; Brown, L.R. Primary grassland communities of urban open spaces in Gauteng, South Africa. S. Afr. J. Bot. 2006, 72, 367–377. [Google Scholar] [CrossRef] [Green Version]
  58. Carbutt, C.; Tau, M.; Stephens, A.; Escott, B. The conservation status of temperate grasslands in southern Africa. Grassroots 2011, 1, 17–23. [Google Scholar]
  59. Koricheva, J.; Mulder, C.P.; Schmid, B.; Joshi, J.; Huss-Danell, K. Numerical responses of different trophic groups of invertebrates to manipulations of plant diversity in grasslands. Oecologia 2000, 125, 271–282. [Google Scholar] [CrossRef] [PubMed]
  60. Hunter, M.R. Using ecological theory to guide urban planting design: An adaptation strategy for climate change. Landsc. J. 2011, 30, 2–11. [Google Scholar] [CrossRef]
  61. Díaz, S.; Cabido, M. Vive la difference: Plant functional diversity matters to ecosystem processes. Trends Ecol. Evol. 2001, 16, 646–655. [Google Scholar] [CrossRef]
  62. Clarke, K.R. Non-parametric multivariate analyses of changes in community structure. Austral Ecol. 1993, 18, 117–143. [Google Scholar] [CrossRef]
  63. Vellend, M. Do commonly used indices of β-diversity measure species turnover? J. Veg. Sci. 2001, 12, 545–552. [Google Scholar] [CrossRef]
  64. Buschke, F.; Kemp, M.; Seaman, M.; Louw, S. Intra-annual variation of arthropod-plant interactions and arthropod trophic structure in an endangered grassland in the Free State province, South Africa. Afr. J. Range Forage Sci. 2011, 28, 57–63. [Google Scholar] [CrossRef]
  65. Vrdoljak, S.M.; Samways, M.J. Optimizing colored pan traps to survey flower visiting insects. J. Insect Conserv. 2012, 16, 345–354. [Google Scholar] [CrossRef]
  66. Spellerberg, I.F.; Fedor, P.J. A tribute to Claude Shannon (1916–2001) and a plea for more rigorous use of species richness, species diversity and the ‘Shannon-Wiener’ Index. Glob. Ecol. Biogeogr. 2003, 12, 177–179. [Google Scholar] [CrossRef] [Green Version]
  67. Simpson, E.H. Measurement of diversity. Nature 1949, 163, 688. [Google Scholar] [CrossRef]
  68. Kessler, M.; Abrahamczyk, S.; Bos, M.; Buchori, D.; Putra, D.D.; Gradstein, S.R.; Höhn, P.; Kluge, J.; Orend, F.; Pitopang, R.; et al. Alpha and beta diversity of plants and animals along a tropical land-use gradient. Ecol. Appl. 2009, 19, 2142–2156. [Google Scholar] [CrossRef] [PubMed] [Green Version]
  69. Moolman, J.; Van den Berg, J.; Conlong, D.; Cugala, D.; Siebert, S.; Le Ru, B. Species diversity and distribution of lepidopteran stem borers in South Africa and Mozambique. J. Appl. Entomol. 2013, 137, 641–720. [Google Scholar] [CrossRef]
  70. Davies-Colley, R.J.; Payne, G.; Van Elswijk, M. Microclimate gradients across a forest edge. N. Z. J. Ecol. 2000, 24, 111–121. [Google Scholar]
  71. Willmer, P.G. Microclimate and the environmental physiology of insects. In Advances in Insect Physiology; Berridge, M.J., Treherne, J.E., Wigglesworth, V.B., Eds.; Academic Press: Cambridge, MA, USA, 1982. [Google Scholar]
  72. Cook, W.M.; Faeth, S.H. Irrigation and land-use drive ground arthropod community patterns in an urban desert. Env. Entomol. 2006, 35, 1532–1540. [Google Scholar] [CrossRef]
  73. Niemelä, J. Is there a need for a theory of urban ecology? Urban Ecosyst. 1999, 3, 57–65. [Google Scholar] [CrossRef]
  74. Rabitsch, W. The hitchhiker’s guide to alien ant invasions. BioControl 2011, 56, 551–572. [Google Scholar] [CrossRef]
  75. Sugihara, G.; Bersier, L.-F.; Southwood, T.R.E.; Primm, S.L.; May, R.M. Predicted correspondence between species abundances and dendrograms of niche similarities. Proc. Natl. Acad. Sci. USA 2003, 100, 5246–5251. [Google Scholar] [CrossRef] [Green Version]
Figure 1. Location of the intervention, control, and reference areas of the study within Pretoria, City of Tshwane. Source: Google Earth 2020.
Land 11 01171 g001
Figure 2. (a) The differences in yearly plant species richness, (b) plant family richness, and (c) plant functional type richness between sites, measured and compared by quadrat. The bars represent the median, interquartile range (box), and minimum and maximum (whiskers) of the total. Asterisks indicate maximum outliers.
Land 11 01171 g002
Figure 3. Non-metric multidimensional scaling of plots for the six gardens across quadrats indicating (a) all quadrats with summer plant cover, illustrating extreme outliers, (b) quadrats (outliers removed) with summer plant cover, and (c) quadrats (outliers removed) with winter plant cover.
Land 11 01171 g003
Figure 4. The total insect species richness for each garden (a), and the insect species abundance for each garden (b) across seasons. The median, interquartile range (box), and minimum and maximum (whiskers) of the total. * indicate maximum outliers.
Land 11 01171 g004
Figure 5. The Shannon Diversity Index for the insect species in each garden (a), and the Simpson Diversity Index for the insect species found in each garden (b) across seasons. * indicate maximum outliers.
Land 11 01171 g005
Figure 6. The insect species richness in relation to age (a), and the insect species abundance in relation to age (b) across seasons. * indicate maximum outliers.
Land 11 01171 g006
Figure 7. The Shannon Diversity Index (a), and the Simpson Diversity Index (b) in relation to the age of the gardens across seasons. * indicate maximum outliers.
Land 11 01171 g007
Figure 8. (ac) The Javett native garden and (df) the Future Africa native garden in spring (left), summer (middle), and winter (right).
Land 11 01171 g008
Table 1. Sampling areas included in the study with contextual parameters that influence patch conditions.
Plot NameSize
(m2)
Perimeter
(m)
Project StartInterventionSurroundings
Moot Plain Grassland
(old and native)
(reference area)
±100 m2 sample area
(part of a 5 ha grassland area)
Not applicable for sample area
(buffer area 1100 m perimeter)
Land purchased by the University of Pretoria in 1938“Moot Plains Grassland”
Little past disturbance—possibly grazing. More than 100 different species previously recorded. Recent rapid survey recorded 53 species.
Hillcrest Campus: 290 ha, of which 255 ha (92%) is green/pervious.
Large motorway 500 m to the north and wetland area 1 km to the west.
Monocotyledon Garden
(old and non-native)
(reference area)
±100 m2
(part of 0.25 ha green patch)
Not applicable for sample area
(greater patch 203 m perimeter)
Established as a didactic garden in the late 1980sGarden section with 14 mostly monocotyledon species. Hatfield Campus: 570 ha, of which 188 ha (32%) is green/pervious.
Larger garden patch includes lawn.
Future Africa Native Garden
(young and native)(intervention)
198 m260 mOctober 2018Garden section with more than 70 different native species planted.Hillcrest Campus: 290 ha, of which 255 ha (92%) is green/pervious.
Natural rocky outcrop area 500 m to the south.
Future Africa Non-native Garden
(young and non-native)
(control areas)
147 m2 +
37 m2
49 m + 30 mOctober 2018Two garden sections with 12 species.Same as above.
Javett Native Garden
(young and native)
(intervention)
73 m255 mFebruary 2019Garden section with more than 40 different species planted. Hatfield Campus: 570 ha, of which 188 ha (32%) is green/pervious.
Large motorway 3 m to the north, a dominance of impervious surfaces.
Javett Non-native Garden
(young and non-native)
(control area)
75 m240 mFebruary 2019Garden sections with 20 succulent species planted.Hatfield Campus: 570 ha, of which 188 ha (32%) is green/pervious.
A dominance of impervious surfaces, road and trees nearby.
Table 2. The mean values of plant variables listed for each site in summer and winter.
Grassland Reference (May)Grassland Reference (July)Monocotyledon Reference (May)Monocotyledon Reference (July)Future Africa Native Garden (May)Future Africa Native Garden (July)Future Africa Control (May)Future Africa Control (July)Javett Native Garden (May)Javett Native Garden (July)Javett Control (May)Javett Control (July)
1. 
Number of families
111288181866101077
2. 
Dominant families (mean percentage coverage)
Poaceae 79%
Asteraceae 9%
Poaceae 78%Strelitziaceae 33%
Iridaceae 15%
Agapanthaceae 11%
Strelitziaceae 25%
Iridaceae 10%
Asteraceae 23%
Poaceae 19%
Hypoxidaceae 12%
Poaceae 19%
Asteracea 11%
Asphodelaceae 31%
Poaceae 21%
Hypoxidaceae 13%
Asphodelaceae 29%
Poaceae 19%
Lamiaceae 12%
Asphodelaceae 19%
Acanthaceae 15%
Poaceae 13%
Asphodelaceae 19%
Acanthaceae 16%
Poaceae 16%
Aizoaceae 41%
Asphodelaceae 20%
Alliaceae 13%
Aizoaceae 40%
Asphodelaceae 20%
Alliaceae 11%
3. 
Number of species
25279932328819191414
4. 
Beta diversity (mean dissimilarity between quadrats) ª
−0.60−0.32−0.72
(−0.17) ʸ
−0.73
(−0.20) ʸ
−0.87−0.85−0.81
(−0.43) ʸ
−0.87
(−0.60) ʸ
−0.76−0.76−0.27−0.15
5. 
Dominant species (mean percentage coverage > 8%)
Themeda triandra 51%
Eragrostis chloromelas 19%
Themeda triandra 50%
Eragrostis chloromelas 19%
Strelitzia juncea 17%
Strelitzia reginae 17%
Aristea ecklonii 15%
Strelitzia juncea 13%
Strelitzia reginae 13%
Aristea ecklonii 10%
Haplocarpha lyrata 19%
Melinis nerviglumis 18%
Stachys natalensis var. natalensis 12%
Melinis nerviglumis 19%
Haplocarpha lyrata 9%
Melinis nerviglumis 21%
Aloiampelos tenuior 14%
Hypoxis hemerocallidea 13%
Melinis nerviglumis 19%
Aloe vera 13%
Melissa officinalis 12%
Polygala virgata var. virgata 10%
Dicliptrea eenii 9%
Dyschoriste setigera 9%
Aloe merlothii 9%
Carprobrotus edulis 39%
Nothoscordum gracile 13%
Aloe arborescens (hybrid) 10%
Carprobrotus edulis 37%
Nothoscordum gracile 11%
Aloe arborescens (hybrid) 10%
6. 
Plant cover (%)
100%78%95%56%89%58%89%80%87%71%100%96.5%
7. 
Rock (%)
0%0%0%0%7%7%0%0%11%12%0%0%
8. 
Soil (%)
0%1%5%32%4%30%11%20%2%11%0%3.5%
9. 
Litter (%)
0%21%0%12%0%6%0%0%0%6%0%0%
10. 
Evergreen plant cover (%)
4%0%80%52%39%30%34%32%55%50%100%96.5%
11. 
Deciduous plant cover (%)
96%78%15%4%52%29%55%49%32%25%0%0%
12. 
Total number of plant functional types
444466555522
13. 
Dominant functional type (and species number thereof)
Perennial graminoid (7)Perennial graminoid (8)Perennial forb (6)Perennial forb (6)Perennial forb (6)Perennial graminoid (4)Succulent (3)Succulent (3)Succulent (5)Perennial graminoid (5)Succulent (12)Succulent (12)
14. 
Native species (mean % contribution to overall coverage)
100%78%8%0%87.75%60%43%37%87%71%14%14%
15. 
Indigenous/non-native species (mean % contribution to overall coverage)
0%0%59%40%1.25%1%22%19%0%0%54%51%
16. 
Alien species (mean % contribution to overall coverage)
0%0%18%11%0%0%24%24%0%0%23%21%
ª Sørensen coefficient was used to determine the mean dissimilarity between pairs of plots. ʸ Sørensen coefficient with outlier plot removed.
Table 3. Spearman rho correlations found between plant and insect variables during summer and winter sampling (p values in brackets).
VariablesInsectPlant
AbundanceRichnessOrderAve_
Shannon Index
Ave_
Simpson Index
Ave_Beta Diversity_AllAve_Beta Diversity_RemovedFamily Richness
(ƴ)
Species Richness
(ƴ)
Functional Types
(ƴ)
Summer
Plants summerAve_beta diversity_all0.3143
(0.5639)
−0.0286
(1.0000)
−0.3381
(0.4972)
−0.3143
(0.5639)
0.1429
(0.8028)
-----
Ave_beta diversity_
removed
0.2571
(0.6583)
−0.3143
(0.5639)
−0.1690
(0.7139)
−0.6000
(0.2417)
−0.1429
(0.8028)
0.6000
(0.2417)
----
Family richness(ƴ)0.4857
(0.3556)
0.8286
(0.0583)
−0.1690
(0.7139)
0.2571
(0.6583)
−0.3714
(0.4972)
−0.2571
(0.6583)
−0.7143
(0.1361)
---
Species richness(ƴ)0.3143
(0.5639)
0.7714
(0.1028)
−0.1690
(0.7139)
0.4857
(0.3556)
−0.0857
(0.9194)
−0.1429
(0.8028)
−0.7714
(0.1028)
0.9429 *
(0.0333)
--
Functional types(ƴ)−0.3237
(0.4972)
0.0883
(0.9194)
0.3482
(0.5639)
0.3825
(0.4972)
−0.0883
(0.8028)
−0.9710 *
(0.0028)
−0.7650
(0.1028)
0.4119
(0.4972)
0.324
(0.564)
-
Ave% native cover−0.0286
(1.0000)
0.4286
(0.4194)
−0.3381
(0.4972)
0.2571
(0.6583)
−0.0857
(0.9194)
−0.2571
(0.6583)
−0.8286
(0.0583)
0.7143
(0.1361)
0.771
(0.103)
0.441
(0.419)
Winter
Plants winterAve_beta diversity_all0.0857
(0.9194)
−0.2571
(0.6583)
0.3395
(0.5639)
−0.6571
(0.1750)
−0.7143
(0.1361)
Ave_beta diversity_
removed
−0.0286
(1.000)
−0.4857
(0.3556)
0.1234
(0.9194)
−0.9429 *
(0.0167)
−0.7714
(0.1028)
0.7714
(0.1028)
Family richness(ƴ)0.4286
(0.4194)
0.7714
(0.1028)
0.6172
(0.2417)
0.4857
(0.3556)
0.1429
(0.8028)
0.0286
(1.0000)
−0.5429
(0.2972)
Species richness(ƴ)0.1429
(0.8028)
0.5429
(0.2972)
0.4938
(0.3556)
0.5429
(0.2972)
0.2571
(0.6583)
0.1429
(0.8028)
−0.4857
(0.3556)
0.9429 *
(0.0333)
Functional types(ƴ)0.0000
(1.0000)
0.5002
(0.3556)
−0.1271
(0.8028)
0.8827
(0.0583)
0.7945
(0.1028)
−0.8827 *
(0.0333)
−0.9710 *
(0.0028)
0.4119
(0.4972)
0.3237
(0.5639)
Ave% native cover0.1429
(0.8028)
0.1429
(0.8028)
−0.0309
(0.9194)
0.6000
(0.2417)
0.2571
(0.6583)
−0.0857
(0.9194)
−0.5429
(0.2972)
0.6000
(0.2417)
0.6571
(0.1750)
0.3531
(0.5639)
* Strong correlations (statistically significant but limited due to small data sets).
Publisher’s Note: MDPI stays neutral with regard to jurisdictional claims in published maps and institutional affiliations.

