Article

Assessing Green Roof Contributions to Tree Canopy Ecosystem Services and Connectivity in a Highly Urbanized Area

1
Department of Forest Resources, Graduate School of Kookmin University, 77 Jeongneung-ro, Seongbuk-gu, Seoul 02707, Korea
2
Department of Forest Environment and Systems, College of Science and Technology, Kookmin University, 77 Jeongneung-ro, Seongbuk-gu, Seoul 02707, Korea
*
Author to whom correspondence should be addressed.
Land 2022, 11(8), 1281; https://doi.org/10.3390/land11081281
Submission received: 28 June 2022 / Revised: 31 July 2022 / Accepted: 8 August 2022 / Published: 10 August 2022

Abstract

:
Ecosystem services refer to the benefits provided to humans by the natural environment and healthy ecosystems. Green roofs can be used to enhance ecosystem services, which are reduced by urbanization. Moreover, green roofs can improve biodiversity by connecting green spaces. Therefore, it is necessary to examine the multi-dimensional contributions of green roofs to urban ecosystems. To this end, we used i-Tree Canopy to identify changes in land cover and tree canopy ecosystem services from 2003 to 2021 in Suwon City, Republic of Korea. Next, we simulated improved ecosystem service effects of tree canopies by green roofs. Graph theory was also used to analyze connectivity improvement at local and landscape scales. Tree area was found to decrease from 2003 to 2012, alongside the corresponding ecosystem services, which then showed a tendency to increase from 2012 to 2021. The tree area was expected to increase further in the green roof scenario than in 2003. Green roofs were found to improve tree canopy connectivity at the landscape scale more than the local scale, by acting as stepping stones in connecting fragmented forests and trees. Areas with improved connectivity at both scales should be prioritized for green roof development. These results will aid in the strategic planning of urban green infrastructure and provide support for decision-making processes to improve ecosystem services and connectivity using green roofs.

1. Introduction

The term ecosystem services refers to the direct and indirect benefits that humans receive from their surrounding ecosystems. For example, vegetation benefits humans by air filtering, noise reduction, and rainwater drainage [1]. The conservation and improvement of these services have become an important focus [2,3] of sustainable development goals (SDGs) [4]. This will be especially important in the future, as the urban population is projected to increase by approximately 55% by 2050 (based on 2019 levels) [5]. Accordingly, it will be difficult for undeveloped natural and semi-natural urban areas (sources of urban ecosystem services) to avoid the effects of continuous and excessive urbanization. Urban environmental issues include the heat island phenomenon [6], air pollution [7], noise pollution due to traffic [8], damage from ecosystem disservices (e.g., biodiversity loss) [9], and increase in infectious diseases [10]. These issues may become more serious in the future, so it is therefore imperative to prepare effective strategies that will restore and enhance the functions and services of ecosystems sustainably for urban environments.
To cope with rapid urbanization, cities need to create more green spaces and enhance ecosystem functions and services. However, higher demand for urban spaces and an increasing population make it difficult to secure the required number of spaces for urban forests, parks, and green spaces. Accordingly, green infrastructure strategies that focus on greening small spaces in the city, including green roofs, are attracting attention. Green roofs provide heat island mitigation and energy savings [11], rainfall-runoff reduction [12], and air pollutant reduction [13]. Moreover, they benefit the buildings by providing soundproofing [14] and increasing fire resistance [15]. In an urban environment where it is difficult to create green spaces, a green roof enables multi-dimensional and efficient use of spaces, such as the utilization of idle spaces for rest.
Studies focusing on green roofs are rapidly increasing, particularly studies related to the environmental benefits of green roofs [16]. However, despite the various ecosystem services of green roofs [17], most studies have focused only on single ecosystem services (e.g., [11,12,13]). The ecosystem services of green roofs are affected by a region‘s spatial characteristics (e.g., land uses) [18,19], however, these aspects have not been properly reflected in the evaluations of green roof effects and the appropriateness of their planning. For scientific and rational spatial planning and to support decision-making, it is necessary to analyze the effects of ecosystem services both before and after the implementation of a green roof strategy, along with complex and quantitative evaluations of various ecosystem services in a spatial context.
Biodiversity should be assessed as one of the basic ecosystem services provided by green roofs, as it can aid in the conservation of biological resources [20]. Moreover, it enables the sustainable use of ecosystem services [21]. In particular, urban biodiversity directly benefits the quality of life of urban dwellers by mitigating air pollution, preventing the spread of pests and diseases, and improving their mental health [22]. However, the habitats of various living organisms provided by green spaces are disappearing due to urban development, leading to a rapid decrease in biodiversity [9,23]. Land use changes and land fragmentation have led to low levels of network connectivity between tree canopy areas, and consequently corridors of living organisms have been disconnected, reducing genetic biodiversity and exerting a negative impact on the flow of abiotic elements such as water and wind paths [24,25]. To overcome the limitations of fragmented urban green spaces and to promote biodiversity and ecosystem services, it is necessary to systematize the connectivity between the remaining green and rooftop green spaces in the city, through a green infrastructure network.
Connectivity influences the ecological flux of living organisms and abiotic elements, and the long-term maintenance of biodiversity [26,27]. In addition, since the movement of living organisms and the flux of abiotic elements directly affect the supply of ecosystem services [26,27], connectivity also supports ecosystem services. Although studies directly showing the effects of connectivity on ecosystem services are sparse [28], some have shown positive interactions between ecosystem services and biodiversity (e.g., [29,30]). These studies report that higher levels of landscape connectivity are related to higher levels of biodiversity. Among urban green infrastructure, green roofs in particular can act as habitats or stepping stones to improve local- and landscape-level connectivity between urban green patches [31,32,33]. Consequently, it is necessary to select optimal locations for green roofs at both local and landscape scales, to promote biodiversity and ecosystem services on a multi-spatial scale.
In this study, we focused on Suwon City, a large city with a high population density and urbanization rate in the Republic of Korea. The aims of the study were as follows: (1) to analyze the status and changes in land cover and tree canopy ecosystem services in 2003, 2012, and 2021; (2) to simulate and evaluate the level of improvement of potential ecosystem services in line with green roofs; (3) to identify priority areas for green roofs by evaluating the contributions and importance of the improved probabilities of tree canopy connections as a result of the green roofs. This study analyzes the effects of green roofs and provides a method for sequential site selection to establish more efficient and ecological urban greening plans and support spatial decision-making for green infrastructure.

2. Materials and Methods

2.1. Study Area

The study area for this research was Suwon City in the south-central Gyeonggi Province in the Republic of Korea, one of the large cities in the Seoul metropolitan area (Figure 1). Its total area is 121.3 km2, and the population, as of 2022, is approximately 1.218 million [34]. The Gwanggyo and Baegun mountains are located in the northern outskirts of Suwon City, which is comprised of a mosaic of landscapes, including high hilly areas, fragmented urban forests, parks in the downtown area, and plains in the southern area. The regional landscape characteristics and the high urbanization rate (a population density of approximately 10,000 per km2) of Suwon City indicate that it is a suitable area to analyze urban ecosystem services and tree canopy connectivity.

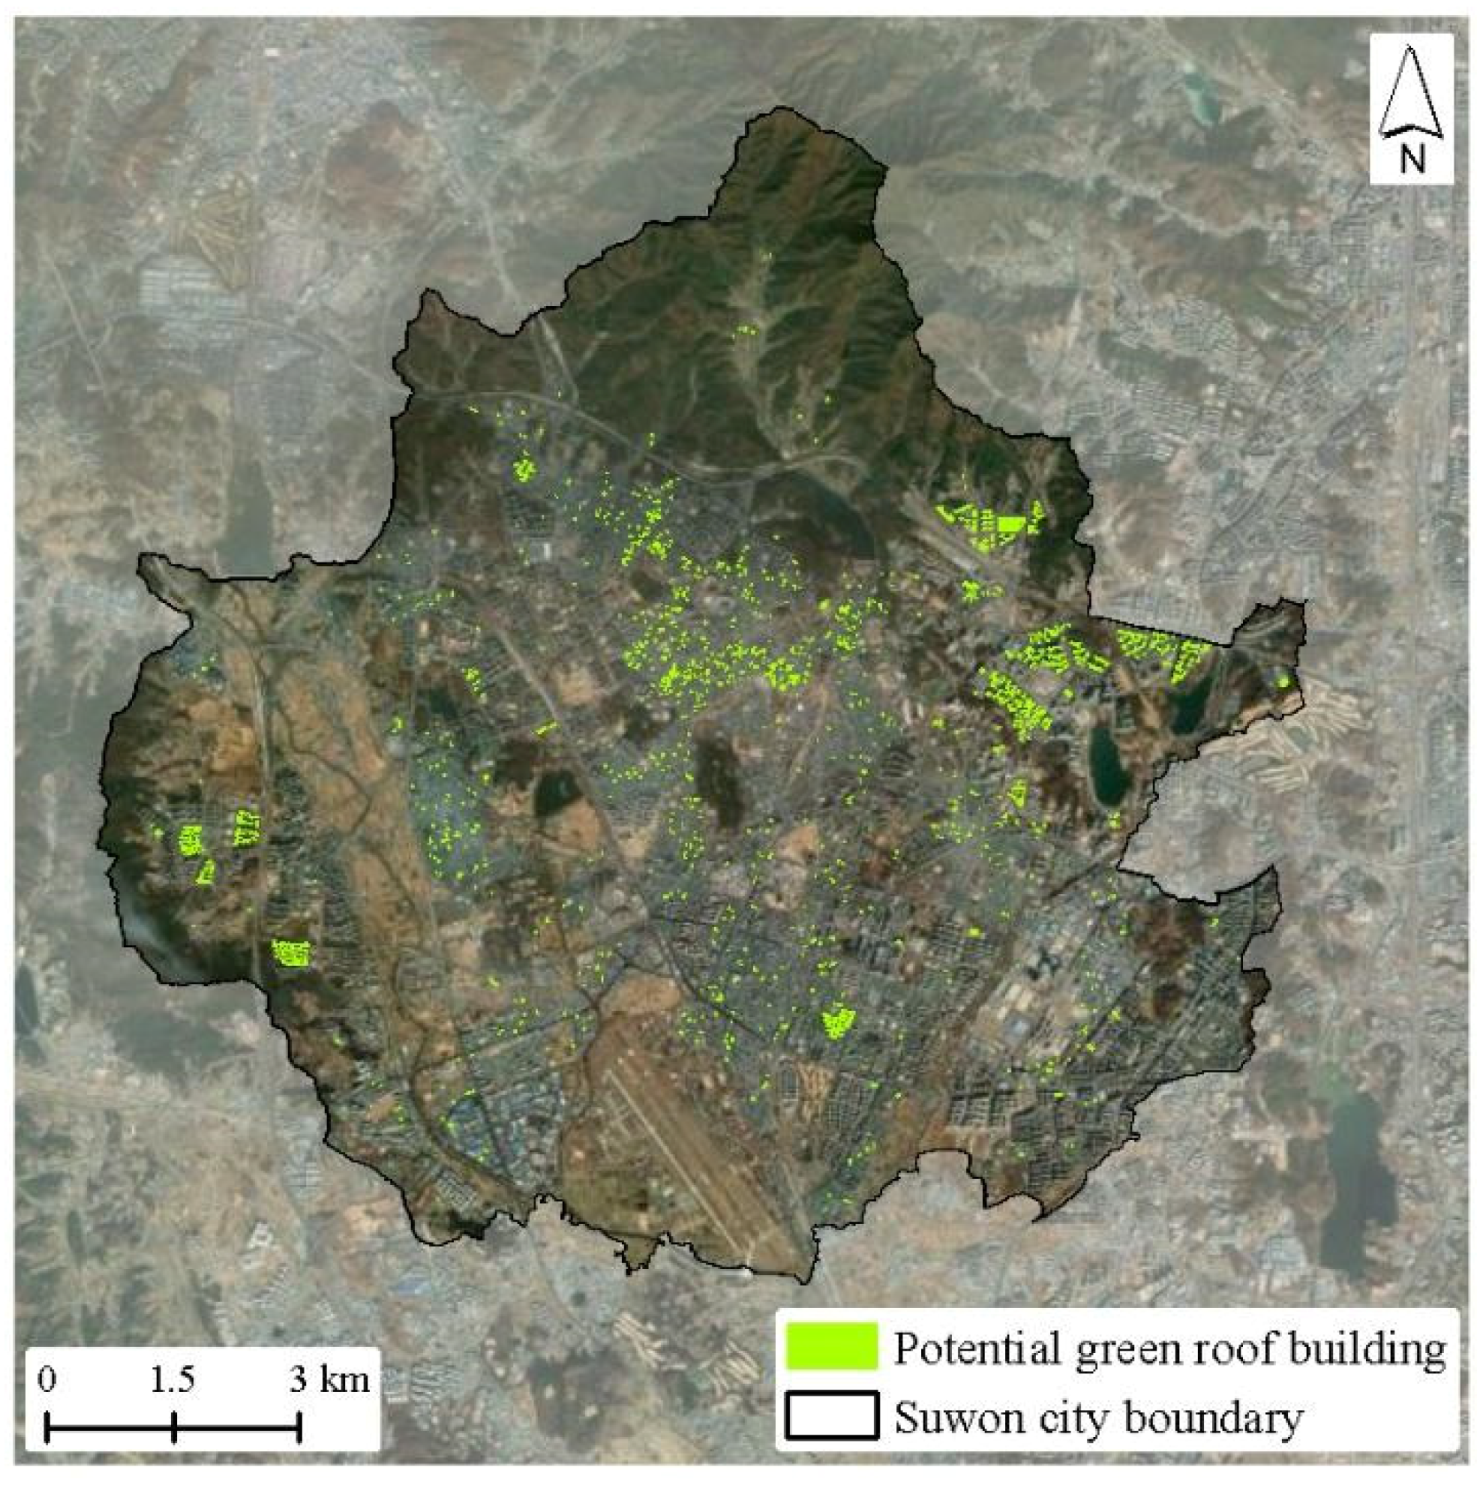
2.2. Potential Green Roof Spaces

Buildings with roofs that could potentially be greened were identified in Suwon City in 2021, which is currently promoting more green spaces in the city center based on legislation proposed by the local government, i.e., ‘Ordinance on Urban Greening, etc. of Suwon City’ (7 January 2021). Accordingly, there are ongoing projects supporting green roof installation for buildings with a roof area ≥60 m2. Using the GIS building information data of the National Spatial Information Portal [37], the spaces capable of having a green roof were chosen by considering: (1) the area standard ordinance of Suwon City; (2) the structural safety of the buildings; and (3) the establishment year of the buildings, i.e., those that were constructed within the last 10 years. The total roof area of the buildings finally selected for this study comprised 0.87 km2 (Figure 2), which accounts for approximately 0.7% of the total area of Suwon City.

2.3. Research Outline and Data Analysis

As shown in Figure 3, we evaluated the contributions of green roof in two main aspects (i.e., tree canopy ecosystem services and connectivity), and consequently provided implications based on the results. First, Google Earth satellite images and i-Tree Canopy were used to examine urbanization-related land cover and ecosystem services changes within the study area. Moreover, the green roof scenario-based ecosystem services were assessed in accordance with changes in overall tree cover changes in the city. Then, we estimated the effect of roof greening on the connectivity, thereby providing recommendations for strategic greening of city roofs as part of green infrastructure.

2.3.1. Assessment of Ecosystem Service Changes

i-Tree Canopy is a web-based model and tool developed to investigate land cover and evaluate the ecosystem services of trees. This tool was employed to analyze the changes in ecosystem services in response to land cover changes and the implementation of green roofs [38]. Moreover, we analyzed historic and present-day land cover data based on Google Earth satellite images. This tool enables the classification of land cover and the evaluation of the trees easily and simply, based on the area calculated in line with the ratio of randomly generated sample points within the boundaries of the target site. We conducted a time-series analysis of the historic (2003, 2012) and present (2021) changes in land cover and ecosystem services, centered on the last 18 years, and then simulated the ecosystem service effects of buildings with the capacity to have a greening roof.
Using i-Tree Canopy and ArcGIS Pro [39], we created 1500 random sample points in the study area and classified the historic and current land covers of each sample point into six categories: tree, road, building, grass and cropland, bare ground, or water. For the classification of historic land cover, historic satellite images from the corresponding time provided by Google Earth Pro were used to confirm the land cover types visually and to assign the corresponding land cover types to the sample points. It is worth noting that inaccurate land cover classification using this method may have been made for several reasons, including image resolution and tree canopy changes due to seasonal changes. To address this problem, we used aerial photo map services from other websites such as Kakao Corp. and NAVER Corp. as reference materials. In addition, to minimize seasonal effects, land cover was classified using summer images from a corresponding time frame. For the 2021 land cover type classifications, the area for buildings that have green roof capabilities was changed into tree areas to create a green roof scenario.
The amount of ecosystem services calculated through the i-Tree Canopy model is proportional to the tree areas. Moreover, the ecosystem services per area are affected by the regional setting in the i-Tree Canopy model. The regional setting is related to climatic factors affecting tree growth, and the setting in the current i-Tree Canopy model is limited to the United States, United Kingdom, and Sweden. Consequently, New York, which corresponds to a Mid-Atlantic climatic region, was selected as the model region, as it is similar to Suwon City in terms of the annual heating and cooling degree days [40]. The ecosystem services calculated in the i-Tree Canopy model include the annual removal of air pollutants (CO, NO2, O3, and SO2) and fine dust (PM2.5 and PM10), storage and sequestration of carbon dioxide (CO2), and rainfall-runoff reduction.

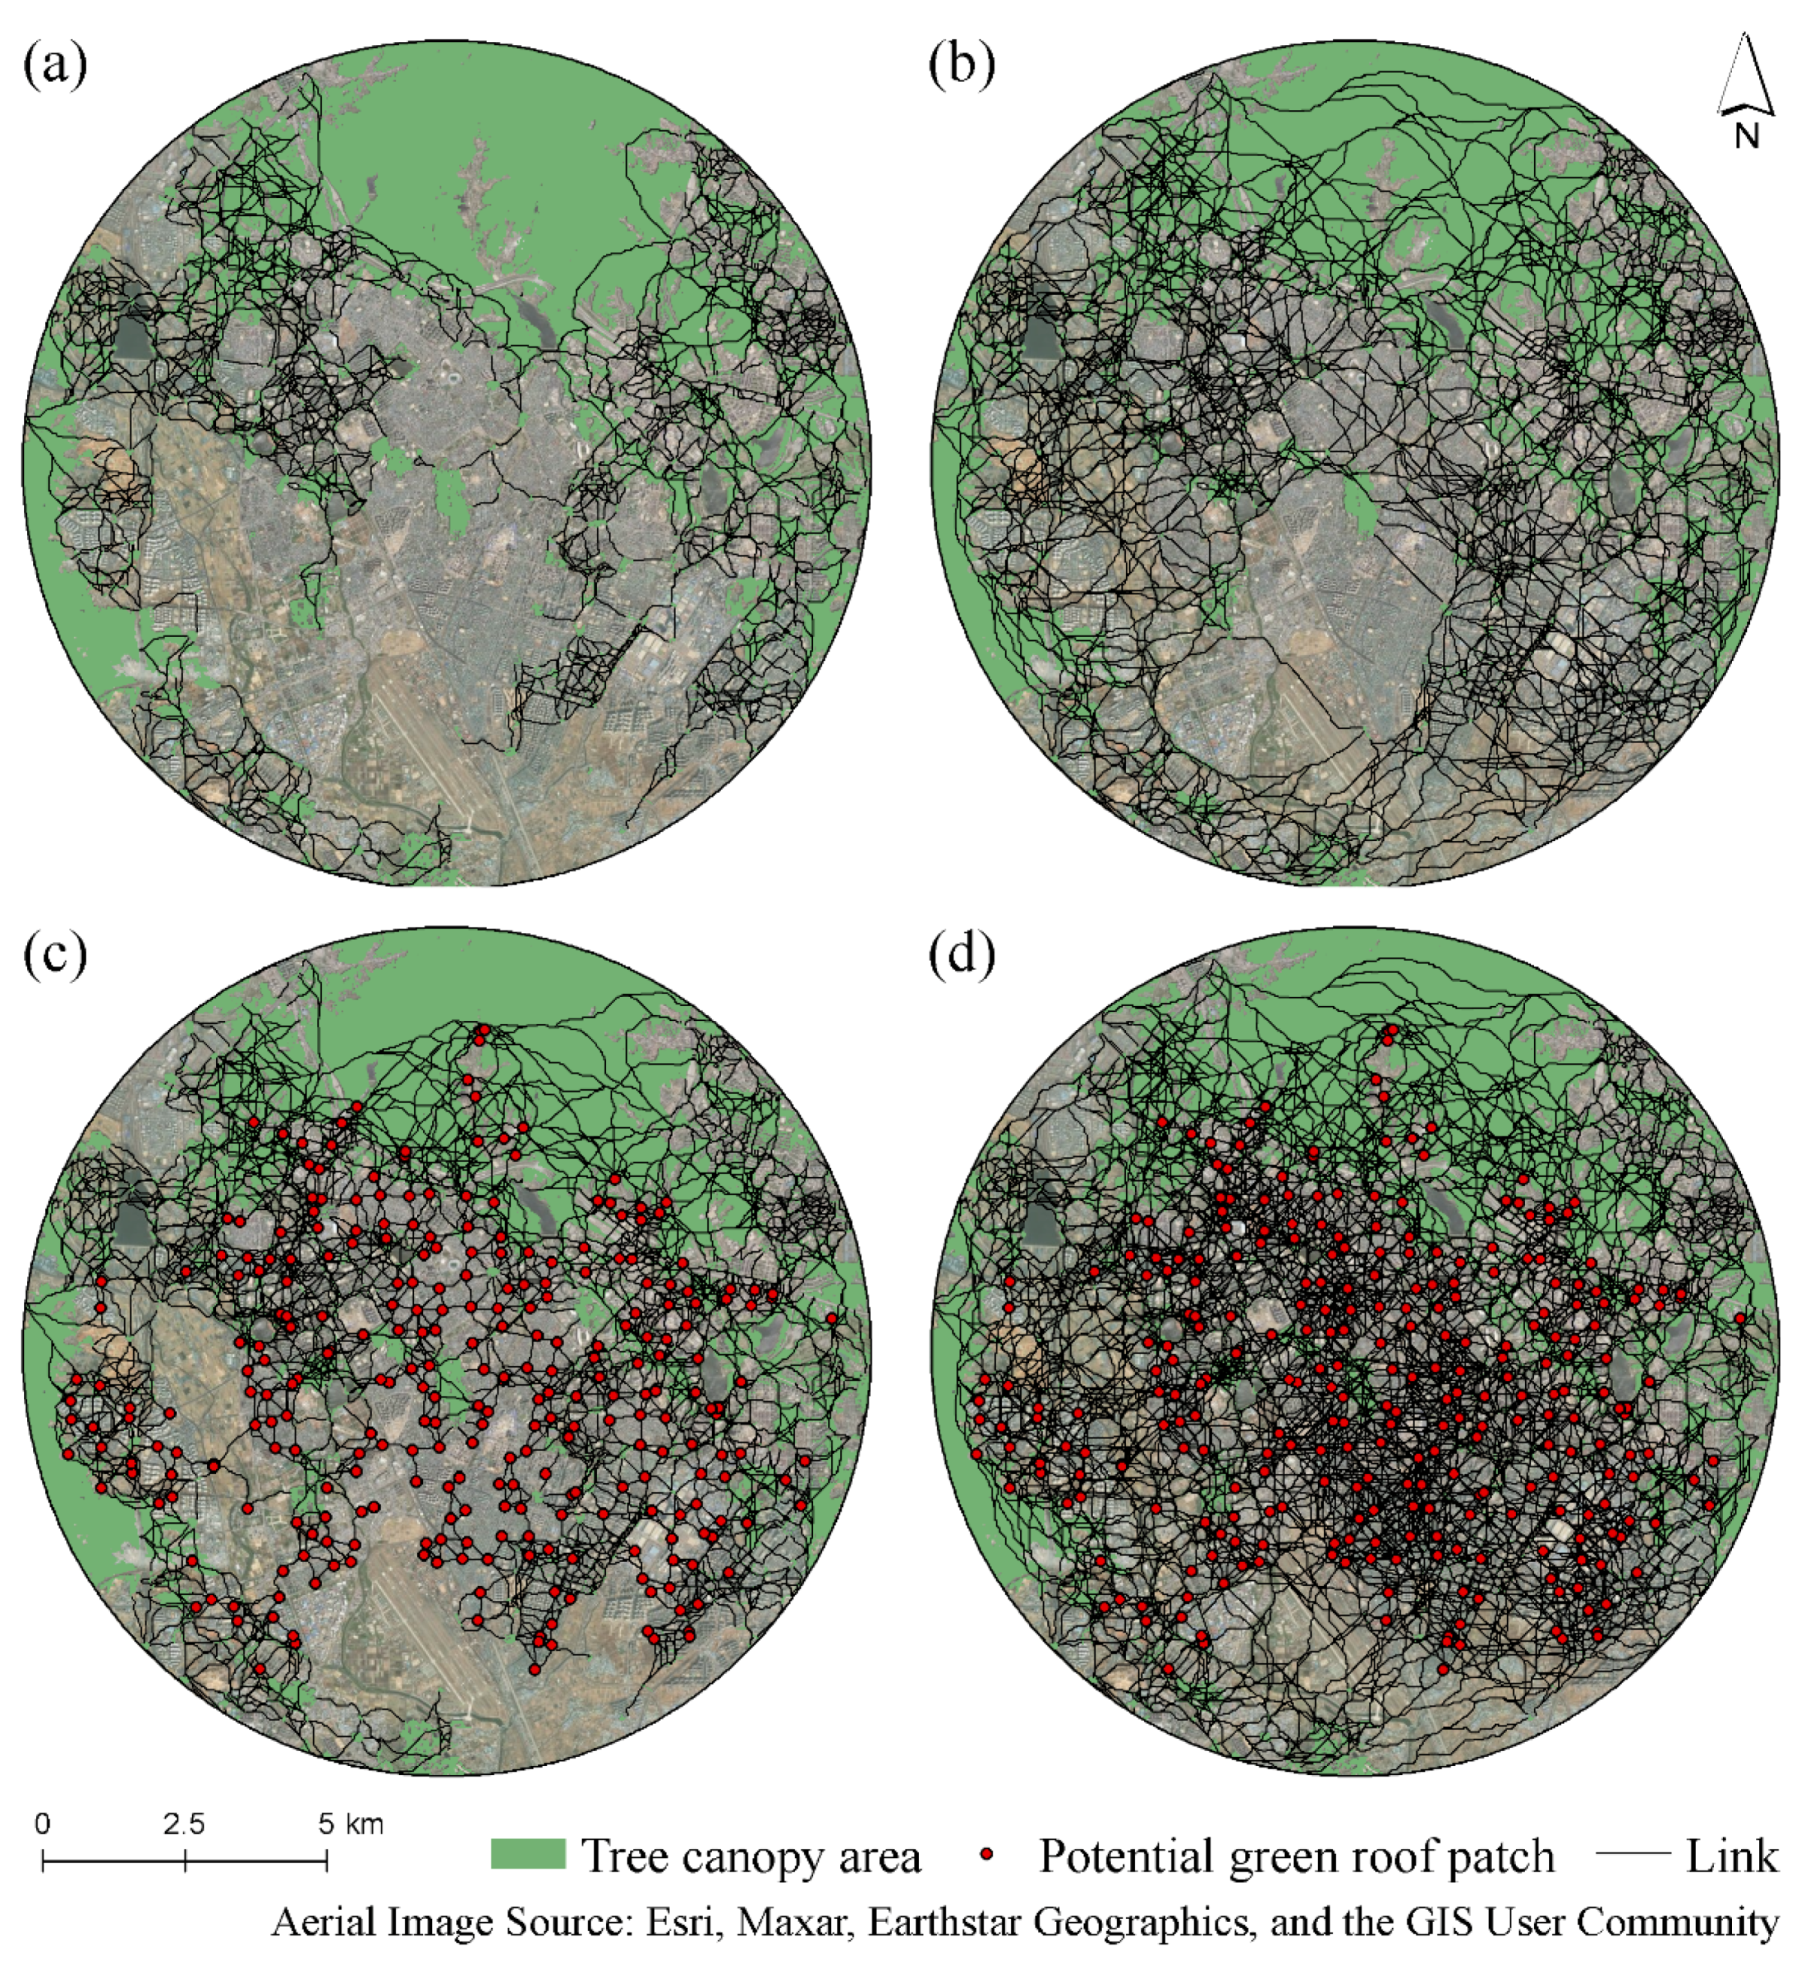
2.3.2. Evaluation of Green Roof Contributions to Tree Canopy Connectivity

Network-based approaches and methodologies (e.g., percolation theory, graph theory, and circuit theory) are mainly used for landscape connectivity analysis [41,42]. In the present study, we employed a landscape network approach based on the graph theory, which enables effective quantification and visualization of the landscape patterns and connectivity [43]. The landscape network (or graph) consists of nodes, which represent patches (or focal habitat), and links, indicating the connection between patches [44]. The graph theory has been widely used for the analysis and evaluation of landscape connectivity, that is, the distribution of the metapopulation in line with ecological flows (e.g., dispersal and gene flow); the physical connections between habitat patches; and modeling of connectivity between protected areas for wildlife and plants [45,46]. This study utilized Graphab as a tool to analyze the landscape network [47] and assess the contribution of green roofs to tree canopy connectivity. Using this approach, we attempted to present a strategy for selecting priority areas for green roofs, to improve tree canopy connection via green roofs in the future.
To create tree canopy patches as nodes in the study area, we utilized the European Space Agency’s (ESAs) WorldCover 2020 product that provides a global land cover map for 2020 at 10 m resolution based on Sentinel-1 and Sentinel-2 data. Patches were defined based on the 8-neighbor rule; tree canopy areas of >0.5 ha were used as patches, as this area is the estimated minimum urban green area required to provide a viable home range for diverse species, and can effectively provide ecological and landscape value [48]. Since most of the roof area of the buildings that could potentially be used as green roofs is smaller than 0.5 ha, we did not set individual buildings with the potential to have a green roof as patches. Instead, we attempted to increase the efficiency of connectivity analysis, by setting up nodes in a grid unit. After creating a 500 m grid approximately corresponding to a block scale on the study area, the grid cell center points with the attribute information (i.e., capacity), which is the sum of the areas of all buildings capable of greening roofs within each grid cell, were set as point patches.
We used the least-cost distance as the link distance between the patches. Unlike the Euclidean distance, a resistance value indicating the degree to which the flux of ecological processes is facilitated or disturbed, is required to calculate the least-cost distance. In this study, rather than assigning a discrete resistance value for each landscape type, we assigned a resistance value that reflects more heterogeneous urban landscape patterns. To this end, the median NDVI (Normalized Difference Vegetation Index) values during the period from June to September 2020 derived from Sentinel-2 satellite images through the Google Earth Engine were sorted in descending order; they were then rescaled from 1 (forest) to 100 (non-vegetated area); the rescaled values were used as the resistance values.
The probability of connectivity (PC) based on the probabilistic connectivity model was utilized to analyze the contributions of green roofs to tree canopy connectivity [49]. PC was calculated as follows: the amount of dispersal or movement of wild animals and plants according to the distance between patches was calculated as the probability (P) according to the negative exponential distribution, as shown in Equation (1):
P i j = e k × d i j
where k is a constant and dij is the distance between patches i and j. Through the probability (P) based on the distance between patches, the connectivity probability index of the entire landscape is calculated, as shown in Equation (2):
P C = i = 1 n j = 1 n a i × a j × P i j * A L 2
where n is the total number of patches, P i j * is the probability value of the maximum product probability path in which the connection between patches i and j is possible, a i is the area of patch i, a j is the area of patch j, and A L is the total area of the landscape. As of 2021, this study evaluated the contribution of green roofs to connectivity, through the delta Probability of Connectivity (dPC) with and without individual green roof patches at two threshold distances. The threshold distances were set to 1 km [50,51] and 5 km [52,53] at the local and landscape scales, respectively. These distances were selected while considering the distribution features of the landscape elements in the study area (e.g., the distribution of patches of tree canopy areas and the areas capable of installing green roofs), as well as their importance for urban biodiversity. As a result of log-log linear model analysis between the Euclidean distance of network links and the least-cost distance based on the resistance value (R2 = 0.82), 1 km corresponded to an effective distance of 3981, and 5 km corresponded to an effective distance of 13,290; each was applied as a threshold distance at the local and landscape scales, respectively. The probability of ecological process flux (P) was set to 0.05 at each threshold distance. Potential individual green roof patches were added sequentially to maximize the improvement of overall tree canopy connectivity. At each threshold distance, a greater change in the connectivity probability index based on the presence or absence of individual green roof patches implies that the corresponding green roof patch is located on an important connection path, improving overall tree canopy connectivity.

3. Results

3.1. Assessment of Land Cover and Ecosystem Service Changes by i-Tree Canopy

3.1.1. Urban Land Cover Changes

Land cover changes in Suwon City over the past 18 years are shown in Table 1. The land cover type occupying the largest area over the entire period was the tree type. In 2012, the tree areas decreased by 2.35 km2 (approximately 1.9% of the total area of Suwon City) when compared to 2003. In 2021, however, it increased by 1.70 km2 when compared to 2012, resulting in a total decrease of 0.65 km2 over the last 18 years. Grass and cropland saw the largest decrease over the last 18 years, with a total decrease of 11.24 km2. Roads, however, saw the largest increase during the same period, with an increase of 6.39 km2. Both types indicated substantial changes from 2003 to 2012, with a decrease of 10.51 km2 for grass and cropland, and an increase of 4.12 km2 for roads. Pervious land (e.g., trees, grassland, and cropland) showed a decrease of 12.86 km2 from 2003 to 2012, without much change after 2012. It was found that impervious land (e.g., buildings and roads) continuously increased by nearly 10% of the total study area over the last 18 years.
The detailed changes in land cover types between 2003 and 2021 are shown in Table 2. For the tree type, 5.98 km2 was found to have changed to other land types during the evaluation period. In particular, changes from trees to buildings, and trees to grass and cropland were found to be most prominent. When detailed land types are categorized into pervious and impervious land covers, the changes over the entire evaluation period were 12.45 km2 from pervious to impervious land covers, and 1.78 km2 from impervious to pervious land covers.

3.1.2. Urban Tree Service Changes and Green Roof Effects

Ecosystem services provided by trees at each time point and in the green roof scenario are shown in Table 3. From 2003 to 2021, the ecosystem services were reduced by the annual CO2 sequestration of 0.57 kt/yr, CO2 storage of 18.22 kt, air pollution removal of 4.92 t/yr, and rainfall-runoff reduction of 0.13 ML/yr. If greening was carried out for a building (in which it was possible to have a green roof) on an area of 0.87 km2 in Suwon City, the ecosystem services would be improved when compared to 2021 by an annual CO2 sequestration of 0.75 kt/yr, CO2 storage of 23.92 kt, air pollution removal of 6.44 t/yr (CO 0.09 t/yr, NO2 0.55 t/yr, O3 4.27 t/yr, PM10 1.01 t/yr, PM2.5 0.21 t/yr, and SO2 0.31 t/yr), and rainfall-runoff reduction of 0.18 ML/yr. Furthermore, it was predicted that if the roof is greened in the future, the tree canopy ecosystem services will be improved when compared to 2003.

3.2. Assessment of Green Roof Contributions to Tree Canopy Connectivity

Changes in the tree canopy connectivity before and after the implementation of green roofs for each spatial scale are shown in Figure 4. Prior to the greening roof, the gap area of the tree canopy connectivity was found to be larger in the central and southern parts of the local-scale network (364 patches and 2794 links), than in the landscape-scale network (364 patches and 17,952 links). After adding 290 patches that represent possible installations of green roofs, the number of links for the local-scale network increased by 3137 (654 patches, and 5931 links), when compared to the initial, and the number of links for the landscape-scale network increased by 34,096 (654 patches, and 52,048 links). In addition, when a green roof was implemented, it was confirmed that areas that were indirectly connected in the local-scale network became directly connected. In the landscape-scale network, the tree canopy network was more densely connected through the green roof.
Changes in green roof contributions to connectivity at the local and landscape scales are shown in Figure 5. The contribution from the green roof patches with the highest connectivity improvement effect was 0.25 × 10⁻⁴ at a local scale and 0.39 × 10⁻⁴ at a landscape scale (1.56 times higher than the local scale). The changes in connectivity improvement tended to converge to zero faster at a local scale than at a landscape scale.

3.3. Priority Area Selection of Green Roofs

Priority areas for installing green roofs were selected based on whether they improve connectivity, with the selected areas shown in Figure 6. Based on the non-normality of the distribution of the dPC values (Shapiro–Wilk test, p-value < 0.05), the top 25% green roof patches with the greatest effects on improving connectivity at each scale were selected as the priority areas for installing green roofs. Specifically, the areas with high synergy effects on better connectivity at both scales were selected as the top priority areas for creating green roofs. There were 87 top 25% of green roof patches, all of which had a large effect on connectivity at the local or landscape scale; they were mainly located at the border between mountainous and urban areas. At both scales, the number of highest priority points for installing green roofs with high connectivity improvement effects at the same time, was 57 patches, accounting for 19.7% of the total number of patches suitable for installing green roofs. As for the green roof patches that showed higher connectivity improvement effects for only one scale, it was confirmed that 15 patches were closer to the large mountainous areas at a local scale, and 15 patches were located in the inner areas of Suwon City at a landscape scale. Patches with a weaker connectivity improvement effect were mainly found in the central and southern areas of Suwon City.

4. Discussion

The focus of previous studies has been the effects of green roofs on individual ecosystem services at a local or site scale (e.g., [11,12,54]), pointing to the necessity of comprehensively researching the effects of the green roof functions on various ecosystem services at multiple scales [20,55,56]. The promotion and vitalization of green roofs by strategic and comprehensive approaches has also been important tasks in urban and green infrastructure planning [20,57]. In this regard, this study analyzed land cover changes in a major city to investigate the diverse ecosystem services offered by tree canopies and the benefits of green roof; it also suggested a scenario-based roof greening strategy, assuming that the tree canopy connectivity enhances the urban biodiversity. The implications of our approach and findings are discussed in the following four sections.

4.1. Time-Series Land Cover Changes and Green Roof Ecosystem Services

To understand urbanization trends, this study analyzed land cover patterns in 2003, 2012, and 2021, using i-Tree Canopy and Google Earth satellite images (Table 1). During the evaluation period, pervious areas that included trees (the basis of urban ecosystem services) decreased, while impervious areas showed a tendency to increase. Decreases in pervious land were directly related to the increase in impervious land (Table 2). Suwon City showed typical urbanization development in which buildings and roads are constructed by transforming agricultural and mountainous areas. Therefore, if greening is conducted on rooftops (idle spaces), buildings are expected to simultaneously perform impervious and pervious functions, as the grey infrastructures in which urban dwellers reside, and as green infrastructures providing ecosystem services via trees, yards, and gardens.
In addition to understanding urbanization trends, this study efficiently and quantitatively evaluated the effects of green roofs on improving ecosystem services, as a potential green infrastructure strategy to supplement the ecosystem services of trees, which have been reduced due to development. Suwon City announced the ‘2050 Basic Strategy for Carbon Neutrality’ for systematic greenhouse gas (GHG) emission reduction in 2020 and suggested seven tasks to reach this goal [58]. One of the tasks includes the expansion of green infrastructure. The aim of this city is to offset 1165.6 kt of CO2, which accounts for 20% of the city’s GHGs emissions (5828.0 kt CO2) in 2005 [58]. Assuming that the entire 0.87 km2 area, on which it is possible to install green roofs in the city, can be greened, a total of 24.67 kt (CO2 sequestration of 0.75 kt, and CO2 storage of 23.92 kt) can be additionally offset (Table 3), which corresponds to approximately 2.1% of the city’s carbon offset target. In the future, to achieve the goal of carbon neutrality, it will be necessary to establish a systematic green infrastructure strategy, not only through green roofs but also by creating green spaces in vacant lots and greening walls.

4.2. Selection of Priority Areas for Greening Roofs Based on the Connectivity

Tree canopy networks play an important role in maintaining urban biodiversity and ecosystem services [59,60]. This study visually and quantitatively evaluated the effects of green roofs on improving tree canopy connectivity. Moreover, the study selected the optimal priority areas for green roofs that could enhance the connectivity of tree canopy networks at multiple spatial scales.
Despite the distribution of urban forests with an area of 20–50 ha in the center of Suwon City, it was confirmed that there were tree canopy connectivity gaps that could be filled through the implementation of green infrastructure: in the central and southern areas at a local scale, and in the central area at a landscape scale (Figure 4a,b). Furthermore, the network created by urban forests in the center of Suwon City was relatively poorly connected when compared to the network formed by several small tree canopy patches in the southeast of Suwon City. To improve the connectivity between larger urban forest patches, which serve as a source habitat, and to connect such patches with small urban forests, it will be necessary to introduce elements of green infrastructure (e.g., green roofs) to serve as stepping stones for the movement and dispersal of living organisms [31,32]. The tree canopy network in the city, before the implementation of green roofs, was connected as one component only at the landscape scale. However, if green roofs are installed, connectivity gaps will be filled by green roof patches, resulting in a more resilient tree canopy network.
The connectivity gaps were found to be filled by green roofs at both scales, but differences existed in the spatial scales in terms of stronger tree canopy connectivity (Figure 4c,d). At a local scale, the patches that were indirectly connected through diverse paths showed a tendency to also be connected by short paths through green roofs. At a landscape scale, the number of alternative paths increased, as green roof patches were added for higher network redundancy. As such, it is expected that green roofs will contribute to the effective movement and flux of abiotic and biotic elements on a multi-scale level, by providing a path for faster short-distance movement and several alternative paths for long-distance movement.
As the quantitative effects of improved tree canopy connectivity by multiple green roof patches, the connectivity increase (i.e., dPC) at both local and landscape scales was found to be closer to zero when the patches were added sequentially (Figure 5). The weak connectivity enhancement could be attributed to the small area of the corresponding multiple green roof patches and the configuration of the tree canopy patches distributed in the vicinity in the spatial context [49]. Moreover, the increases in connectivity tended to converge to zero faster at a local scale than at a landscape scale. Therefore, the contributions of the green roofs to connectivity were relatively greater at the landscape scale than at the local scale. In other words, green roofs were found to improve tree canopy connectivity at the landscape scale more than the local scale, by acting as stepping stones in connecting fragmented forests and trees. To improve ecosystem services and tree canopy connectivity on a limited budget, priority should be given to areas with high synergy effects for improved connectivity at both local and landscape scales. In addition, priority should be given to the areas with higher enhancement effects at one scale, especially landscape scale. According to this priority order (both scales > one scale), it is necessary to implement greening strategies sequentially.
The areas with synergistic effects from improved connectivity, or improved connectivity at one scale, were mainly located near the border between mountainous and urban areas (Figure 6). As the individual roof areas that can be greened are small, they did not exert a great effect on the improvement of the tree canopy ecosystem services in Suwon City. However, even if the areas are small, green roofs can serve as a hub in the network; main green roof areas, which could increase the entire tree canopy connectivity by connecting the fragmented urban forests in the city with the existing nearby mountainous areas, could be confirmed.
Even after greening roofs, gaps remain that need to be addressed for connectivity, especially at a local scale (Figure 4c). In addition to the functions provided by tree canopy, there are functions of public benefit in terms of social and cultural aspects (e.g., provision of rest areas) [1,3]. This study selected the areas with the synergy effects of improved connectivity, as the top priority for greening roofs. However, the areas with weak connectivity (or connectivity gaps) should also be selected as priority areas for greening, resulting in better access of residents to ecosystem services and thus improved equity of green infrastructure, as well as the creation of a balanced ecological network [61].

4.3. Overall Evaluation of the Methodology

This study aimed to provide a framework to support efficient spatial decision-making in green roof planning, to improve ecosystem services and biodiversity in large cities. We analyzed changes in land cover and ecosystem services of trees, from 2003 to 2021, and simulated the degree of improvement in ecosystem services from potential green roofs. To evaluate the connectivity for the improvement of biodiversity, the effects of green roofs on improved connectivity were evaluated at multi-spatial scales, and as a result, it was possible to select priority areas for efficiently installing green roofs.
This study also utilized multi-temporal satellite images and examined the time-series urbanization trend in the study area. In this trend, by quantifying and presenting various ecosystem services for trees, it was possible to predict changes in individual ecosystem services after the creation of green roofs. By considering urban ecosystem services related to climate change, fine particulate matter, flood-control response (e.g., carbon sequestration and storage, less air pollution, and rainfall-runoff reduction), and tree canopy connectivity related to improved biodiversity, this study suggests greening strategies for ecologically friendly urban spaces. As a nature-based solution using green infrastructure, this study has significance in comprehensively evaluating the effects of improving ecosystem services and ecological connectivity in line with rooftop greening, to support urban environmental planning in the future.

4.4. Limitations of This Study

Further enhancements are required to improve the approach suggested in this study. First, ecosystem services in i-Tree Canopy, which was used for evaluation, are only proportional to the area of the canopy. In the future, it will be necessary to evaluate not only the canopy but also the characteristics of individual trees (e.g., tree species and height). That is, more enhancements are possible by conducting an urban tree survey and utilizing a model such as i-Tree Eco [62], wherein it is possible to more precisely evaluate ecosystem services at the species or genus level. Second, although this study focused on tree canopy ecosystem services, it will also be necessary to evaluate ecosystem services of other land types (e.g., ponds, vegetable gardens, and grasslands) applicable to green roofs [20]. Future studies should consider ecosystems of not only urban trees, but also natural and semi-natural elements such as water bodies, grasslands, and croplands. In addition, connectivity should be evaluated in relation to the interactions between biodiversity and ecosystem services from these land types.

5. Conclusions

This study focused on Suwon City (a large urban area with a population of 1.218 million), and analyzed the changes in land cover and tree canopy ecosystem services over the last 18 years using i-Tree Canopy. In addition, the study evaluated the level of ecosystem services in line with potential rooftop greening, by conducting historical data comparisons. By applying the graph theory, it was possible to efficiently derive the priority areas for creating green roofs for biodiversity promotion at local and landscape scales, based on the evaluation for the importance of improved connectivity via green roofs.
The role of nature-based solutions to respond to climate change and for higher urban resilience has been receiving increasing attention [63,64]. In the context of nature-based solutions, the approaches, methodologies, and results of this study will provide useful tools and information for urban greening plans and future strategies to promote urban ecosystem services and biodiversity through the utilization of green roof infrastructure.

Author Contributions

Conceptualization and methodology, J.K. and W.K.; data curation, J.K. and W.K.; formal analysis, J.K. and W.K.; investigation and visualization, J.K. and W.K.; funding acquisition, project administration, resources, and supervision, W.K.; writing—original draft preparation, J.K.; validation and writing—review and editing, W.K. and J.K. All authors have read and agreed to the published version of the manuscript.

Funding

This work was conducted with the support of the Korea Environment Industry & Technology Institute (KEITI) through its Urban Ecological Health Promotion Technology Development Project funded by the Korea Ministry of Environment (MOE) (2019002770001).

Institutional Review Board Statement

Not applicable.

Informed Consent Statement

Not applicable.

Data Availability Statement

No new data were generated or analyzed in this study; therefore, data sharing does not apply to this article.

Acknowledgments

We would like to thank Jonghwan Kim, Inyoo Kim, and Sinyoung Park for their assistance with data collection and analysis. We would also like to thank reviewers for their helpful comments.

Conflicts of Interest

The authors declare no conflict of interest. The funders had no role in the design of the study; in the collection, analyses, or interpretation of the data; in the writing of the manuscript, or in the decision to publish the results.

References

  1. Bolund, P.; Hunhammar, S. Ecosystem services in urban areas. Ecol. Econ. 1999, 29, 293–301. [Google Scholar] [CrossRef]
  2. Guerry, A.D.; Polasky, S.; Lubchenco, J.; Chaplin-Kramer, R.; Daily, G.C.; Griffin, R.; Ruckelshaus, M.; Bateman, I.J.; Duraiappah, A.; Elmqvist, T. Natural capital and ecosystem services informing decisions: From promise to practice. Proc. Natl. Acad. Sci. USA 2015, 112, 7348–7355. [Google Scholar] [CrossRef]
  3. Millennium Ecosystem Assessment. Ecosystems and Human Well-Being: Synthesis; Island Press: Washington, DC, USA, 2005. [Google Scholar]
  4. Desa, U. Transforming Our World: The 2030 Agenda for Sustainable Development; United Nations General Assembly: New York, NY, USA, 2016. [Google Scholar]
  5. United Nations Conference on Trade and Development (UNCTAD). Total and Urban Population. Available online: https://stats.unctad.org/handbook/Population/Total.html (accessed on 25 October 2021).
  6. Akbari, H.; Pomerantz, M.; Taha, H. Cool surfaces and shade trees to reduce energy use and improve air quality in urban areas. Sol. Energy 2001, 70, 295–310. [Google Scholar] [CrossRef]
  7. Butt, E.; Turnock, S.; Rigby, R.; Reddington, C.; Yoshioka, M.; Johnson, J.; Regayre, L.; Pringle, K.; Mann, G.; Spracklen, D. Global and regional trends in particulate air pollution and attributable health burden over the past 50 years. Environ. Res. Lett. 2017, 12, 104017. [Google Scholar] [CrossRef]
  8. Goines, L.; Hagler, L. Noise pollution: A modem plague. South Med. J. 2007, 100, 287–294. [Google Scholar] [CrossRef]
  9. Chapin Iii, F.S.; Zavaleta, E.S.; Eviner, V.T.; Naylor, R.L.; Vitousek, P.M.; Reynolds, H.L.; Hooper, D.U.; Lavorel, S.; Sala, O.E.; Hobbie, S.E. Consequences of changing biodiversity. Nature 2000, 405, 234–242. [Google Scholar] [CrossRef]
  10. Lyytimäki, J.; Petersen, L.K.; Normander, B.; Bezák, P. Nature as a nuisance? Ecosystem services and disservices to urban lifestyle. Environ. Sci. 2008, 5, 161–172. [Google Scholar] [CrossRef]
  11. Susca, T.; Gaffin, S.R.; Dell’Osso, G. Positive effects of vegetation: Urban heat island and green roofs. Environ. Pollut. 2011, 159, 2119–2126. [Google Scholar] [CrossRef]
  12. Gregoire, B.G.; Clausen, J.C. Effect of a modular extensive green roof on stormwater runoff and water quality. Ecol. Eng. 2011, 37, 963–969. [Google Scholar] [CrossRef]
  13. Speak, A.; Rothwell, J.; Lindley, S.; Smith, C. Urban particulate pollution reduction by four species of green roof vegetation in a UK city. Atmos. Environ. 2012, 61, 283–293. [Google Scholar] [CrossRef]
  14. Yang, H.S.; Kang, J.; Choi, M.S. Acoustic effects of green roof systems on a low-profiled structure at street level. Build. Environ. 2012, 50, 44–55. [Google Scholar] [CrossRef]
  15. Palmiere, S.E.; Riascos, C.E.; Riascos, L.A. Integration of energy and fire prevention systems in greenbuildings. In Proceedings of the 2015 IEEE 24th International Symposium on Industrial Electronics (ISIE), Buzios, Brazil, 3–5 June 2015; pp. 723–728. [Google Scholar]
  16. Blank, L.; Vasl, A.; Levy, S.; Grant, G.; Kadas, G.; Dafni, A.; Blaustein, L. Directions in green roof research: A bibliometric study. Build. Environ. 2013, 66, 23–28. [Google Scholar] [CrossRef]
  17. Nguyen, C.N.; Muttil, N.; Tariq, M.A.U.R.; Ng, A.W.M. Quantifying the benefits and ecosystem services provided by green roofs—A review. Water 2022, 14, 68. [Google Scholar] [CrossRef]
  18. Frank, S.; Fürst, C.; Koschke, L.; Makeschin, F. A contribution towards a transfer of the ecosystem service concept to landscape planning using landscape metrics. Ecol. Indic. 2012, 21, 30–38. [Google Scholar] [CrossRef]
  19. Syrbe, R.-U.; Walz, U. Spatial indicators for the assessment of ecosystem services: Providing, benefiting and connecting areas and landscape metrics. Ecol. Indic. 2012, 21, 80–88. [Google Scholar] [CrossRef]
  20. Oberndorfer, E.; Lundholm, J.; Bass, B.; Coffman, R.R.; Doshi, H.; Dunnett, N.; Gaffin, S.; Köhler, M.; Liu, K.K.Y.; Rowe, B. Green roofs as urban ecosystems: Ecological structures, functions, and services. Bioscience 2007, 57, 823–833. [Google Scholar] [CrossRef]
  21. Ziter, C. The biodiversity–ecosystem service relationship in urban areas: A quantitative review. Oikos 2016, 125, 761–768. [Google Scholar] [CrossRef]
  22. Díaz, S.; Fargione, J.; Chapin III, F.S.; Tilman, D. Biodiversity loss threatens human well-being. PLoS Biol. 2006, 4, e277. [Google Scholar] [CrossRef]
  23. Haddad, N.M.; Brudvig, L.A.; Clobert, J.; Davies, K.F.; Gonzalez, A.; Holt, R.D.; Lovejoy, T.E.; Sexton, J.O.; Austin, M.P.; Collins, C.D. Habitat fragmentation and its lasting impact on Earth’s ecosystems. Sci. Adv. 2015, 1, e1500052. [Google Scholar] [CrossRef]
  24. Bailey, S. Increasing connectivity in fragmented landscapes: An investigation of evidence for biodiversity gain in woodlands. For. Ecol. Manag. 2007, 238, 7–23. [Google Scholar] [CrossRef]
  25. Correa Ayram, C.A.; Mendoza, M.E.; Etter, A.; Salicrup, D.R.P. Habitat connectivity in biodiversity conservation: A review of recent studies and applications. Prog. Phys. Geogr. 2016, 40, 7–37. [Google Scholar] [CrossRef]
  26. Fahrig, L. Relative effects of habitat loss and fragmentation on population extinction. J. Wildl. Manag. 1997, 61, 603–610. [Google Scholar] [CrossRef]
  27. Laita, A.; Kotiaho, J.; Mönkkönen, M. Graph-theoretic connectivity measures: What do they tell us about connectivity? Landsc. Ecol. 2011, 26, 951–967. [Google Scholar] [CrossRef]
  28. Mitchell, M.G.; Bennett, E.M.; Gonzalez, A. Linking landscape connectivity and ecosystem service provision: Current knowledge and research gaps. Ecosystems 2013, 16, 894–908. [Google Scholar] [CrossRef]
  29. Pelorosso, R.; Gobattoni, F.; Geri, F.; Monaco, R.; Leone, A. Evaluation of ecosystem services related to bio-energy landscape connectivity (BELC) for land use decision making across different planning scales. Ecol. Indic. 2016, 61, 114–129. [Google Scholar] [CrossRef]
  30. Williams, S.H.; Scriven, S.A.; Burslem, D.F.; Hill, J.K.; Reynolds, G.; Agama, A.L.; Kugan, F.; Maycock, C.R.; Khoo, E.; Hastie, A.Y. Incorporating connectivity into conservation planning for the optimal representation of multiple species and ecosystem services. Conserv. Biol. 2020, 34, 934–942. [Google Scholar] [CrossRef]
  31. Herrera, L.P.; Sabatino, M.C.; Jaimes, F.R.; Saura, S. Landscape connectivity and the role of small habitat patches as stepping stones: An assessment of the grassland biome in South America. Biodivers. Conserv. 2017, 26, 3465–3479. [Google Scholar] [CrossRef]
  32. Rösch, V.; Tscharntke, T.; Scherber, C.; Batáry, P. Biodiversity conservation across taxa and landscapes requires many small as well as single large habitat fragments. Oecologia 2015, 179, 209–222. [Google Scholar] [CrossRef]
  33. Braaker, S.; Obrist, M.K.; Ghazoul, J.; Moretti, M. Habitat connectivity and local conditions shape taxonomic and functional diversity of arthropods on green roofs. J. Anim. Ecol. 2017, 86, 521–531. [Google Scholar] [CrossRef]
  34. Suwon. Statistics Suwon. Available online: https://www.suwon.go.kr/stat/index.do (accessed on 30 July 2022).
  35. ESRI. World Imagery Basemap. 2021. Available online: https://www.arcgis.com/home/item.html?id=10df2279f9684e4a9f6a7f08febac2a9 (accessed on 29 December 2021).
  36. Zanaga, D.; Van De Kerchove, R.; De Keersmaecker, W.; Souverijns, N.; Brockmann, C.; Quast, R.; Wevers, J.; Grosu, A.; Paccini, A.; Vergnaud, S.; et al. ESA WorldCover 10 m 2020 v100. 2021. Available online: https://zenodo.org/record/5571936#.YvMgWBxByUk (accessed on 12 July 2022).
  37. Ministry of Land, Infrastructure and Transport (MOLIT). Integrated building information data. 2021. Available online: http://data.nsdi.go.kr/dataset/12623 (accessed on 29 December 2021).
  38. i-Tree Canopy. i-Tree Software Suite v6.x. (n.d.). Available online: http://www.itreetools.org (accessed on 2 May 2022).
  39. ESRI. ArcGIS Pro (Version 2.7). Esri Inc. 2021. Available online: https://www.esri.com/en-us/arcgis/products/arcgis-pro/overview (accessed on 29 December 2021).
  40. Andersson, B.; Carroll, W.; Martin, M. Aggregation of U.S. population centers using climate parameters related to building energy use. J. Clim. Appl. Meteorol. 1986, 25, 596–614. [Google Scholar] [CrossRef]
  41. Kong, F.; Yin, H.; Nakagoshi, N.; Zong, Y. Urban green space network development for biodiversity conservation: Identification based on graph theory and gravity modeling. Landsc. Urban Plan. 2010, 95, 16–27. [Google Scholar] [CrossRef]
  42. Urban, D.; Keitt, T. Landscape connectivity: A graph-theoretic perspective. Ecology 2001, 82, 1205–1218. [Google Scholar] [CrossRef]
  43. Rayfield, B.; Fortin, M.-J.; Fall, A. Connectivity for conservation: A framework to classify network measures. Ecology 2011, 92, 847–858. [Google Scholar] [CrossRef] [PubMed]
  44. Galpern, P.; Manseau, M.; Fall, A. Patch-based graphs of landscape connectivity: A guide to construction, analysis and application for conservation. Biol. Conserv. 2011, 144, 44–55. [Google Scholar] [CrossRef]
  45. Urban, D.L.; Minor, E.S.; Treml, E.A.; Schick, R.S. Graph models of habitat mosaics. Ecol. Lett. 2009, 12, 260–273. [Google Scholar] [CrossRef]
  46. Fuller, T.; Munguía, M.; Mayfield, M.; Sánchez-Cordero, V.; Sarkar, S. Incorporating connectivity into conservation planning: A multi-criteria case study from central Mexico. Biol. Conserv. 2006, 133, 131–142. [Google Scholar] [CrossRef]
  47. Foltête, J.-C.; Clauzel, C.; Vuidel, G. A software tool dedicated to the modelling of landscape networks. Environ. Model. Softw. 2012, 38, 316–327. [Google Scholar] [CrossRef]
  48. Rudd, H.; Vala, J.; Schaefer, V. Importance of backyard habitat in a comprehensive biodiversity conservation strategy: A connectivity analysis of urban green spaces. Restor. Ecol. 2002, 10, 368–375. [Google Scholar] [CrossRef]
  49. Saura, S.; Pascual-Hortal, L. A new habitat availability index to integrate connectivity in landscape conservation planning: Comparison with existing indices and application to a case study. Landsc. Urban Plan. 2007, 83, 91–103. [Google Scholar] [CrossRef]
  50. Volpe, N.L.; Hadley, A.S.; Robinson, W.D.; Betts, M.G. Functional connectivity experiments reflect routine movement behavior of a tropical hummingbird species. Ecol. Appl. 2014, 24, 2122–2131. [Google Scholar] [CrossRef]
  51. Zurbuchen, A.; Landert, L.; Klaiber, J.; Müller, A.; Hein, S.; Dorn, S. Maximum foraging ranges in solitary bees: Only few individuals have the capability to cover long foraging distances. Biol. Conserv. 2010, 143, 669–676. [Google Scholar] [CrossRef]
  52. Klaassen, R.H.; Strandberg, R.; Hake, M.; Alerstam, T. Flexibility in daily travel routines causes regional variation in bird migration speed. Behav. Ecol. Sociobiol. 2008, 62, 1427–1432. [Google Scholar] [CrossRef]
  53. Byrne, M.; Elliott, C.; Yates, C.; Coates, D. Extensive pollen dispersal in a bird-pollinated shrub, Calothamnus quadrifidus, in a fragmented landscape. Mol. Ecol. 2007, 16, 1303–1314. [Google Scholar] [CrossRef] [PubMed]
  54. Gnecco, I.; Palla, A.; Lanza, L.G.; La Barbera, P. The role of green roofs as a source/sink of pollutants in storm water outflows. Water Resour. Manag. 2013, 27, 4715–4730. [Google Scholar] [CrossRef]
  55. Cortinovis, C.; Geneletti, D. Ecosystem services in urban plans: What is there, and what is still needed for better decisions. Land Use Policy 2018, 70, 298–312. [Google Scholar] [CrossRef]
  56. Hansen, R.; Pauleit, S. From multifunctionality to multiple ecosystem services? A conceptual framework for multifunctionality in green infrastructure planning for urban areas. Ambio 2014, 43, 516–529. [Google Scholar] [CrossRef]
  57. Hoeben, A.D.; Posch, A. Green roof ecosystem services in various urban development types: A case study in Graz, Austria. Urban For. Urban Green 2021, 62, 127167. [Google Scholar] [CrossRef]
  58. Suwon. Climate Change Countermeasures. 2021. Available online: https://www.suwon.go.kr/sw-www/deptHome/dep_env/env_02/env_01_06/env_01_06-03.jsp (accessed on 29 December 2021).
  59. Niemelä, J.; Saarela, S.-R.; Söderman, T.; Kopperoinen, L.; Yli-Pelkonen, V.; Väre, S.; Kotze, D.J. Using the ecosystem services approach for better planning and conservation of urban green spaces: A Finland case study. Biodivers. Conserv. 2010, 19, 3225–3243. [Google Scholar] [CrossRef]
  60. Jongman, R. Ecological networks are an issue for all of us. J. Landsc. Ecol. 2008, 1, 7–13. [Google Scholar] [CrossRef]
  61. Thorne, J.H.; Choe, H.; Boynton, R.M.; Lee, D.K. Open space networks can guide urban renewal in a megacity. Environ. Res. Lett. 2020, 15, 094080. [Google Scholar] [CrossRef]
  62. i-Tree Eco. i-Tree Software Suite v6.x. (n.d.). Available online: http://www.itreetools.org (accessed on 2 May 2022).
  63. Seddon, N.; Daniels, E.; Davis, R.; Chausson, A.; Harris, R.; Hou-Jones, X.; Huq, S.; Kapos, V.; Mace, G.M.; Rizvi, A.R.; et al. Global recognition of the importance of nature-based solutions to the impacts of climate change. Glob. Sustain. 2020, 3, e15. [Google Scholar] [CrossRef]
  64. Frantzeskaki, N. Seven lessons for planning nature-based solutions in cities. Environ. Sci. Policy 2019, 93, 101–111. [Google Scholar] [CrossRef]
Figure 1. Geographical location and land cover map of Suwon City, Republic of Korea. (a) Aerial view of the Korean Peninsula in Northeast Asia [35]. (b) Land cover map of Suwon City, Republic of Korea [36].
Land 11 01281 g001
Figure 2. Roof spaces in Suwon City, Republic of Korea that could potentially be greened. The map shows an aerial view of the city and the surrounding areas [35].
Land 11 01281 g002
Figure 3. A flowchart illustrating the procedures followed in the present study.
Land 11 01281 g003
Figure 4. Current networks of tree canopy areas (nodes) connected by least-cost links at distance thresholds of (a) 3981 and (b) 13,290 cost units for the local and landscape scales, respectively, in Suwon City, Republic of Korea. (c,d) indicate changes in the tree canopy area network when adding potential green roof patches as nodes, connected by least-cost links at a distance threshold of 3981 and 13,290 cost units for the local and landscape scales, respectively.
Land 11 01281 g004
Figure 5. Contributions of potential individual green roof patches (N = 290) sequentially added to maximize the improvement of overall tree canopy connectivity as measured by the delta Probability of Connectivity (dPC) at distances of 3981 and 13,290 cost units for the local and landscape scales, respectively, in Suwon City, Republic of Korea.
Land 11 01281 g005
Figure 6. Priority areas for green roof locations based on each location’s contribution to tree canopy connectivity at local and landscape scales in Suwon City (Republic of Korea), with an aerial view of the city and surrounding areas [35]. Red grids represent the top 25% of the green roof patches with the greatest effects on the improved connectivity at all scales; orange grids represent the top 25% only at the local scale; yellow grids the top 25% only at the landscape scale; green grids the top 25–50% at the local or landscape scale; and blue grids the lowest 50% at both scales.
Land 11 01281 g006
Table 1. Land cover type by year and green roof scenario.
Land Cover Type200320122021Green Roof Scenario *
Area (km2)% of the Total Study AreaArea (km2)% of the Total Study AreaArea (km2)% of the Total Study AreaArea (km2)% of the Total Study Area
Tree37.1230.6034.7728.6736.4730.0737.3430.77
Road21.2717.5425.3920.9327.6622.8027.6622.80
Building25.9621.4028.0623.1330.7325.3329.8624.63
Grass and cropland26.3621.7315.8513.0715.1212.4715.1212.47
Bare ground8.497.0015.2012.539.307.679.307.67
Water2.101.732.021.672.021.672.021.67
Pervious area63.4852.3350.6241.7451.5942.5452.4643.24
Impervious area47.2338.9353.4544.0658.3948.1357.5247.43
* Green roof scenario refers to a scenario whereby the area of eligible buildings for green roof installation (0.87 km2) was changed into tree areas in the 2021 land cover type classification.
Table 2. Land cover transition matrix (unit: km2).
Time PeriodTo 2021
TreeRoadBuildingGrass and CroplandBare GroundWater
From 2003Tree31.131.462.102.020.40-
Road0.8917.791.700.320.57-
Building0.571.8621.91-1.62-
Grass and cropland3.075.093.8011.972.35-
Bare ground0.651.461.210.814.37-
Water0.16----1.94
Table 3. Evaluation of urban tree services by year and green roof scenario.
Category200320122021Green Roof Scenario *
Sequestered annually in trees (CO2) (kt/yr)32.6630.6032.0932.84
Stored in trees (CO2) (kt)1045.84979.771027.621051.54
CO (t/yr)3.933.683.863.95
NO2 (t/yr)24.1622.6423.7424.29
O3 (t/yr)186.66174.86183.40187.67
PM10 (t/yr)44.0041.2243.2344.24
PM2.5 (t/yr)9.118.538.959.16
SO2 (t/yr)13.4412.5913.2013.51
Avoided Runoff (ML/yr)7.917.417.787.96
* Green roof scenario refers to a scenario whereby the area of eligible buildings for green roof installation (0.87 km2) was changed into tree areas in the 2021 land cover type classification.
Publisher’s Note: MDPI stays neutral with regard to jurisdictional claims in published maps and institutional affiliations.

