Article

Spatial Dynamics and Determinants of Population Urbanization in the Upper Reaches of the Yellow River

1
College of Economics, Northwest Normal University, Lanzhou 730070, China
2
College of Geography and Environmental Science, Northwest Normal University, Lanzhou 730070, China
*
Author to whom correspondence should be addressed.
Land 2022, 11(9), 1420; https://doi.org/10.3390/land11091420
Submission received: 9 June 2022 / Revised: 24 August 2022 / Accepted: 25 August 2022 / Published: 29 August 2022
(This article belongs to the Section Land Socio-Economic and Political Issues)

Abstract

:
The spatiotemporal evolution of population urbanization and its relationship with economic variables are important aspects of socioeconomic research and essential for revealing the mechanism of urban construction and evolution. To study the spatial heterogeneity and influencing mechanisms of population urbanization in the upper reaches of the Yellow River, this study investigated the spatial distribution and dynamic evolution of population urbanization using nuclear density analysis, exploratory spatial data analysis and the geographical detector model. The results showed that the rate of population urbanization in the upper reaches of the Yellow River increased annually since 2000 and that the nuclear density curve changed from a single–peaked mode in 2000 to a double–peaked mode in 2018. The spatial distribution of the population urbanization level was uneven, that is, high in the north and low in the south, with substantial spatial agglomeration and spatial autocorrelation. The main distribution of hot spots was in the Yinchuan area in the north, while cold spots were distributed mainly in the south. Analysis revealed that changes in population urbanization level were mainly attributable to the influence of economic and employment opportunities, such as regional GDP, GDP per capita, proportion of tertiary industry in GDP, and total retail sales of consumer goods.

1. Introduction

As the product of social development and the main part of economic progress, urbanization represents a new engine of economic growth and social development, and it has become one of the research hotspots in the fields of geography, economics, and sociology [1,2]. It is also a comprehensive issue of developing countries’ contemporary economic and social development [3], involving a series of issues such as coordinated development of the national economy, rational development, utilization of resources and the environment, and sustainable development [4]. The process of urbanization includes elements such as population urbanization, economic urbanization, social urbanization, and spatial urbanization [5], among which, population urbanization is fundamental [1]. Its essence is the transfer of population and economic factors from rural areas to cities and the improvement of population quality and living standards caused by productivity reform [1,6]. It reflects the gradual process of population gradually concentrating and the loss in space in cities [4,7] and plays an important part in promoting urban socioeconomic development [8].
Following the implementation of China’s reform and opening–up policies and the associated progress of the national economy, China’s level of urbanization entered a stage of rapid development, increasing at an average annual rate of 3.02% (1978–2019). In 2019, as the level of urbanization exceeded 60% for the first time, China preliminarily completed its transformation from a rural society to an urban society [9]. China’s level of urbanization has increased substantially; however, problems such as poor urbanization quality, inconsistent basic conditions, and uncoordinated development remain [10]. In addition to such problems, there are also spatial differences in urbanization level with an obvious distribution pattern of ‘high in the east and low in the west’ [11]. The problems outlined above affect the scale and process of national urban modernization and the relationship between urban and rural areas [12]. Since the 18th National Congress, the party and the state have proposed a different strategy for urbanization development that places people at the core and considers the connotation of quality as guidance. New urbanization has become an important component of China’s domestic policy, and systematic evaluation of human-centered population urbanization represents an important theoretical basis for the correct understanding of urbanization and the formulation of relevant policies [9]. Therefore, research on the spatial differences in population urbanization level is of great importance to the study of both the mechanism of interaction between urbanization and economic development and the process of urbanization. Much recent research in this field has been conducted from the perspective of evaluation of the quality of the population growth [4,5], spatial pattern [13,14], driving factors [15,16,17], impact of urbanization [18,19], sustainable development [20,21,22], role in regional development [23,24], and presumptive role in education or climate [25,26]. Especially in China, the level of attention on population urbanization increased recently [25], and most studies have focused on the economically developed areas nationally or in the east at the national, provincial, or other large regional scales [27], while research on population urbanization of undeveloped areas such as the upper reaches of the Yellow River remains inadequate [28].
The Yellow River Basin, which is an important ecological barrier and economic zone in China, plays a critical role in China’s socioeconomic development and ecological security [29]. It is situated in the arid and semiarid areas of Northwest China and is the main regional ecological corridor. It is not only an important area of implementation of China’s ‘Belt and Road’ strategy, but also a vital link between China and Central Asia, South Asia, and Europe. This region has a fragile ecological environment, changeable habitat conditions, frequent natural disasters, complex terrain, and a large rural population. Except for Inner Mongolia, the industrial foundation of other provinces is relatively weak, resulting in considerable spatial heterogeneity of the regional economy, which is in a comparatively weak position with respect to the national development pattern [30]. Therefore, using the research method of spatial correlation analysis and the geographic detector of geographic information technology, this study investigated the dynamics, spatial clustering, and spatiotemporal evolution of the regional level of urbanization in the upper reaches of the Yellow River Basin and examined the spatial distribution mechanism, evolution mechanism, and spatiotemporal effects of urbanization. This study has two primary objectives: (1) to clarify the spatial heterogeneity and dynamic spatial evolution characteristics of population urbanization in the upper reaches of the Yellow River and (2) to determine whether the urbanization level of the upper reaches of the Yellow River is affected by the economic conditions, industrial structure, regional conditions, and/or other factors. The findings of this study will provide an explanation of the driving mechanism of population urbanization in the upper reaches of the Yellow River, a prediction of the development trend of population urbanization and coordinated development of towns in the Yellow River, a reference for formulating new population urbanization development policies according to local conditions, and a guide with important practical relevance for realizing leapfrog development in the upper reaches of the Yellow River.

2. Study Area and Data Sources
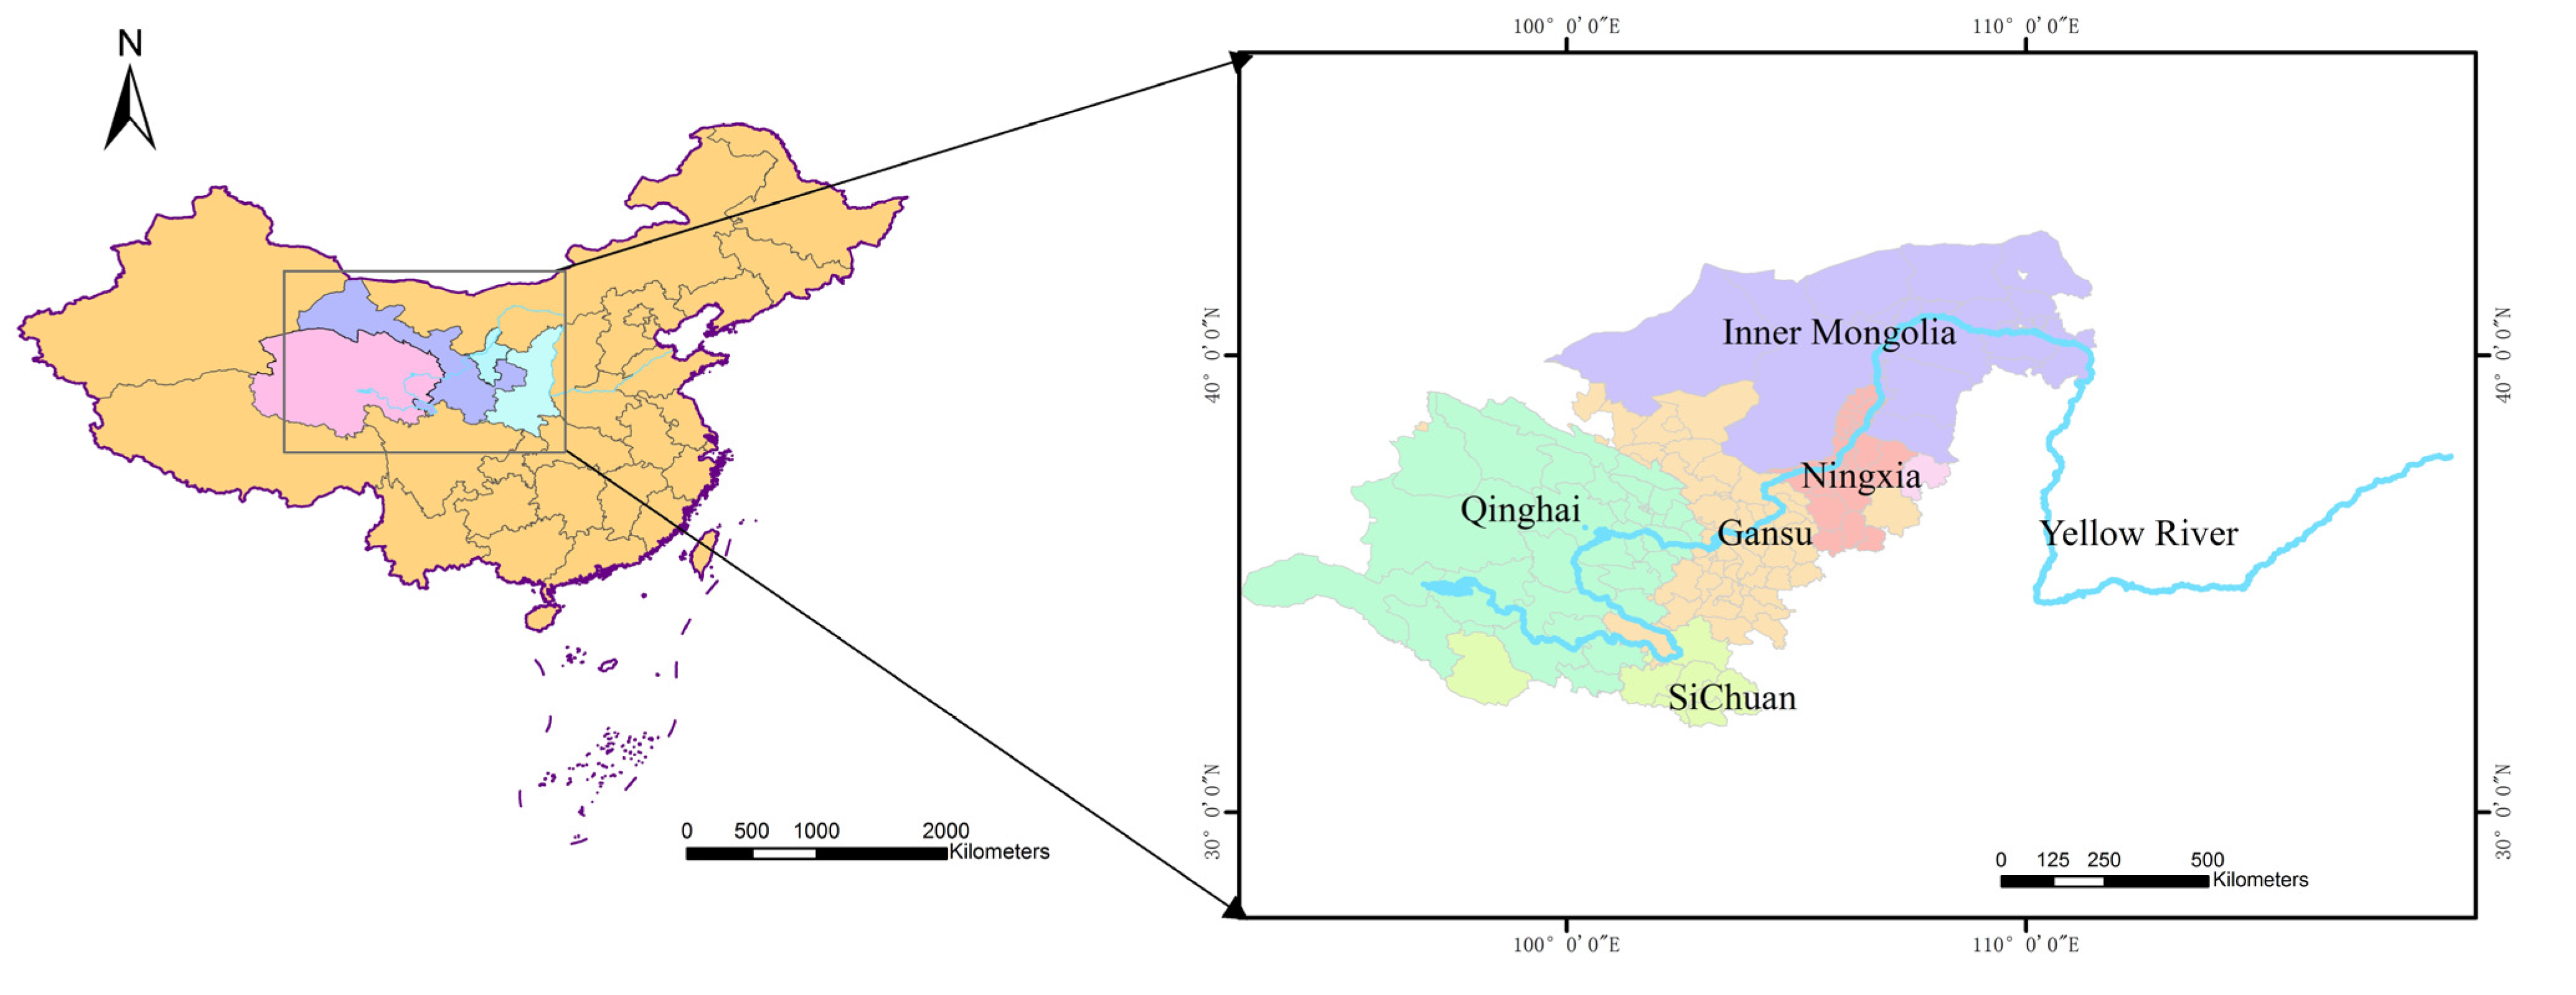
2.1. Study Area

The study area is situated in the upper reaches of the Yellow River Basin, China (Figure 1). The administrative region extends from the source area of the Yellow River to Hekou village, Tuoketuo County, Inner Mongolia, across the five provinces (autonomous regions) of Qinghai, Sichuan, Gansu, Ningxia, and Inner Mongolia. The watershed scope refers to the data source of Du Heqiang (http://westdc.westgis.ac.cn/, accessed on 10 February 2019) and was determined using the natural boundary of the administrative scope at the county level (location: 31°51′9″–42°44′4″ N, 92°55′43″–111°32′17″ E, elevation: 935–4987 m, total length of river reach: 3472 km, drainage area: 3.86 × 10⁵ km2). The river has a total drop in elevation of 3496 m and an average drop ratio of 1‰. The terrain of the study area is generally high in the west and low in the east, and the region is characterized by three zones of temperature: warm, cold, and high cold [31].

2.2. Data Source

On the basis of the 122 counties (districts) in Qinghai, Sichuan, Gansu, Ningxia, and Inner Mongolia, the main data set used in this paper was collected from China’s County Statistical Yearbooks, China’s City Statistical Yearbooks, and the Gansu Statistical Yearbook, Qinghai Statistical Yearbook, Sichuan Statistical Yearbook, Inner Mongolia Statistical Yearbook, and Ningxia Statistical Yearbook from 2000 to 2018. Some data were obtained from the Statistical Bulletin of National Economic and Social Development of cities (prefectures) and counties. The map data were obtained from the National Geographic Center, and some missing data were derived by interpolation.

3. Methodology

3.1. Research Design

In this study, the nuclear density analysis method was used to analyze the overall distribution of population urbanization and to clarify the evolutionary trend. Then, we used the exploratory spatial data analysis (ESDA) method to elucidate the spatial distribution and spatial dynamics of population urbanization. Finally, geodetector analysis was performed to reveal the driving factors behind the spatial differentiation of population urbanization. Nuclear density analysis was conducted using Stata 12.0 statistical software (StataCorp, College Station, TX, USA); ESDA was completed using ArcGIS 10.2 software (ESRI, Inc., Redlands, CA, USA). Geodetector analysis was conducted using Geodetector software (http://www.geodetector.org, accessed on 10 February 2019).
In order to describe the level of population urbanization, the population urbanization rate in this region is divided into five levels according to the division standard proposed by Fang Chuanglin [32]: high urbanization (80–100%), medium-high urbanization (60–80%), medium urbanization (30–60%), low-medium urbanization (15–30%), and low urbanization (1–15%).

3.2. Nuclear Density Analysis

The kernel density estimation method, which is a nonparametric estimation method that can effectively avoid the subjectivity of setting a function [33], was used to analyze the overall distribution and evolution trend of population urbanization. That is, the kernel density estimation method does not use the prior knowledge of the data distribution and does not attach any assumptions to the data distribution. It is a method to study the data distribution characteristics from the data samples themselves. Therefore, it has been highly valued in the statistical theory and application fields. It was proposed by Rosenblatt (1955) and Emanuel Parzen (1962), also known as Parzen window. The formula is expressed as follows:
f n x = 1 n h i = 1 n K x i x ¯ h
where n is the number of observation units, x ¯ is the mean value of the population urbanization level, xi is the population urbanization level of the ith county, K x i x ¯ h is the kernel function, and h is the bandwidth.

3.3. ESDA

ESDA is a set of tools or methods that can support deep understanding of the spatial distribution of data and help build a robust interpolation model. The approach is divided into global spatial autocorrelation and local spatial autocorrelation processes, and it was used to analyze the overall spatial difference and correlation degree of population urbanization in the study area. The specific formula is expressed as follows [34]:
Global spatial autocorrelation:
I = n i = 1 n j = 1 n w i j x i x ¯ x j x ¯ i = 1 n j = 1 n w i j i = 1 n x i x ¯ 2
and local spatial autocorrelation:
G i d = j = 1 n W i j d x j j = 1 n x i i j
Where n is the number of cities, xi and xj represent the population urbanization level of city i and j, respectively, x ¯ is the mean value of the population urbanization level, and Wij is the spatial weight matrix.

3.4. Model Construction and Geo Detector Analysis

The regression model explores the related driving factors of the research object at a certain scale, and it can be used to predict future results more accurately. According to other research [5], the formula can be expressed as follows:
Y = β 0 + j = 1 n β j x j + ε
where Y is the dependent variable (population urbanization), xj, is the independent variable (Table 1), β 0 is a constant term, β j is a coefficient of the variable xj, and ε is random error.
To detect spatial differentiation and reveal the underlying driving factors, we used the geographic detector. The geodetector is a statistical method based on the assumption of infinity, and it can be used to quantitatively detect whether a geographical factor affects the spatial distribution difference of an index value and its weight. The interactive detector calculates and compares the q value of each single factor and the q value after the superposition of two factors to determine whether there is interaction between the two factors and to discern the intensity of any interaction. The specific formulas are expressed as follows [35]:
q = 1 h = 1 n N h δ h 2 2 a N h δ 2 = 1 S S W S S T
S S W = h = 1 L N h δ h 2
S S T = N δ 2
where h = 1, …, L is the strata of variable Y or factor X, that is, classification or partition; N h and N are the number of units in layer h and the entire area, respectively; δ h 2 and δ 2 are the variance of layer h and Y value of the whole region, respectively; and SSW and SST are the sum of the intralayer variance and total variance of the entire region, respectively.
The interaction of factors identifies whether the interaction between factors increases or weakens the explanatory power of the analytical variables by detecting the q(Xi∩Xj) values [36]. When q(Xi∩Xj) < min (q(Xi), q(Xj)), then Xi and Xj are nonlinear weakening interaction types; when min (q(Xi), q(Xj)) < q(Xi∩Xj) < max (q(Xi), q(Xj)), then they are single-factor nonlinear weakening interaction types; when q(Xi∩Xj) > max (q(Xi), q(Xj)), they are two-factor interaction enhancement types; when q(Xi∩Xj) > q(Xi) + q(Xj), they have nonlinear enhancement; and when q(Xi∩Xj) = q(Xi) + q(Xj), the factors are mutually independent.

4. Results

4.1. Dynamic Evolution of Population Urbanization

The kernel density analysis of the population urbanization level in the upper reaches of the Yellow River (Figure 2) reveals that the nuclear density curves show a right–shift trend from 2000 to 2018, indicating that the population urbanization level in this region increased annually. The peak of the curve decreases and the wave width narrows, indicating that the difference in regional population urbanization showed a decreasing trend. The curves of 2000 and 2010 both show a single–peaked mode, and the peak of each is close to the low urbanization level, that is, distributed at around 17% and 21%, respectively, indicating that the population urbanization level of this region was concentrated at a low level at this stage. The curve of 2018 shows a double–peaked pattern with the peaks distributed at around 35% and 85%. The first peak is larger than the second peak, indicating an increasing number of counties with a high level of urbanization, but an overall number that was still less than that of counties with a low urbanization level. It shows that, although the level of population urbanization in the upper reaches of the Yellow River achieved certain progress, it remained at the low development level.

4.2. Temporal and Spatial Differentiation of Population Urbanization

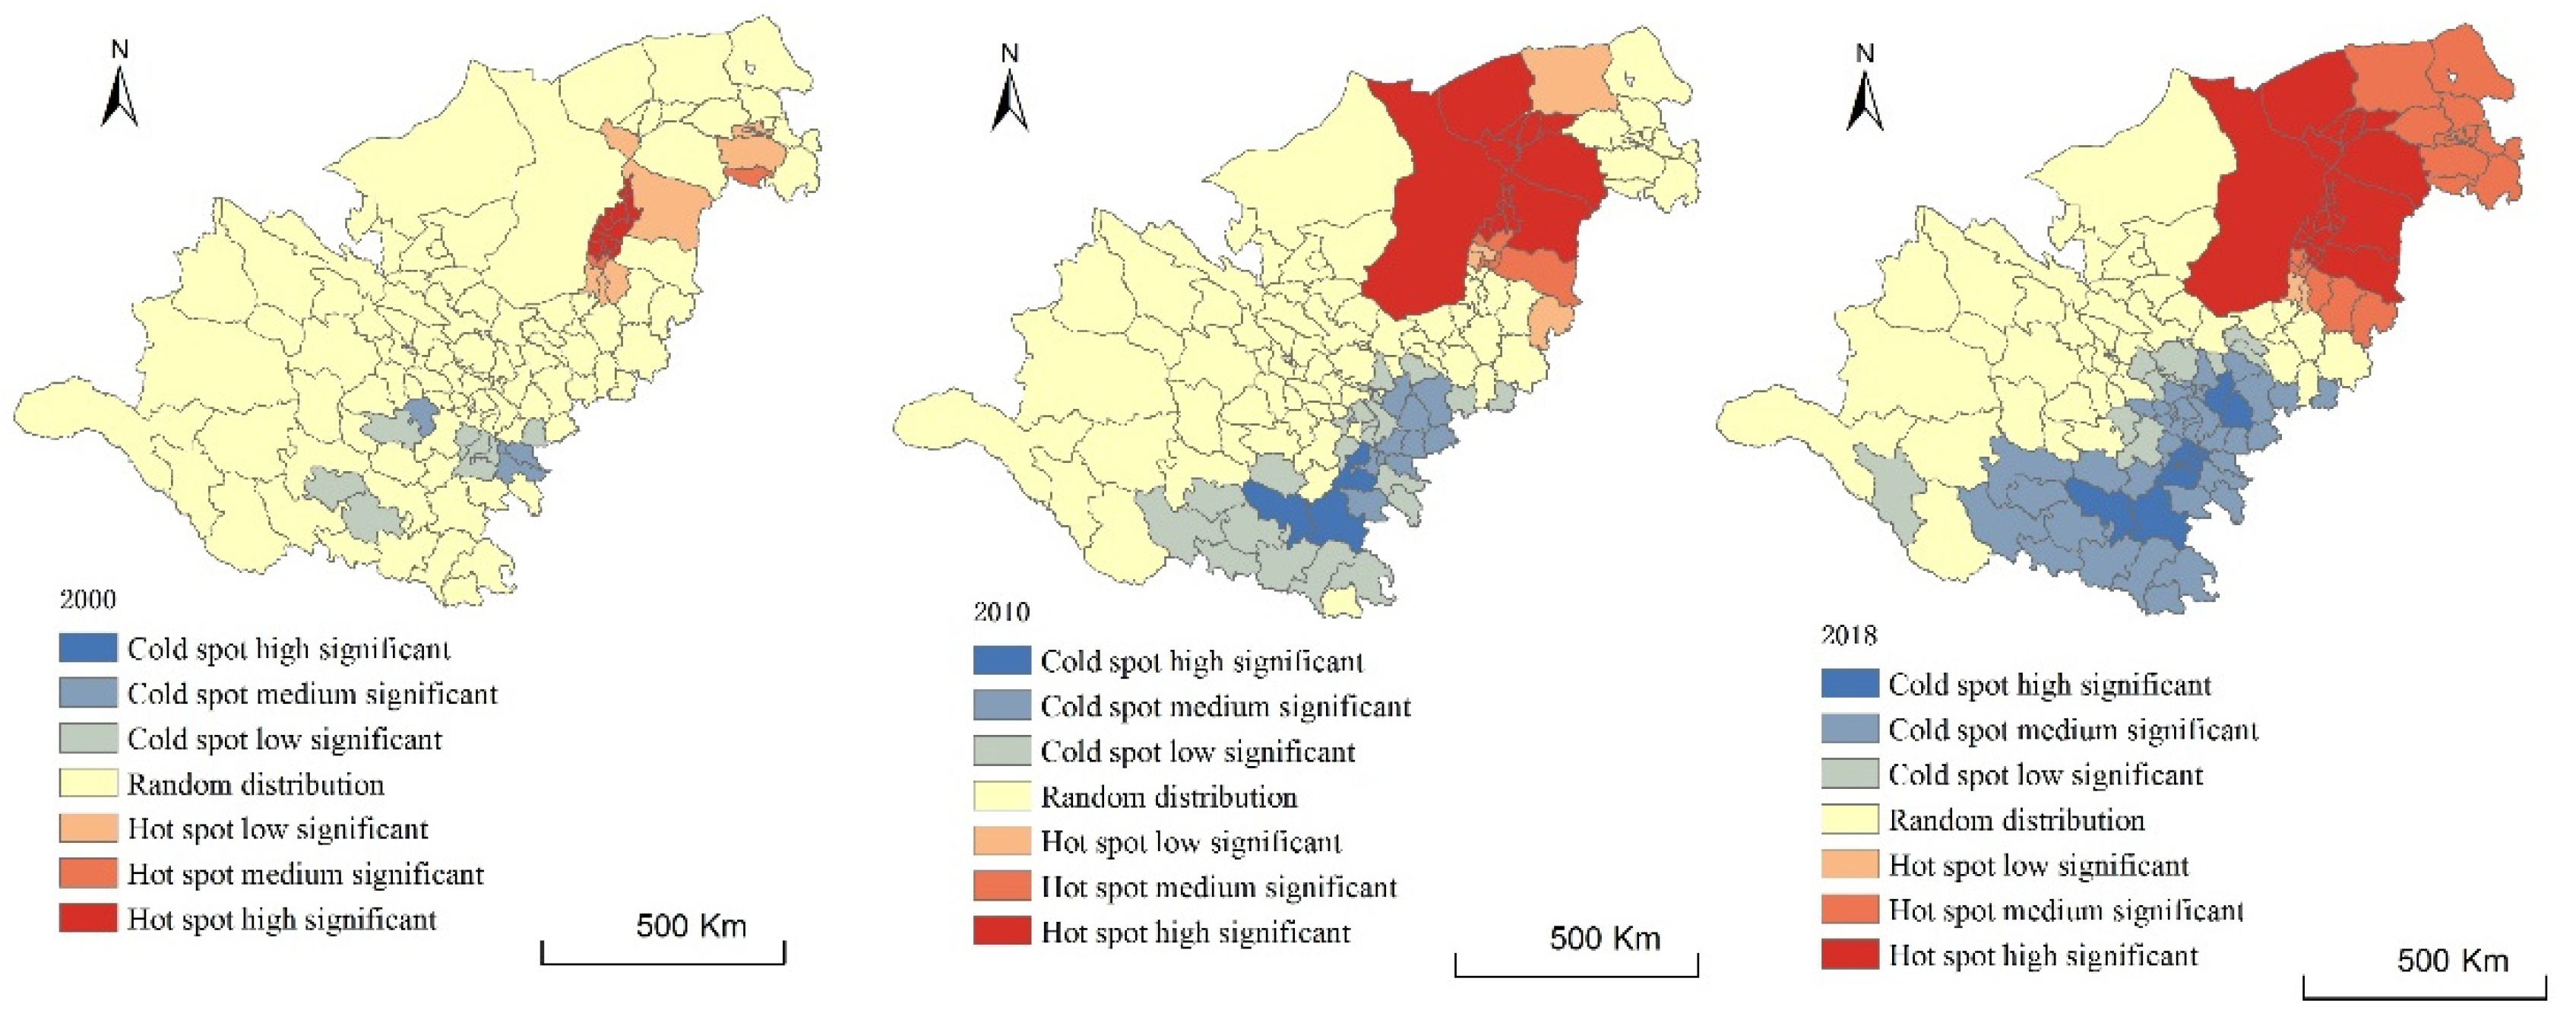
4.2.1. Hot Spot Distribution of Population Urbanization

We used ArcGIS to perform cluster analysis of hot spots of population urbanization level in the study region from 2000 to 2018. Which can create a map of statistically significant hot and cold spots. The hot spots mean that high values of population urbanization cluster at this position, and the cold spots mean the low values of population urbanization cluster at these places, while the random spots mean there is no clustering trend. The results reveal that population urbanization in the upper reaches of the Yellow River was characterized by a random distribution and that the number of randomly distributed counties (districts) showed a trend of decrease with time (Figure 3). The distribution pattern of the hot spots of population urbanization level in this region changed little over time, with the greatest distribution in urban circles centered on the Yinchuan, Lanzhou, and Xining areas. Which means that the population urbanization levels in these places were high and clustered significantly.Conversely, the distribution pattern of cold spots changed significantly. In 2000, the greatest distribution was in Huan County, Yuanzhou District, Xiji County, Huining County, Weiyuan County, Zhuoni County, Lintan County, Min County, and other counties, with a significant concentration of cold spots in Kangle County, Weiyuan County, and Anding District; In 2010, the distribution of cold spots moved to Maduo County, Maqin County, Dari County, Jiuzhi County, Maqu County, Ruoergai County, Diebu County, and other counties (districts) in the south, forming a V–type cold spot distribution area, with a significant concentration of cold spots in Jiuzhi County, Kangle County, Weiyuan County, and other counties (districts). In 2018, the distribution of cold spots continued to move toward the south and west, and cold spot areas such as Anding District and Tongwei County in the east weakened and developed into a random distribution of cold spot areas centered on Maduo County, Maqin County, Dari County, and Jiuzhi County. Areas with a significant concentration of cold spots focused on areas in Maduo County, Maqin County, Dari County, and Jiuzhi County. The results show that the cold spots of population urbanization level are mostly concentrated in areas of ethnic minorities with a low economic level; therefore, economic level might be one of the factors that affect the urbanization rate.

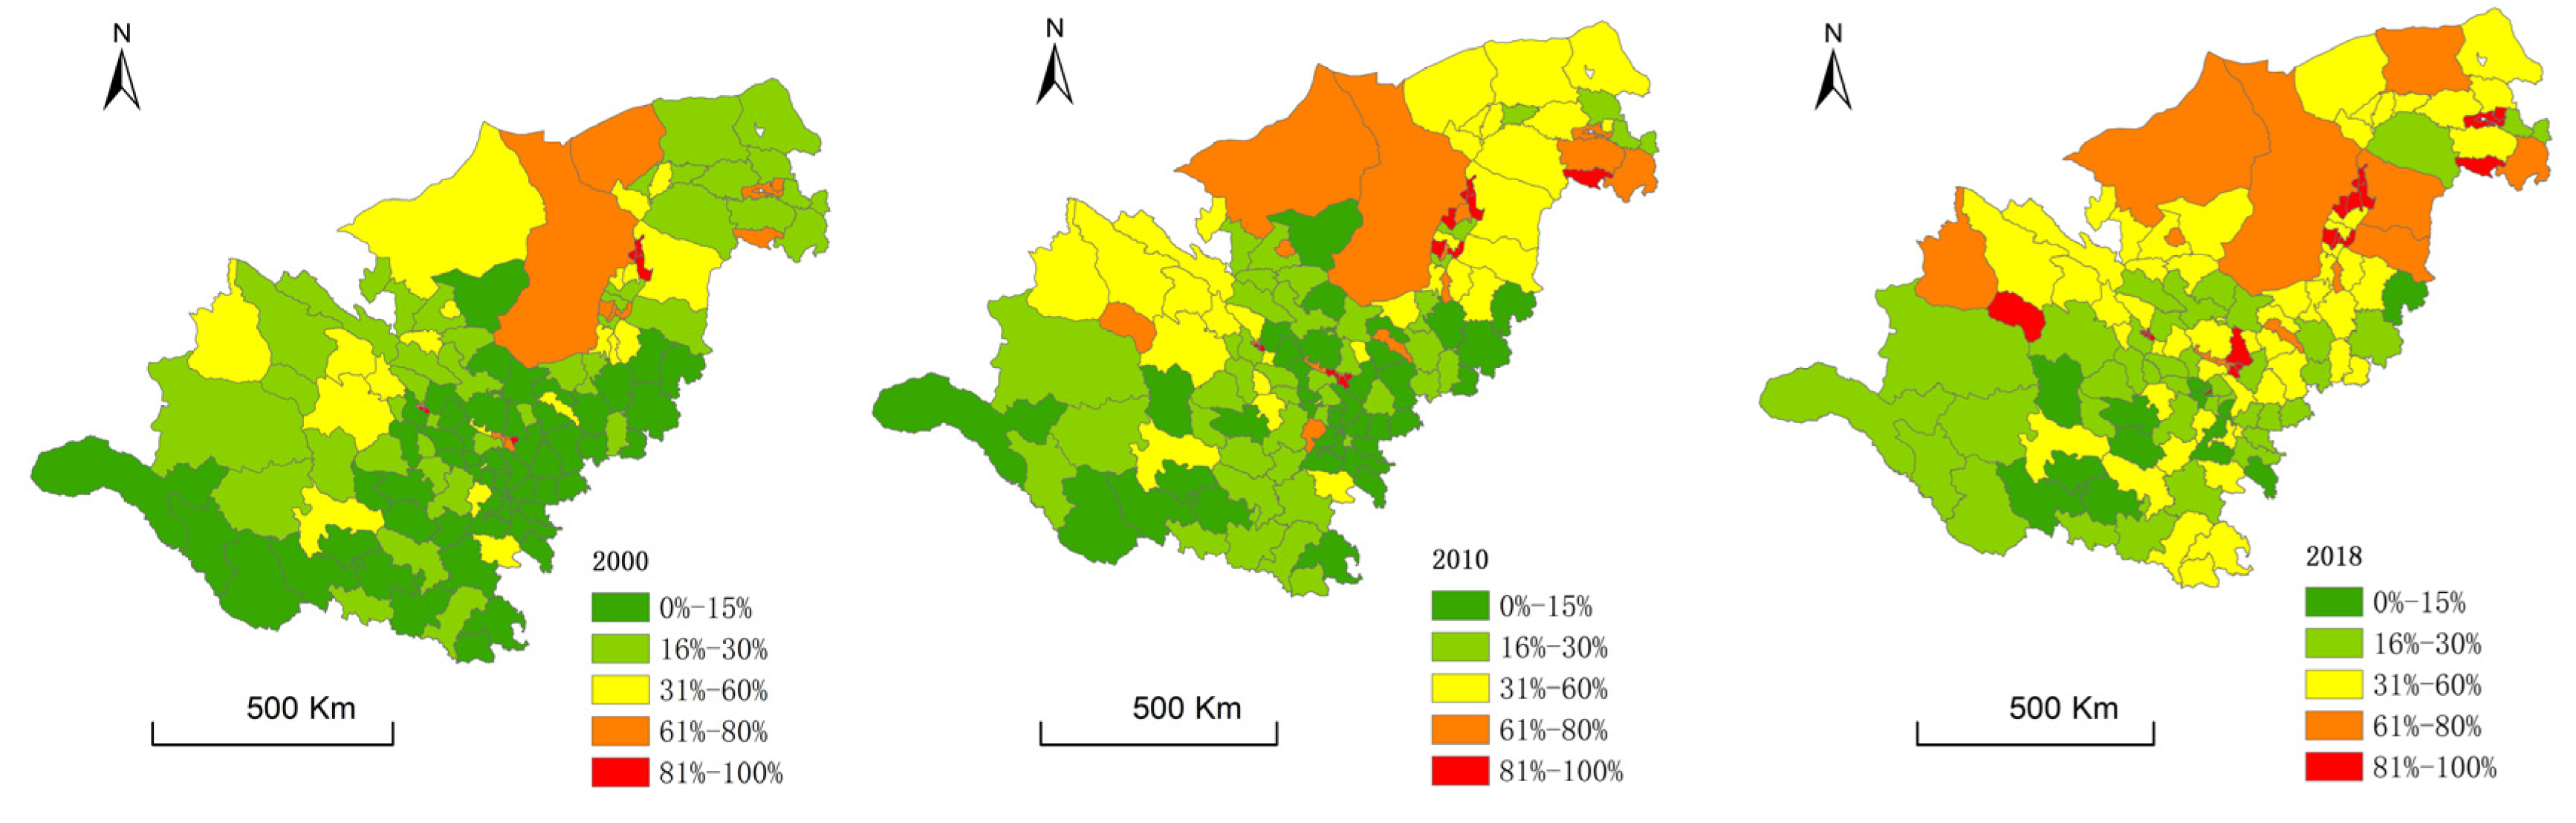
4.2.2. Overall Differentiation Characteristics of Population Urbanization

The classification function of ArcGIS was used to analyze the population urbanization level in the study region (2018). The results show that the counties(districts) with a medium urbanization level accounted for 39.13% of the total; those with a low–medium urbanization level accounted for 27.54%; those with a high urbanization level accounted for 15.94%; and those with a medium–high urbanization level and low urbanization level jointly accounted for 17.39% (Figure 4). The population urbanization level in the north of the region was higher than that in the south, and the overall trend indicated decrease from north to south. The counties (districts) with a high population urbanization level were mostly distributed around provincial capitals such as Yinchuan, Lanzhou, and Xining. An area of medium–high urbanization level with radius of approximately 300 km developed with Yinchuan at it center, and it extended as far as Otok qi, Alxa zuoqi, Alxa youqi, and the Bronze Gorge city. By contrast, the extent of an area of medium–high urbanization level centered on Lanzhou was smaller, covering only the urban areas of Lanzhou and Gaolan County. An area of high urbanization level formed only in the urban area of Xining. The counties with low–medium urbanization levels and low urbanization levels were mostly distributed in Xinghai County, Zeku County, Dari County, Jiuzhi County, and other areas of ethnic minorities in the south. This result show that Yinchuan has strong radiation capacity and good agglomeration ability, while the radiation capacity of population urbanization in Lanzhou and Xining is poor. Considering that the urbanization level of areas of ethnic minorities is generally low, the location factor might be one of the factors that affect the urbanization rate.

4.2.3. Spatial Correlation of Population Urbanization Level

The global spatial autocorrelation of the population urbanization rate in the upper reaches of the Yellow River was analyzed. The results show that the values of the global autocorrelation Moran’s I index in 2000, 2010, and 2018 were 0.34 (p < 0.05), 0.37 (p < 0.05), and 0.46 (p < 0.05), respectively, indicating that the spatial distribution of the population urbanization rate in this region is not random, that is, it exhibits significant spatial autocorrelation. The value of the Moran’s I index changed with time and increased annually, indicating that the spatial autocorrelation of the population urbanization level in this region is increasing year by year. Local spatial autocorrelation analysis reveals that the level of regional population urbanization exhibits spatial agglomeration and substantial differences in terms of spatial distribution (Figure 5). High–high agglomeration areas were mainly distributed in the north of the region and low–low agglomeration areas were mainly distributed in the south of the region. From 2000 to 2018, there was little interannual change in the high–high concentration areas, but significant change in the low–low concentration areas with scope expanding to the west and north. Analysis of the spatial distribution revealed that the high–high concentration areas were mostly distributed around Yinchuan and the low–low concentration areas were mostly distributed in the south of the area. In 2000, the numbers of counties with high–high, high–low, low–high, and low–low agglomeration were 17, 12, 1, and 27, respectively, which changed to 22, 12, 1, and 38 in 2010 and 24, 11, 4, and 37 in 2018, respectively. It indicates that the spatial pattern of the population urbanization level is uneven and that the counties with high urbanization levels are adjacent to each other, with little change year by year. The number of low–low agglomeration counties was increasing, and they were mainly distributed in areas of ethnic minorities such as Chengduo County, Shiqu County, Dari County, Gande County, Maqu County, Ruoergai County, ABA County, and Hongyuan County in the south, indicating concentration of counties with low urbanization levels. The counties with high–low agglomeration patterns were mainly distributed in Lanzhou, Xining, and Wulan counties, and the overall number hardly changed, indicating that the radiation–driving ability of these regions is small.

4.3. Analysis of Influencing Factors of Population Urbanization

The dominant factors of the spatial variation of population urbanization in the upper reaches of the Yellow River and provincial regions were analyzed using the geodetector method. The results, presented in Table 2, show that the spatial difference of population urbanization level in the upper reaches of the Yellow River was mainly affected by regional GDP (current year price) (x1), per capita regional GDP (x2), the proportion of tertiary industry in GDP (x4), total retail sales of social consumer goods (x6), and the total amount of telecom services (x11). On the provincial scale, Inner Mongolia was mainly affected by several factors, such as regional GDP (current year price) (x1), per capita regional GDP (x2), the proportion of secondary industry in GDP (x3), total investment in fixed assets (x5), total retail sales of social consumer goods (x6), the general budget expenditure of local finance (x7), average wage of employees (x8), and the per capita green area (x13); Ningxia was mainly affected by the proportion of secondary industry in GDP (x3), the proportion of tertiary industry in GDP (x4), the number of beds in hospitals and health centers (x10), and the total amount of telecom services (x11). Gansu was mainly affected by the proportion of tertiary industry in GDP (x4), the number of ordinary middle schools (x9), and the total amount of telecom services (x11). Qinghai was mainly affected by factors such as per capita regional GDP (x2), the proportion of secondary industry in GDP (x3), and the total amount of telecom services (x11).
The interactive detection analysis of the driving factors shows that the interaction of any two factors is greater than the influence of any single factor and that most of the interaction types belong to the nonlinear enhanced type, indicating that the cause of the spatial differentiation of urbanization rate in this region is not a single factor, but the result of the joint action of multiple factors (Table 3). The interaction of per capita regional GDP (x2) and the proportion of secondary industry in GDP (x3) has the highest impact on urbanization. Furthermore, the interaction of total investment in fixed assets (x5) and the general budget expenditure of local finance (x7) belong to the two-factor enhanced type, indicating that these two factors might enhance each other in this region.

5. Discussion

5.1. Analysis of the Dynamic Evolution and the Spatial Distribution of Population Urbanization

Owing to its reform and opening–up policies, China has become one of the countries with the fastest economic development. Correspondingly, the level of population urbanization has been steadily increasing, and it has become a new engine of economic growth and social development. Because of historical differences in the natural environment and socioeconomic development of various regions, the spatial difference in population urbanization level is very large [12]. The results of this research are consistent with those of previous, related studies [37]. The population urbanization level in the upper reaches of the Yellow River is generally lower than that of eastern China, and it is mainly concentrated in the medium or low–medium population urbanization levels. The spatial difference in population urbanization level is substantial; it exhibits a trend of high in the north and low in the south, and there are significant phenomena in terms of spatial agglomeration and spatial autocorrelation. This could be attributable to a number of causes. First, the region, which plays the role of the main area of supply of ecological service functions in China, has a fragile ecosystem, obvious regional differentiation, complex weather conditions, and a minimal level of infrastructure. Except for Inner Mongolia, the fiscal foundation of other regions is relatively weak. Following the implementation of the reform and opening–up policies, the gap in the level of socioeconomic development between this region and the eastern or other central regions of China has been widening. Moreover, there are considerable differences in the socioeconomic development of the internal counties in the region, which lead to an increase in the spatial difference of the population urbanization level. Thus, the dynamic evolution of population urbanization showed a single–peaked mode in 2000 and a double–peaked mode in 2018. Second, the process of population urbanization is not only a meaningful process of social and economic change but also a process of diffusion of urban culture, such as lifestyle and values, to the rural areas. Qinghai, southern Gansu, and other regions in the study region are pastoral areas where traditionally Tibetan and other ethnic minorities gather. Affected by traditional regional culture and living habits, ethnic minorities generally have low enthusiasm for entering the cities, resulting in a slow process of population urbanization and a low development level of regional population urbanization. Third, affected by the differences of national macroscale policies and regional economic development, the better economic development conditions of Inner Mongolia and Ningxia lead to notably greater economic development than that of Gansu and Qinghai. Economic development is the principal driving mechanism of increased population urbanization. Therefore, a high-level agglomeration area of population urbanization has developed in Yinchuan. Forth, the progress of population urbanization in the study region has spatial dependence, which could be attributable to the radiation effect of urbanization. Improvements of the economic level and the human capital level have a positive spillover effect on the population urbanization of surrounding areas. Therefore, to a certain extent, regional population urbanization exhibits spatial correlation.

5.2. Analysis of the Determinants of Population Urbanization

Population urbanization is an indication of social progress and of economic development. It has gradually become a necessary means for underdeveloped countries to seek progress and national revitalization [3]. Population urbanization is related not only to migration of the rural population to urban areas, but also to various livelihood issues, such as regional economic development, social transformation, and improved quality of life [11]. In this study, socioeconomic factors, such as regional GDP, per capita regional GDP, the proportion of tertiary industry in GDP, total retail sales of social consumer goods and total telecom services, environmental development factors, industrial structure factors, and location factors have been shown to be the influencing factors of regional population urbanization in the upper reaches of the Yellow River, resulting in the spatial difference of the population urbanization level. There are several reasons that can account for these findings. Frist, cities and towns with better regional GDP and urban location conditions have relatively large urban scales, strong comprehensive competitiveness, and high levels of economic development, allowing them to become agglomeration centers of the regional economy. According to Romer’s view on technological externality, high-tech intensive industries have stronger positive externality and scale effects and endogenous spatial agglomeration and scale effects [38]. Under the actions of the urban agglomeration effect and the spillover effect, the level of regional population urbanization can be increased substantially. Second, cities with better basic economic and social conditions such as total investment in fixed assets, expenditure in the general budget of local finance, education conditions, hospital conditions, and total telecom services, as well as cities with better environmental conditions such as higher per capita green space area, perfect urban road conditions and per capita built-up area, and perfect public services and better livability will attract inflow of labor, expand the scale of the city, and improve the actual income and welfare level of the population. Additionally, the education level in urban areas is higher than that in rural areas, which can improve the human capital level of the labor force and bring about future improvement in expected (or actual) income [39]. Especially in poor areas, many people can change their destiny through education. The expected income of the rural labor force is higher in cities and towns with better per capita regional GDP, total retail sales of social consumer goods, and average wage of employees, leading to the continuous flow of rural labor to cities. Third, the key to the development of urbanization lies in the rapid growth of the service industry and the upgrading of the employment structure [40]. Because the urban migrant population is mainly engaged in secondary and tertiary industries, the expansion of the proportion of secondary and tertiary industries will lead to surplus labor in primary industries and shortage of labor in secondary and tertiary industries, further encouraging the transfer of the rural population to cities and towns. Therefore, the development of secondary and tertiary industries and the gap between economic levels are important factors that affect population urbanization. In a certain period, the growth of the proportion of secondary and tertiary industries forms the driving force of regional population urbanization.

6. Conclusions

This study has discussed the dynamics and determinants of population urbanization using the research methods of nuclear density analysis, ESDA, and the geodetector model and obtained the parameters of population urbanization evolution and development models by simulation analysis. According to analysis of the parameters, we find that the level of population urbanization in the upper reaches of the Yellow River increased annually since 2000 and the distribution type changed from a single-peaked mode in 2000 to a double-peaked mode in 2018. Moreover, the spatial distribution of population urbanization is extremely uneven; there is a prominent phenomenon of clustering, with hot spots mainly distributed in Yinchuan in the north and cold spots mainly distributed in Jiuzhi County, Kangle County, and Weiyuan County in the south. Changes in population urbanization level are mainly attributable to the influences of economic and employment opportunities, such as the factors of regional GDP, GDP per capita, proportion of tertiary industry in GDP, and the total retail sales of consumer goods. The findings of this study may help in guiding future planning and policy making for the improvement of population urbanization.

Author Contributions

Conceptualization, L.Z.; methodology, L.Z. and J.H.; software, J.H.; validation, L.Z.; formal analysis, J.H.; investigation, J.H.; resources, L.Z.; data curation, C.Z.; writing—original draft preparation, L.Z.; writing—review and editing, C.Z.; visualization, L.Z.; supervision, C.Z.; project administration, L.Z.; funding acquisition, L.Z. All authors have read and agreed to the published version of the manuscript.

Funding

This research was financially supported by the Scientific Research Projects of Colleges and Universities in Gansu Province (Grant No: 2020B-085) and the Science and Technology Plan Project of Gansu Province (Grant No: 21CX6ZA011).

Institutional Review Board Statement

Not applicable.

Informed Consent Statement

Not applicable.

Data Availability Statement

Not applicable.

Acknowledgments

Thank you to everyone who contributed to this study.

Conflicts of Interest

The authors declare no conflict of interest.

References

  1. Atack, J.; Margo, R.A.; Rhode, P.W. Industrialization and urbanization in nineteenth century America. Reg. Sci. Urban Econ. 2022, 94, 1–11. [Google Scholar] [CrossRef]
  2. Malcolm, A.M. Energy Use Patterns in Georgia as They Relate to Population, Urbanization, and Quality-of-Life. Southeast. Geogr. 2013, 22, 20–34. [Google Scholar]
  3. Cohen, B. Urbanization in developing countries: Current trends, future projections, and key challenges for sustainability. Technol. Soc. 2006, 28, 63–80. [Google Scholar] [CrossRef]
  4. Henderson, V. Urbanization in Developing Countries. World Bank Res. Obs. 2002, 17, 89–112. [Google Scholar] [CrossRef]
  5. Henderson, V. The Urbanization Process and Economic Growth: The So-What Question. J. Econ. Growth 2003, 8, 47–71. [Google Scholar] [CrossRef]
  6. Carter, S.B.; Gartner, S.S.; Haines, M.R.; Olmstead, A.L.; Sutch, R.; Wright, G.; Cain, L.P. Historical Statistics of the United States Millennial Edition Online; Cambridge University Press: Cambridge, UK, 2006. [Google Scholar]
  7. Partridge, M.D.; Rickman, D.S.; Ali, K.; Olfert, M.R. Lost in space: Population growth in the American hinterlands and small cities. J. Econ. Geogr. 2008, 8, 727–757. [Google Scholar] [CrossRef]
  8. Gallman, R.E.; Rhode, P.W. Capital in the Nineteenth Century; The University of Chicago Press: Chicago, IL, USA; London, UK, 2019. [Google Scholar]
  9. Li, P.L.; Chen, G.J.; Wang, C.G. Analysis and Prediction of China’s Social Situation in 2020; Social Science Literature Press: Beijing, China, 2020. [Google Scholar]
  10. Zhou, Y.X. Thoughts on the speed of China’s urbanization. City Plan. Rev. 2007, 3, 32–35, 40. [Google Scholar]
  11. Qin, J.; Li, L.M. Spatial differences and influencing factors of population urbanization in China. Popul. Res. 2013, 37, 25–40. [Google Scholar]
  12. Lu, D.D. Research content framework of Geography in the field of Urbanization. Sci. Geogr. Sin. 2013, 33, 897–901. [Google Scholar]
  13. Rahimi, F.; Sadeghi-Niaraki, A.; Ghodousi, M.; Choi, S.M. Modeling Population Spatial-Temporal Distribution Using Taxis Origin and Destination Data. Sustainability 2021, 13, 3727. [Google Scholar] [CrossRef]
  14. Kassouri, Y.; Okunlola, O.A. Analysis of spatio-temporal drivers and convergence characteristics of urban development in Africa. Land Use Policy 2022, 112, 105868. [Google Scholar] [CrossRef]
  15. Davis, J.C.; Henderson, J.V. Evidence on the political economy of the urbanization process. Rev. J. Urban Econ. 2004, 53, 98–125. [Google Scholar] [CrossRef]
  16. Boustan, L. Urbanization in American economic history, 1800–2000. In The Oxford Handbook of American Economic History; Oxford University Press: Oxford, UK, 2018; Volume 2, pp. 74–100. [Google Scholar]
  17. Usui, R.; Funck, C.; Adewumi, I.B. Tourism and Counterurbanization in a Low-Amenity Peripheral Island: A Longitudinal Study at Yakushima Island in Kagoshima, Japan. Sustainability. 2021, 13, 1–21. [Google Scholar]
  18. Fikir, S. Econometric Analysis of the Effect of Urbanization on Energy Security in Africa: Evidence from Panel Data for Selected African Countries. J. Exp. Theor. Phys. 2020, 10, 13–21. [Google Scholar]
  19. Satterthwaite, D.; Mcgranahan, G.; Tacoli, C. Urbanization and its implications for food and farming. Philos. Trans. R. Soc. Lond. Ser. B Biol. Sci. 2018, 365, 2809–2820. [Google Scholar] [CrossRef] [PubMed]
  20. Kousar, S.; Ahmed, F.; Pervaiz, A.; Bojnec, Š. Food Insecurity, Population Growth, Urbanization and Water Availability: The Role of Government Stability. Sustainability 2021, 13, 12336. [Google Scholar] [CrossRef]
  21. Rasoolimanesh, S.M.; Badarulzaman, N.; Jaafar, M. City development strategies (CDS) and sustainable urbanization in developing world. Procedia-Soc. Behav. Sci. 2012, 36, 623–631. [Google Scholar] [CrossRef]
  22. Abubakari, M.M.; Anaman, K.A.; Ahene-Codjoe, A.A. Urbanization and Arable Land Use in Northern Ghana: A Case Study of the Sagnarigu Municipality in the Greater Tamale Area. Appl. Econ. Financ. 2022, 9, 68–84. [Google Scholar] [CrossRef]
  23. Yang, X. City size and the economic impacts of urbanization and citizenization: Quantitative analysis of productivity and amenity differences among Chinese cities. China Econ. Q. 2017, 16, 1601–1620. [Google Scholar]
  24. Fehr, M.; Fernandes, K. The Challenge of Attaining Satisfactory Urban Life in Social Housing Programs. J. City Dev. 2021, 3, 101–105. [Google Scholar]
  25. Ye, L.; Zeng, G.; Wang, Y. The influence of population urbanization and urban-rural development gap on education urbanization. Econ. Surv. 2019, 36, 9–15. [Google Scholar]
  26. Kalnay, E.; Cai, M. Impact of urbanization and land-use change on climate. Nature 2003, 423, 528. [Google Scholar] [CrossRef] [PubMed]
  27. Wang, D.G.; Sun, F. Geographic patterns and coupling-coordination between urbanization and land transportation accessibility in the Yangtze River Economic Zone. Sci. Geogr. Sin. 2018, 38, 1089–1097. [Google Scholar]
  28. Hu, D.X.; Pan, J.H.; Li, Y. Space dynamic analysis of population urbanization in Gansu province based on ESDA-GWR. Popul. Dev. 2015, 21, 41–49, 67. [Google Scholar]
  29. Xi, J.P. Speech at the symposium on ecological protection and high-quality development in the Yellow River Basin. Water Conserv. Constr. Manag. 2019, 39, 1–3+6. [Google Scholar]
  30. Lei, Z.M. Economic Analysis and Evaluation of the Sustainable Development of the Yellow River; China Environmental Science Press: Beijing, China, 2009. [Google Scholar]
  31. Pei, Z.L.; Yang, Q.K.; Wang, C.M.; Pang, G.W.; Yang, L.H. Spatial distribution of vegetation coverage and its affecting factors in the upper reaches of the Yellow River. Arid Zone Res. 2019, 36, 546–555. [Google Scholar]
  32. Wang, Y.; Fang, C.L.; Wang, Z.B. The study on comprehensive evaluation and urbanization division at county level in China. Geogr. Res. 2012, 31, 1305–1316. [Google Scholar]
  33. Okabe, A.; Satoh, T.; Sugihara, K. A kernel density estimation method for networks, its computational method and a GIS-based tool. Int. J. Geogr. Inf. Sci. 2009, 23, 7–32. [Google Scholar] [CrossRef]
  34. Cliff, A.D.; Ord, J.K. Spatial Autocorrelation; Pion: London, UK, 1973. [Google Scholar]
  35. Wang, J.F.; Xu, C.D. Geodetector: Principle and prospective. Acta Geogr. Sin. 2017, 72, 116–134. [Google Scholar]
  36. Wang, J.F.; Hu, Y. Environmental health risk detection with GeogDetector. Environ. Model. Softw. 2012, 33, 114–115. [Google Scholar] [CrossRef]
  37. Gu, C.L.; Guan, W.H.; Liu, H.L. Chinese urbanization 2050: SD modeling and process simulation. Sci. Sin. (Terrae) 2017, 47, 818–832. [Google Scholar] [CrossRef]
  38. Romer, P.M. Increasing returns and long-run growth. J. Political Econ. 1986, 94, 1002–1037. [Google Scholar] [CrossRef]
  39. Lucas, R.E. Life earnings and rural-urban migration. J. Political Econ. 2004, 112, 29. [Google Scholar] [CrossRef] [Green Version]
  40. Cao, G.Z.; Liu, T. Dynamic mechanism of urbanization and its evolution in post-reform China. China Soft Sci. 2010, 9, 86–95. [Google Scholar]
Figure 1. Location of the study area.
Land 11 01420 g001
Figure 2. Evolution of urbanization level.
Land 11 01420 g002
Figure 3. Cluster patterns of population urbanization.
Land 11 01420 g003
Figure 4. Spatial distribution of population urbanization.
Land 11 01420 g004
Figure 5. Lisa agglomeration of population urbanization.
Land 11 01420 g005
Table 1. Definition of annotation.
NotesDefinition
x1Regional GDP (current year price)
x2Per capita regional GDP
x3Proportion of secondary industry in GDP
x4Proportion of tertiary industry in GDP
x5Total investment in fixed assets
x6Total retail sales of social consumer goods
x7Expenditure within the general budget of local finance
x8Average wage of employees
x9Number of ordinary middle schools
x10Number of beds in hospitals and health centers
x11Total amount of telecom services
x12Per capita urban road area
x13Per capita green area
Table 2. Maximum q value of single-factor action at different spatial scales.
x1x2x3x4x5x6x7
Whole region0.43 *0.64 *0.350.45 *0.270.37 *0.20
Inner Mongolia0.86 *0.99 *0.81 *0.420.71 *0.67 *0.81 *
Ningxia0.360.400.60 *0.97 *0.430.310.37
Gansu0.280.330.550.96 *0.360.220.29
Qinghai0.510.84 *0.79 *0.450.160.10.15
x8x9x10x11x12x13
Whole region0.220.240.230.35 *0.250.26
Inner Mongolia0.72 *0.100.140.310.270.73 *
Ningxia0.460.570.67 *0.74 *0.420.05
Gansu0.390.82 *0.630.70 *0.340.01
Qinghai0.110.260.230.94 *0.160.09
Notes: * p < 0.05. GDP (x1), per capita regional GDP (x2), proportion of secondary industry in GDP (x3), proportion of tertiary industry in GDP (x4), total investment in fixed assets (x5), total retail sales of social consumer goods (x6), expenditure within the general budget of local finance (x7), average wage of employees (x8), number of ordinary middle schools (x9), number of beds in hospitals and health centers (x10), total amount of telecom services (x11), per capita urban road area (x12), per capita green area (x13).
Table 3. The q value of the interaction detector.
Xi∩Xjq(Xi∩Xj)Interaction TypeXi∩Xjq(Xi∩Xj)Interaction Type
1–30.79Nolinear enhance3–110.88Nolinear enhance
1–40.87Nolinear enhance3–80.78Nolinear enhance
1–90.73Nolinear enhance3–90.72Nolinear enhance
1–110.77Nolinear enhance3–100.77Nolinear enhance
2–30.90Nolinear enhance3–120.89Nolinear enhance
2–40.89Nolinear enhance4–50.80Nolinear enhance
2–50.73Nolinear enhance4–60.76Nolinear enhance
2–90.78Nolinear enhance4–100.72Nolinear enhance
2–110.84Nolinear enhance4–110.78Nolinear enhance
2–120.82Nolinear enhance4–120.82Nolinear enhance
2–130.76Nolinear enhance4–130.81Nolinear enhance
3–40.70Nolinear enhance5–70.61Two factors enhance
3–50.77Nolinear enhance9–110.62Nolinear enhance
3–60.78Nolinear enhance10–110.68Nolinear enhance
3–70.72Nolinear enhance11–130.71Nolinear enhance
Note: the data shown here are significant (p < 0.05); other data that are not significant are not shown.
Publisher’s Note: MDPI stays neutral with regard to jurisdictional claims in published maps and institutional affiliations.

