Abstract
Land-use transition (LUT) refers to the change in the land-use form corresponding to the regional economic and social development. At different stages of LUT, changes in the land-use scale and structure may lead to carbon source transfer by affecting industrial transfer and carbon sinks, resulting in changes in the total carbon emission transfer (CET) from the land use in the whole region. The clarification of the relationship between LUT and CET is of great importance for the sustainable development of the regional economy and society and the realization of carbon peak and carbon neutrality. In this paper, we firstly conducted a theoretical analysis of the nonlinear relationship between LUT and CET, then took the Middle Reaches of the Yangtze River in China as an example to explore the characteristics of LUT and CET, and finally constructed a threshold regression model to verify their nonlinear relationship. The following main findings were obtained. (1) From 2000 to 2020, profound LUT had occurred in the Middle Reaches of the Yangtze River, with continuous decreases in farmland, substantial increases in construction land, and a first decrease and then increase in forest land; farmland is the main contributor to construction land and forest with a contribution rate exceeding 60%. (2) During the study period, the CET in the Middle Reaches of the Yangtze River exhibited certain regular characteristics. The phase characteristics of the carbon sink changes follow an intensification–moderation–reintensification–remoderation pattern, and those of the carbon source transfer and net carbon emissions follow an intensification–reintensification–moderation–remoderation pattern. In addition, carbon sink changes are far from enough to offset the effect of carbon source transfer. (3) The nonlinear relationship between LUT and CET was confirmed by the threshold effect at the economic development level, industrial optimization level, and technological progress level. The nonlinear relationship between the LUT and the carbon sink changes in the Middle Reaches of the Yangtze River is on the left side of the U-shaped curve and that between the LUT and the carbon source transfer or net carbon emissions is on the left side of the inverted U-shaped curve.
1. Introduction
Currently, climate change is an important environmental issue of global concern, and greenhouse gases, mainly CO2, are the main cause of global warming [1]. As the largest carbon emitter in the world [2,3], China actively assumes the responsibility for reducing carbon emissions and has claimed to achieve carbon peak by 2030 and carbon neutrality by 2060 [4]. Carbon emission transfer (CET) has attracted great academic attention due to the ‘pollution refuge hypothesis’ [5], which believes that developed countries/regions tend to transfer heavily polluting industries to less developed countries/regions with loose environmental policies through trade and industrial transfer, making them sanctuaries for polluting industries [6,7,8]. Due to relatively backward production technologies, less developed countries/regions usually involve significantly higher carbon emissions than developed countries/regions in production [9]. Therefore, CET is considered as an important reason for the reduction in carbon emissions in developed countries/regions and the rapid growth of carbon emissions in developing countries/regions in recent years. From a global perspective, CET will cause the phenomenon of ‘carbon leakage’ [10,11], in which the total amount of carbon emissions does not decrease but increases, which is not conducive to the realization of a global carbon neutrality target.
The carbon neutrality target involves both the reduction in carbon sources and an increase in carbon sinks [12]. In the ‘pollution refuge hypothesis’, CET is in essence the transfer of carbon sources, while the carbon sinks of terrestrial ecosystems are of great significance to the balance of carbon sources [13]. Fang et al. [14] observed and estimated the carbon sinks of different ecosystems (such as forest, grassland, and farmland) in China from 1981 to 2000 and proposed that the vegetation carbon sinks in China can offset 14.6–16.1% of the carbon sources and offset 21–27% of the carbon sources together with soil carbon sinks in the same period. The carbon source transfer and carbon sink changes based on land use have become an important topic in the academic community [15,16,17,18]. Xia and Chen [19] constructed a land-use carbon emission transfer network, including the flow of both carbon sources and carbon sinks based on a land-use transition matrix and carbon emission transfer density, and described the positive and negative carbon emission transfer associated with land and its spatial distribution. Because construction land is the main carrier of industrial transfer, it is indirectly related to the transfer-in of a carbon source in the ‘pollution refuge hypothesis’. Land types such as forest land and grassland are important carbon sinks, which directly affect the balance of carbon sources. We speculate that the CET from land use includes both carbon source transfer and carbon sink changes (Figure 1). Carbon source transfer refers to the changes in the net carbon sources in the ‘pollution refuge hypothesis’, and carbon sink changes represent variations in the net carbon sinks in the terrestrial ecosystems due to changes in the land-use patterns.
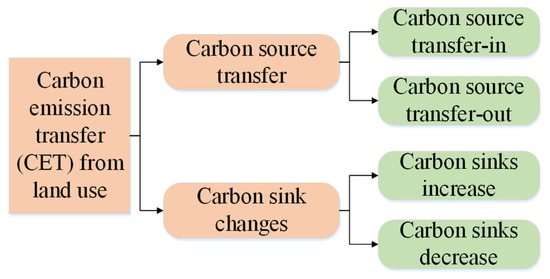
Figure 1.
Connotation of carbon emission transfer from land use.
Land-use transition (LUT) is an important research topic of the Global Land Project [20], which was proposed on the basis of forest transition research [21,22]. LUT refers to the long-term changes in land-use patterns in accordance with regional economic and social development [23,24] and is a major source of greenhouse gases with a significant impact on climate change [25,26]. The clarification of the impact of LUT on CET is of great significance for the sustainable development of the regional economy and society as well as the realization of carbon peak and carbon neutrality. The impact of LUT on CET has been mainly explored from the following two aspects. On the one hand, CET is mainly affected by the changes in land-use scale and structure under LUT. Construction land is the main carbon source; forest is the main carbon sink; farmland is both a carbon source and a carbon sink; and grassland, water, and unused land are considered as carbon sinks [16,27]. Some research has been carried out on the transition of construction land [28], farmland [29], and forest [30]. It has been found that the scale expansion of construction land at the cost of ecological land results in the transfer of large amounts of carbon sources and great changes in carbon sinks; the conversion of farmland to construction land leads to increases in carbon source and decreases in carbon sink; and the conversion to forest results in increases in carbon sink. On the other hand, LUT affects CET through industrial transfer. Some studies have explored the influencing factors of CET, including interregional trade, technology spillover, industrial transfer, and population migration [31,32]. Most researchers believe that industrial transfer is the main factor affecting CET. In industrial transfer, the receiver of the industry generally has significant increases in energy consumption and carbon sources due to changes in the regional labor division and industrial structure [33]. Numerous studies have demonstrated that LUT greatly affects industrial transfer [34,35,36,37,38,39]. During the rapid industrialization and urbanization of China, land supply has played an important role in regulating industrial transfer [40]. Construction land is a key factor to attract fixed-asset investment and industrial transfer. An extensive expansion of construction land and low-cost land supply have created favorable conditions for industrial transfer [41,42]. In addition, the optimal allocation of land resources among different industries also has great impacts on the transformation of the industrial structure [43], as mainly represented by the increase in scientific research investment, technological progress, and industrial structural optimization [44,45]. The transformation of the industrial structure will lead to the re-transfer of the industry.
However, the impact of LUT on CET has certain nonlinear characteristics. It has been reported that when the scale and proportion of carbon source land and carbon sink land reach certain levels, CET will show changes with a certain trend. CET can be reflected by changes in the intensity of carbon sources and carbon sinks [46]. For example, Zhang et al. [47] studied the relationship between the total amount of construction land and carbon intensity in Wuxi, China, and found that the relationship between them is an inverted U-shaped curve: as the construction land expands to the inflection point, the carbon source intensity gradually decreases, and the inflection point is at around 1.91% of the construction land ratio.
The threshold regression model was proposed by Hansen [48], which may provide a useful tool for analyzing the nonlinear impact of LUT on CET. Compared with traditional methods, this model can be tested and estimate the presence of threshold effects according to the randomness of exogenous variable grouping [49]. Some studies have used the threshold regression model to study the threshold effects of technological progress [50], environmental regulation [51], economic scale [52], industrial structure [53], urbanization [54], and other factors on carbon sources or carbon intensity changes. However, no study has used the threshold regression model to examine the threshold effect of LUT on CET, particularly the nonlinear relationship of LUT with carbon sources, carbon sinks, and net carbon emissions.
Therefore, this paper studied the above topic from the following three aspects, hoping to make marginal contributions to a better understanding of the effect of LUT on CET. First, this paper calculates the total net CET from the perspectives of carbon source transfer, carbon sink changes, and net carbon emissions, as well as observing their characteristics. Second, this paper conducts a theoretical analysis about the impact of LUT on the CET at different stages from three levels, including the scale effect, structural effect, and technology effect. Third, this paper uses the economic development, industrial optimization, and technological progress levels as threshold variables to construct a threshold regression model to explore the nonlinear relationship between LUT and CET. The findings may help to clarify the changing law of regional CET and propose targeted suggestions for the regulation of regional LUT so as to reduce carbon emissions and increase carbon sinks and help to achieve carbon peak and carbon neutrality.
2. Theoretical Analysis
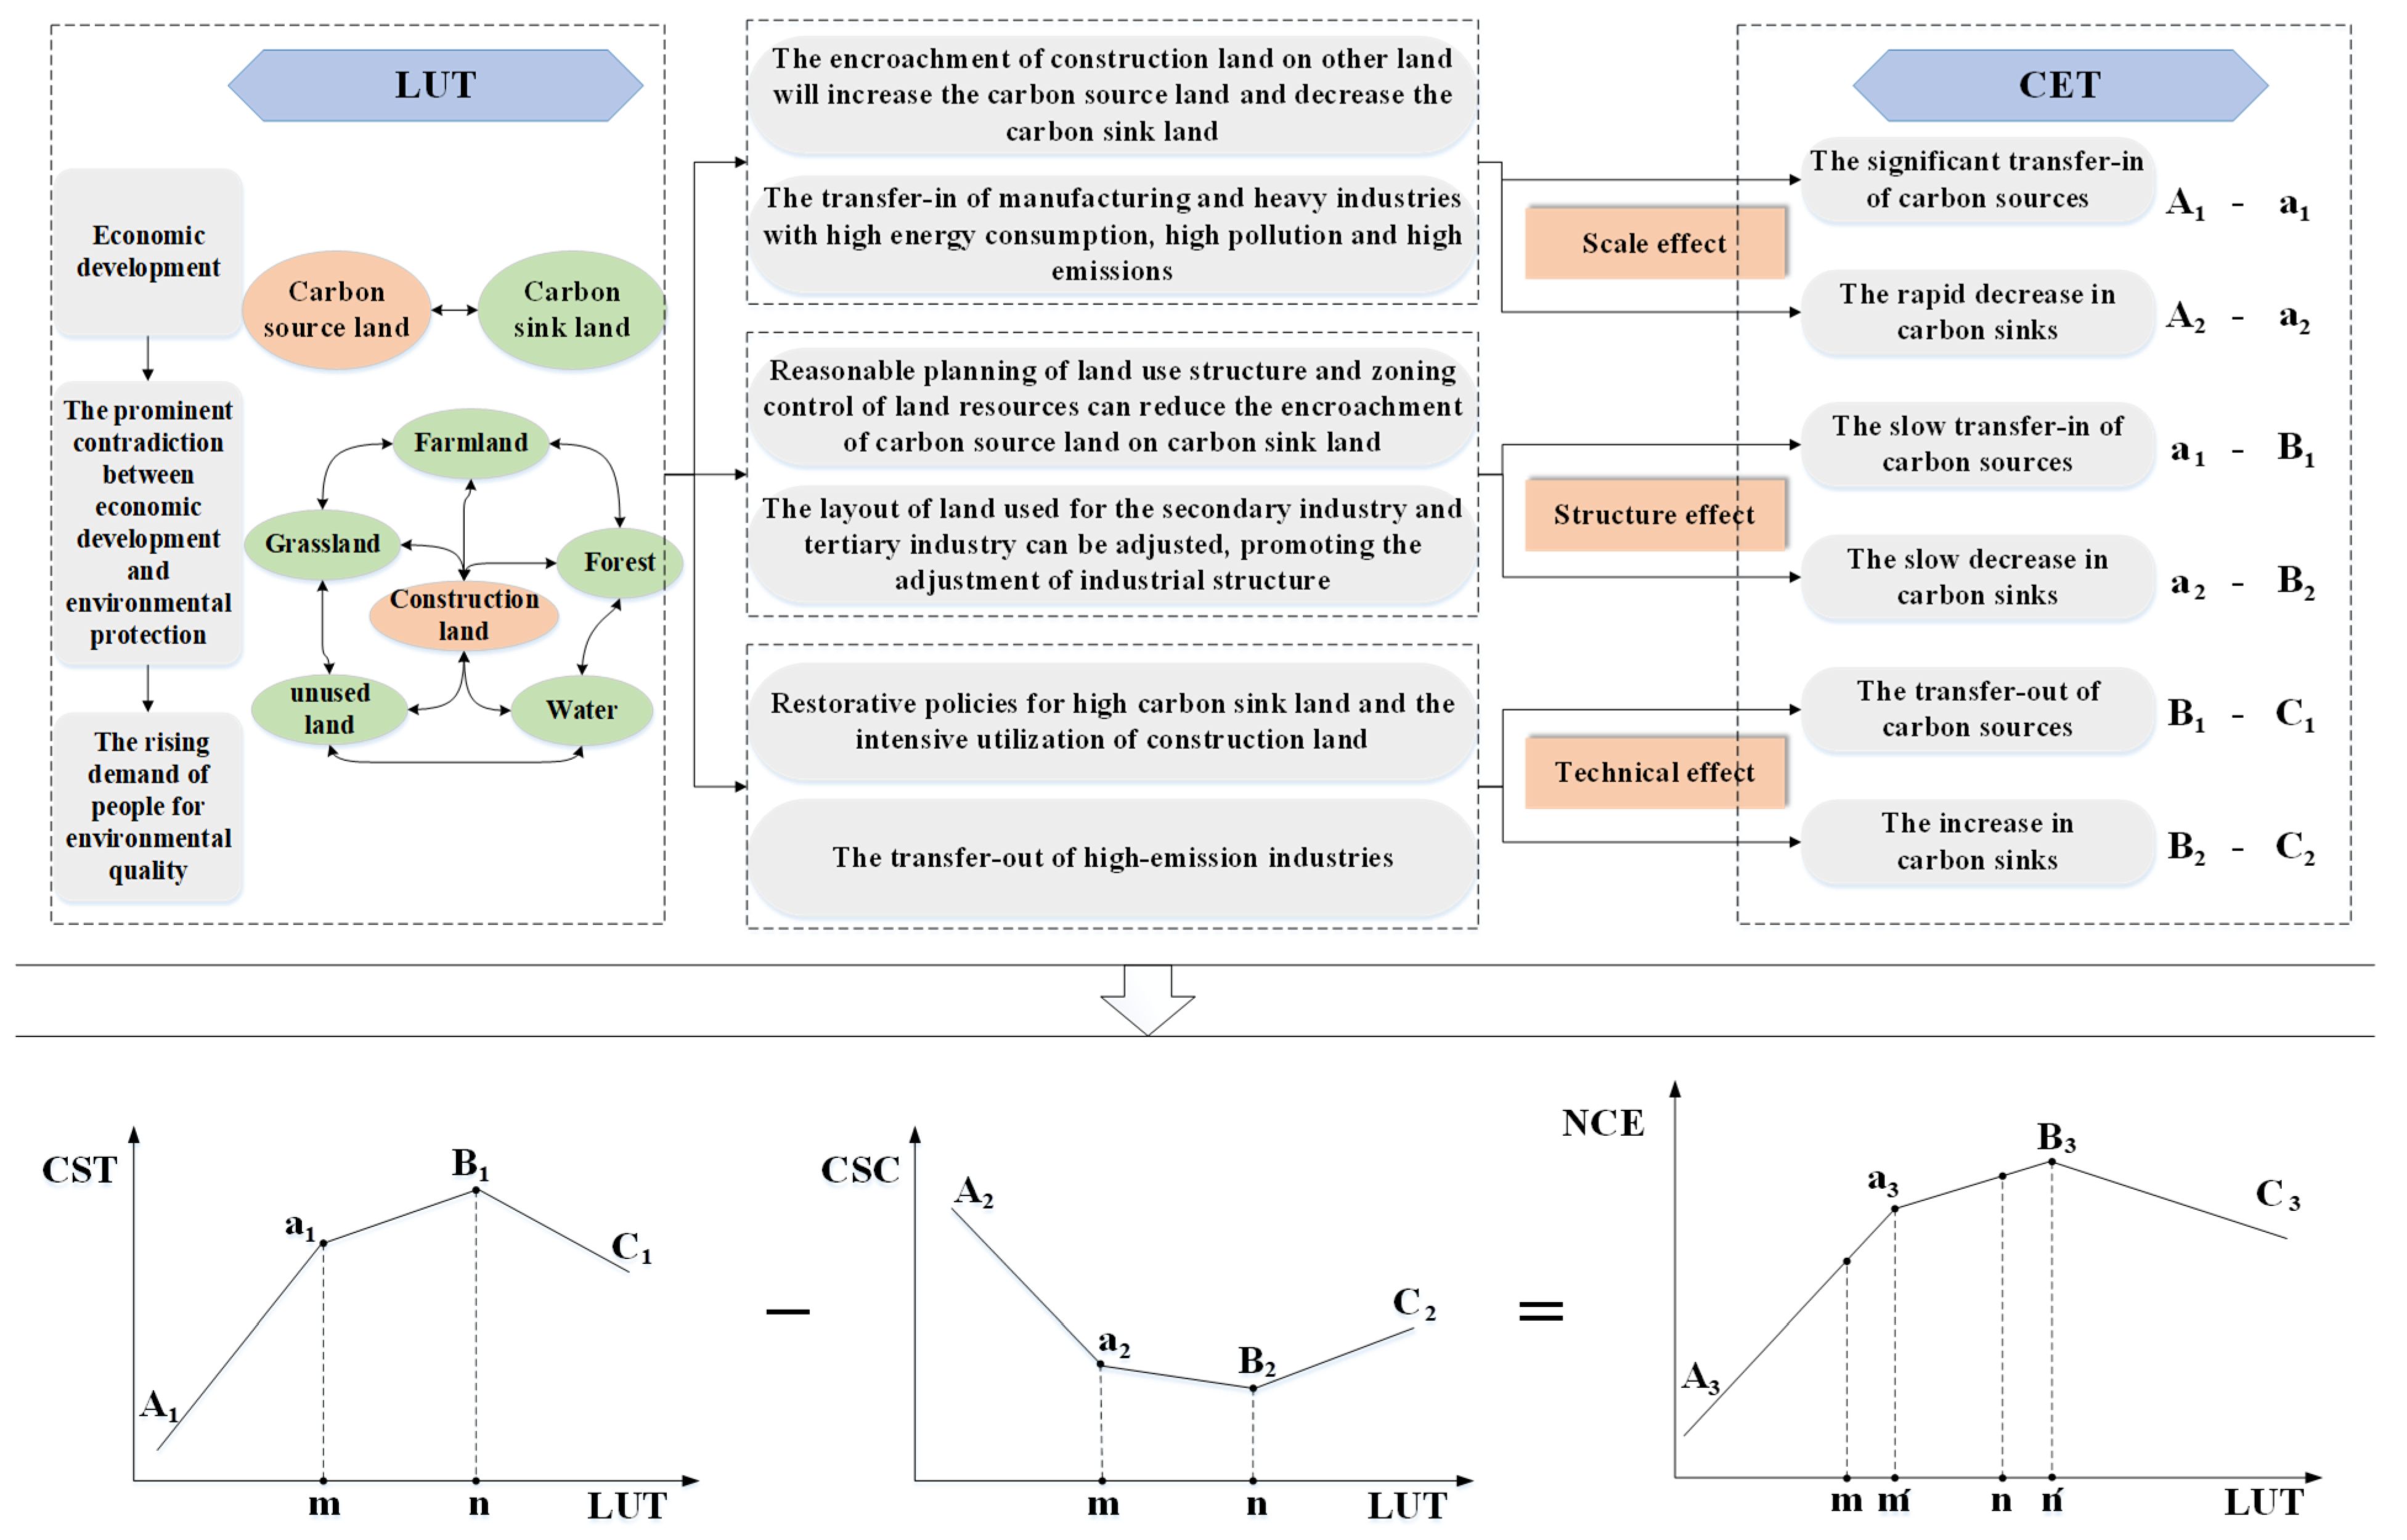
This paper mainly discusses the threshold effect of LUT on CET, which can reflect the nonlinear characteristics of the impact of LUT on CET. Previous studies have demonstrated that the transition stage of land use corresponds to that of economic and social development [55]. Grainger [21] studied the LUT in forest-dominated countries and found that most forest-based countries have gone through some stages of development, including a first continuous deforestation leading to a reduction in forest land, to a new balance between the forestry and agricultural sectors, and then to an increase in forests due to self-regeneration and plantation. It can be speculated that with the evolution of LUT, there may be different nonlinear relationships between LUT and carbon source transfer, carbon sink changes, and net carbon emissions, and the threshold at which LUT affects CET may also be different. The changing process of LUT is divided into three stages, including the A-a, a-B, and B-C stages (Figure 2).
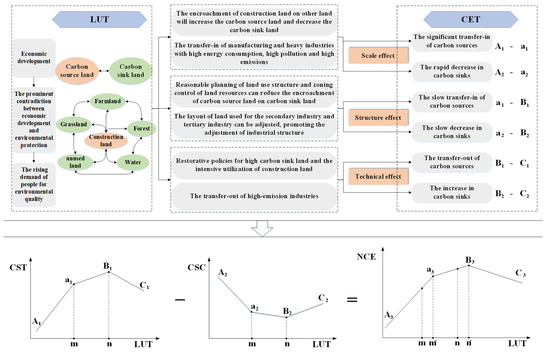
Figure 2.
Theoretical analysis of the relationship between LUT and CET (CSC: carbon sink changes; CST: carbon source transfer; NCE: net carbon emissions).
A-a stage. Before LUT reaches the thresholds m and m’, it will promote the significant transfer-in of carbon sources, a rapid decrease in carbon sinks, and a rapid increase in net carbon emissions. Firstly, at this stage, the region is focused on economic development, which requires as much construction land as possible for economic activities. With a limited amount of total land resources, the expansion of construction land is usually at the expense of other land. Based on the division of land use into six categories by the Chinese Academy of Sciences, and considering the actual situation of the study area, this paper classifies construction land as carbon source land, and farmland, forest, grassland, water, and unused land as carbon sink land. Forest belongs to high-carbon sink land, and farmland, grassland, water, and unused land belong to low-carbon sink land. The encroachment of construction land on other land will increase the carbon source land and decrease the carbon sink land, resulting in the transfer-in of carbon sources and a decrease in carbon sinks, which will lead to a rapid increase in the net carbon emissions. Secondly, land factor is a basic production factor and plays an important role in industrial transfer. In order to meet the needs of rapid economic development, the local governments are driven by ‘competition for investment’ and adopt the policies of ‘supply according to demand’ and ‘tailor-made strategy’ to attract industrial transfer-in. The government lowers the price of land supply and the land-use cost of micro-enterprises, leading to the transfer-in of numerous land cost-sensitive industries, which are mainly manufacturing and heavy industries with high energy consumption, high pollution, and high emissions. The transfer-in of these industries will exacerbate the regional transfer-in of carbon sources.
a-B stage. Before reaching the thresholds n and n’, LUT will slow down the transfer-in of carbon sources and lead to a slow decrease in carbon sinks and an increase in net carbon emissions. First, with the prominent contradiction between economic development and environmental protection in the process of regional development, the optimal allocation of land resources plays an increasingly important role in alleviating the contradiction. The reasonable planning of the land-use structure and zoning control of land resources can reduce the encroachment of carbon source land on carbon sink land and reduce the rate of carbon source transfer and carbon sink changes. Second, in the previous stage, the local government tends to adopt a ‘land-based development’ model to attract enterprises with high pollution and repeated production capacity, resulting in the convergence of industrial structures, which will promote the emergence of economic benefits and at the same time deplete the environmental benefits. At this stage, the local governments will decrease their support for the land use of industries with high energy consumption, high pollution, and high emissions and encourage land demanders to compete for construction land in the market based on their own product types, land-use scale, and required location. In this way, the layout of the land used for the secondary industry and tertiary industry can be adjusted, promoting the adjustment of the industrial structure. The adjustment of the industrial structure will further help to improve the level of inter-industry linkage and coordination, thereby improving energy utilization efficiency, enhancing pollution treatment capacity, and reducing energy consumption in the process of raw material search and transport between different industries. Therefore, the regional transfer-in of carbon sources will be slowed down.
B-C stage. Before reaching the corresponding thresholds, LUT will promote the transfer-out of carbon sources and increase carbon sinks and decrease net carbon emissions. At this stage, with the rising demand of people for environmental quality, the ecological service value of carbon sink land and the intensive use of carbon source land will attract great attention. Restorative policies for high-carbon sink land (such as returning farmland to forest and grassland) may directly change the decrease in regional carbon sinks into an increase. In addition, the intensive utilization of construction land requires the transformation of labor-intensive land to capital-intensive and knowledge-intensive land, which largely depends on technological progress. With strengthened local environmental regulations, the supply of construction land will decrease and accordingly the price will rise. In order to reduce the production cost, high-emission industries will migrate to other places with low demand for environmental quality. The transfer-out of these high-emission industries will leave more room for local low-carbon projects with stronger technological innovation capability, which will greatly improve the local technological progress, and also change the transfer-in of carbon sources into transfer-out.
Based on the above analysis, it can be inferred that the impact of LUT on CET has a threshold effect, and LUT has different nonlinear relationships with carbon source transfer, carbon sink changes, and net carbon emissions. We speculate that (1) there may be an inverted U-shaped curve relationship between LUT and carbon source transfer, that is, with the evolution of LUT, carbon source transfer will show a first rising and then falling trend. Due to the effects of the industrial structure and technology, when the direction for the impact of LUT on carbon source transfer remains unchanged, the degree of impact will vary. (2) There may be a U-shaped curve relationship between LUT and carbon sink changes, that is, with the evolution of LUT, carbon sinks will show a first decreasing and then increasing trend. When the direction for the impact of LUT on carbon sinks remains constant, the degree of impact will vary. (3) There may be an inverted U-shaped curve relationship between LUT and net carbon emissions, that is, with the evolution of LUT, net carbon emissions will exhibit a similar trend to carbon sources. However, the inflection point for net carbon emissions will appear later than that for carbon sources due to the certain offsetting effect of carbon sinks.
3. Methods and Data Sources
3.1. Research Methods
In this paper, the land-use transition matrix is used to describe the dynamic process of LUT; the coefficient method is used to directly measure the changes in carbon sinks; and the industrial transfer carried by the construction land is used to measure the carbon source transfer. Furthermore, based on the information of LUT, this paper selects the threshold variables to reflect the scale effect, structural effect, and technology effect of LUT [56] and constructs the threshold regression model for the effect of LUT on carbon source transfer, carbon sink changes, and net carbon emissions.
3.1.1. Land-Use Transition Matrix
The land-use transition matrix reflects the dynamic process of the mutual transformation between different land types in the same area [57]. This paper analyzes the LUT status of the study area during the study period by establishing a two-dimensional matrix.
In the formula, S represents the area of a certain land type in the study area; n indicates the number of land-use types before and after transition; i, j (i, j = 1,2,…,n) represent the land-use types before and after transition, respectively; Sij represents the area of land type i converted to land type j.
3.1.2. Calculation of Carbon Emission Transfer
(1) Carbon Sink Changes
Carbon sink changes (CSC) of farmland, forest, grassland, water, and unused land are the product of land-type transfer scale and carbon sink coefficient. The formula is as follows:
In the formula, represents the changes in carbon sinks of land type i in the j region in the t period and the t − 1 period; CSi is the carbon sink of the ith land type; Si is the area of the ith land type; is the carbon sink coefficient of the ith land type; the carbon sink coefficients of farmland, forest, grassland, water, and unused land are taken as 0.013 kg C/(m2·a), 0.0578 kg C/(m2·a), 0.0021 kg C/(m2·a), 0.0257 kg C/(m2·a), and 0.0005 kg C/(m2·a), respectively [58,59,60].
(2) Carbon Source Transfer
This paper makes use of relevant research results [61,62] to first calculate the scale of industrial transfer in the study area and then calculate the carbon source transfer in combination with the carbon emission intensity of various industries.
Scale of industrial transfer. Industrial transfer is manifested as changes in the spatial distribution of industrial activities in different periods. Because currently no statistical data are available on the local relocation of enterprises in China to identify the specific scale and direction of industrial relocation, some related research uses indicators such as location entropy and input-output ratio to indirectly measure the degree of industrial relocation [63]. Generally, the regional industrial output is affected by its own growth, foreign inflow, and local outflow. Factors such as technological innovation and improvement of management will promote their own growth; policy encouragement can enhance the transfer-in of foreign industries; and policy constraints will lead to the transfer-out of local industries. The formulas for calculating the scale of regional industrial transfer are as follows:
In the formulas, represents the industrial transfer volume of the m-type industry in j city in the t period; and indicate the industrial output of the m-type industry in j city in the t period and the t − 1 period; is the added value of self-output value of m-type industry in j city from period t − 1 to period t under the assumption that no industrial transfer occurs; represents the growth rate of industrial output value of the m-type industry in each city from period t − 1 to period t, which is calculated from the average value of the Middle Reaches of the Yangtze River; 42 is the number of cities in the Middle Reaches of the Yangtze River. If the industrial transfer of each city is positive, the industry is transferred in, and vice versa.
Carbon emission intensity. Carbon emission intensity is the ratio of industry energy consumption carbon emissions to the total industrial output value. The carbon emissions of industrial energy consumption are calculated using the IPCC method [64].
In the formulas, represents the carbon emission intensity of the m-type industry in period t; is the carbon emissions of industrial energy consumption; is the final consumption of various types of energy; is the conversion factor of various types of energy into standard coal; is the emission factor of various types of energy; 44 and 12 represent the molecular weights of CO2 and C, respectively. The energy conversion factor to standard coal is derived from the China Energy Statistical Yearbook (2020), and the energy carbon emission factor is obtained from the IPCC National Greenhouse Gas Guidelines (2006). The specific values are shown in Table 1.

Table 1.
Calculation coefficients of energy consumption carbon emissions.
Carbon source transfer. The carbon source transfer (CST) is obtained by multiplying the industrial transfer amount (obtained by Formula (4)) and the carbon emission intensity (obtained by Formula (7)) of each city, which is calculated as follows:
In the formula, represents the carbon source transfer from period t − 1 to period t of the m-type industry in the j city.
(3) Net Carbon Emissions
Net carbon emissions (NCE) are the difference between carbon source transfer (from Formula (9)) and carbon sink changes (from Formula (2)).
3.1.3. Threshold Regression Model
(1) Model Construction
The threshold regression model developed by Hansen and Gonzalo et al. can divide the interval according to the characteristics of the sample itself, estimate the threshold value and significance of the parameter, and explain the ‘non-linear’ relationship between the explained variable and explanatory variable [65]. When a certain economic parameter reaches a certain critical value, the parameter of the explanatory variable will undergo a sudden change in direction or quantity, and this critical value is considered as the threshold value of the explanatory variable to the explained variable. The basic formula of the threshold regression model is:
where i is the region, t is the year, qit is the threshold variable, γ is the unknown threshold value, eit is the random disturbance term, and I is the indicator function.
By referring to Hansen’s threshold model, this paper selects carbon source transfer, carbon sink changes, and net carbon emissions modified by the bootstrap method as dependent variables, takes LUT as the core explanatory variable, and introduces variables representing the scale effect, structure effect, and technology effect as threshold variables, respectively. Considering the possibility of the existence of multiple threshold values, the multi-threshold regression model is constructed as follows:
where represents the amount of carbon source transfer, carbon sink changes, and net carbon emissions corrected by the bootstrap method, indicates the LUT, stands for the threshold variable, and represents the control variable.
(2) Variable Description
The variable descriptions are shown in Table 2.
Table 2.
Variable selection and explanation.
Core explanatory variable: LUT is expressed as the changes in the proportion of farmland. According to previous analysis, construction land is the main carbon source land, and forest is the main carbon sink land. However, during the rapid urbanization and industrialization in China, farmland is the main contributor to the expansion of construction land. In addition, with the implementation of a series of ecological protection policies, farmland is also the main contributor to forest restoration. Therefore, changes in the proportion of farmland can reflect the overall dynamics of regional LUT and can be used to further analyze the relationship of LUT with carbon source transfer, carbon sink changes, and net carbon emissions, which will also be confirmed in the empirical analysis below.
Threshold explanatory variables: The economic development level, industrial optimization level, and technological progress level are selected to represent the scale effect, structural effect, and technological effect of LUT, respectively. All of them have uncertain impact on CET from land use. (1) The economic development level is expressed as GDP per unit of land. At the stage dominated by the scale effect, improvement of economic density is the most direct manifestation. Moreover, economic development has both a positive agglomeration effect and a negative scale effect on environmental quality. (2) The industrial optimization level is expressed as the output value of the tertiary industry. At the dominant stage of the structural effect, the output value of the tertiary industry can indicate the optimization degree of the industrial structure layout. In addition, the process of industrial structure optimization and upgrading has either an attractive effect or a crowding out effect on different types of enterprises in the industrial chain. (3) The technological progress level is indicated by the number of technological patent applications. At the stage dominated by the technological effect, the technological progress level can indicate the degree of intensive utilization of carbon source land. In addition, it has been reported that technological progress can improve energy efficiency, but due to the rebound effect, technology may not always achieve energy saving and emission reduction [66].
Control variables: (1) Energy consumption per unit GDP. A higher energy consumption per unit GDP represents a lower energy utilization efficiency. (2) Local financial expenditure. The orientation of local financial expenditure (supporting high-emission sectors such as industry and transportation versus green projects) will influence the direction of CET from land use. (3) Environmental regulation. Loose environmental regulations are conducive to the transfer-in of industries, while strict ones will result in the transfer-out of industries, thereby affecting the carbon source transfer. (4) Urban population density. If the urban population is controlled within a certain range, it will have a positive agglomeration effect, increasing the utilization rate of infrastructure and affecting the carbon sources.
3.2. Data Sources
The remote sensing data of land-use status are obtained from the Data Center for Resources and Environment Science, Chinese Academy of Sciences, including five periods in 2000, 2005, 2010, 2015, and 2020, with a spatial resolution of 30 m × 30 m. ArcGIS 10.7 was used to divide the land into six types: farmland, forest, grassland, water, construction land, and unused land.
The industrial output data, energy consumption data, and other socio-economic statistical data are obtained from China Urban Statistical Yearbook, Hubei Provincial Statistical Yearbook, Hunan Provincial Statistical Yearbook, Jiangxi Provincial Statistical Yearbook, statistical bulletins issued by municipal governments, and the National Bureau of Statistics of China database. In order to eliminate the influence of inflation, the data are deflated with 2000 as the base period. Before test of the threshold regression model, a z-score standardization is performed on the data of each variable.
3.3. Study Area
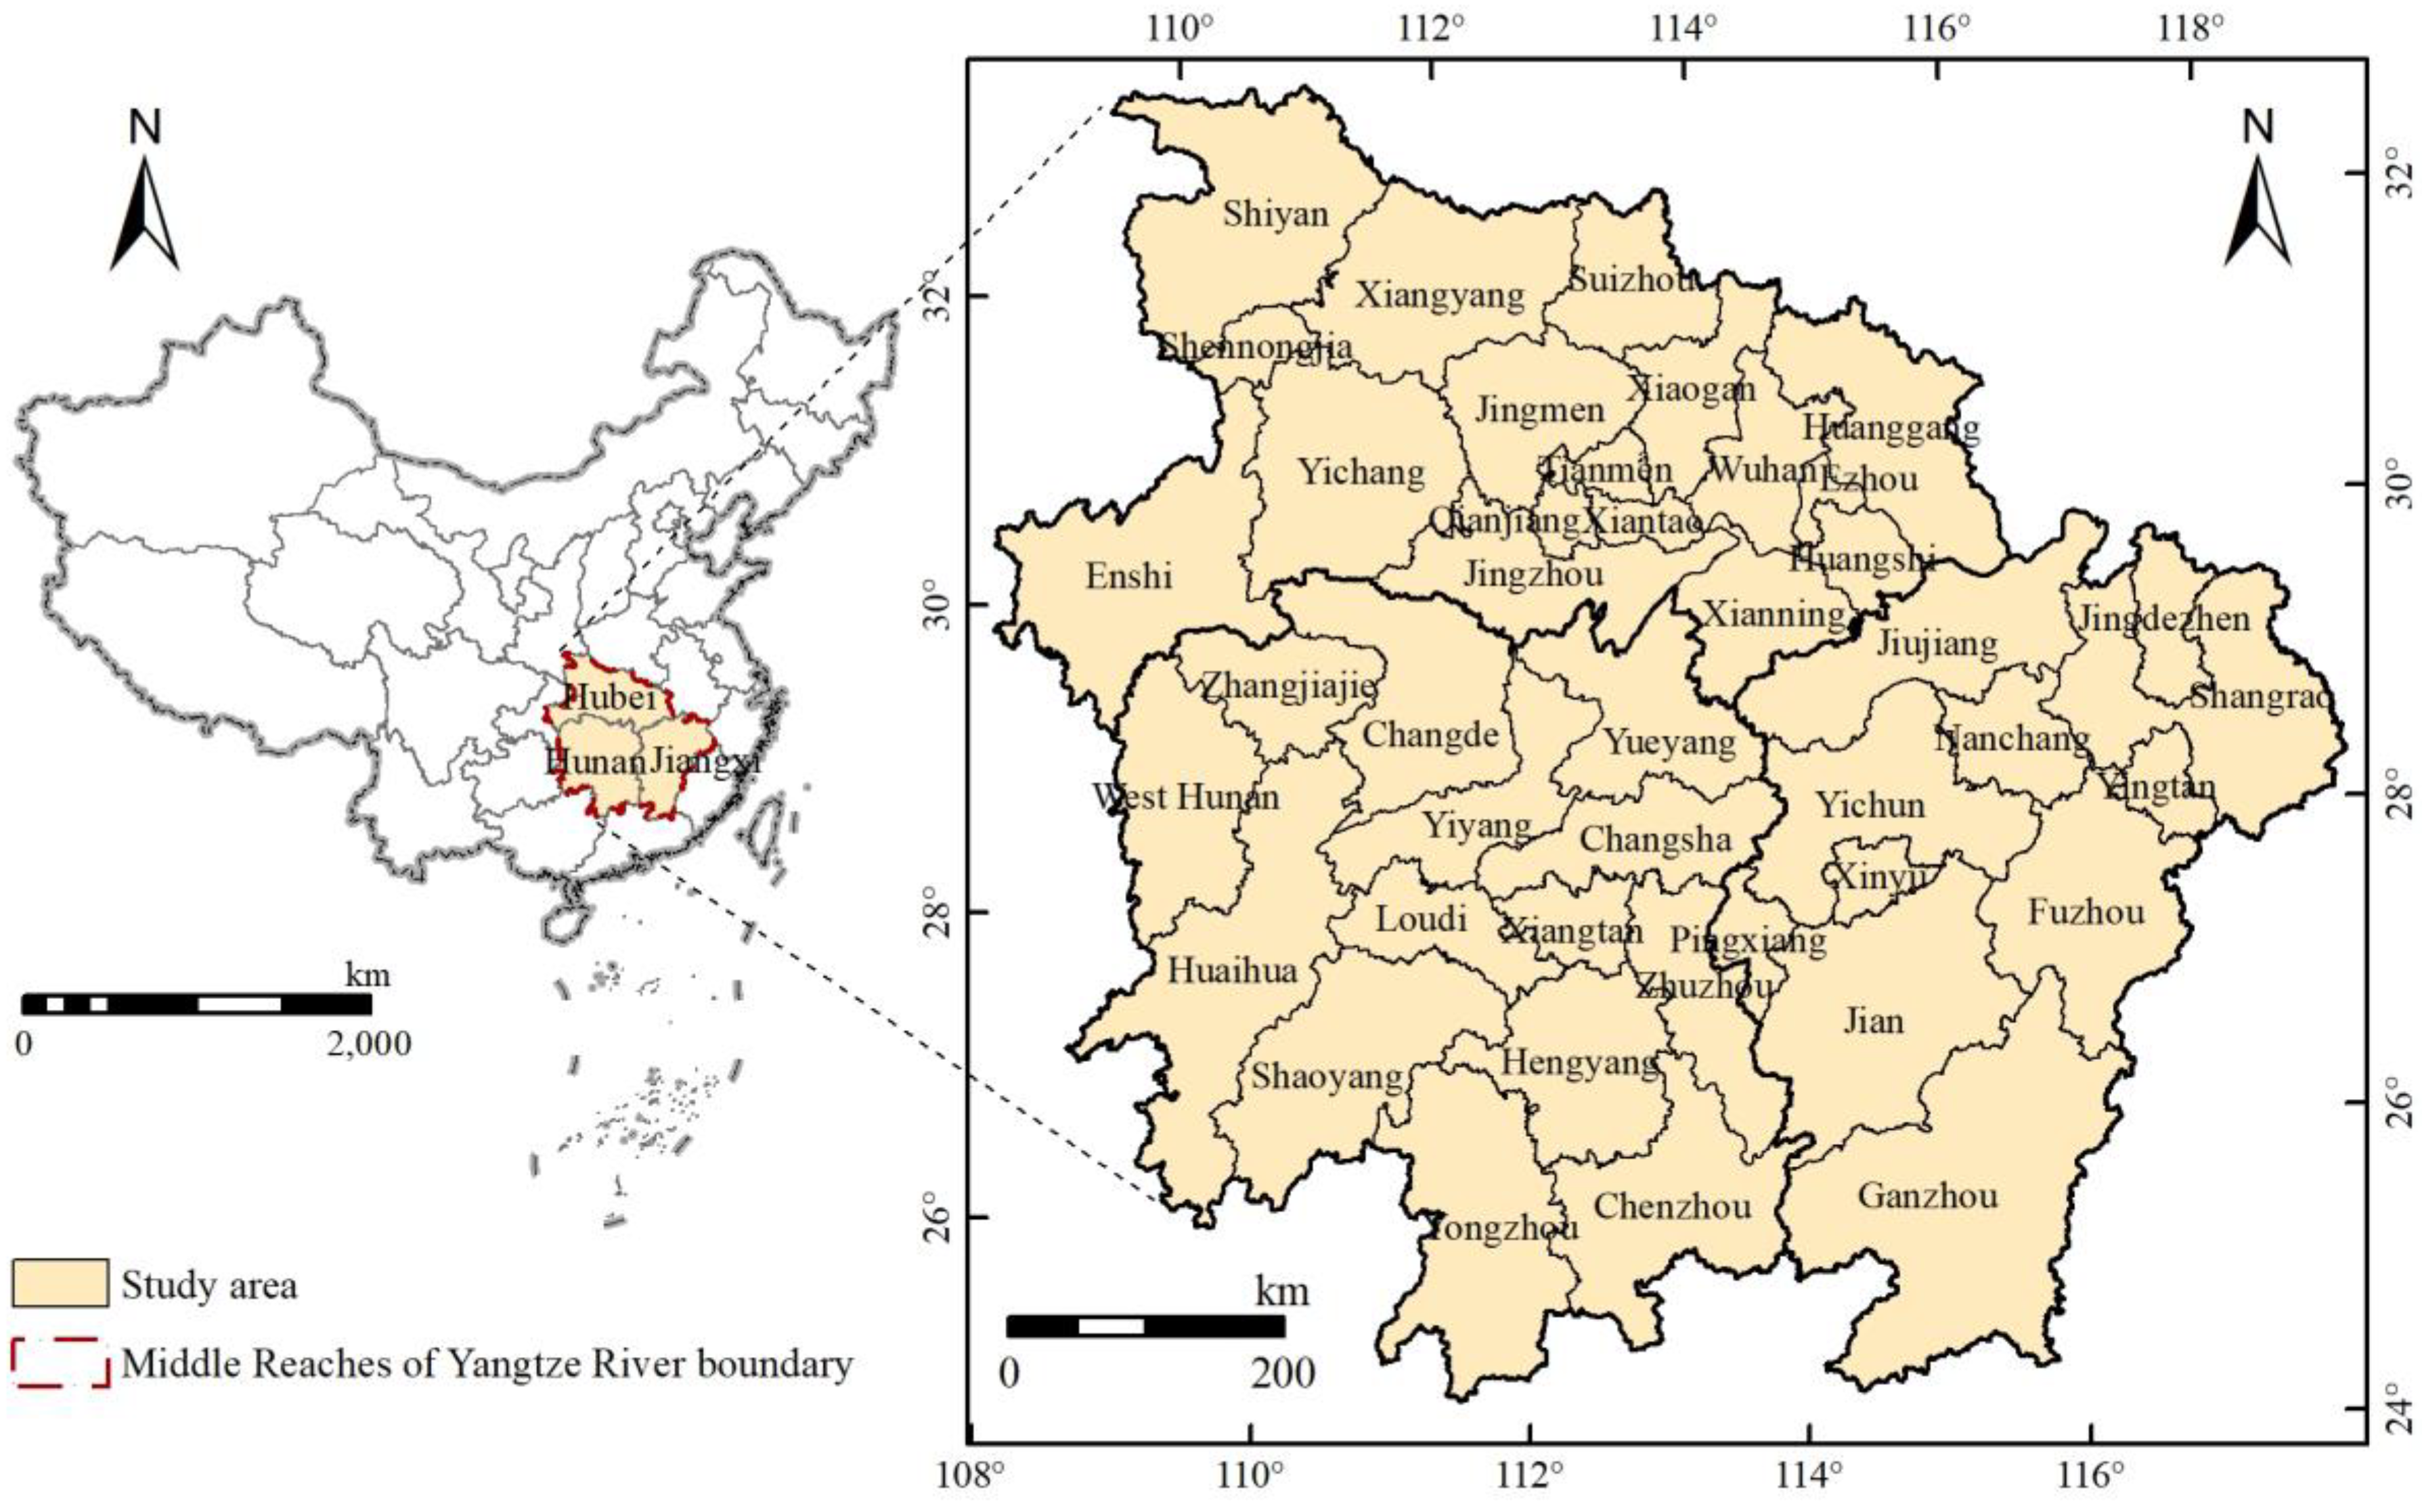
The Middle Reaches of the Yangtze River in China include Hubei, Hunan, and Jiangxi provinces (Figure 3). The total land area is 564,100 km2. In 2021, the total economic volume reached 12.57 trillion CNY. With the ‘Rise of Central China’, ‘Yangtze River Economic Belt’, and other key national strategies in China, this region has become an important growth pole for China’s economic development. The Middle Reaches of the Yangtze River includes the Wuhan-centered urban agglomeration (involving nine cities), Changsha-centered Chang-Zhu-Tan urban agglomeration (involving eight cities), and Nanchang-centered Poyang Lake urban agglomeration (involving eight cities). In the past 20 years, China’s labor-intensive and energy-intensive industries have shifted from coastal areas to central and western regions, and the Middle Reaches of the Yangtze River has undertaken a large number of industries with high energy consumption, high pollution, and high emissions. Moreover, the land use in this region has undergone profound transformation, resulting in prominent ecological and environmental problems, and CET has become a restrictive factor for sustainable development. In this context, this paper takes the Middle Reaches of the Yangtze River as the research area to explore the relationship between LUT and CET to guide the low-carbon transition of land use.
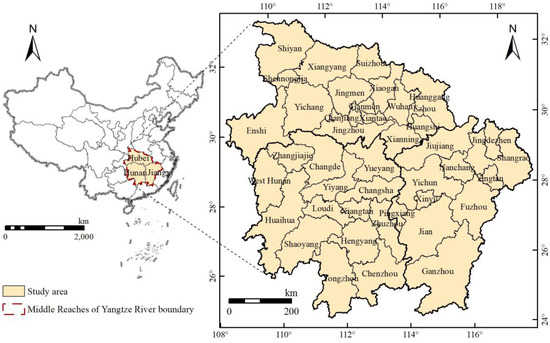
Figure 3.
Study area.
4. Results and Discussion
4.1. Land-Use Transition
Based on the remote sensing images of the Middle Reaches of the Yangtze River in 2000, 2005, 2010, 2015, and 2020, the land-use status of the corresponding years is obtained (Table 3). The area of each land-use type in this region follows a descending order of forest > farmland > water > grassland > construction land > unused land.
Table 3.
Land-use status in the Middle Reaches of the Yangtze River from 2000 to 2020 (km2).
In general, the changes in the land use from 2000 to 2020 exhibit the following prominent features. (1) The farmland shows continuous decreases, and the construction land shows significant increases. The total net decrease in farmland is 9115.25 km2, with a decrease rate of 5.17%. The total net increase in construction land is 8833.48 km2, with an increase rate of 80.99%. (2) The forest first decreases before 2015 and then increases after 2015. (3) Other land types show fluctuations, with grassland and unused land showing an overall decrease and water displaying an overall increase.
By using the land-use transition matrix, the LUT status in the Middle Reaches of the Yangtze River from 2000 to 2020 could be obtained (Table 4; Figure 4), which can intuitively reflect the internal conversion of the land-use types in this region over the past 20 years. In terms of the net amount, from 2000 to 2010, farmland, forest, grassland, and unused land are the main types that are transferred out, most of which are converted into water and construction land. From 2010 to 2020, the same trend can be observed, except for forest, which is changed from ‘transfer-out’ to ‘transfer-in’.
Table 4.
Land-use transition in the Middle Reaches of the Yangtze River from 2000 to 2020 (km2).
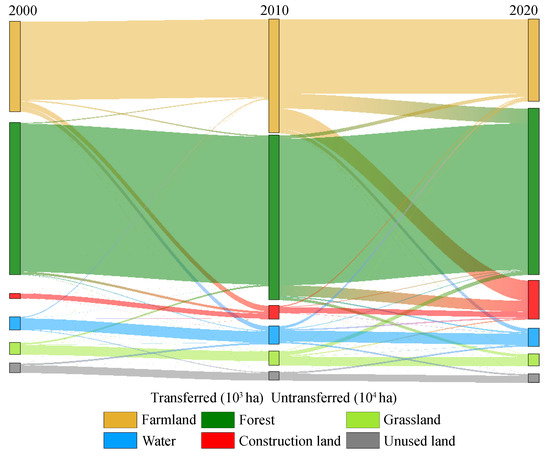
Figure 4.
Characteristics of land-use transition in the Middle Reaches of the Yangtze River from 2000 to 2020.
During the whole study period, the farmland is mainly converted to construction land, forest, and water, and the transfer-out area significantly increases from 2010 to 2020. From 2010 to 2020, the area converted to construction land is 3.57-folds, the area converted to forest is 11.82-folds, and the area converted to water was less relative to those in 2000–2010. In the whole period, the forest is mainly converted into construction land and farmland. Similarly, the transferred-out area of the forest from 2010 to 2020 was significantly larger than that from 2000 to 2010. Notably, the farmland contributes 74.18% to the forest and is the main reason for the change in the forest from transfer-out to transfer-in. The construction land is always dominated by transfer-in, and the farmland has a contribution rate of 66.57% and 60.64% in the two stages, respectively. Therefore, in the process of the LUT, the farmland is the main contributor to the construction land and forest with a contribution rate exceeding 60%.
According to the previous classification of carbon source land and carbon sink land in the Middle Reaches of the Yangtze River, the trend of the LUT analyzed above can be summarized as follows. (1) Conversion of carbon sink land to carbon source land. Due to the needs of economic development, urbanization, and industrialization, construction land has achieved a large-scale expansion at the cost of ecological land. With limited regional land resources, carbon source land and carbon sink land have a trade-off relationship from a structural perspective. Therefore, the forest-dominated carbon sink land decreases along with the expansion of the construction land. In addition, because the construction land is the carrier of industrial development, the conversion of the carbon sink land to carbon source land means a decrease in carbon sinks and an increase in carbon sources. (2) Conversion of low-carbon sink land to high-carbon sink land. The forest has the highest carbon sink value among all the land types. From 2010 to 2020, a large amount of farmland in the Middle Reaches of the Yangtze River has been converted into forest, manifesting the conversion of low-carbon sink land to high-carbon sink land, which is associated with the implementation of the national strategy ‘ecological civilization construction’ and the policy of ‘returning farmland to forests’ in many areas at that time. The conversion of the low-carbon sink land to high-carbon sink land means that the region is consciously improving the regional carbon source and carbon sink pattern by adjusting the LUT.
Obviously, the LUT in the Middle Reaches of the Yangtze River has undergone a profound transformation, which is very likely to induce CET. The transfer scale, direction, and periodic changes of the carbon source land and carbon sink land will lead to different characteristics of the carbon source transfer, carbon sink changes, and net carbon emissions. It is worth noting that the farmland is the main contributor to both the carbon source land (construction land) and the high-carbon sink land (forest), indicating that it is reasonable to select the changes in the proportion of farmland as a comprehensive index to reflect the LUT. These findings may help the further research on the status of the CET and the nonlinear relationship between the LUT and CET in the Middle Reaches of the Yangtze River.
4.2. Carbon Emission Transfer
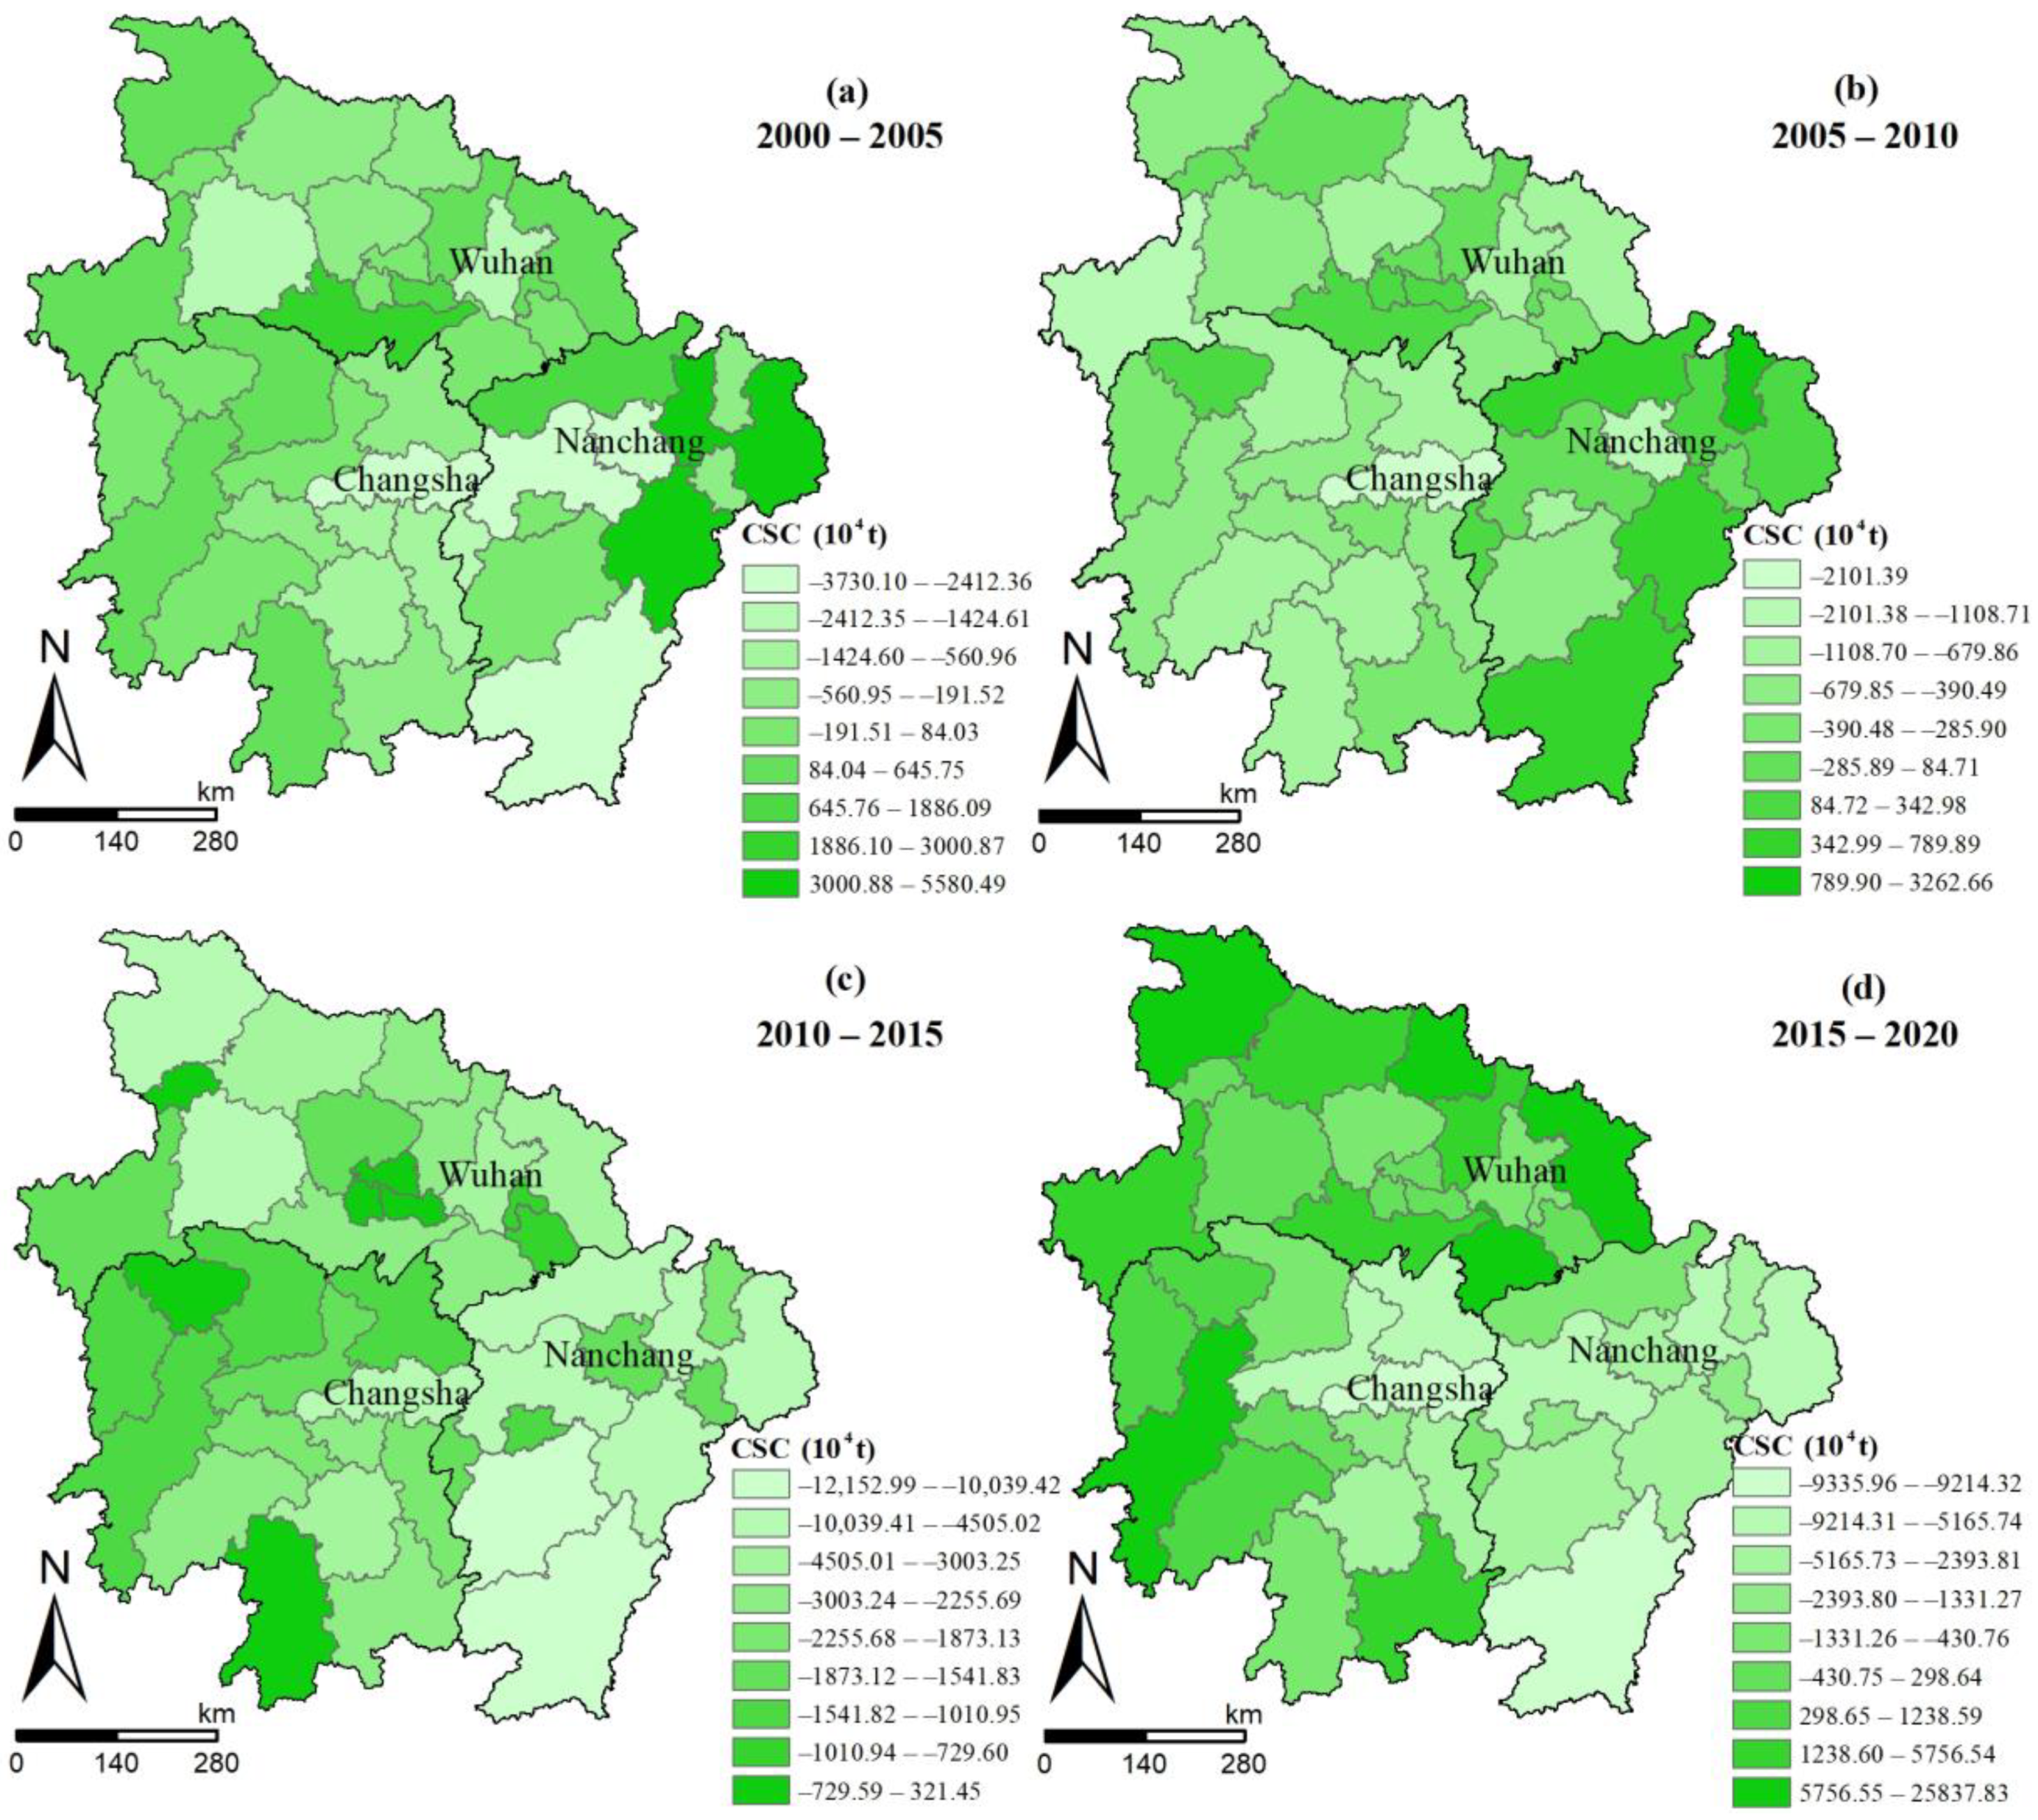
4.2.1. Carbon Sink Changes
According to Formulas (2) and (3), we obtain the changes in the carbon sinks in the Middle Reaches of the Yangtze River (Figure 5). As a whole, the phase characteristic of the carbon sink changes shows an N-type pattern of intensification–moderation–reintensification–remoderation. The east and south first show an increase and then a decrease, while the west and north first exhibit a decrease and then an increase. From 2000 to 2005, Nanchang has the largest decrease in carbon sinks (37.301 million t); from 2005 to 2010, Changsha has the most significant decrease in carbon sinks (21.0139 million t); and from 2010 to 2015, the largest decrease in carbon sinks occurs in Wuhan (31.302 million t). The significant decreases in the carbon sinks in Wuhan, Changsha, and Nanchang are related to the fact that they are the development centers of the Wuhan urban agglomeration, the Chang-Zhu-Tan urban agglomeration, and the urban agglomeration around the Poyang Lake, respectively.
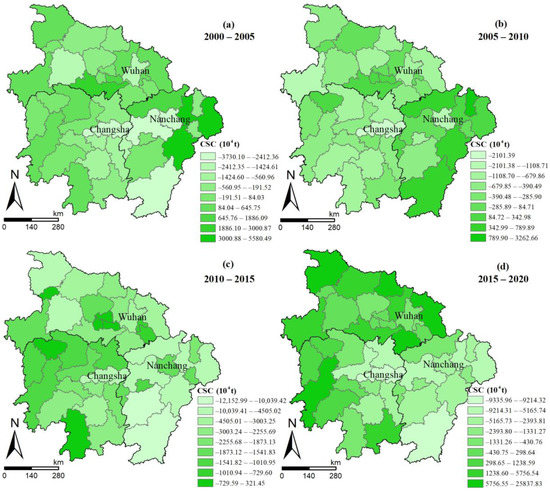
Figure 5.
Carbon sink changes in the Middle Reaches of the Yangtze River from 2000 to 2020.
The period from 2000 to 2015 is a period of rapid economic growth in the Middle Reaches of the Yangtze River, as well as a period of rapid urbanization and industrialization. Numerous people migrate from rural areas to urban areas and from underdeveloped areas to developed areas, which requires the increase in the carrying capacity of urban construction land. In order to meet the needs of urban infrastructure construction and industrial site selection, a large-scale and extensive expansion of construction land have occurred through the encroachment of farmland and forest, directly leading to the reduction in carbon sink land, so that the central area of economically developed urban agglomeration shows continuous decreases in carbon sink land. The economically underdeveloped non-urban agglomeration areas, such as Shiyan City in northern Hubei, Zhangjiajie City in western Hunan, and Ganzhou City in eastern Jiangxi, have more carbon sink land, but due to the dual needs of social and economic development and ecological protection, they have experienced fluctuating changes in carbon sink land.
4.2.2. Carbon Source Transfer
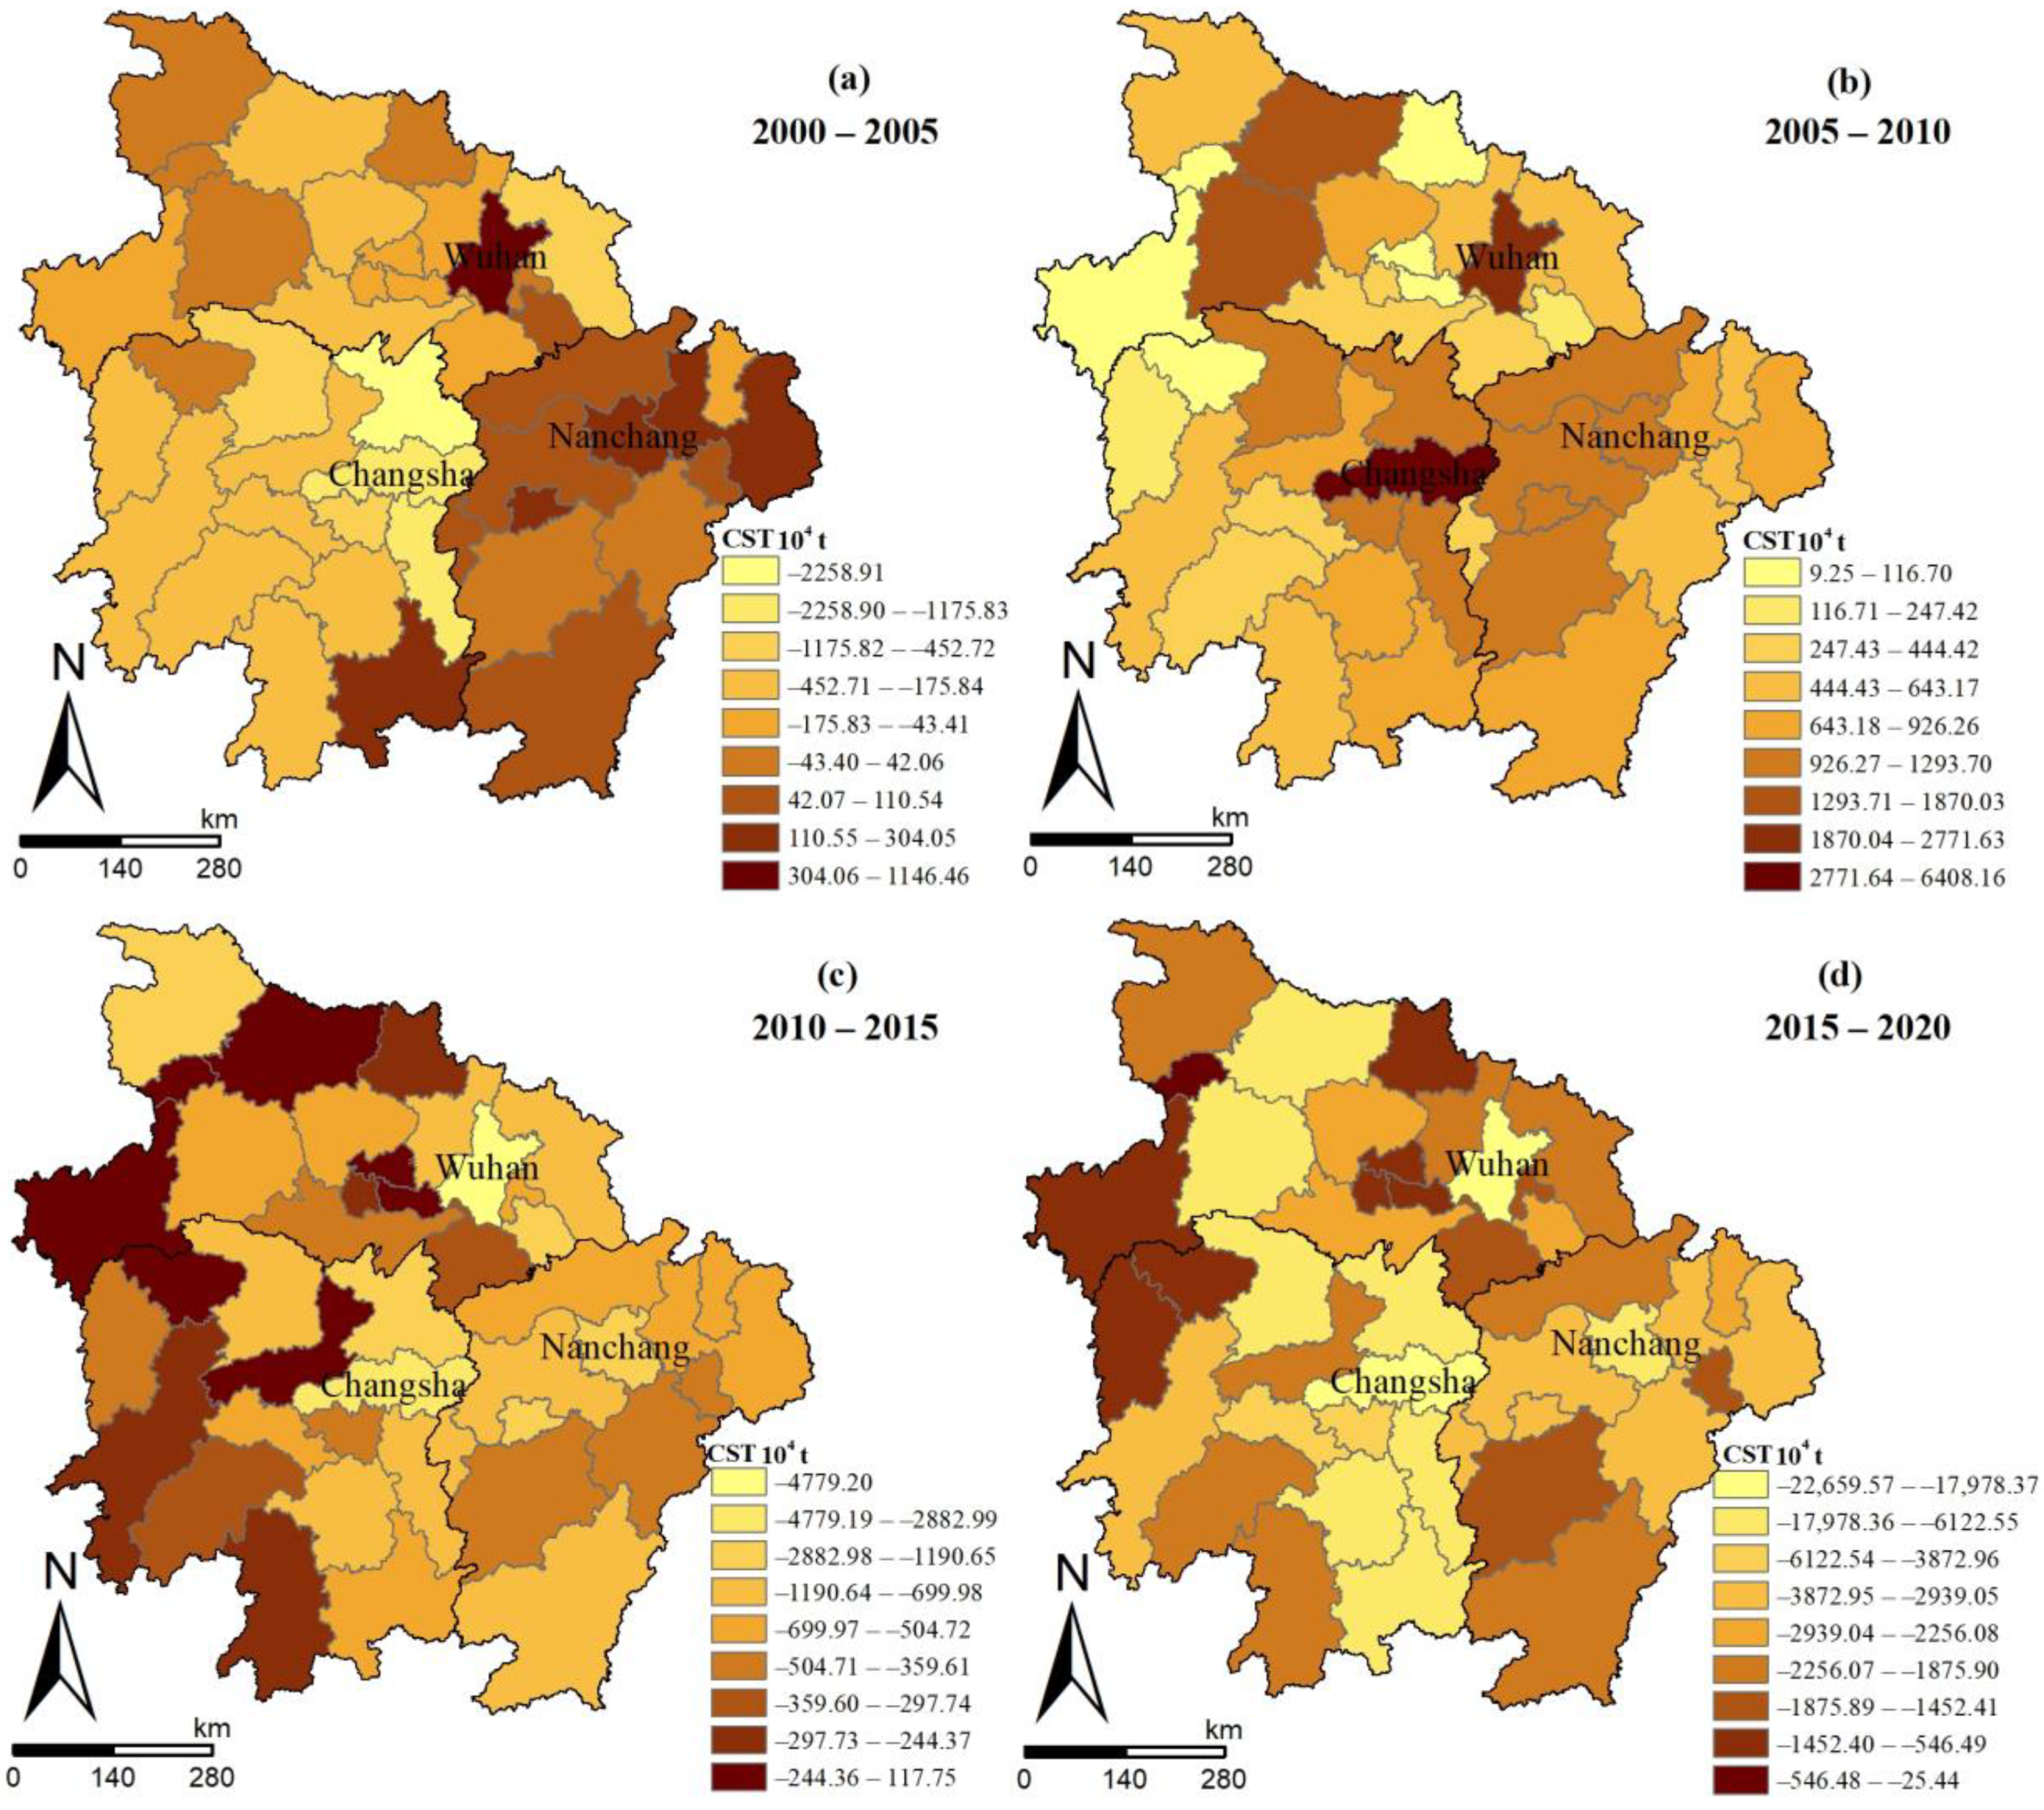
According to Formulas (4)–(9), we obtain the carbon source transfer in the Middle Reaches of the Yangtze River (Figure 6). As a whole, the phase characteristics of the carbon source transfer show an inverted U-shaped pattern of intensification–reintensification–moderation–remoderation. Economically developed urban agglomeration areas have experienced both the transfer-out and transfer-in of carbon sources (mainly transfer-in before 2010, then as transfer-out). From 2000 to 2005, Wuhan City has the largest carbon source transfer-in (11.4646 million t). From 2005 to 2010, Changsha has the most significant carbon source transfer-in (64.0816 million t). The economically underdeveloped non-urban agglomeration areas have experienced the process from carbon source transfer-out to carbon source transfer-in. The above changing trends of the carbon source transfer are consistent with the law of industrial transfer.
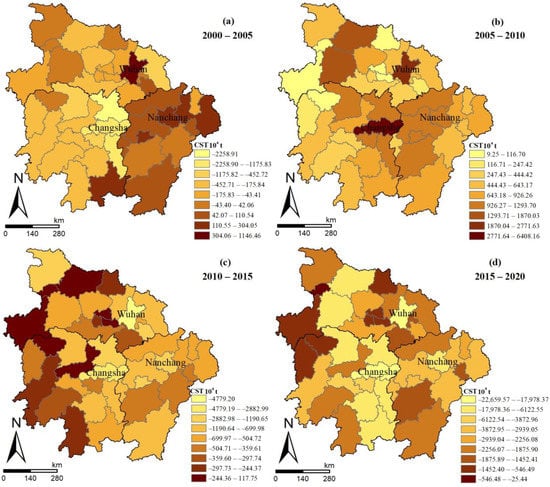
Figure 6.
Carbon source transfer in the Middle Reaches of the Yangtze River from 2000 to 2020.
The location changes based on comparative advantages are the external manifestation of industrial transfer. With the maturity of production technologies and increases in product market demand, lower labor costs and land factor costs have become key factors for enterprises to gain competitive advantages. In order to pursue greater profit margins, industries begin to diffuse and transfer, and due to the impact of environmental policies, low-end manufacturing is often the first type of industry to transfer. During the period of rapid development, the Middle Reaches of the Yangtze River have made use of land supply, market regulation, and taxation to attract a large number of high-emission manufacturing industries transferred from other regions, which is an important reason for the intensified carbon source transfer-in in this region at the early stage. In around 2010, the Wuhan urban agglomeration and the Chang-Zhu-Tan urban agglomeration strengthened the construction of a ‘Resource-saving and Environment-friendly Society’. In 2015, China made a commitment to reach carbon peak in 2030 and reduce carbon emission intensity by 60%–65% compared with that in 2005. During the same period, the ‘Development Plan for Urban Agglomerations in the Middle Reaches of the Yangtze River’ calls for improving resource utilization efficiency, implementing a land-intensive and economical land-use system, and promoting the green development of urban agglomerations. This series of macro policies has brought about constraints on the development of regional industries. Therefore, some high-emission industries within the region have been gradually transferred to the periphery of central cities, resulting in the gradual marginalization of carbon source transfer-in.
4.2.3. Net Carbon Emissions
According to Formula (10), we obtain the changes in the net carbon emissions in the Middle Reaches of the Yangtze River (Figure 7). From 2000 to 2020, the changes in the net carbon emissions in the Middle Reaches of the Yangtze River show significant heterogeneity in different regions and different periods. The urban agglomeration area with Wuhan–Changsha–Nanchang as the core shows an increasing trend in net carbon emissions before 2010, and a decreasing trend after 2010, while it is the opposite case for the non-urban agglomeration area. This feature is similar to that of the carbon source transfer, indicating that the increase in the carbon sinks in the Middle Reaches of the Yangtze River is far from enough to offset the transfer-in of the carbon sources.

Figure 7.
Changes in net carbon emissions in the Middle Reaches of the Yangtze River from 2000 to 2020.
The changes in the net carbon emissions are determined by the carbon source transfer and carbon sink changes. The above results reveal significant differences in the changes of the carbon sources, carbon sinks, and net carbon emissions in different periods. Therefore, the following part will focus on whether there is a threshold effect between the LUT and CET, as well as the threshold value at the economic development, industrial optimization, and technological progress levels.
4.3. Test and Estimation of the Threshold Effect
4.3.1. Test of the Threshold Effect
Before estimating the nonlinear relationship between the LUT and CET, it is necessary to determine whether there is a threshold effect by testing the significance level of the threshold value. The threshold regression model was run by using the Stata 15 software with 400 bootstrap replicates. Table 5 presents the thresholds that have passed the 5% and above significance-level test.
Table 5.
Threshold effect test of carbon emission transfer.
When the core explanatory variable is the LUT and the explained variable is the carbon sink changes, the economic development level and industrial optimization level show a double-threshold effect. The first threshold value of the economic development level is −0.114, and the second threshold value is −0.461. The first threshold value of the industrial optimization level is −0.001, and the second threshold value is 0.219. The technological progress level shows a single-threshold effect, with a threshold value of −0.133. When the explained variable is the carbon source transfer, the LUT shows a single-threshold effect on the CET. When the explained variable is the net carbon emissions, the LUT shows a double-threshold effect on the CET at the economic development level and technological progress level, and a single-threshold effect at the industrial optimization level.
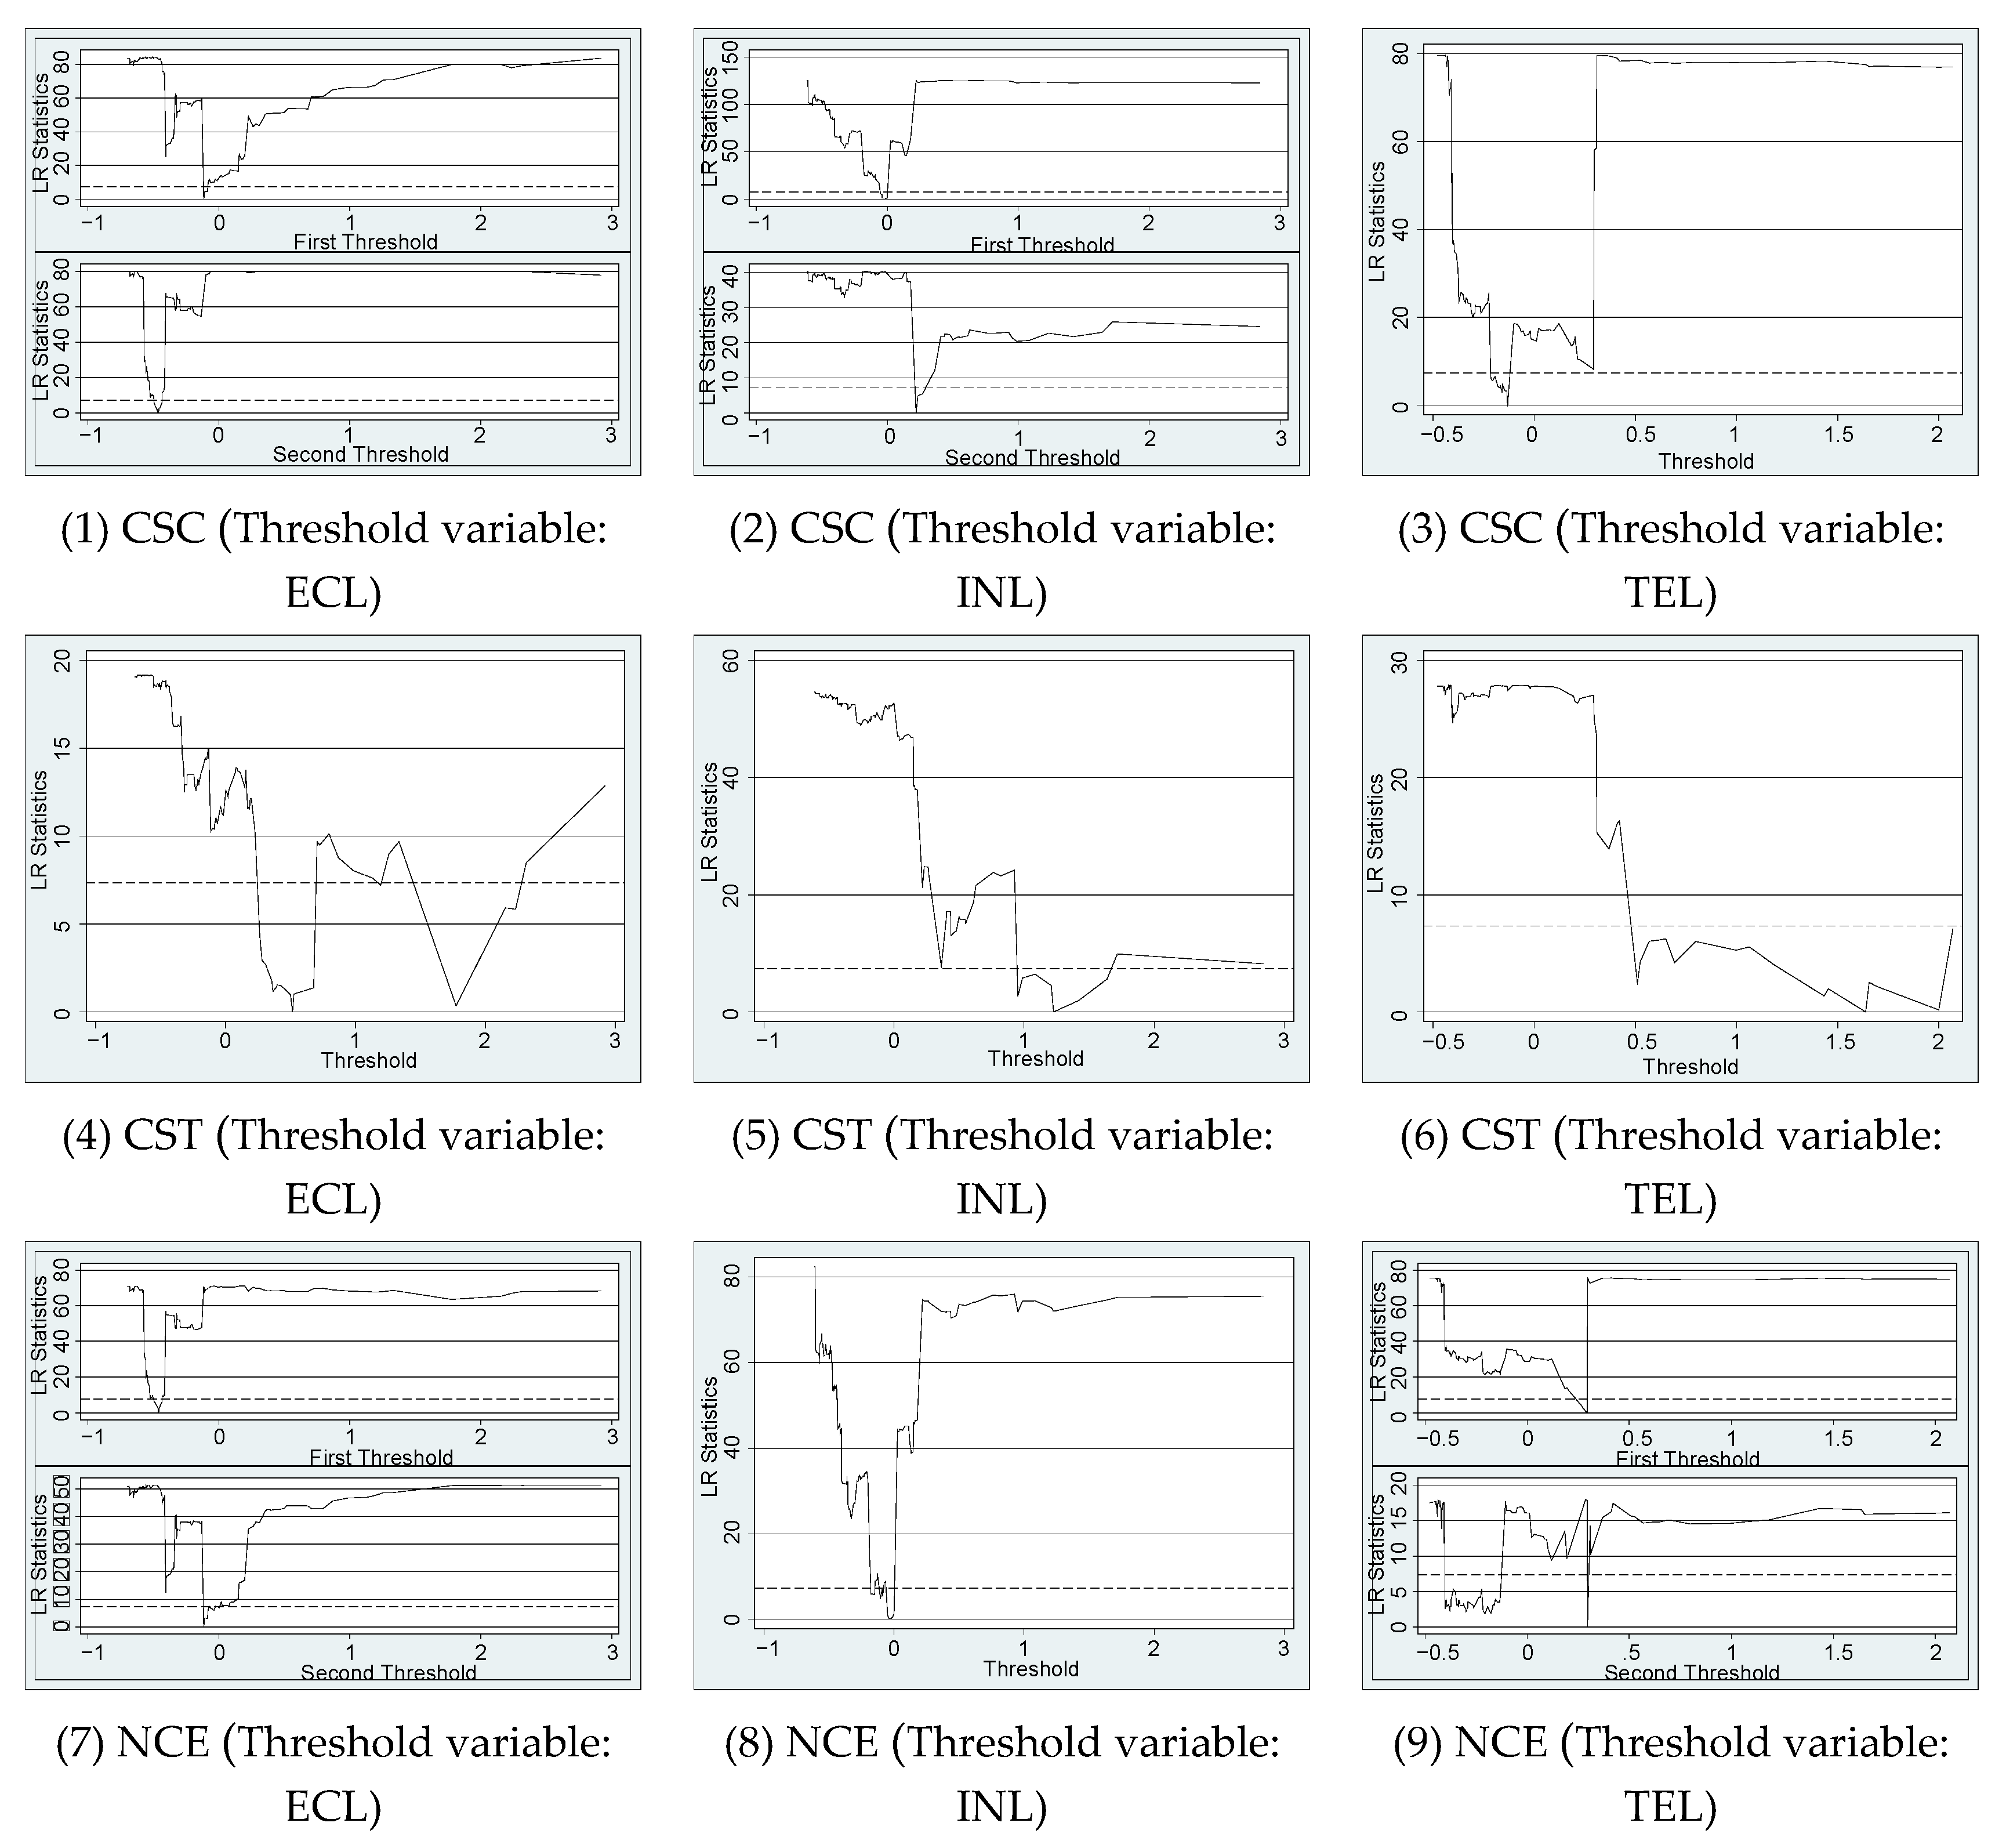
Furthermore, we plot the threshold parameter versus the likelihood ratio (LR) statistics to verify the robustness of the threshold regression model. In Figure 8, the dotted line represents the critical value at the 95% confidence level; the LR curve below the critical value indicates the confidence interval of the threshold value; and the threshold value is the minimum value of the LR curve within the confidence interval. The results in Figure 8 are consistent with the significant results in Table 5, indicating that the results of the threshold regression model are relatively robust.
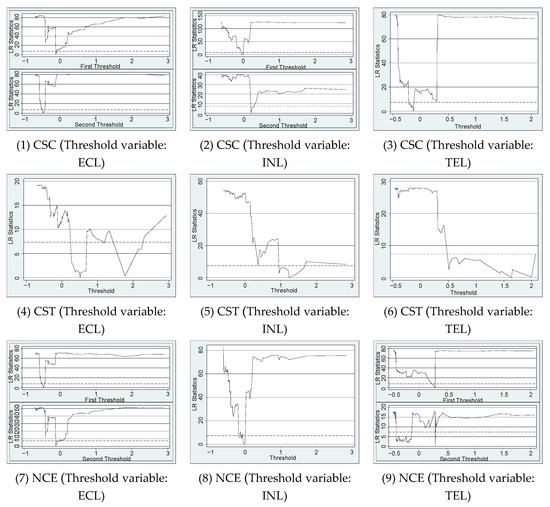
Figure 8.
LR test plot of threshold variables.
4.3.2. Estimation of the Threshold Regression Model
(1) Threshold Effect of Carbon Sink Changes
The economic development level, industrial optimization level, and technological progress level are used as the threshold variables to estimate the threshold effect of the LUT on the carbon sink changes. The results are shown in Table 6.
Table 6.
Estimation of the threshold effects of carbon sink changes.
Within the range of the different thresholds of the economic development level, industrial optimization level, and technological progress level, the LUT all presents a negative impact on the carbon sinks. In the three intervals divided by the threshold value of the economic development level, when the standardized value is lower than −0.461, the carbon sinks decrease by 0.093% for each unit of LUT. When the standardized value is in the interval of (−0.461, −0.114), the carbon sinks decrease by 1.334% for each unit of LUT. When the standardized value is greater than 0.114, for each unit of LUT, the carbon sinks decrease by 0.109%. It is worth noting that in different intervals, although the impact direction of the LUT on the CET shows no change, the impact degree varies significantly, showing a weak–strong–weak trend.
In the three intervals divided by the threshold value of the industrial optimization level, the influence degree of the LUT on the CET is the same as that at the economic development level. In the two intervals divided by the threshold value of the technological progress level, when the standardized value is lower than −0.133, the carbon sinks decrease by 0.036% for each unit of LUT. When the standardized value is greater than −0.133, the carbon sinks decrease by 1.184% for each unit of LUT. Therefore, with technological progress, LUT will have an increasingly significant inhibitory effect on the loss of carbon sinks. These results indicate that the LUT has a nonlinear relationship with the carbon sink changes in the Middle Reaches of the Yangtze River, and the relationship is still on the left side of the U-shaped curve.The control variables with significant impacts on carbon sink changes include energy consumption per unit of GDP, local fiscal expenditure, and environmental regulation. A high GDP energy consumption means a low energy-use efficiency and underdeveloped clean production technologies, and the estimation results demonstrate that energy consumption per unit of GDP has a negative impact on carbon sinks. During the period of rising demand for environmental quality, local fiscal expenditure is gradually transferred to green and ecological industries. The estimation results reveal that the fiscal expenditure during the study period has an inhibitory effect on the loss of carbon sinks. In this paper, environmental regulation is represented by the amount of pollution. The larger the value is, the weaker the environmental regulation will be. The estimation results demonstrate that the overall environmental regulation during the study period is relatively loose, which will increase the loss of the carbon sinks.
(2) Threshold Effect of Carbon Source Transfer
The economic development level, industrial optimization level, and technological progress level are used as the threshold variables to estimate the threshold effect of the LUT on the carbon source transfer. The results are shown in Table 7. Different from the carbon sink changes, the threshold variables all show a single-threshold effect at this time. Moreover, within the intervals divided by the threshold variable values, the LUT all present a positive effect on the carbon source transfer. According to the change in the coefficient of the carbon source transfer, the promotion effect of the LUT on the carbon source transfer is more significant in the second interval than in the first interval, indicating that the LUT has a nonlinear relationship with the carbon source transfer in the Middle Reaches of the Yangtze River, which is on the left side of the inverted U-shaped curve.
Table 7.
Estimation of threshold effects of carbon source transfer.
When the levels of industrial optimization and technological progress are used as the threshold variables for the model estimation and the economic development level is controlled, the results show that economic development significantly promotes carbon source transfer. When the levels of economic development and technological progress are used as the threshold variables for the model estimation and the industrial optimization level is controlled, the results show that a higher industrial optimization level will reduce the carbon source transfer. Similarly, the technological progress level also inhibits the carbon source transfer. The control variables with significant impacts on the carbon source transfer include energy consumption per unit of GDP and local financial expenditure, with the former inhibiting and the latter promoting the carbon source transfer.
(3) Threshold Effect of Net Carbon Emissions
The economic development level, industrial optimization level, and technological progress level are used as the threshold variables to estimate the threshold effect of the LUT on the net carbon emissions. The results are shown in Table 8. The levels of economic development and technological progress show a double-threshold effect, while the industrial optimization level exhibits a single-threshold effect. Within the intervals divided by the threshold variable values, the LUT has a positive effect on the net carbon emissions, which is consistent with the direction that LUT affects carbon source transfer and opposite to the direction that LUT affects carbon sink changes. According to the changes in the coefficient of the net carbon emissions, when the levels of economic development and technological progress are used as the threshold variables, the promotion effect of LUT on net carbon emissions shows a weak–strong–weak trend, while when the industrial optimization level is used as the threshold variable, the promotion effect shows a weak–strong trend. These results indicate that the LUT also has a nonlinear relationship with the net carbon emissions in the Middle Reaches of the Yangtze River, which is still on the left side of the inverted U-shaped curve.
Table 8.
Estimation of threshold effect of net carbon emissions.
The control variables with significant impacts on net carbon emissions include the economic development level, industrial optimization level, technological progress level, energy consumption per unit of GDP, local fiscal expenditure, and urban population density. The impact of the first five control variables on net carbon emissions is in the same direction as that on the carbon source transfer, which again confirms that the increase in the carbon sinks in the Middle Reaches of the Yangtze River is far from sufficient to offset the carbon source transfer-in during the study period. Urban population density affects the carbon source transfer-in, indicating that with an increasing urban population, people are increasingly aware of the importance of environmental protection, and the increase in the demand for environmental quality has affected the scale and type of industries undertaken by the region. High-emission industries are crowded out, and technology-intensive and knowledge-intensive industries are transferred in.
5. Conclusions and Policy Implications
5.1. Conclusions
LUT is the change in land-use form corresponding to the transition of the regional economic and social development stage and has significant impacts on regional carbon sources and carbon sinks. In different stages of LUT, carbon source transfer, carbon sink changes, and net carbon emissions have different characteristics. Studying the nonlinear relationship between LUT and CET is helpful to reveal the law of regional land-use transition and carbon emission transfer from land use and to broaden the research horizon of land use affecting carbon emission. The findings can help the region judge the transition stage it is in, thus providing a reference for a suitable low-carbon development path. In addition, it provides a basis for reducing China’s carbon emission pressure and achieving carbon peak and carbon neutrality by regulating LUT. This paper first builds a theoretical analysis framework for LUT and CET, and then uses the related panel data in the Middle Reaches of the Yangtze River in China from 2000 to 2020 to examine the LUT and CET (including the carbon source transfer, carbon sink changes, and net carbon emissions), and further builds a threshold regression model to study the nonlinear relationship between the LUT and CET. The main conclusions are as follows.
(1) In the past 20 years, with the transformation of economic and social development, the land use in the Middle Reaches of the Yangtze River has undergone a profound transition. The prominent features include continuous decreases in farmland, substantial increases in construction land, and first decreases and then increases in forest. Farmland is the main contributor to the construction land and forest, with a contribution rate exceeding 60%. The features of the LUT also show the changes in the carbon sources and carbon sinks: carbon sink land is converted into carbon source land and low-carbon sink land is converted into high-carbon sink land.
(2) From 2000 to 2020, the carbon source transfer, carbon sink changes, and net carbon emissions in the Middle Reaches of the Yangtze River have a certain regularity. As a whole, the changes in the carbon sinks show an N-shaped pattern of intensification–moderation–reintensification–remoderation. Within the region, the economically developed urban agglomeration areas with Wuhan–Changsha–Nanchang as the core show a continuous loss of carbon sinks, while the economically underdeveloped non-urban agglomeration areas show fluctuations in the carbon sink changes. In general, the carbon source transfer shows an inverted U-shaped pattern of intensification–reintensification–moderation–remoderation. Within the region, the urban agglomeration areas have experienced both the transfer-in and transfer-out of carbon sources (mainly transfer-in before 2010, and mainly transfer-out thereafter), while for the non-urban agglomeration areas, the carbon source transfer-out is gradually changed into transfer-in. The transfer-in of the carbon sources is gradually marginalized, which is consistent with the law of industrial transfer. The phase characteristics of the net carbon emissions are similar to those of the carbon source transfer. The urban agglomeration area shows an increasing trend in the net carbon emissions before 2010, and a decreasing trend after 2010, while it is the opposite for the non-urban agglomeration areas, indicating that the increase in the carbon sinks in the Middle Reaches of the Yangtze River is far from enough to offset the carbon source transfer-in.
(3) The threshold regression model verifies the nonlinear relationship between the LUT and CET in the Middle Reaches of the Yangtze River. The impact of the LUT on the CET shows different threshold effects at the economic development level, industrial optimization level, and technological progress level. The effect of the LUT on the carbon sink changes is manifested as a double-threshold effect at the economic development level and industrial optimization level, and a single-threshold effect at the technological progress level. The effect of the LUT on the carbon source transfer is a single-threshold effect. The effect of the LUT on the net carbon emissions is represented by a double-threshold effect at the economic development level and technological progress level, and a single-threshold effect at the industrial optimization level. The estimation results of the threshold regression model for the carbon sink changes show that the nonlinear relationship between the LUT and the carbon sink changes in the Middle Reaches of the Yangtze River is still on the left side of the U-shaped curve. The estimation results of the threshold regression model of the carbon source transfer and net carbon emissions show that their nonlinear relationship with the LUT is on the left side of the inverted U-shaped curve.
5.2. Policy Implications
In view of the above conclusions, this paper proposes some policy suggestions for the scientific regulation of regional LUT, the promotion of carbon sinks and a reduction in carbon sources, and the improvement of the relationship between LUT and CET to reach an inflection point. First, the local governments should strictly control the transfer of farmland, forest, and grassland (carbon sink land) to construction land (carbon source land), increase the scale and proportion of forest (high-carbon sink land), and implement afforestation and reforestation policies, which can help increase carbon sinks. In addition, the local governments should rationally plan the industrial space on construction land, and improve the efficiency of construction land use, which can help reduce carbon sources. Secondly, the local governments can further increase the threshold for undertaking industries by flexibly applying land supply. On the one hand, the threshold of land use for industries with high energy consumption and high pollution should be raised, while on the other hand, the land supply indicators for high-tech industries and modern service industries can be increased, thereby reducing the carbon source transfer-in. Third, differences in the level of economic development, industrial optimization, and technological progress within regions should be paid attention to. Each area should rationally judge the stage of the relationship between the LUT and CET and promote economic development and environmental governance according to the local conditions. When the industrial transfer from developed areas to underdeveloped areas is carried out, more technical assistance should be provided, which will help achieve carbon emission reduction in the whole region.
This paper attempts to comprehensively explore the law of regional CET and the threshold effect of LUT on it. However, it only quantifies the amount of carbon source transfer, carbon sink changes, and net carbon emissions and does not describe the specific direction of CET due to the limitation of the data and methods. In addition, this paper only involves 42 cities in the Middle Reaches of the Yangtze River in China, and the sample size is relatively small. Therefore, this paper only builds the threshold regression model of the impact of the LUT on the CET by taking the region as a whole and does not further build models, respectively, for economically developed urban and underdeveloped non-urban agglomeration areas. The specific direction of the CET and the unfairness of the carbon emission responsibilities in developed and underdeveloped areas are of great significance to the division of emission reduction responsibilities and the improvement of cross-regional carbon trading and carbon offset systems, which will be an important research direction in the future.
Author Contributions
Conceptualization, Q.X.; data curation and analysis, Q.X.; methodology, L.L. and B.Z.; project administration, J.D.; supervision, J.D.; writing—original draft, Q.X.; writing—review and editing, L.L. and J.D. All authors have read and agreed to the published version of the manuscript.
Funding
This study was supported by the National Natural Science Foundation of China (grant numbers 71774064).
Institutional Review Board Statement
Not applicable.
Informed Consent Statement
Not applicable.
Data Availability Statement
Data available on request.
Conflicts of Interest
The authors declare no conflict of interest.
References
- IPCC. Summary for Policymakers. In Climate Change 2007: The Physical Science Basis; Contribution of Working Group I to the Fourth Assessment Report of the Intergovernmental Panel on Climate Change; Cambridge University Press: Cambridge, UK; New York, NY, USA, 2007. [Google Scholar]
- Wang, J.; Zhao, T.; Wang, Y. How to achieve the 2020 and 2030 emissions targets of China: Evidence from high, mid and low energy-consumption industrial sub-sectors. Atmos. Environ. 2016, 145, 280–292. [Google Scholar] [CrossRef]
- Yang, H.; Zheng, H.; Liu, H.; Wu, Q. NonLinear effects of environmental regulation on eco-efficiency under the constraint of land use carbon emissions: Evidence based on a bootstrapping approach and panel threshold model. Int. J. Environ. Res. Public Health 2019, 16, 1679. [Google Scholar] [CrossRef] [PubMed]
- Zhang, S.; Bai, X.; Zhao, C.; Tan, Q.; Luo, G.; Wu, L.; Xi, H.; Li, C.; Chen, F.; Ran, C.; et al. China’s carbon budget inventory from 1997 to 2017 and its challenges to achieving carbon neutral strategies. J. Clean. Prod. 2022, 347, 130966. [Google Scholar] [CrossRef]
- Jiang, Y.; Khaskheli, A.; Raza, S.A.; Qureshi, M.A.; Ahmed, M. Threshold non-linear relationship between globalization, renewable energy consumption, and environmental degradation: Evidence from smooth transition models. Environ. Sci. Pollut. Res. 2021, 28, 13323–13339. [Google Scholar] [CrossRef] [PubMed]
- Walter, I.; Ugelow, J.L. Environmental policies in developing countries. Ambio 1979, 8, 102–109. [Google Scholar]
- McGuire, M.C. Regulation, factor rewards, and international trade. J. Public Econ. 1982, 17, 335–354. [Google Scholar] [CrossRef]
- Doytch, N.; Uctum, M. Globalization and the environmental impact of sectoral FDI. Econ. Syst. 2016, 40, 582–594. [Google Scholar] [CrossRef]
- Weber, C.L.; Peters, G.P.; Guan, D.; Hubacek, K. The contribution of Chinese exports to climate change. Energy Policy 2008, 36, 3572–3577. [Google Scholar] [CrossRef]
- Wyckoff, A.W.; Roop, J.M. The embodiment of carbon in imports of manufactured products: Implications for international agreements on greenhouse gas emissions. Energy Policy 1994, 22, 187–194. [Google Scholar] [CrossRef]
- Jakob, M. Why carbon leakage matters and what can be done against it. One Earth 2021, 4, 609–614. [Google Scholar] [CrossRef]
- Yang, Y.; Shi, Y.; Sun, W.; Chang, J.; Zhu, J.; Chen, L.; Wang, X.; Guo, Y.; Zhang, H.; Yu, L.; et al. Terrestrial carbon sinks in China and around the world and their contribution to carbon neutrality. Sci. China Life Sci. 2022, 65, 861–895. [Google Scholar] [CrossRef] [PubMed]
- Rogelj, J.; Schaeffer, M.; Meinshausen, M.; Knutti, R.; Alcamo, J.; Riahi, K.; Hare, W. Zero emission targets as long-term global goals for climate protection. Environ. Res. Lett. 2015, 10, 105007. [Google Scholar] [CrossRef]
- Fang, J.Y.; Guo, Z.D.; Piao, S.L.; Chen, A.P. Terrestrial vegetation carbon sinks in China, 1981–2000. Sci. China Ser. D Earth Sci. 2007, 50, 1341–1350. [Google Scholar] [CrossRef]
- Xu, Q.; Yang, R.; Dong, Y.X.; Liu, Y.X.; Qiu, L.R. The influence of rapid urbanization and land use changes on terrestrial carbon sources/sinks in Guangzhou, China. Ecol. Indic. 2016, 70, 304–316. [Google Scholar] [CrossRef]
- Zhang, P.; He, J.; Hong, X.; Zhang, W.; Qin, C.; Pang, B.; Li, Y.; Liu, Y. Carbon sources/sinks analysis of land use changes in China based on data envelopment analysis. J. Clean. Prod. 2018, 204, 702–711. [Google Scholar] [CrossRef]
- Zhao, L.; Chen, D.; Zhao, N.; Li, Q.; Cheng, Q.; Luo, C.; Xu, S.; Wang, S.; Zhao, X. Responses of carbon transfer, partitioning, and residence time to land use in the plant–soil system of an alpine meadow on the Qinghai-Tibetan Plateau. Biol. Fert. Soils. 2015, 51, 781–790. [Google Scholar] [CrossRef]
- Müller-Wenk, R.; Brandão, M. Climatic impact of land use in LCA—Carbon transfers between vegetation/soil and air. Int. J. Life Cycle Assess. 2010, 15, 172–182. [Google Scholar] [CrossRef]
- Xia, C.; Chen, B. Urban land-carbon nexus based on ecological network analysis. Appl. Energy 2020, 276, 115465. [Google Scholar] [CrossRef]
- Lambin, E.F.; Meyfroidt, P. Land use transition: Socio-ecological feedback versus socio-economic change. Land Use Policy 2010, 27, 108–118. [Google Scholar] [CrossRef]
- Grainger, A. The forest transition: An alternative approach. Area 1995, 27, 242–251. [Google Scholar]
- Mather, A.S.; Fairbairn, J.; Needle, C.L. The course and drivers of the forest transition: The case of France. J. Rural Stud. 1999, 15, 65–90. [Google Scholar] [CrossRef]
- Long, H.L.; Qu, Y. Land use transitions and land management: A mutual feedback perspective. Land Use Policy 2017, 34, 1607–1618. [Google Scholar] [CrossRef]
- Lyu, L.; Gao, Z.; Long, H.; Wang, X.; Fan, Y. Farmland use transition in a typical farming area: The case of Sihong County in the Huang-Huai-Hai Plain of China. Land 2021, 10, 347. [Google Scholar] [CrossRef]
- Ojoyi, M.M.; Mutanga, O.; Odindi, J.; Kahinda, J.M.; Abdel-Rahman, E.M. Implications of land use transitions on soil nitrogen in dynamic landscapes in Tanzania. Land Use Policy 2017, 64, 95–100. [Google Scholar] [CrossRef]
- Long, H.; Zhang, Y.; Ma, L.; Tu, S. Land use transitions: Progress, challenges and prospects. Land 2021, 10, 903. [Google Scholar] [CrossRef]
- Li, Y.; Huang, X.; Zhen, F. Effects of land use patterns on carbon emission in Jiangsu Province. Trans. CSAE 2008, 24, 102–107. [Google Scholar]
- Chuai, X.; Huang, X.; Wang, W.; Zhao, R.; Zhang, M.; Wu, C. Land use, total carbon emissions change and low carbon land management in Coastal Jiangsu, China. J. Clean. Prod. 2015, 103, 77–86. [Google Scholar] [CrossRef]
- Kuang, B.; Lu, X.; Zhou, M.; Chen, D. Provincial cultivated land use efficiency in China: Empirical analysis based on the SBM-DEA model with carbon emissions considered. Technol. Forecast. Soc. Change 2020, 151, 119874. [Google Scholar] [CrossRef]
- MacDonald, H.; McKenney, D. Envisioning a global forest transition: Status, role, and implications. Land Use Policy 2020, 99, 104808. [Google Scholar] [CrossRef]
- Wang, W.; Hu, Y. The measurement and influencing factors of carbon transfers embodied in inter-provincial trade in China. J. Clean. Prod. 2020, 270, 122460. [Google Scholar] [CrossRef]
- Yue, L.; Miao, J.; Ahmad, F.; Draz, M.U.; Guan, H.; Chandio, A.A.; Abid, N. Investigating the role of international industrial transfer and technology spillovers on industrial land production efficiency: Fresh evidence based on Directional Distance Functions for Chinese provinces. J. Clean. Prod. 2022, 340, 130814. [Google Scholar] [CrossRef]
- Chen, L.; Xu, L.; Yang, Z. Accounting carbon emission changes under regional industrial transfer-in an urban agglomeration in China’s Pearl River Delta. J. Clean. Prod. 2017, 167, 110–119. [Google Scholar] [CrossRef]
- Wu, Y.; Zhang, X.; Skitmore, M.; Song, Y.; Hui, E.C.M. Industrial land price and its impact on urban growth: A Chinese case study. Land Use Policy 2014, 36, 199–209. [Google Scholar] [CrossRef] [Green Version]
- Ma, W.; Jiang, G.; Li, W.; Zhou, T. How do population decline, urban sprawl and industrial transformation impact land use change in rural residential areas? A comparative regional analysis at the peri-urban interface. J. Clean. Prod. 2018, 205, 76–85. [Google Scholar]
- Tian, Y.; Jiang, G.; Zhou, D.; Ding, K.; Su, S.; Zhou, T.; Chen, D. Regional industrial transfer-in the Jingjinji urban agglomeration, China: An analysis based on a new “transferring area-undertaking area-dynamic process” model. J. Clean. Prod. 2019, 235, 751–766. [Google Scholar] [CrossRef]
- Lu, X.; Jiang, X.; Gong, M. How land transfer marketization influence on green total factor productivity from the approach of industrial structure? Evidence from China. Land Use Policy 2020, 95, 104610. [Google Scholar] [CrossRef]
- Dong, Y.; Jin, G.; Deng, X. Dynamic interactive effects of urban land-use efficiency, industrial transformation, and carbon emissions. J. Clean. Prod. 2020, 270, 122547. [Google Scholar] [CrossRef]
- Wang, H.; Lu, S.; Lu, B.; Nie, X. Overt and covert: The relationship between the transfer of land development rights and carbon emissions. Land Use Policy 2021, 108, 105665. [Google Scholar] [CrossRef]
- Jiang, G.; Ma, W.; Qu, Y.; Zhang, R.; Zhou, D. How does sprawl differ across urban built-up land types in China? A spatial-temporal analysis of the Beijing metropolitan area using granted land parcel data. Cities 2016, 58, 1–9. [Google Scholar]
- Hui, E.C.; Leung, B.Y.; Yu, K. The impact of different land-supplying channels on the supply of housing. Land Use Policy 2014, 39, 244–253. [Google Scholar] [CrossRef]
- Chen, W.; Shen, Y.; Wang, Y.; Wu, Q. The effect of industrial relocation on industrial land use efficiency in China: A spatial econometrics approach. J. Clean. Prod. 2018, 205, 525–535. [Google Scholar] [CrossRef]
- Yang, Y.; Jiang, G.; Zheng, Q.; Zhou, D.; Li, Y. Does the land use structure change conform to the evolution law of industrial structure? An empirical study of Anhui Province, China. Land Use Policy 2019, 81, 657–667. [Google Scholar]
- Lu, N.; Wei, H.; Fan, W.; Xu, Z.; Wang, X.; Xing, K.; Dong, X.; Viglia, S.; Ulgiati, S. Multiple influences of land transfer-in the integration of Beijing-Tianjin-Hebei region in China. Ecol. Indic. 2018, 90, 101–111. [Google Scholar] [CrossRef]
- Zhang, L.; Li, X.; Liu, B. Can land marketization promote the industrial structure optimization: Based on the analysis of micro land transfer data. China Land Sci. 2018, 32, 23–31. [Google Scholar]
- Liu, X.; Li, T.; Zhang, S.; Jia, Y.X.; Li, Y.; Xu, X.X. The role of land use, construction and road on terrestrial carbon stocks in a newly urbanized area of western Chengdu, China. Landsc. Urban Plan. 2016, 147, 88–95. [Google Scholar] [CrossRef]
- Zhang, R.; Pu, L.; Wen, J.; Xu, Y. Hypothesis and validation on the Kuznets Curve of construction land expansion and carbon emission effect. J. Nat. Resour. 2012, 27, 723–733. [Google Scholar]
- Hansen, B.E. Threshold effects in non-dynamic panels: Estimation, testing, and inference. J. Econ. 1999, 93, 345–368. [Google Scholar] [CrossRef]
- Hansen, B.E. Sample splitting and threshold estimation. Econometrica 2000, 68, 575–603. [Google Scholar] [CrossRef] [Green Version]
- Huang, J.; Liu, Q.; Cai, X.; Hao, Y.; Lei, H. The effect of technological factors on China’s carbon intensity: New evidence from a panel threshold model. Energy Policy 2018, 115, 32–42. [Google Scholar] [CrossRef]
- Wu, H.; Xu, L.; Ren, S.; Hao, Y.; Yan, G. How do energy consumption and environmental regulation affect carbon emissions in China? New evidence from a dynamic threshold panel model. Resour. Policy 2020, 67, 101678. [Google Scholar]
- Song, Z. Economic growth and carbon emissions: Estimation of a panel threshold model for the transition process in China. J. Clean. Prod. 2021, 278, 123773. [Google Scholar] [CrossRef]
- Zhang, L.; Ma, L. The relationship between industrial structure and carbon intensity at different stages of economic development: An analysis based on a dynamic threshold panel model. Environ. Sci. Pollut. Res. 2020, 27, 33321–33338. [Google Scholar] [CrossRef] [PubMed]
- Huo, T.; Cao, R.; Du, H.; Zhang, J.; Cai, W.; Liu, B. Nonlinear influence of urbanization on China’s urban residential building carbon emissions: New evidence from panel threshold model. Sci. Total Environ. 2021, 772, 145058. [Google Scholar] [CrossRef] [PubMed]
- Long, H. Land use transition: A new integrated approach of land use/cover change study. Geogr. Geo-Inf. Sci. 2003, 19, 87–90. [Google Scholar]
- Qi, Y.; Rao, G.; Zha, L.; Chen, L.; Niu, Y. Carbon transfer decision model based on LMDI method. Comput. Intel. Neurosc. 2022, 2022, 3970880. [Google Scholar] [CrossRef]
- Zhu, E.; Deng, J.; Zhou, M.; Gan, M.; Jiang, R.; Wang, K.; Shahtahmassebi, A. Carbon emissions induced by land-use and land-cover change from 1970 to 2010 in Zhejiang, China. Sci. Total Environ. 2019, 646, 930–939. [Google Scholar] [CrossRef]
- Lai, L. Carbon Emission Effect of Land Use in China; Nanjing University: Nanjing, China, 2010. [Google Scholar]
- Zhang, M.; Lai, L.; Huang, X.; Chuai, X.; Tan, J. The carbon emission intensity of land use conversion in different regions of China. Resour. Sci. 2013, 35, 792–799. [Google Scholar]
- Sun, H.; Liang, H.; Chang, X.; Cui, Q.; Tao, Y. Land use patterns on carbon emission and spatial association in China. Econ. Geogr. 2015, 35, 154–162. [Google Scholar]
- Zhang, W.; Li, F.; Hu, Y. The study of provincial transfers and reduction responsibilities of China’s CO2 emissions. China Ind. Econ. 2014, 3, 57–69. [Google Scholar]
- Wang, S.; Tian, S.; Cai, Q.; Wu, H.; Wu, C. Driving factors and carbon transfer of industrial carbon emissions in Guangdong province under the background of industrial transfer. Geogr. Res. 2021, 40, 2606–2622. [Google Scholar]
- Liu, H.; Liu, W.; Liu, Z. The quantitative study on inter-regional industry transfer. China Ind. Econ. 2011, 29, 79–88. [Google Scholar]
- IPCC. IPCC Guidelines for National Greenhouse Gas Inventories; Prepared by the National Greenhouse Gas Inventories Programme—Volume 2, Energy. Intergovernmental Panel on Climate Change. Mobile Combustion; IGES: Kanagawa, Japan, 2006. [Google Scholar]
- Wang, Q. Fixed-effect panel threshold model using Stata. Stata J. 2015, 15, 121–134. [Google Scholar] [CrossRef]
- Gu, W.; Zhao, X.; Yan, X.; Wang, C.; Li, Q. Energy technological progress, energy consumption, and CO2 emissions: Empirical evidence from China. J. Clean. Prod. 2019, 236, 117666. [Google Scholar] [CrossRef]


Publisher’s Note: MDPI stays neutral with regard to jurisdictional claims in published maps and institutional affiliations. |
© 2022 by the authors. Licensee MDPI, Basel, Switzerland. This article is an open access article distributed under the terms and conditions of the Creative Commons Attribution (CC BY) license (https://creativecommons.org/licenses/by/4.0/).