Article

Analysis of Spatial Carbon Metabolism by ENA: A Case Study of Tongzhou District, Beijing

1
Faculty of Architecture, Civil and Transportation Engineering, Beijing University of Technology, Beijing 100124, China
2
Beijing Municipal Institute of City Planning & Design, Beijing 100045, China
3
Beijing Tsinghua TongHeng Urban Planning & Design Institute, Beijing 100085, China
*
Author to whom correspondence should be addressed.
Land 2022, 11(9), 1573; https://doi.org/10.3390/land11091573
Submission received: 16 August 2022 / Revised: 4 September 2022 / Accepted: 7 September 2022 / Published: 15 September 2022
(This article belongs to the Special Issue Urban Planning Pathways to Carbon Neutrality)

Abstract

:
Carbon metabolism research has attracted worldwide attention as an important way to cope with climate change, promote carbon emission reduction, increase carbon sequestration, and support low-carbon city construction. Ecological network analysis (ENA) plays an important role in network analysis and simulation of carbon metabolism. However, current studies largely focus on single elements or local processes while rarely analyzing the spatial coupling between land use and carbon metabolism. Therefore, taking Tongzhou District as an example, based on the data of land use change and energy consumption, this study constructed an analysis framework based on ENA to explore the comprehensive impact of land use changes on carbon metabolism. The results show the following: (1) From 2014 to 2020, the total carbon emissions increased year by year. Carbon emissions of other construction land (OCL) were dominant, while the carbon sequestration capacity of forest land (FL) increased by 236%. The positive carbon metabolic density remained relatively stable, while the negative carbon metabolic density decreased year by year. (2) The negative carbon flow was concentrated in the transfer of other land to OCL, accounting for 40.2% of the total negative “carbon flow.” The positive carbon flow was primarily from the transfer of other land to FL. (3) From 2014 to 2016, the spatial ecological relationships of carbon flow were dominated by exploitation and control. From 2016 to 2018, competition relationships intensified due to the expansion of the field; from 2016 to 2018, exploitation and control relationships, competition relationships, and mutualism relationships increased significantly and were evenly distributed. This study provides decision-making guidance for the subsequent formulation of government carbon emission reduction policies.

1. Introduction

Carbon emission reduction and carbon sequestration enhancement are key factors for the global response to climate change [1,2,3]. Carbon metabolism can effectively track the inflow and outflow of carbon in cities and can help to find the key nodes for carbon emission reduction and carbon sequestration enhancement [4,5]. Looking at the carbon element of the whole city from the perspective of metabolism is helpful for clarifying the intensity and efficiency of carbon circulation among various components of the urban ecosystem and for comprehensively understanding the mechanism and operation laws of the carbon element cycle. Land use and land cover change are key factors affecting carbon emissions and carbon sequestration [6,7,8]. It was estimated that over the past 150 years, the contribution of land use change to carbon emissions has accounted for about one third of human activity since the industrial revolution [9]. Therefore, it is of great significance to study the driving mechanisms of land use changes on carbon metabolism in order to explore the development path of low-carbon cities.
In recent years, the research on land use change and carbon metabolism has primarily focused on the impact of land use changes on the carbon cycle [10,11,12,13,14,15,16,17,18], the multi-scale measure of carbon emission intensity and efficiency [19,20,21,22,23], the impact of spatial policy and urban planning on carbon metabolism [24,25,26,27,28,29,30,31,32], and the utility analysis and coupling relationship between carbon emissions and carbon sequestration [33,34,35,36,37,38,39]. Such studies could be seen as preliminary investigations of land use changes and carbon metabolism attempting to clarify the impact of land use changes on carbon emissions and sequestration from a single element or a local perspective. For example, Zhu et al. examined the impact of land use changes on carbon emissions in Zhejiang Province over the past four decades [11]. Tang et al. performed a spatial–temporal assessment of carbon emissions and carbon sequestration from land use changes in the Mekong River Basin [15]. Kellett et al. developed a systematic approach to the study of carbon cycles and emissions at the urban community scale [19]. Zheng et al. analyzed the effect of sustainable development policies of resource-based cities on carbon emission reduction [25]. Ecological network analysis (ENA) is widely used in the study of urban metabolism [34,35,38], because it has the advantage of quantitatively determining the ecological flow direction and intensity in complex networks, which is helpful to determine the path of structural optimization. For example, Xia and Du calculated the respective carbon fluxes in Hangzhou and Zhaotong using ENA [8,35]; the research results provided effective guidance and a new perspective for the formulation of urban low-carbon spatial development planning. Such studies simply focused on quantitative relationships while ignoring the spatial analysis of carbon metabolic processes and coarsely studied the natural subjects involved in carbon metabolic processes. Therefore, the combined effects of land use change on carbon metabolism need to be investigated.
To fill these gaps, this study employed Tongzhou District as an example, where we selected three time periods with high temporal accuracy (2014–2016, 2016–2018, and 2018–2020) to establish a land use–carbon metabolism analysis model based on ENA. We discuss the impact of land use changes on spatial carbon metabolism. In particular, we sought to (1) explore the impact of land use changes on carbon flow; (2) examine the ecological relationships and spatial distribution of carbon metabolism in the territorial space; and (3) provide guidance for urban carbon emission reduction and carbon sequestration enhancement.

2. Materials and Methods
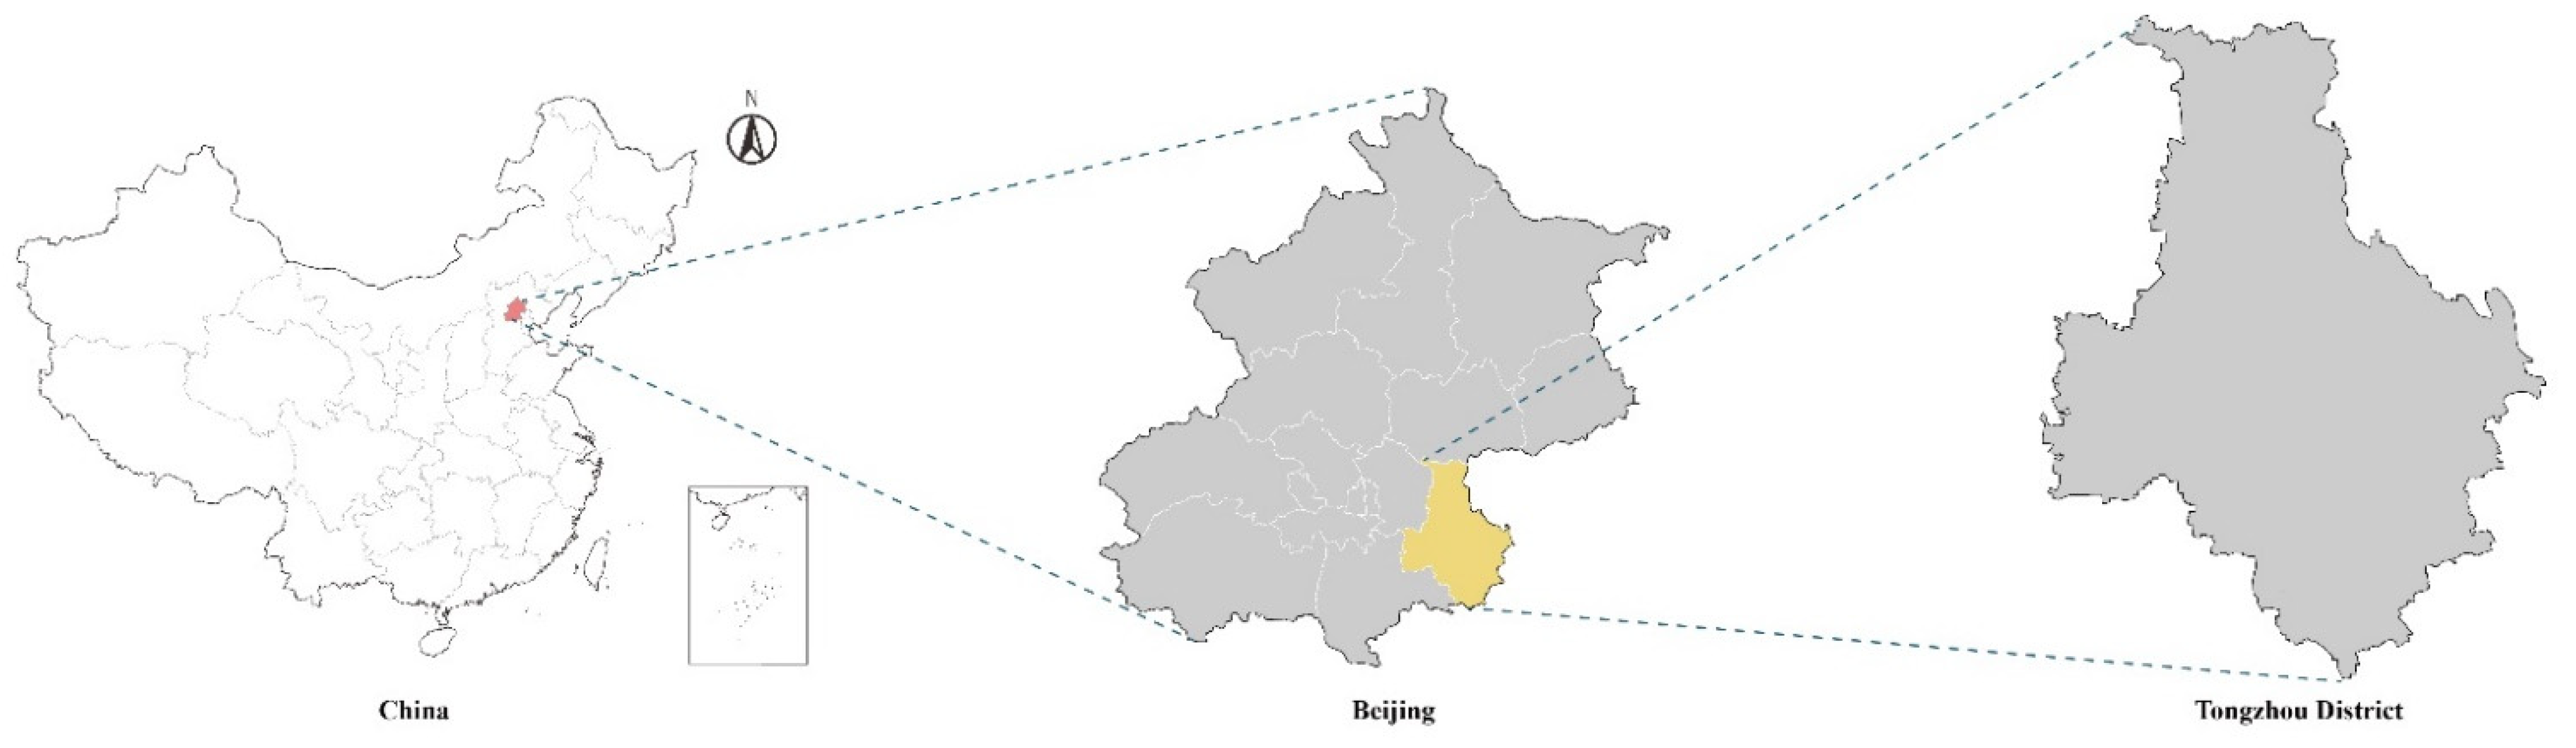
2.1. Study Area

The study area was located in Tongzhou District, Beijing, with an area of 906 km2 (Figure 1). This area is a key node in the geographical pattern of the plains in the east of the capital from mountain to sea. In recent years, Tongzhou District’s economy has developed rapidly, and the government has invested hundreds of billions of yuan every year to support and cultivate new economic growth points, with the GDP growing from CNY 54.89 billion in 2014 to CNY 110.3 billion in 2020. Economic development has brought about drastic changes in land use. Moreover, the government has actively promoted green and low-carbon transition and has formulated policies in finance, planning, management, and other fields to improve carbon metabolism and actively create carbon-neutral examples in China. The economic development and policy measures of Tongzhou District are typical for the study of the impact of land use change on carbon metabolism. Therefore, it is of great practical value to deeply discuss the eco-environmental effects in the process of the spatial evolution of rapidly developing areas.

2.2. Data Sources and Preparation

Land use data for 2014–2020 were obtained from the interpretation results of thematic mapper remote sensing image supervision classification. To improve the accuracy of the data, each remote sensing image was preprocessed with survey correction and geometric correction.
The data for energy, resident population, household car ownership, motorcycle ownership, bicycle self-ownership, taxi ownership, suburban passenger car ownership, highway cargo turnover, fertilizer application amount, and pig, cattle, and sheep breeding were obtained from the Statistical Yearbook of Beijing in the corresponding year. The carbon emission generated by the energy consumption of industrial land and other construction land in 2018 and 2020 was calculated based on the total equivalent amounts of standard coal. The data on total power and irrigation area of agricultural machinery were converted to the ratio of the sown area to the area of the city in the same year.

2.3. Methods

2.3.1. Calculating the Carbon Transitions Caused by Land Use Changes

Carbon metabolism includes carbon emission and carbon sequestration. According to Xia, Zhang, Du, and Liu et al.’s research on carbon metabolism [7,8,33,35,37], the territorial space can be divided into seven compartments, i.e., forest land (FL), cultivated land (CL), grassland (GL), water and wetland (WL), industrial land (IL), road and traffic land (R&TL), and other construction land (OCL). These categories can be combined with the actual situation of land use in Tongzhou District. IL, R&TL, and OCL are the main contributors to carbon emissions. FL, GL, and WL are important carbon sequestration zones. CL includes the activities of agricultural production and animal husbandry and has the dual functions of carbon emission and carbon sequestration (Figure 2). Due to the complexity of obtaining indirect carbon emission data in the processes of production and living, only direct carbon emissions caused by vertical land use were calculated in this study.
The calculation formulas for carbon emissions are as follows [40]:
VN = VI + VT + VU + VC
VI = ∑EiFi
VT = Vp + VF
Vp = K1Mh + K2Mt + K3Mm + K4Mz + K5Mb
VF = ∑K6MF
VU = ∑EuFi + K7P
VC = VA + VL
VA = K8M + K9Si + K10D
VL = K11(Pi + Gi) + K12 Ci
where VN is the spatial total carbon emission; VI is the carbon emission of IL; VT is the R&TL use carbon emission; VU is the OCL carbon emission; VC is the carbon emissions of CL; Ei is the industrial energy consumption amount (of standard coal); Fi is the energy carbon emission coefficient; Vp is the passenger transport carbon emission; VF is the freight transport carbon emission; Ki is a carbon emission coefficient; and Mh, Mt, Mm, Mz and Mb are, respectively, the mileages of family cars, suburban passenger buses, motorcycles, mopeds, and taxis. According to relevant research, the average annual mileage per car in China is about 15,000 km, and the average annual mileage per motorcycle and moped is 4000 km. The mileage of taxis was selected as 250 km per vehicle per day, and the mileage of suburban passenger vehicles was calculated according to the numbers of suburban passenger transport vehicles, passenger routes, and the total mileage of passenger transport in the Statistical Yearbook of Beijing 2014, 2016, 2018, and 2020. MF is the highway cargo turnover. Considering the small amount of railway cargo transportation in Tongzhou District, this study did not consider the carbon emissions generated by freight transportation. Eu is the energy consumption (standard coal) of OCL in the territorial space, and P is the size of the resident population. VA is the carbon emission from agricultural activities; VL is the carbon emission from livestock metabolism; M is the total driving force of agricultural machinery; Si is the irrigated area of the entire region; and D is the scale of fertilizer application. Pi, Gi, and Ci are pig, sheep, and cattle feeds, respectively. All K and F values are shown in Table 1.
The calculation formula for carbon sequestration is as follows:
Vs = ∑KnSn
where Vs is the sum of carbon sequestration in the territorial space, Sn is the area of land types with carbon sequestration in various territorial spaces, and Kn is the carbon sequestration coefficient of land sub-types in various territorial spaces referring to the studies of Gui, Fang, Liu, Duan, and Walsh et al. in Table 2 [46,47,48,49,50,51,52].
Based on the definitions of carbon emission and carbon sequestration capacity, carbon metabolic density ΔW can be defined as follows:
ΔW = WiWj = Vi/SiVj/Sj
Fij = ΔWΔS
where i and j represent two types of land subdivision; Fij represents the “carbon flow” generated after the land type changes from j to i; Wi represents the net “carbon flow” density of subdivision i; Wj represents the net “carbon flow” density of subdivision j; and ΔS represents the land use transfer area. If ΔW > 0, this indicates that urban carbon metabolism is positive, and urban carbon sequestration is increasing or carbon emissions are gradually decreasing. The opposite, in contrast, suggests that the city’s carbon metabolism is out of balance, with the city’s carbon sequestration decreasing or carbon emissions increasing.

2.3.2. Determining Ecological Relationships between Different Land Uses

ENA is an analytical method used to delineate the interactions between ecosystem components and to identify the internal attributes of the system as a whole [53]. The method is widely used in the analysis of economic and urban metabolic systems [54,55], in industrial ecological models [56,57], in landscape ecology [58,59,60], and in other fields [61,62]. For example, Ukidwe et al. used network analysis to study the ecological relationships of the chemical industry [56]. Chen et al. studied the structural complexity of ecological industrial systems [57]. Ecological networks quantitatively describe the material and energy flow between different compartments of an ecosystem by simulating the compartments and paths of biological networks [53]. ENA was used to quantitatively analyze the interaction and intensity of the two compartments in the carbon metabolism network under the action of the overall network. Furthermore, we referred to the dynamic analysis of Finn’s equilibrium variable [63] and the conclusions of Zhang et al.’s study on the changes in carbon storage in Beijing’s urban carbon cycle [33], i.e., all compartments may obtain and store carbon from the environment and can also emit carbon into the environment, but the overall inflow is equal to the overall outflow.
The effective utilization matrix (D) can reflect the direct effect of each “carbon flow”; matrix elements dij represent the effective utilization rate of “carbon flow” between compartments i and j. According to D, the dimensionless overall utility matrix U can be obtained, and the specific calculations are as follows:
dij = (fijfji)/Ti
D i j = ( f j j f j j T j f j i f i j T j f i j f j i T i f i i f i i T i )
U = ( U i j ) = m = 0 n D m = ( I D ) 1
where Uij is an element of matrix U, and n is the type of land used in the territorial space; I is the identity matrix that represents the self-feedback effect of various land uses in the process of carbon flow exchange; Fij is the horizontal carbon flow from land j to land i; and Ti is the carbon flux of land type i. The ecological relationship between the two land uses can be judged according to the complete utility matrix U. There are four common relationships in ecological networks: plunder, restriction, mutualism, and competition.
The interaction mode between compartments in the ecological network can be obtained through the overall utility matrix U. According to relevant studies, there are nine ecological relationships in theory (listed in Table 3), among which the exploitation and control relationship indicates that one compartment uses another compartment. The competitive relationship indicates that the competition between two compartments leads to utility loss, and the mutualistic symbiosis relationship indicates that the two compartments increase utility in the interaction.
The positive and negative elements in the complete utility matrix U can reflect whether the interactions between nodes in the ecological network are positive or negative. The comprehensive impact of carbon balance is defined as M, and the calculation formula is as follows:
M = S+/S
where S+ and S−, respectively, represent the number of positive and negative elements in the matrix U. M > 1 indicates that the comprehensive effect of land use change on carbon metabolism is positive, and the reciprocal synergy of the whole ecological synergy is greater than the negative competition. In contrast, when M < 1, the comprehensive effect is negative. The smaller the value of M, the stronger the negative effect.

3. Results

3.1. Spatial Carbon Metabolism

3.1.1. Carbon Emission

Figure 3 illustrates the carbon emissions caused by land use changes from 2014 to 2020. The total carbon emission of Tongzhou District in 2020 was 413.5 × 10⁴ TC, an increase of 10.94% compared with 2014, with an average annual growth of about 1.82%. The growth rate was higher in 2016–2018, with an increase of about 17.5 × 10⁴ TC. With the increasing demands of Tongzhou District’s economic development and population density, carbon emissions, especially those of R&TL and OCL, increased rapidly. In 2020, carbon emissions from OCL dominated, with 286.2 × 10⁴ TC contributing 69% of the total carbon emissions. The proportion of CL carbon emissions in total carbon emissions was small, being 2.36%, 2%, 0.55%, and 0.31% in 2014, 2016, 2018, and 2020, respectively.

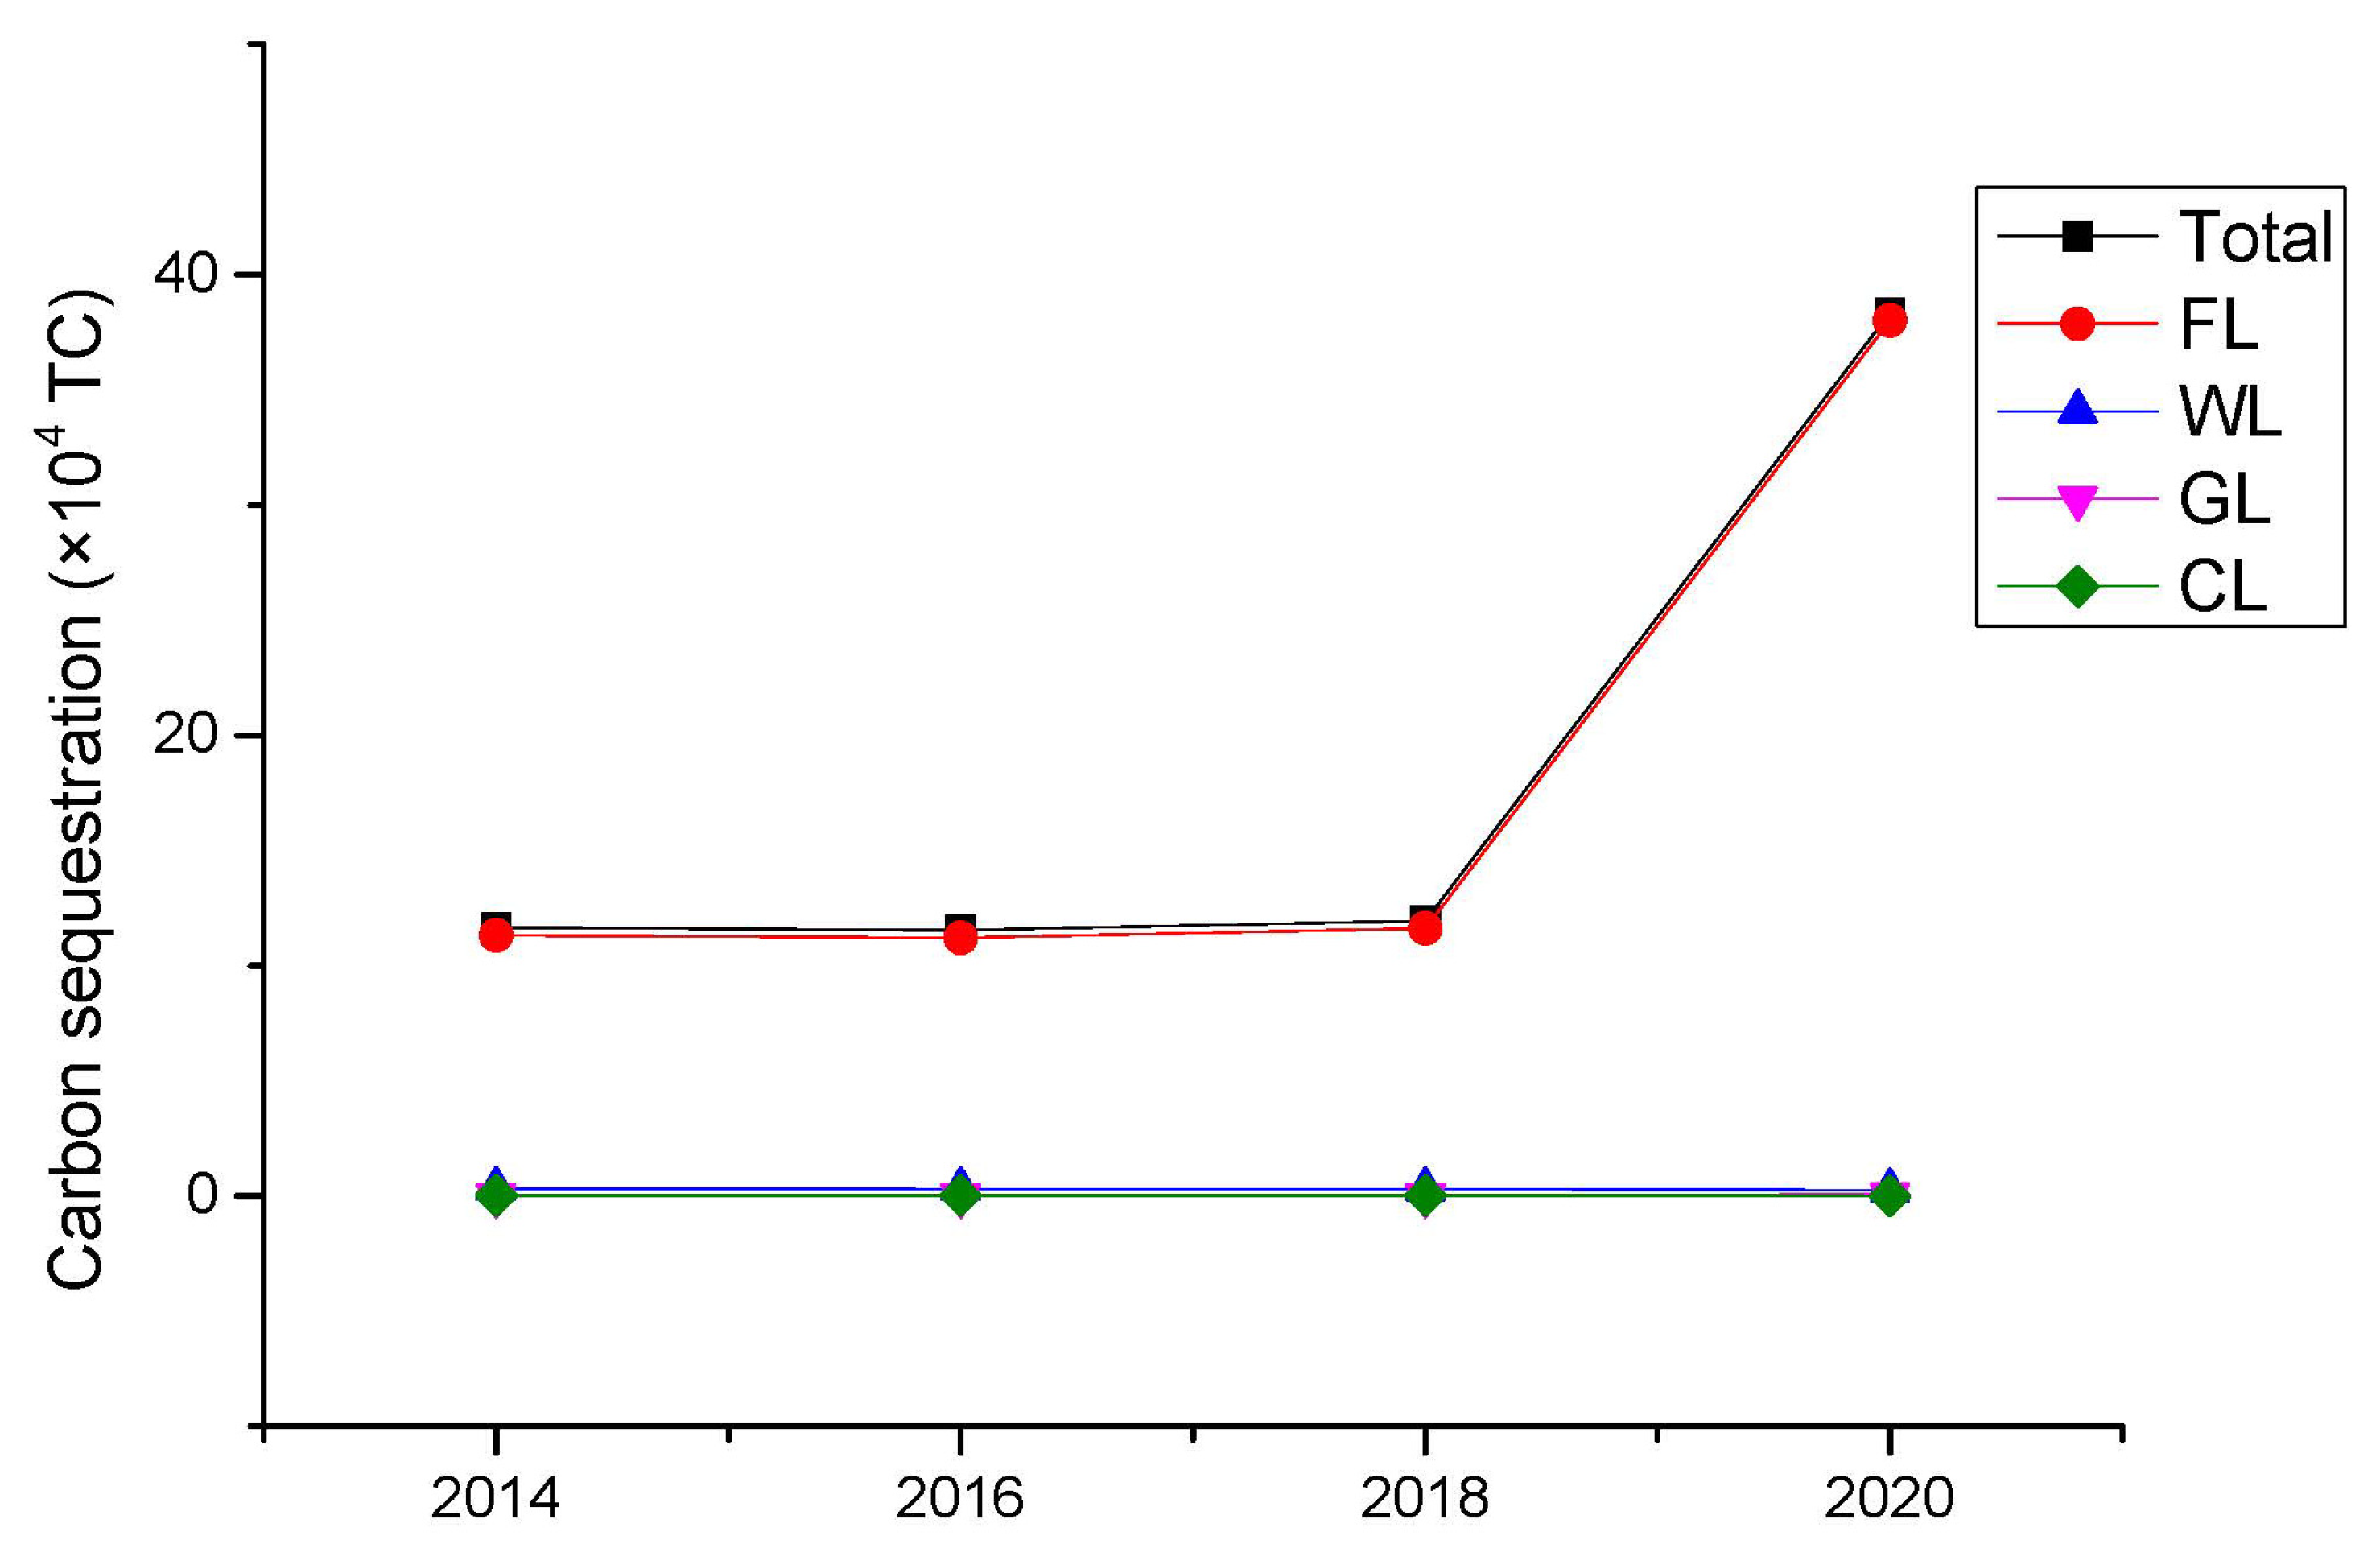
3.1.2. Carbon Sequestration

The total carbon sequestration of Tongzhou District in 2020 was 38.3 × 10⁴ TC, an increase of 230% compared with 11.7 × 10⁴ TC in 2014 (Figure 4). Comparing carbon emissions, the increase was significant. FL was the most important functional land for carbon sequestration, contributing 69% of the total carbon sequestration. In general, the total spatial carbon emission was greater than the carbon absorption in all three periods, and the net carbon flux in the vertical direction was negative. Due to the promotion of low-carbon development policies, the proportion of carbon emissions offset by carbon sequestration increased from 3.1% in 2014 to 9.3% in 2020. The carbon balance has improved, but it is still dominated by carbon emissions. Ecological problems need to be paid attention to. The control of carbon emission sources and intensity is the key to realizing the balance of carbon metabolism in the territorial space.

3.1.3. Carbon Flow from 2014 to 2020

Based on the calculations of carbon flux in the vertical direction of Tongzhou District and the data of land use change, the carbon metabolic densities of each land use from 2014 to 2020 were obtained (Figure 5). From 2014 to 2020, FL, GL, and WL were the positive carbon metabolism compartments in the entire space of Tongzhou District, and the carbon sequestration density remained relatively stable. Therefore, the change in carbon sequestration was largely related to the change in land area use. R&TL, IL, OCL, and CL all fell within the range of negative carbon metabolism. The net carbon emission of the negative carbon metabolism compartment, which occupied less than 47% of the total area of the sub-center, was about 11–32 times the net carbon sequestration of the positive carbon metabolism compartment. Due to the large amount of carbon produced by CL, the carbon metabolic density was negative, although CL had the function of carbon sequestration. OCL dominated the negative carbon metabolism, and the carbon metabolism density decreased by 33.7% during the period of 2014–2020. The carbon metabolism density of R&TL was reduced by 61.6%. The sub-compartment of IL is an important factor for negative carbon metabolism. With the industrial land reduction in Tongzhou District, the carbon metabolism density in 2020 was reduced to 71% of that in 2014.
According to the distribution of “carbon flow” caused by land use changes in different periods, the net “carbon flow” driven by low-carbon city construction continued to increase, with an increase of 13.3% in 2016–2018 compared with 2014–2016 (Table 4). Although the net “carbon flow” in 2014–2018 remained negative, and the positive “carbon flow” was less than the negative “carbon flow,” the carbon metabolism improved each year, and the net “carbon flow” in 2018–2020 increased by 897% compared with that in 2016–2018. The net “carbon flow” in the region changed from negative to positive, with a significant increase. The main reason was that R&TL, CL, and IL were converted to FL.
In the three research periods, the negative “carbon flow” mainly came from the conversion of IL to OCL (2014–2016), CL to OCL (2016–2018), and CL to OCL (2018–2020), accounting for 40.2%, 32.3%, and 23.6% of the total negative “carbon flow”, respectively. From 2018 to 2020, the contributions of the conversion of CL to R&TL and FL to OCL were not negligible, accounting for 17.4% and 12.2% of the total negative carbon flow, respectively. This indicates that the high carbon emissions caused by R&TL and OCL occupation of CL and FL in the early stages of low-carbon city construction have become important factors affecting the balance of carbon metabolism in regional territorial spaces. In addition, in order to solve the problem of work–housing balance caused by population redistribution, the supply of land for housing, offices, and scientific and technological innovation centers has increased, exerting pressure on the balance of carbon metabolism. The positive “carbon flow” was primarily from the conversion of OCL to IL (2014–2016), OCL to FL (2016–2018), and OCL to FL (2018–2020), accounting for 54%, 40.2%, and 31.8% of the total positive “carbon flow”, respectively. FL, as an important source of carbon sequestration, improved the capacity of carbon metabolism in the territorial space.

3.2. Spatial Ecological Relationships of Carbon Flow

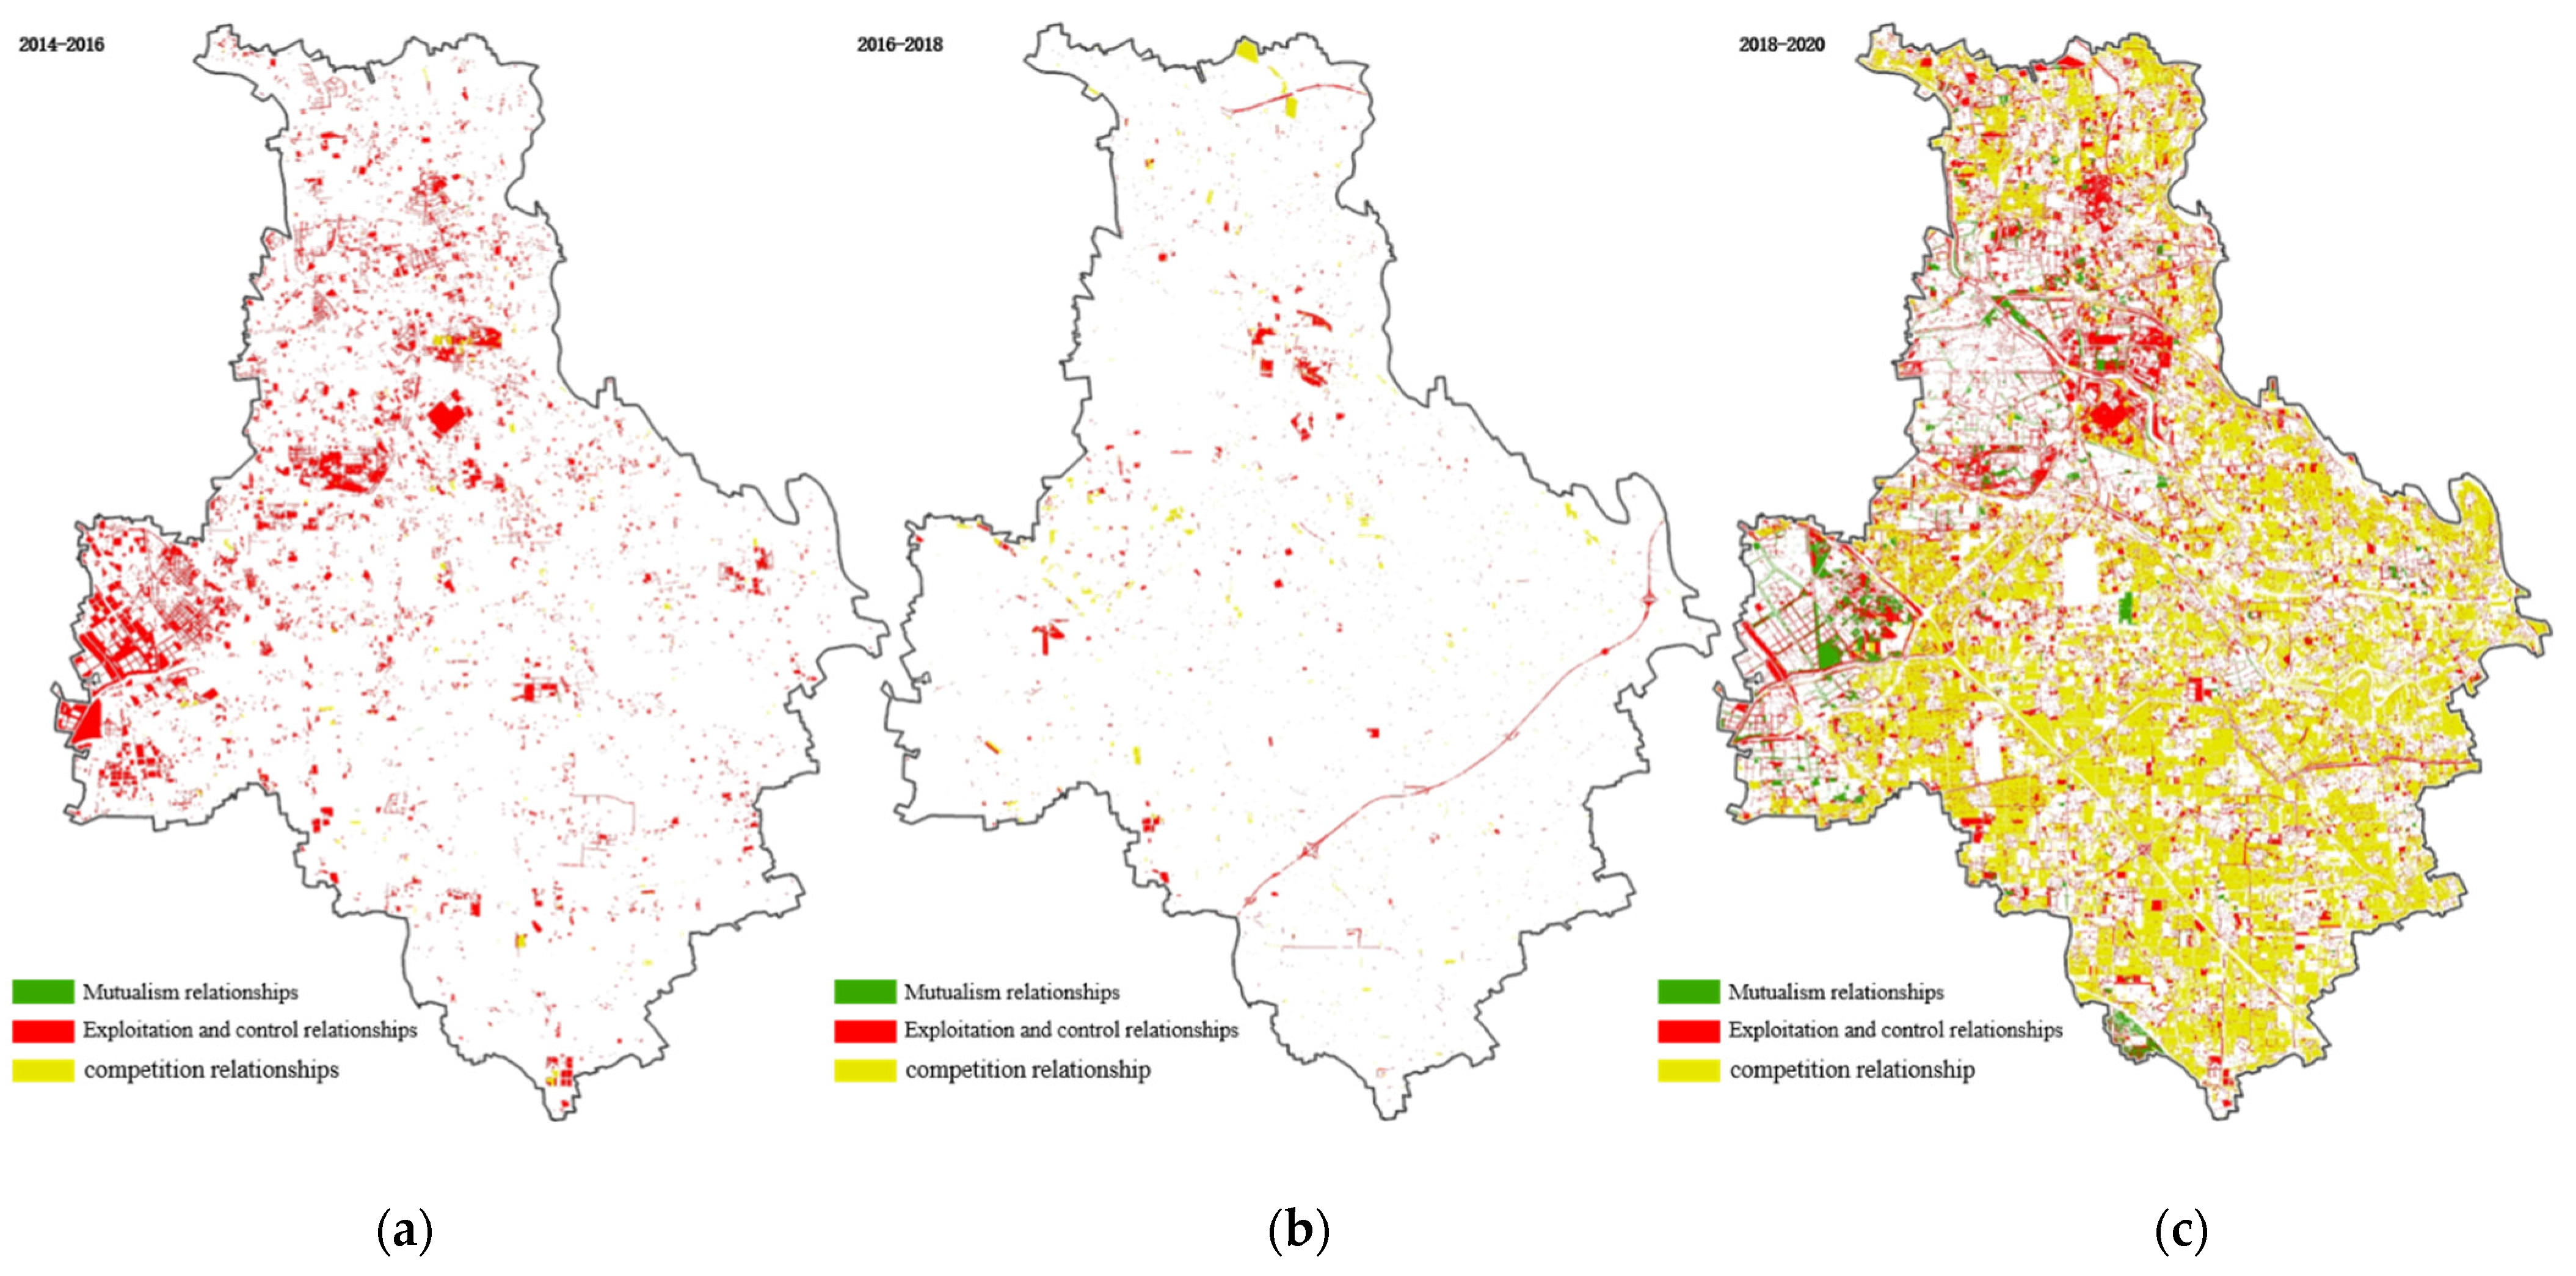
3.2.1. Ecological Relationships of Carbon Flow

The complete utility matrix of land use carbon flow was calculated using the ENA method, and then the ecological relationships among land use types from 2014 to 2020 were obtained, including competition, control, exploitation, and mutualism. Since exploitation and control relationships have the same essence, they were combined as exploitation and control relationships for statistical analysis. The white areas in Table 5 and Figure 6 represent no land use changes.
From 2014 to 2016, the ecological relationships of Tongzhou District land in the carbon metabolism system were dominated by exploitation and control relationships, accounting for 54.3% of all ecological relationships from the calculation in Table 6. These exploitation and control relationships existed in OCL, R&TL, and IL, accounting for 57% of these relationships. In terms of space, this was mainly distributed in cultural tourism areas, administrative office areas, and new urban areas, indicating that the conversion of OCL, R&TL, and IL in these areas was large, and ecological conflicts were significant. There was strong competition for carbon storage among different areas. Mutualism and competition were sparsely distributed in the region.
From 2016 to 2018, the spatial distribution of exploitation and control relationships decreased significantly, primarily due to a large number of construction projects being stalled and hence less spatial conversion of land use. Only the built-up areas had exploitation and control relationships. At the same time, due to the large conversion areas of FL, WL, and CL in this region, the competition relationship was strengthened compared with the previous period, being primarily distributed in the peripheral areas. Competition relationships were still scattered and relatively few.
From 2018 to 2020, the spatial distribution of exploitation and control relationships increased slightly. This was mainly due to the speed of urbanization in the region driven by related urban renewal and municipal infrastructure projects. The spatial distribution of competition increased significantly, covering almost the entire township area evenly, largely because the government accelerated the construction of national forest areas and carried out large-scale plain afforestation work, resulting in a significant increase in the area of FL and hence significant spatial conversion between FL and other land uses. These competition relationships also increased significantly compared with the previous period, being primarily distributed in the blue and green land.

3.2.2. Overall Ecological Utility Function

According to the results of the complete utility matrix, the value of the overall ecological utility function M was 0.54, less than 1, indicating the utility of the horizontal flow of carbon metabolism in the study area. The overall regional comprehensive effect of land use change on carbon metabolism balance in the study area from 2014 to 2020 was negative.

4. Discussion

4.1. Impact of Land Use Changes on Carbon Flow

4.1.1. Impact of Negative Carbon Flow

The carbon flow associated with land use changes was determined by both land use change area and carbon metabolism density. The negative carbon flow in the three study periods largely came from the transfer of other land to OCL, unlike other cities in China. For example, the negative carbon flow in Hangzhou [6,7], Zhaotong [35], and other cities [36] was in large part due to the transfer of other land to IL, and this was determined by the development stage and development policies of the cities. In the early 20th century, the development of Hangzhou and other cities attracted the investment of enterprises through the sale of cheap IL, often resulting in the transformation of CL into IL [6,7,35]. However, the low-carbon city development route has been established in the early stage of the construction of Tongzhou District [64,65], being converted to business offices, cultural tourism, administration, and other functions. IL was used for high-tech enterprises bearing low carbon emissions, activities that were not the main source of negative carbon flow. Therefore, the industrial development path selection of the central and local governments is crucial to regional low-carbon development. Industrial policies should not only emphasize industrial development and the improvement of economic efficiency but should also pay attention to the support and encouragement of green industries, reduce the carbon emission intensity of the industry, and promote the sustainable development of the region.

4.1.2. Impact of Positive Carbon Flow

The positive carbon flow was primarily due to the transfer of other land to FL. From 2016 to 2018 and from 2018 to 2020, the proportions of carbon flow to FL were 72% and 51%, respectively. Afforestation and forest management as well as preventing deforestation and forest degradation were also important measures used to increase carbon storage in ecosystems in other cities around the world [66]. Since 2015, Beijing has been committed to green development and has made all-out efforts to promote a new round of afforestation projects covering an area of 1 million mu. Eight super-large parks have been built in Tongzhou District, and the forest coverage rate of the entire area has reached 35.24%. The contribution of GL increases to the positive carbon flow cannot be ignored, as this accounted for 25.3% of the total positive carbon flow. Therefore, optimizing the spatial layout of woodland and GL, planting vegetation reasonably, and promoting the healthy growth of plants in spatial planning have strong development potential for improving the carbon sequestration capacity of green spaces.

4.2. Effects of Land Use Changes on Ecological Relationships

4.2.1. Exploitation and Control Relationships

Analyzing the ecological relationship of carbon metabolism under the influence of land use change is helpful in formulating policies for optimizing land use structure [10,11]. The results of the utility analysis show that these exploitation and control relationships were the main ecological relationships involved in carbon metabolism in Tongzhou District, and these were spatially distributed in the concentrated development and construction areas. Beijing implements a strict policy of intensive land conservation [67], resulting in very limited land available for development and construction. This intensifies the land competition among OCL, R&TL, and IL in the process of urbanization, especially in high-value areas. The government re-develops land through urban renewal and other means to explore new economic growth points, but this process will generate massive population and economic activities, leading to increases in energy consumption and carbon emissions. Therefore, in the process of urbanization, low-carbon development requires a clear and reasonable scale of land use and optimization of urban spatial structure in order to reduce urban carbon emissions and promote the balanced development of regional carbon metabolism.

4.2.2. Competition Relationships

The competition relationship accounted for 37.8% of the overall ecological relationship, being primarily in the positive carbon metabolism compartments and manifested as the competition between FL, CL, WL, and GL for space. With the gradual establishment of territorial space planning systems, the role of natural ecological space in carbon metabolism analysis is becoming increasingly important. In the traditional management mode, this type of land belongs to the management of different industry departments, especially FL, CL, and WL, which have certain rigid control requirements. When the index is difficult to meet, deforestation or occupation of cultivated land often occurs, and this can significantly change the vegetation coverage of the surface in a short time. For example, from 2018 to 2020, the government vigorously adopted economic means to promote plain afforestation projects, resulting in shrinkage of the cultivated land area and a substantial increase in the woodland area; this had a significant impact on the regional carbon metabolism balance. Therefore, in the development of low-carbon cities, it is necessary to respect ecological laws and natural processes, combine the characteristics of natural endowments in various regions, reasonably determine the scale and proportion of natural elements such as woodland, farmland, and water areas, guide rational layouts, alleviate the competition between land types, and promote the balanced development of regional carbon metabolism.

4.2.3. Mutualism Relationships

During the study period, mutualism existed in both positive and negative carbon metabolism compartments, but the overall proportion was relatively small and scattered in the area, occurring largely in GL and T&RL, indicating that there was no significant land use change in these two compartments. Mutualism emphasizes the harmonious symbiosis, mutual benefit, and mutual use between social and economic development and the external natural environment. During the study period, mutualism was mainly distributed in the natural ecological space within the urban construction area of Tongzhou District, which highlighted the urban characteristics of mixed blue and green land, and a large number of green spaces inside the city have been reserved to provide high-quality and convenient leisure and recreation space for citizens since 2014. Such spaces are also areas that conform to planning guidance, increasing the ecological utility of the area in the process of interaction. Therefore, reasonable urban space policy is of great value to the improvement of urban comprehensive ecological utility.

5. Conclusions and Suggestions

5.1. Conclusions

In this study, an analysis framework between land use change and carbon metabolism was constructed based on ENA to explore the comprehensive impact on carbon metabolism. Taking Tongzhou District as an example, we analyzed the spatial characteristics of carbon emissions and carbon sequestration in three time periods from 2014 to 2020 and depicted the carbon flow and spatial distribution related to land use. The following conclusions were drawn.
From 2014 to 2020, the total carbon emission of Tongzhou District increased year by year. The carbon emission of OCL was dominant, and the carbon emission of IL decreased significantly. The carbon sequestration capacity of FL increased by 236%. The positive carbon metabolic density remained relatively stable, while the negative carbon metabolic density decreased year by year.
From 2014 to 2020, the negative carbon flow in Tongzhou District was concentrated in the transfer IL to OCL (2014–2016), CL to OCL (2016–2018), and CL to OCL (2018–2020), accounting for 40.2% of the total negative “carbon flow”. The positive carbon flow mainly came from the conversion of OCL to IL (2014–2016), OCL to FL (2016–2018), and OCL to FL (2018–2020). Since the negative “carbon flow” originated from the transfer of other land to OCL, reducing the carbon emission density of OCL and promoting the centralized and intensive development of urban construction land are key to realizing low-carbon development in the process of urban development and construction.
From 2014 to 2016, the spatial ecological relationships of carbon flow in Tongzhou District were dominated by exploitation and control relationships. In 2016–2018, competition intensified, largely in expanded areas; in 2016–2018, exploitation and control relationships, competition relationships, and mutualism relationships increased significantly and were evenly distributed. However, the overall ecological utility value was 0.54, indicating that the regional carbon metabolism was unbalanced. In terms of urban industrial development, the government should pay attention to supporting and encouraging green industries, optimize the spatial structure of urban construction land, and reduce urban carbon emissions. Moreover, we should respect ecological laws, optimize the scale and distribution of ecological factors, and improve the carbon sequestration capacity of green spaces.

5.2. Suggestions

Based on the above conclusions, suggestions for the construction of low-carbon cities in Tongzhou District are proposed as follows.
In terms of social life, education should be developed to increase residents’ awareness of low carbon and promote lifestyle transformation. The lifestyle of residents in OCL has a direct impact on carbon emissions. The adoption of a green, healthy, and environmentally friendly lifestyle should be encouraged, thereby reducing the emission of carbon dioxide and other greenhouse gases. It should be noted that OCL is mainly concentrated in urban construction areas. Therefore, raising the awareness of a low-carbon lifestyle and encouraging the use of clean energy are important aspects of urban construction and low-carbon development in construction areas.
In terms of public management, spatial planning guidance and natural ecological environment protection should be strengthened. In fact, natural ecological space (especially FL) is the main source of positive carbon flow. It is necessary to strengthen the protection of green space and carry out the construction of laws and regulations for the development and management of low-carbon ecological cities. Important green spaces should be reserved in low-carbon urban planning while paying attention to strengthening afforestation and forest management to prevent deforestation and forest degradation.
In terms of economic development, the mode of economic development needs to be transformed to encourage green industries and gradually promote the decoupling of economic growth and carbon emissions. The development of a low-carbon economy needs to adopt an economic development mode to adapt to the global changes, improve the energy utilization rate, and choose a green industrial development path, in order to achieve an economic growth rate higher than the carbon emission rate without slowing down economic development and lowering living standards. As a result, the industrial development path selection of central and local governments is crucial to regional low-carbon development.

5.3. Limitations and Future Insights

The present study also has certain limitations, e.g., this study did not explore the driving mechanisms of ecological relationship change and lacked an analysis of the impact of construction policies and management on carbon metabolism. In addition, we also did not perform a quantitative analysis of the differences in vegetation types and ignored the difference in carbon emissions between urban and rural houses in OCL. Given these limitations, the analysis needs to be further strengthened.

Author Contributions

Conceptualization, Y.Q., J.Z. and S.Z.; methodology, Y.Q.; formal analysis, Y.Q. and M.X.; writing—original draft preparation, Y.Q. and M.X.; writing—review and editing, Y.Q., J.Z., C.X., Y.G. and S.Z.; supervision, Y.Q., J.Z. and S.Z.; funding acquisition, J.Z. and S.Z. All authors have read and agreed to the published version of the manuscript.

Funding

This work was supported by grants from the National Natural Science Foundation of China (No. 52078008, No. 51908004) and the Beijing Municipal Natural Science Foundation (No. 8202004).

Institutional Review Board Statement

Not applicable.

Data Availability Statement

Not applicable.

Acknowledgments

We thank Chuyu Xia for her constructive comments and suggestions to improve the quality of this article.

Conflicts of Interest

The authors declare no conflict of interest.

References

  1. Intergovernmental Panel on Climate Change (IPCC). Special Report on Global Warming of 1.5 ℃[R]; Cambridge University Press: Cambridge, UK, 2018. [Google Scholar]
  2. United Nations Environment Programme (UNEP). Emissions Gap Report 2020[R]; United Nations Environment Programme and UNEP DTU Partnership: Nairobi, Kenya, 2020. [Google Scholar]
  3. He, J.; Yang, Y.; Liao, Z.; Xu, A.; Fang, K. Linking SDG 7 to assess the renewable energy footprint of nations by 2030. Appl. Energy 2022, 317, 119167. [Google Scholar] [CrossRef]
  4. Wolman, A. The metabolism of cities. Sci. Am. 1965, 213, 179–190. [Google Scholar] [CrossRef] [PubMed]
  5. Xia, L.L.; Zhang, Y.; Li, M.J. A review of urban carbon metabolism. Acta Ecol. Sin. 2017, 37, 4268–4277. [Google Scholar]
  6. Xia, C.; Li, Y.; Xu, T.; Chen, Q.; Ye, Y.; Shi, Z.; Liu, J.; Ding, Q.; Li, X. Analyzing spatial patterns of urban carbon metabolism and its response to change of urban size: A case of the Yangtze River Delta, China. Ecol. Indic. 2019, 104, 615–625. [Google Scholar] [CrossRef]
  7. Xia, C.; Xiang, M.; Fang, K.; Li, Y.; Ye, Y.; Shi, Z.; Liu, J. Spatial-temporal distribution of carbon emissions by daily travel and its response to urban form: A case study of Hangzhou, China. J. Clean. Prod. 2020, 257, 120797. [Google Scholar] [CrossRef]
  8. Li, Y.; Shen, J.; Xia, C.; Xiang, M.; Cao, Y.; Yang, J. The impact of urban scale on carbon metabolism --a case study of Hangzhou, China. J. Clean. Prod. 2021, 292, 126055. [Google Scholar] [CrossRef]
  9. Houghton, R.A. The annual net flux of carbon to the atmosphere from changes in land use 1850–1990. Tellus B Chem. Phys. Meteorol. 1999, 51, 298–313. [Google Scholar] [CrossRef]
  10. Xia, C.; Chen, B. Urban land-carbon nexus based on ecological network analysis. Appl. Energy 2020, 276, 115465. [Google Scholar] [CrossRef]
  11. Zhu, E.; Deng, J.; Zhou, M.; Gan, M.; Jiang, R.; Wang, K.; AmirReza, S. Carbon emissions induced by land-use and land-cover change from 1970 to 2010 in Zhejiang, China. Sci. Total Environ. 2019, 646, 930–939. [Google Scholar] [CrossRef]
  12. Houghton, R.A.; House, J.I.; Pongratz, J.; Van Der Werf, G.R.; Defries, R.S.; Hansen, M.C.; Le Quéré, C.; Ramankutty, N. Carbon emissions from land use and land-cover change. Biogeosciences 2012, 9, 5125–5142. [Google Scholar] [CrossRef]
  13. Findell, K.L.; Berg, A.; Gentine, P.; Krasting, J.P.; Lintner, B.R.; Malyshev, S.; Santanello, J.A.; Shevliakova, E. The impact of anthropogenic land use and land cover change on regional climate extremes. Nat. Commun. 2017, 8, 989. [Google Scholar] [CrossRef] [PubMed] [Green Version]
  14. Kay, S.; Rega, C.; Moreno, G.; den Herder, M.; Palma, J.H.N.; Borek, R.; Herzog, F. Agroforestry creates carbon sinks whilst enhancing the environment in agricultural landscapes in Europe. Land Use Policy 2019, 83, 581–593. [Google Scholar] [CrossRef]
  15. Tang, X.; Woodcock, C.E.; Olofsson, P.; Hutyra, L.R. Spatiotemporal assessment of land use/land cover change and associated carbon emissions and uptake in the Mekong River Basin. Remote Sens. Environ. 2021, 256, 112336. [Google Scholar] [CrossRef]
  16. Xia, C. Multi-Scale Studies on Urban Carbon Metabolism from the Perspective of Land Use and Scenario Analysis of Emission Reduction, China. Ph.D. Thesis, Zhejiang University, Zhejiang, China, 2019. [Google Scholar] [CrossRef]
  17. Yu, Z.; Chen, L.; Tong, H.; Chen, L.; Zhang, T.; Li, L.; Yuan, L.; Xiao, J.; Wu, R.; Bai, L.; et al. Spatial correlations of land-use carbon emissions in the Yangtze River Delta region: A perspective from social network analysis. Ecol. Indic. 2022, 142, 109147. [Google Scholar] [CrossRef]
  18. Zhao, J.; Shao, Z.; Xia, C.; Fang, K.; Chen, R.; Zhou, J. Ecosystem services assessment based on land use simulation: A case study in the Heihe River Basin, China. Ecol. Indic. 2022, 143, 109402. [Google Scholar] [CrossRef]
  19. Kellett, R.; Christen, A.; Coops, N.C.; van der Laan, M.; Crawford, B.; Tooke, T.R.; Olchovski, I. A systems approach to carbon cycling and emissions modeling at an urban neighborhood scale. Landsc. Urban Plan. 2013, 110, 48–58. [Google Scholar] [CrossRef]
  20. Long, Y.; Ayyoob, S.; Huang, L.; Chen, J. Urban carbon accounting: An overview. Urban Clim. 2022, 44, 101195. [Google Scholar]
  21. Chen, X.; Meng, Q.; Shi, J.; Liu, Y.; Sun, J.; Shen, W. Regional Differences and Convergence of Carbon Emissions Intensity in Cities along the Yellow River Basin in China. Land 2022, 11, 1042. [Google Scholar] [CrossRef]
  22. Sun, Y.; Jia, J.; Ju, M.; Chen, C. Spatiotemporal Dynamics of Direct Carbon Emission and Policy Implication of Energy Transition for China’s Residential Consumption Sector by the Methods of Social Network Analysis and Geographically Weighted Regression. Land 2022, 11, 1039. [Google Scholar] [CrossRef]
  23. Chen, S.-Q.; Chen, B. Network environ perspective for urban metabolism and carbon emissions: A case study of Vienna, Austria. Environ. Sci. Technol. 2012, 46, 4498–4506. [Google Scholar] [CrossRef]
  24. Chen, H.; Meng, C.; Cao, Q. Measurement and Influencing Factors of Low Carbon Urban Land Use Efficiency—Based on Non-Radial Directional Distance Function. Land 2022, 11, 1052. [Google Scholar] [CrossRef]
  25. Zheng, H.; Ge, L. Carbon emissions reduction effects of sustainable development policy in resource-based cities from the perspective of resource dependence: Theory and Chinese experience. Resour. Policy 2022, 78, 102799. [Google Scholar] [CrossRef]
  26. Vaccari, F.P.; Gioli, B.; Toscano, P.; Perrone, C. Carbon dioxide balance assessment of the city of Florence (Italy), and implications for urban planning. Landsc. Urban Plan. 2013, 120, 138–146. [Google Scholar] [CrossRef]
  27. Wang, S.-H.; Huang, S.-L.; Huang, P.-J. Can spatial planning really mitigate carbon dioxide emissions in urban areas? A case study in Taipei, Taiwan. Landsc. Urban Plan. 2018, 169, 22–36. [Google Scholar] [CrossRef]
  28. Fang, K. Moving away from sustainability. Nat. Sustain. 2022, 5, 5–6. [Google Scholar] [CrossRef]
  29. Ye, R.; Gao, Z.; Fang, K.; Liu, K.; Chen, J. Moving from subsidy stimulation to endogenous development: A system dynamics analysis of China’s NEVs in the post-subsidy era. Technol. Forecast. Soc. Chang. 2021, 168, 120757. [Google Scholar] [CrossRef]
  30. Zhang, Q.; Fang, K.; Chen, J.; Liu, H.; Liu, P. The role of sectoral coverage in emission abatement costs: Evidence from China’s industrial sectors. Environ. Res. Lett. 2022, 17, 045002. [Google Scholar] [CrossRef]
  31. Huang, H.; Yang, H.; Chen, Y.; Chen, T.; Bai, L.; Peng, Z.R. Urban Green Space Optimization Based on a Climate Health Risk Appraisal—A case study of Beijing city, China Science Direct. Urban For. Urban Green. 2021, 62, 127154. [Google Scholar] [CrossRef]
  32. Huang, H.; Chen, K.; Zhang, H.; Ren, L. Planning and coordinated response mechanism of economic and ecological services in urban expansion. Econ. Res.-Ekon. Istraživanja 2022, 35, 1–21. [Google Scholar] [CrossRef]
  33. Zhang, Y.; Xia, L.-L.; Fath, B.-D.; Yang, Z.-F.; Yin, X.-A.; Su, M.-R.; Liu, G.-Y.; Li, Y.-X. Development of a spatially explicit network model of urban metabolism and analysis of the distribution of ecological relationships: Case study of Beijing, China. J. Clean. Prod. 2016, 112, 4306–4317. [Google Scholar] [CrossRef]
  34. Chen, S.-Q.; Chen, B. Determining carbon metabolism in urban areas though network environ theory. Procedia Environ. Sci. 2012, 13, 2246–2255. [Google Scholar] [CrossRef] [Green Version]
  35. Du, J.-S.; Fu, J.-Y.; Hao, M.-M. Analyzing the carbon metabolism of “Production-LivingEcological” space based on ecological network utility in Zhaotong, China. J. Nat. Resour. 2021, 36, 1208–1223. [Google Scholar]
  36. Lin, G.; Jiang, D.; Fu, J.; Cao, C.; Li, X.; Li, Z.; Huang, S. Carbon flow analysis for production-living-ecological space: A case study of Tangshan, China. Sci. Technol. Rev. 2020, 38, 107–114. [Google Scholar] [CrossRef]
  37. Liu, C.; Sun, W.; Li, X. Characteristics of spatiotemporal variations in coupling coordination between integrated carbon emission and sequestration index: A case study of the Yangtze River Delta, China. Ecol. Indic. 2022, 135, 108520. [Google Scholar] [CrossRef]
  38. Xia, C.Y.; Li, Y.; Ye, Y.M.; Shi, Z.; Liu, J.M.; Li, X.S. Analyzing urban carbon metabolism based on ecological network utility: A case study of Hangzhou City. Acta Ecol. Sin. 2018, 38, 73–85. [Google Scholar]
  39. Xia, L.L.; Fath, B.D.; Scharler, U.M.; Zhang, Y. Spatial variation in the ecological relationships among the components of Beijing’s carbon metabolic system. Sci. Total Environ. 2016, 544, 101–113. [Google Scholar] [CrossRef]
  40. Xia, C.; Li, Y.; Xu, T.; Ye, Y.; Shi, Z.; Peng, Y.; Liu, J. Quantifying the spatial patterns of urban carbon metabolism: A case study of Hangzhou, China. Ecol. Indic. 2018, 95, 474–484. [Google Scholar] [CrossRef]
  41. Sun, H.; Liang, H.M.; Chang, X.-L.; Cui, Q.-C.; Tao, Y. Land Use Patterns on Carbon Emission and Spatial Association in China. Econ. Geogr. 2015, 35, 154–162. [Google Scholar]
  42. Zhang, Q.; Tao, X.; Yang, P. Research On Carbon Emissions From Metropolis Urban Passenger Transport and Countermeasures, China Population. Resour. Environ. 2012, 22, 35–42. [Google Scholar]
  43. Xie, T.; Wang, J. Comparative study on carbon emissions of transportation industry. Compr. Transp. 2011, 8, 20–24. [Google Scholar]
  44. Min, J. A Research of the Impacts of Agricultural Products in International Market on Greenhouse Gas Emissions in the Chinese Agricultural Production. Ph.D. Dissertation, Chinese Doctoral Dissertations Full-Text Database, Nanjing Agricultural University, Nanjing, China, 2012. [Google Scholar]
  45. Solomon, S. ; Intergovernmental Panel on Climate Change. Climate Change the Physical Science Basis; American Geophysical Union: Boulder, CO, USA, 2007. [Google Scholar]
  46. Yaoqiu, K.; Ting-ping, O.; Yi, Z.; Yu, L.; Chao, L.; De-hui, W. Present Situation of Carbon Source and Sink and Potential for Increase of Carbon Sink in Guangdong Province, China Population. Resour. Environ. 2010, 20, 56–61. [Google Scholar]
  47. Panqin, C.; Xiaoke, W.; Limao, W. Carbon Budget and Sink Enhancement Strategies of Terrestrial Ecosystems in China; Science Press: Beijing, China, 2008. [Google Scholar]
  48. Gui, X.; Wang, J. X000047 China’s Terrestrial Ecosystem Carbon Budget and Countermeasures for Increasing Sinks; Book Almanac of China, Ed.; Hubei People’s Publishing House: Hubei, China, 2009; Volume 760. [Google Scholar]
  49. Fang, J.; Zhao, G.; Shi, P.; Chen, A. Estimation of China’s terrestrial vegetation carbon sink from 1981 to 2000. Sci. China Ser. D Earth Sci. 2007, 6, 804–812. [Google Scholar]
  50. Liu, G.; Fu, B.; Fang, J. Carbon dynamics of Chinese forests and its contribution to global carbon balance. Acta Ecol. Sin. 2000, 5, 733–740. [Google Scholar]
  51. Duan, X.-N.; Han, B.; Fei, X.K. Carbon sequestration and its potential by wetland ecosystems in China. Acta Ecol. 2008, 2, 463–469. [Google Scholar]
  52. Walsh, J.J. Importance of continental margins in the marine biogeochemical cycling of carbon and nitrogen. Nature 1991, 350, 53–55. [Google Scholar] [CrossRef]
  53. Li, Z.C.; Xu, J.Y.; Wu, C.Y.; Zhang, Y. A review of studies using ecological network analysis. Acta Ecol. Sin. 2011, 31, 5396–5405. [Google Scholar]
  54. Ayres, R.U.; Kneese, A.V. Production, consumption and externalities. Am. Econ. Rev. 1969, 59, 282–297. [Google Scholar]
  55. Yang, S.; Fath, B.; Chen, B. Ecological network analysis of embodied particulate matter 2.5—A case study of Beijing. Appl. Energy 2016, 184, 882–888. [Google Scholar] [CrossRef]
  56. Ukidwe, N.R.; Bakshi, B.R. Resource intensities of chemical industry sectors in the United States via input-output network models. Comput. Chem. Eng. 2008, 32, 2050–2064. [Google Scholar] [CrossRef]
  57. Chen, L.; Wang, R.S.; Yang, J.X.; Shi, Y.L. Structural complexity analysis for industrial ecosystems: A case study on LuBei industrial ecosystem in China. Ecol. Complex. 2010, 7, 179–187. [Google Scholar] [CrossRef]
  58. Lu, Y.; Chen, B.; Hayat, T.; Alsaedi, A. Communal carbon metabolism: Methodology and case study. J. Clean. Prod. 2015, 163, S315–S321. [Google Scholar] [CrossRef]
  59. Bolin, B. Changes of land biota and their importance for the carbon cycle. Science 1977, 196, 613–615. [Google Scholar] [CrossRef] [PubMed] [Green Version]
  60. Zhang, Y.; Yang, Z.F.; Fath, B.D. Ecological network analysis of an urban water metabolic system: Model development and a case study for Beijing. Sci. Total Environ. 2010, 408, 4702–4711. [Google Scholar] [CrossRef]
  61. Fang, D.; Chen, B. Ecological network analysis for a virtual water network. Environ. Sci. Technol. 2015, 49, 6722–6730. [Google Scholar] [CrossRef] [PubMed]
  62. Shaikh, F.; Ji, Q.; Fan, Y. Evaluating China’s natural gas supply security based on ecological network analysis. J. Clean. Prod. 2016, 139, 1196–1206. [Google Scholar] [CrossRef]
  63. Finn, J.T. Measures of ecosystem structure and function derived from analysis of flows. J. Theor. Biol. 1976, 56, 363–380. [Google Scholar] [CrossRef]
  64. Wu, Z.-Q.; Li, X. Design Thinking Innovation in the Planning of Beijing City Sub-Center. Urban Plan. Forum. 2019, S1, 138–141. [Google Scholar] [CrossRef]
  65. Li, Y.-X.; Wang, K.-Y. Experience and Implications of Domestic and Foreign Secondary City Center Construction for Beijing Tongzhou. China Anc. City. 2018, 6, 10–18. [Google Scholar] [CrossRef]
  66. Finn, J.T. Flow analysis of models of the hubbard brook ecosystem. Ecology 1980, 61, 562–571. [Google Scholar] [CrossRef]
  67. Zhong, H.-X.; Li, F.-X. Land Policy Selection Based on the Principle of Social Utility Maximization in Beijing. China Land Sci. 2009, 23, 67–71. [Google Scholar]
Figure 1. Location map of Tongzhou District.
Land 11 01573 g001
Figure 2. Spatial network model of carbon metabolism.
Land 11 01573 g002
Figure 3. Total carbon emissions.
Land 11 01573 g003
Figure 4. Total carbon sequestration.
Land 11 01573 g004
Figure 5. Carbon metabolism density. (a) Net carbon metabolism density of GL, FL, and WL; (b) net carbon metabolism density of CL, IL, R&TL, and OCL.
Land 11 01573 g005
Figure 6. Spatial distribution of ecological relationships: (a) spatial distribution of ecological relationships from 2014 to 2016; (b) spatial distribution of ecological relationships from 2016 to 2018; (c) spatial distribution of ecological relationships from 2018 to 2020.
Land 11 01573 g006
Table 1. Carbon emission coefficient of land use in the territorial space.
ItemCarbon Emission CoefficientUnitCode
Raw coal0.7559kg/kgceF1
Coke0.8550kg/kgceF2
Fuel oil0.6185kg/kgceF3
Gasoline0.5538kg/kgceF4
Diesel oil0.5921kg/kgceF5
Liquified petroleum gas0.5042kg/kgceF6
Natural gas0.4483kg/kgceF7
Family car22.3kg/100 kmK1
Suburban passenger car88.1kg/100 kmK2
Motorbike6.7kg/100 kmK3
Moped6.7kg/100 kmK4
Taxi28.3kg/100 kmK5
Passenger transport and freight transport of highway0.0556Kg·t−1·km−1K6
Human breathing79kg·a−1·per−1K7
Agricultural machinery0.18kg/kwK8
Irrigation6.7kg/hm2K9
Fertilizer0.858kg/kgK10
Pigs and sheep breathing82kg·a−1·h−1K11
Cow breathing796kg·a−1·h−1K12
Note: the carbon emission coefficients of energy, road transportation, agricultural production, and animal and human metabolism were derived from the relevant research results of Xia, Sun, Zhang, Xie, Min, and Solomon S. et al. [8,41,42,43,44,45].
Table 2. Carbon sequestration coefficient of each land use compartment in the territorial space.
Land TypeCoefficient of Carbon SequestrationUnit
Cultivated land (CL)0.0007kgC/(m2·a)
Forest land (FL)0.0657kgC/(m2·a)
Water and wetland (WL)0.0402kgC/(m2·a)
Grassland (GL)0.0206kgC/(m2·a)
Table 3. Relationships between components of the network.
Matrix NotationPositive +Neutral 0Negative −
Positive +(+,+) mutualism(+,0) symbiotic(+,−) snatch
Neutral 0(0,+) symbiotic(0,0) neutrality(0,−) amensalism
Negative −(−,+) limitation(−,0) control(−,−) competition
Note: “+” means positive; “−“ means negative; “0” stands for neutral.
Table 4. Exchange of carbon flow.
Exchange Value
(×106 kgc/a)
2014–20162016–20182018–2020
TransitionsDirectionTransitionsDirectionTransitionsDirection
Beneficial carbon flow113.86+35.13+833.62+
Harmful carbon flow−168.48−82.48−456.14
Net carbon flow−54.62−47.35377.48+
B1 (GL,FL)0.01GL→FL0.04GL→FL
B2 (R&TL,GL)22.39R&TL→GL
B3 (R&TL,CL)0.08R&TL→CL0.9R&TL→CL11.89R&TL→CL
B4 (R&TL,FL)0.5R&TL→FL66.34R&TL→FL
B5 (R&TL,WL)0.01R&TL→WL0.8R&TL→WL19.71R&TL→WL
B6 (CL,GL)0.27CL→GL
B7 (CL,FL)0.15CL→FL0.85CL→FL29.74CL→FL
B8 (CL,WL)0.03CL→WL0.63CL→WL
B9 (IL,GL)16.58IL→GL
B10 (IL,R&TL)4.3IL→R&TL
B11 (IL,CL)2.36IL→CL4.16IL→CL
B12 (IL,FL)0.14IL→FL9.72IL→FL58.66IL→FL
B13 (IL,WL)0.15IL→WL1.16IL→WL
B14 (OCL,GL)0.03OCL→GL210.92OCL→GL
B15 (OCL,R&TL)33.43OCL→R&TL0.21OCL→R&TL29.25OCL→R&TL
B16 (OCL,CL)11.2OCL→CL4.13OCL→CL59.69OCL→CL
B17 (OCL,IL)61.47OCL→IL0.69OCL→IL1.56OCL→IL
B18 (OCL,FL)2.41OCL→FL14.13OCL→FL265.44OCL→FL
B19 (OCL,WL)0.67OCL→WL0.55OCL→WL28.96OCL→WL
B20 (WL,FL)0.02WL→FL0.35WL→FL
B21 (R&TL,IL)0.05R&TL→IL5.88R&TL→IL
H1 (GL,R&TL)−0.2GL→R&TL
H2 (GL,IL)−0.13GL→R&TL−0.04GL→IL−0.04GL→IL
H3 (GL,OCL)−0.28GL→OCL−0.13GL→OCL−0.34GL→OCL
H4 (R&TL,IL)−1.7R&TL→IL
H5 (R&TL,OCL)−18.21R&TL→OCL−0.9R&TL→OCL−7.42R&TL→OCL
H6 (CL,R&TL)−0.31CL→R&TL−12.36CL→R&TL−79.41CL→R&TL
H7 (CL,IL)−10.98CL→IL−5.33CL→IL−25.98CL→IL
H8 (CL,OCL)−38.75CL→OCL−26.63CL→OCL−107.57CL→OCL
H9 (IL,OCL)−67.72IL→OCL−3.53IL→OCL−46.85IL→OCL
H10 (FL,GL)−0.23
H11 (FL,CL)−0.08FL→CL−0.03FL→CL−0.66FL→CL
H12 (FL,R&TL)−0.2FL→R&TL−4.23FL→R&TL−38.38FL→R&TL
H13 (FL,IL)−2.94FL→IL−1.67FL→IL−6.31FL→IL
H14 (FL,WL)−0.06FL→WL
H15 (FL,OCL)−15.46FL→OCL−17.85FL→OCL−55.78FL→OCL
H16 (WL,GL)−0.07WL→GL
H17 (WL,CL)−0.03WL→CL−0.04WL→CL−0.1WL→CL
H18 (WL,IL)−2.72WL→IL−0.62WL→IL−6.67WL→IL
H19 (WL,R&TL)−0.21WL→R&TL−1.76WL→R&TL−29.7WL→R&TL
H20 (WL,OCL)−8.76WL→OCL−7.35WL→OCL−43.19WL→OCL
H21 (IL,R&TL)−0.01IL→R&TL−7.18IL→R&TL
Note: “Bn” represents the nth positive carbon flow; “Hn” represents the nth negative carbon flow; “+” represents positive carbon flow direction; “−“ represents negative carbon flow; “—” indicates that there is no exchange between two components; GL: grassland; FL: forest land; R&TL: road and traffic land; CL: cultivated land; WL: water and wetland; IL: industrial land; OCL: other construction land.
Table 5. Changes in ecological relationships of Tongzhou District.
2014–2016CLFLGLWLR&TLILOCL
CL ++
FL ++
GL +++
WL ++
R&TL++
IL+ +
OCL+
2016–2018CLFLGLWLR&TLILOCL
CL +++
FL ++
GL ++
WL ++
R&TL+
IL +
OCL
2018–2020CLFLGLWLR&TLILOCL
CL ++++
FL +++
GL +++
WL+ ++
R&TL+ +
IL+ +
OCL++
Note: “+/−” represents the positive and negative elements in the complete utility matrix U, respectively; yellow—competition; blue—control; red—exploitation; green—mutualism.
Table 6. Distribution of ecological relationships.
Land Use TypeCLFLGLWLR&TLILOCL
Competition relationships911611281
Exploitation and control relationships9786131016
Mutualism relationships1041301
Note: since the nature of the relationship between exploitation and control is the same, they were combined into the relationship between exploitation and control for statistical analysis.
Publisher’s Note: MDPI stays neutral with regard to jurisdictional claims in published maps and institutional affiliations.

