Abstract
The unique natural geographical conditions and land use patterns in semiarid sandy areas have resulted in a distinct cultivated landscape. Identifying and classifying the morphological characteristics of cultivated land are key to improving land utilization efficiency. This study focuses on the semiarid sandy areas of China. We obtained information on cropland morphology by judging high-precision remote sensing images and landscape pattern analysis, and then determined the spatial clustering characteristics of different plot morphologies through local spatial autocorrelation analysis. The results are as follows: cultivated land can be classified into five main types: simple large plots, complex large plots, simple small plots, complex small plots, and scattered plots, and there are significant differences in morphology between eastern and western plots. In addition, different morphology types of plots formed a variety of aggregation patterns; clustered plots are surrounded by scattered plots, showing a staggered distribution pattern. Farmers and land managers can make more informed decisions regarding irrigation, fertilization, and crop selection, and this knowledge can provide a basis for further optimizing the layout of cultivated land, identifying fragmented cultivated land, and scientifically recovering farmland to ensure more scientific and refined classification management and zoning protection of cultivated land.
1. Introduction
The size, shape, and spatial distribution of cultivated land affect the distribution of energy and nutrients, land use intensity, and agricultural production and management efficiency. Prioritizing the protection of cultivated land in ideal geographic locations and with a regular form has become an important task for ensuring the sustainability of agricultural land management. However, it is not uncommon for farmland to be scattered, fragmented, and have complex boundaries, which leads to poor land use efficiency and substantial management difficulty, which not only results in high pressure to protect cultivated land but can also impact food security [1,2,3], biodiversity [4,5,6], and ecological security [7,8], interacting with the regional ecological environment. In addition, China’s countrywide characteristics of a large population but little land determine that some marginal cultivated land (such as sandy land, saline–alkali land, and sloping land) must be properly developed. Among these marginal land types, sandy land is extensive and has good photothermal conditions. Compared with saline–alkali land and sloping land, sandy land is easier to exploit and has greater development potential, thus serving an important supplementary source of cultivated land in China. Therefore, it is increasingly important to comprehensively obtain multidimensional information on cultivated land morphology. It is of great significance to clarify the morphological characteristics and distribution pattern of cultivated land to optimally allocate micro-scale cultivated land resources and ensure a more scientific and efficient utilization and protection of cultivated land, and plot patterns can be used as a basis and reference for land consolidation, promoting to a certain extent the large-scale utilization of land and the sustainable development of agriculture.
The current research on the morphological characteristics of land mainly focuses on the following approaches. The first approach is to analyze the landscape pattern of one or more land types from the perspective of landscape ecology [9,10,11,12], that is, to obtain information on the area and distribution of certain land types by calculating landscape indexes such as patch area and patch aggregation. The focus of this kind of research is mainly limited to the type scale and landscape scale and is less specific to the internal morphological characteristics of cultivated land at the plot scale. It is also difficult to observe the differences between different types of cultivated land morphologies. The second type of approach is to study the morphologies of a certain type of cultivated land, such as the identification and calculation of fragmented cultivated land [13,14,15,16,17], the identification of the morphological characteristics of nongrain cultivated land [18,19], or the large-scale utilization of cultivated land [20]. In other words, it is studying the morphological characteristics of fragmented cultivated land, nongrain cultivated land, or concentrated cultivated land based on its area, shape, aggregation, and other factors. However, the criteria to evaluate cultivated land in this kind of research are limited to a single cultivated land type and lack connection and comparative analysis with other cultivated land types, so it is not possible to comprehensively display the cultivated land morphologies. The third approach is studying the cultivated land morphologies under different geographical environments; that is, the characteristics and changes in cultivated land patterns in the landscape under different environments are investigated through the establishment of a cultivated land morphologies classification model. For example, Jiang P et al. [21] divided cultivated land in Jiangsu Province in southern China into core patches, marginal patches, and scattered patches according to spatial location, core edge characteristics, and basic landscape units. Irwin and Bockstael [22] and Su et al. [23] focused on the fragmentation change in cultivated land morphology with the background of urban sprawl. This kind of research is usually carried out on the macro scale at the provincial and municipal levels and pays more attention to the overall morphology and change trend of regional land, but it is easy to ignore micro characteristics such as plot shape and overlook semiarid sandy areas. In addition, Cunha et al. [24] classified the land morphologies system of mountainous areas in Portugal based on the three criteria of slope, surface curvature, and hydrological characteristics, but it was not easy to distinguish from the classification of landform.
The above analysis shows that the current research on land morphology is increasingly comprehensive yet still limited to the macro or meso scale or a single cultivated land type, which makes it difficult to identify micro-scale land morphology differences and explore spatial relationships in more detail. Moreover, it is urgent to supplement the research on cultivated land morphology in semiarid sandy areas. Therefore, we can further elaborate and reveal the morphological and spatial differentiation characteristics of different plots by selecting appropriate morphological indexes and classification criteria.
The geographical environment of cultivated land at different scales and regions is different, and the cultivated land morphology has its own characteristics. Semiarid sandy areas are an important part of the ecological barrier in northern China. The dune–meadow–dune area is the main geomorphic feature in this area, containing both large areas of farmland and a large amount of scattered reclaimed land. This paper takes Horqin Left Wing Rear Banner, a typical semiarid sandy area, as the research area, obtains basic data on cultivated land morphology through remote sensing image interpretation, determines morphological classification criteria to classify different plots, and then reveals spatial clustering patterns of different types of morphologies through local spatial autocorrelation analysis to explore regional morphological characteristics and spatial distribution rules of plots.
2. Materials and Methods
2.1. Overview of the Study Area
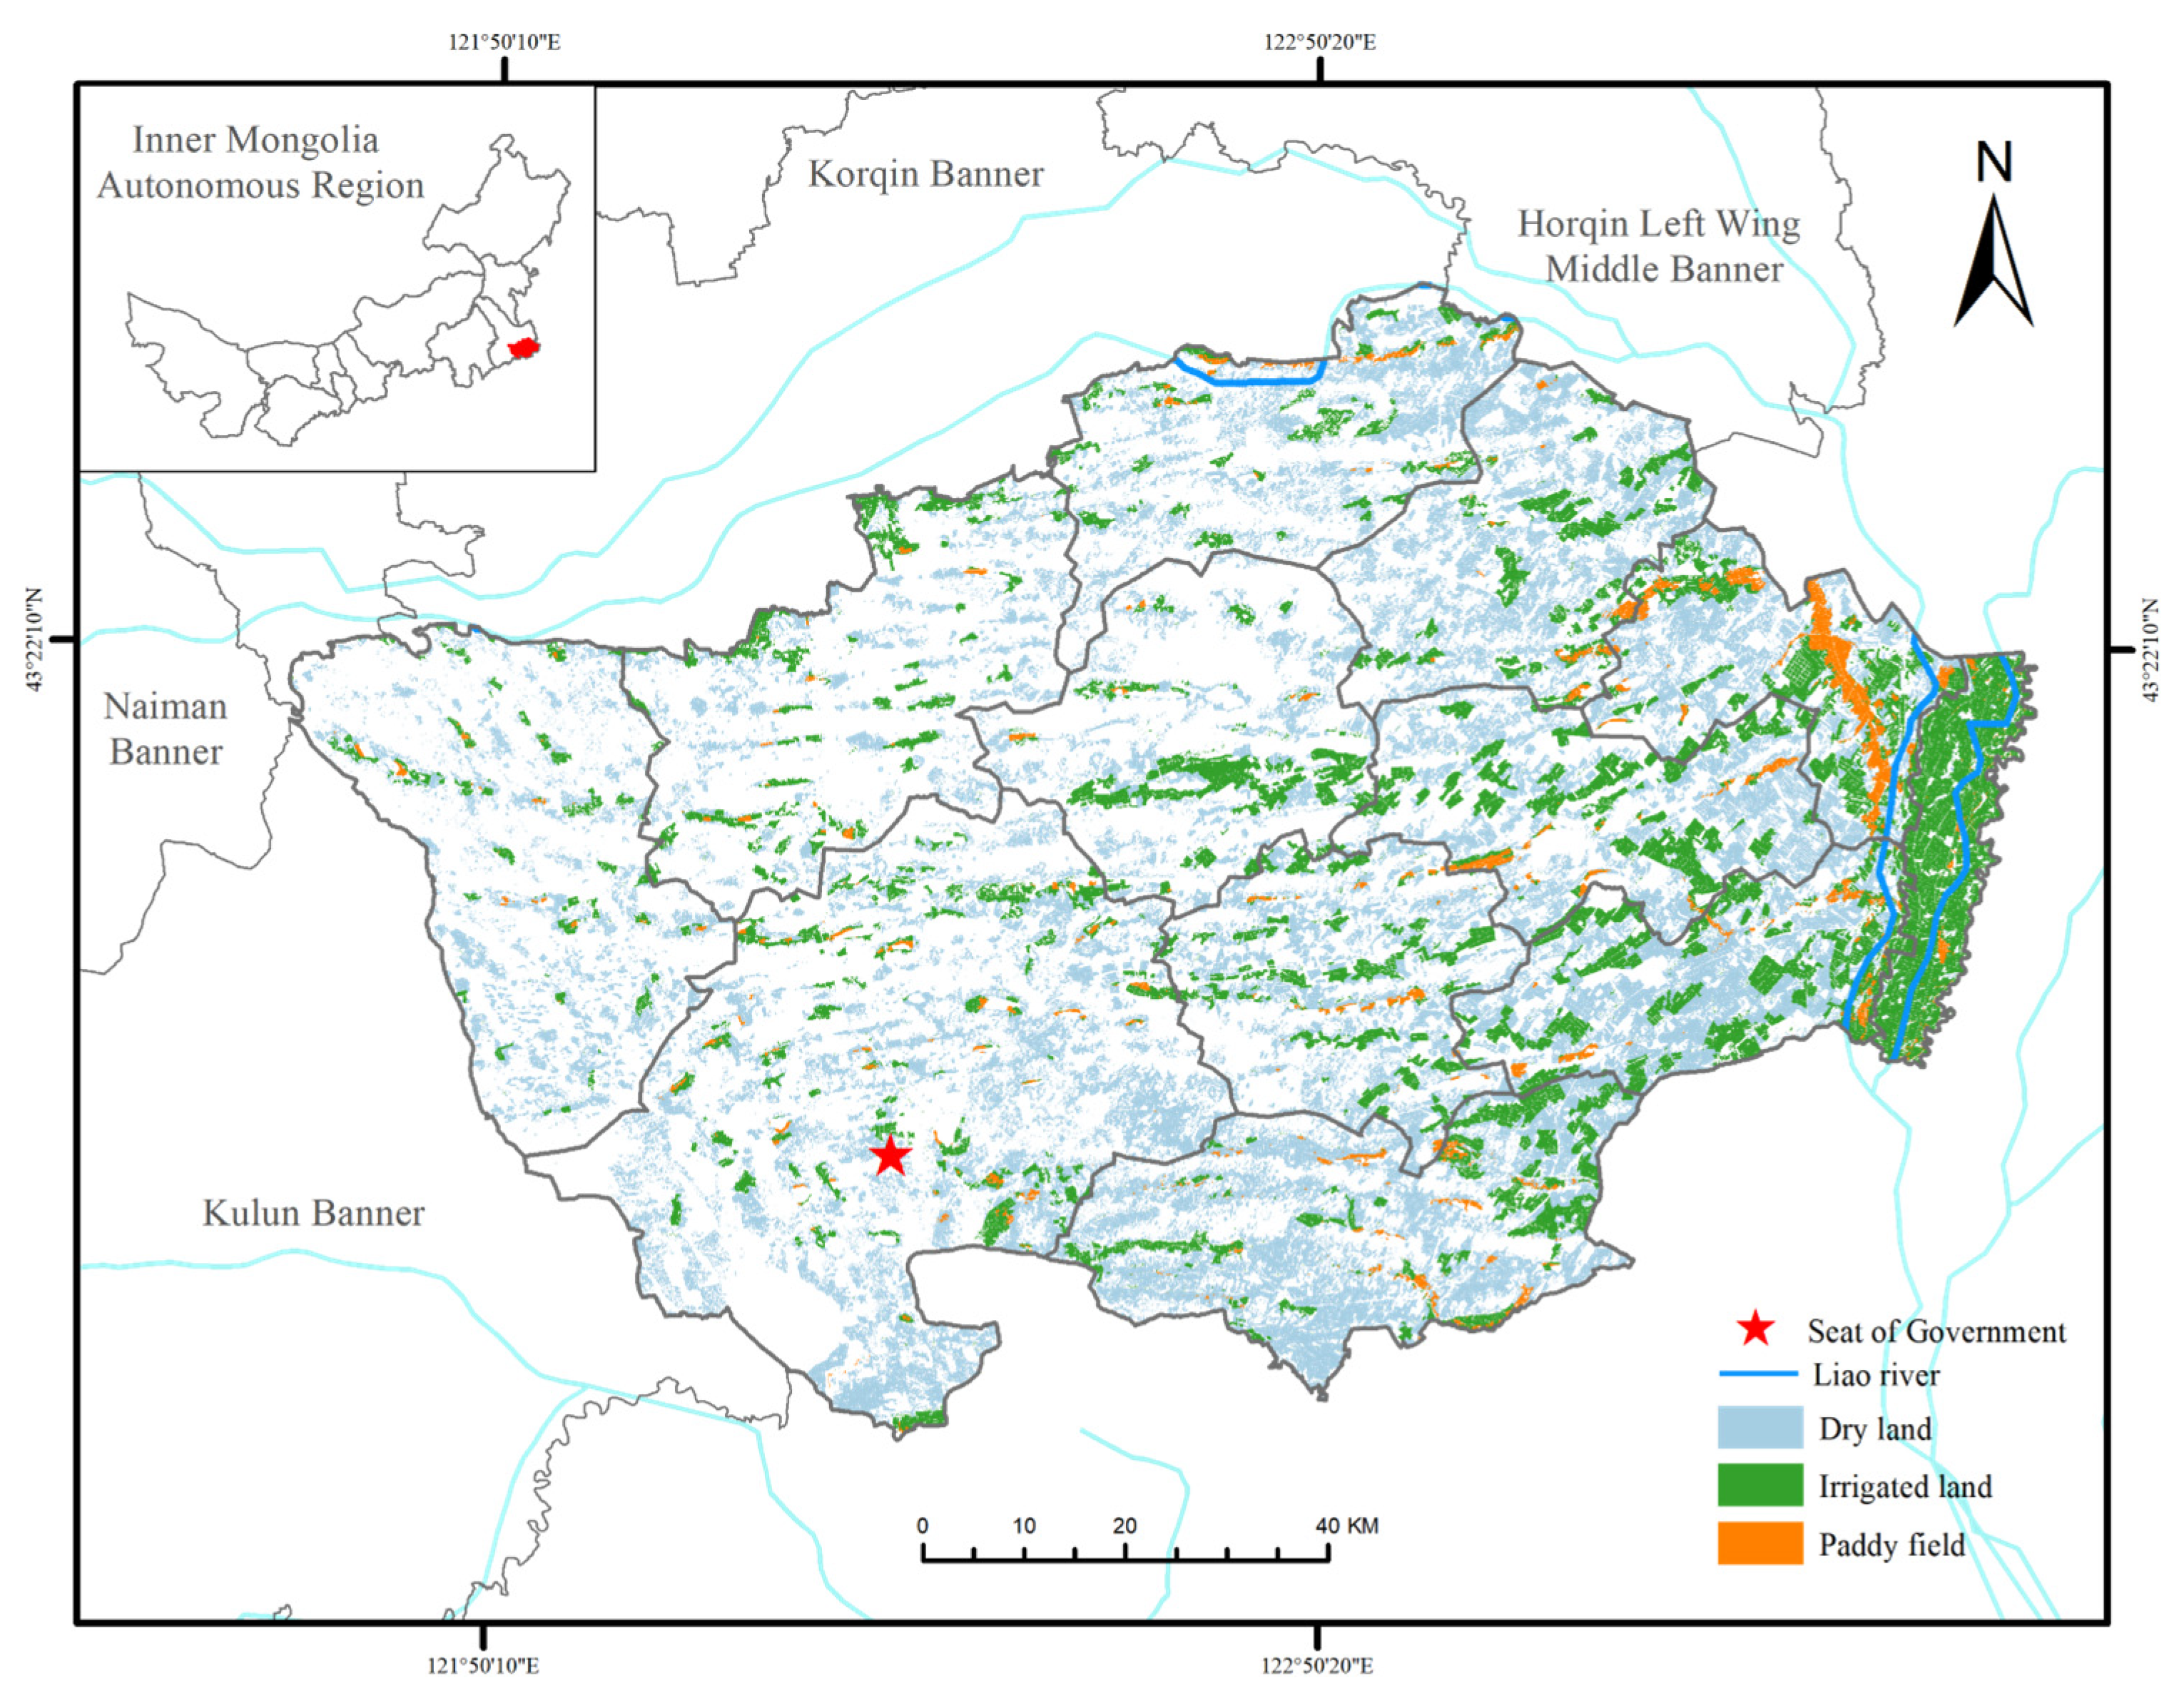
Horqin Left Wing Rear Banner is located in the southeast of Tongliao City, Inner Mongolia Autonomous Region, at the junction between the southeastern edge of Horqin Sandy Land and Songliao Plain (Figure 1). The study area belongs to the cold grassland climate (BSk), the average annual temperature is 5.6 °C, of which the average monthly temperature in January is −13~15 °C, and the average temperature in July is 23~24 °C. The annual precipitation is mainly concentrated in June to August, with an average annual precipitation of about 400 mm. The spatial distribution of precipitation is more in the east and less in the west, and more in the south and less in the north [25]. With the exception of the Liaohe alluvial plain in the east, the study area is a dune–meadow–dune area [26], with the highest elevation of 365 m and the lowest 88.5 m. There are 11 rivers in the territory, the cumulative length of the river is 1188.5 km, there are about 325 large and small lakes, and 11 small- and medium-sized reservoirs. The land use types of the study area are mainly cultivated land, grassland, and forest land; in addition, there are urban villages and industrial and mining land, transportation land, and water and water conservancy facilities land. The main cultivated land types are dryland, paddy field, and irrigated land, and the main crops are maize and rice. However, due to serious soil desertification and local drought, most cultivated land has a shallow soil layer, is of poor quality, and possesses low and unstable crop yield [27]. In general, cultivated land resources in the study area are mainly distributed in the eastern region, with better irrigation conditions and better soil quality. As of the end of 2022, the population of the study area is 394,700. The proportion of rural population is about 66.94%.
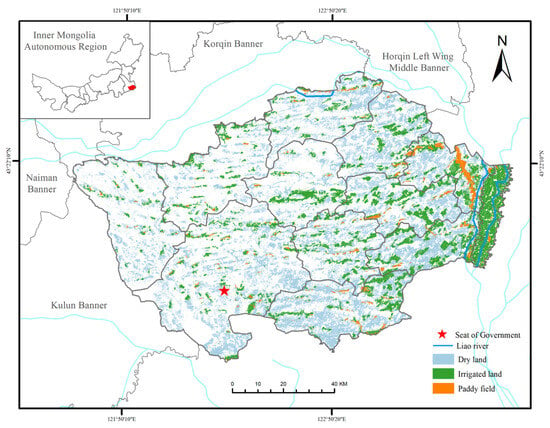
Figure 1.
Geographical location and administrative division of Horqin Left Wing Rear Banner.
2.2. Data Sources
The basic spatial data of this paper are 0.54 m resolution remote sensing image of 2021 obtained from MapQuest (Donnelley Corporation, Chicago, IL, USA). Cultivated land data are derived from remote sensing image interpretation. The dryland, irrigated land, and paddy field data were extracted as the base map data for analysis. During the data processing, the layers were converted into 60 m × 60 m raster data through ArcGIS Version 10.5 spatial analysis.
2.3. Methods
We extracted cultivated land plot information through remote sensing image interpretation, constructed a classification system of cultivated land morphology considering landscape pattern and spatial clustering, morphology, and distribution characteristics, and systematically described the spatial distribution characteristics of cultivated land morphology at the plot scale.
Landscape pattern usually refers to the spatial arrangement and combination of landscape elements of different sizes and shapes, including type, quantity, and spatial distribution, as well as the configuration of landscape components [28], which can directly reflect changes in land use. Therefore, it is of great significance to identify cultivated land morphology from the perspective of landscape patterns [29,30,31]. The cultivated land morphology mainly includes the size, shape, and spatial connectivity of the plots. The indicators describing the plot morphology should be able to reflect the current status of the plots, be clear in meaning, and easy to quantitatively calculate. Based on this, we selected three indicators (plot area, plot fractal dimension, and plot closest distance) to represent plot morphological characteristics (Table 1). Specifically, the larger the plot area, the less fragmented the cultivated land is. The plot fractal dimension ranges from 1 to 2, which is used to measure the complexity of the plot boundary. The larger the value, the more complex the shape of the plot boundary is. The larger the value of the plot’s closest distance, the farther the distance between the plots is and the more scattered the distribution is; conversely, the closer the distance between the plots, the more concentrated the distribution is [12].

Table 1.
Classification index of cultivated land morphology.
First, we used landscape pattern index analysis to calculate the morphological index of cultivated land. Combined with the actual situation and research needs of the study area, the land morphology was divided into clustered type and scattered type according to the nearest distance (ENN), taking 0.4 km as the boundary value. We subdivided the clustered plots into four types based on two criteria: plot area (AREA) and plot fractal dimension (FRAC), and we used 4 hm2 and 1.05 as the boundary values for plot area and plot fractal dimension, respectively.
Spatial autocorrelation analysis is a method to test the correlation between the spatial distribution of a certain spatial element or its attribute value and its adjacent spatial region [32]. In this study, Anselin Local Moran’s I index was used to analyze the degree of correlation between each local unit and its neighboring units. By assigning values to different land morphology, the cultivated land morphology type spatial correlation local index (LISA) cluster map is output to reflect the high or low value cluster of local spatial location so as to present the distribution characteristics of plots between clustered plots and scattered plots, between large plots and small plots, within large plots and within small plots. Within the clustered plots, assign high values to large plots and low values to small plots; within the large plots, assign high values to complex plots and low values to simple plots; within the small plots, assign high values to complex plots and low values to simple plots; in terms of the spatial relationship between clustered plots and scattered plots, assign high values to clustered plots and low values to scattered plots. The formula for Anselin Local Moran’s I is as follows.
In the above formula,
In the formula, n is the total number of units in the study area; and are attributes of regional unit i and regional unit j, respectively; X is the average value of all regional unit attributes; S is the property; and is the spatial weight matrix of regional unit i and regional unit j. The spatial weight matrix determines the potential force of interaction between regional units through spatial adjacency (topological attribute) and spatial distance (distance criterion) [33]. If is greater than , it indicates that there is a positive correlation around regional unit i; that is, the plots with high values are clustered (H–H type) or the plots with low values are clustered (L–L type). If is less than , there is a negative correlation around regional unit i; that is, the plots with low values are surrounded by plots with high values (L–H type) or the plots with high values are surrounded by plots with low values (H–L type).
3. Results
3.1. Recognition Results of Cultivated Land Morphological Characteristics
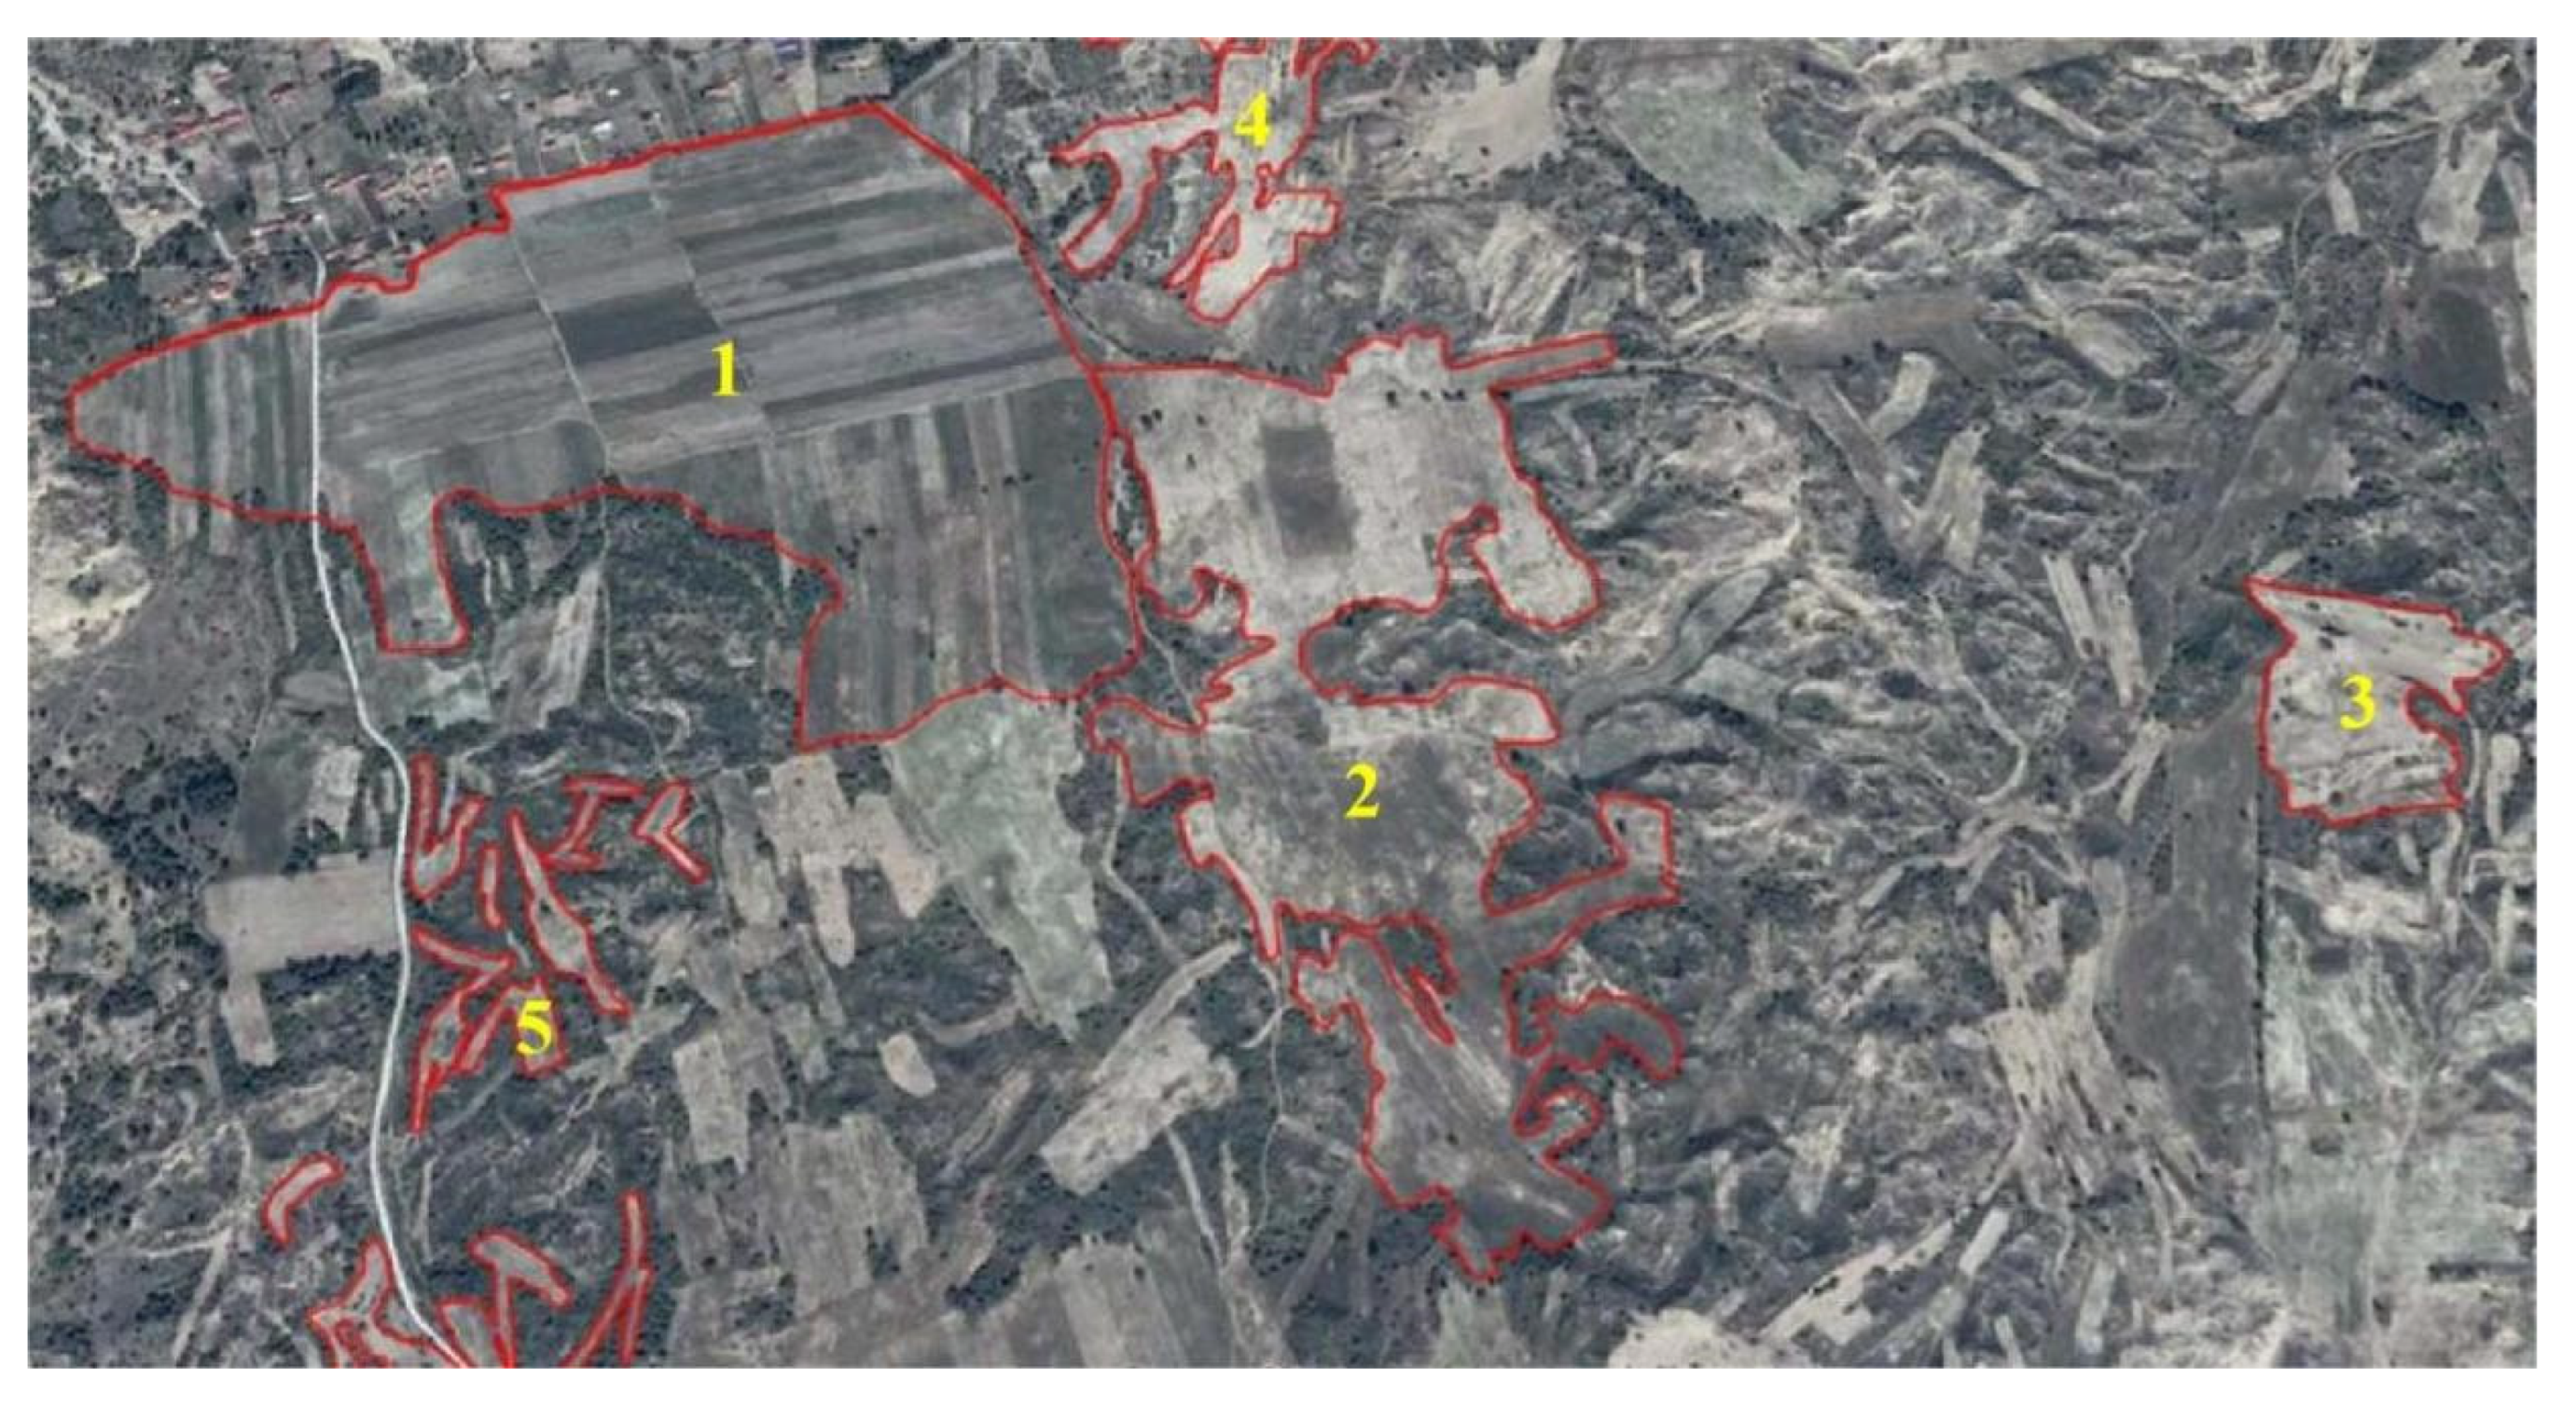
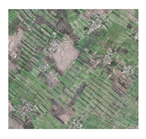
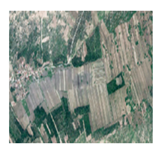
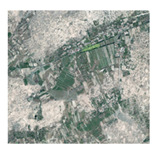
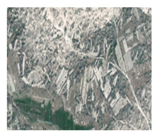
Based on the morphological index calculations and the comparative analysis of remote sensing images of different cultivated land morphologies (Figure 2) and according to the classification standard (Table 2), the cultivated land morphology in the study area can be divided into five categories with the following characteristics:

Figure 2.
Contrast enhancement of remote sensing images of different cultivated land morphologies. (1. Simple large plots; 2. Complex large plots; 3. Simple small plots; 4. Complex small plots; 5. Scattered plots).
Table 2.
Classification of cultivated land morphology types and schematic diagrams.
① The area of simple large plots is 14.32 km2, accounting for 0.32% of the total cultivated land area, which is the smallest cultivated land morphological type with a simple shape and relatively scattered distribution, so it does not tend to form an aggregated area.
② Complex large plots have the broadest distribution range in the study area, with a total area of 4240.63 km2, accounting for 95.06% of the total cultivated land. The distribution of complex large plots is more concentrated in the eastern region, and other land use types are embedded in the distribution, which adds complexity to plot morphology.
③ The area of simple small plots is 75.96 km2, accounting for only 1.70% of the total cultivated area, and is mainly distributed in the western and northern parts of the study area. Due to the constraints of terrain conditions, the plots are small and highly fragmented.
④ The area of complex small plots is 79.42 km2, accounting for 1.78% of the total cultivated land area. The area of complex small plots is relatively fragmented. In some areas, land use types such as grassland and forestland have obvious characteristics of clustering together, and various landscapes are staggered and highly diversified, which tends to lead to a complex plot shape.
⑤ Scattered plots were mainly distributed in the central and western parts of the study area, covering 50.60 km2, accounting for 1.13% of the total cultivated land area. Due to the constraints of topography and landform, as well as presence of woodland, grassland, and other types of barriers to cultivated land, the accessibility between plots is poor, and the distribution is relatively sparse, which is not conducive to large-scale operation.
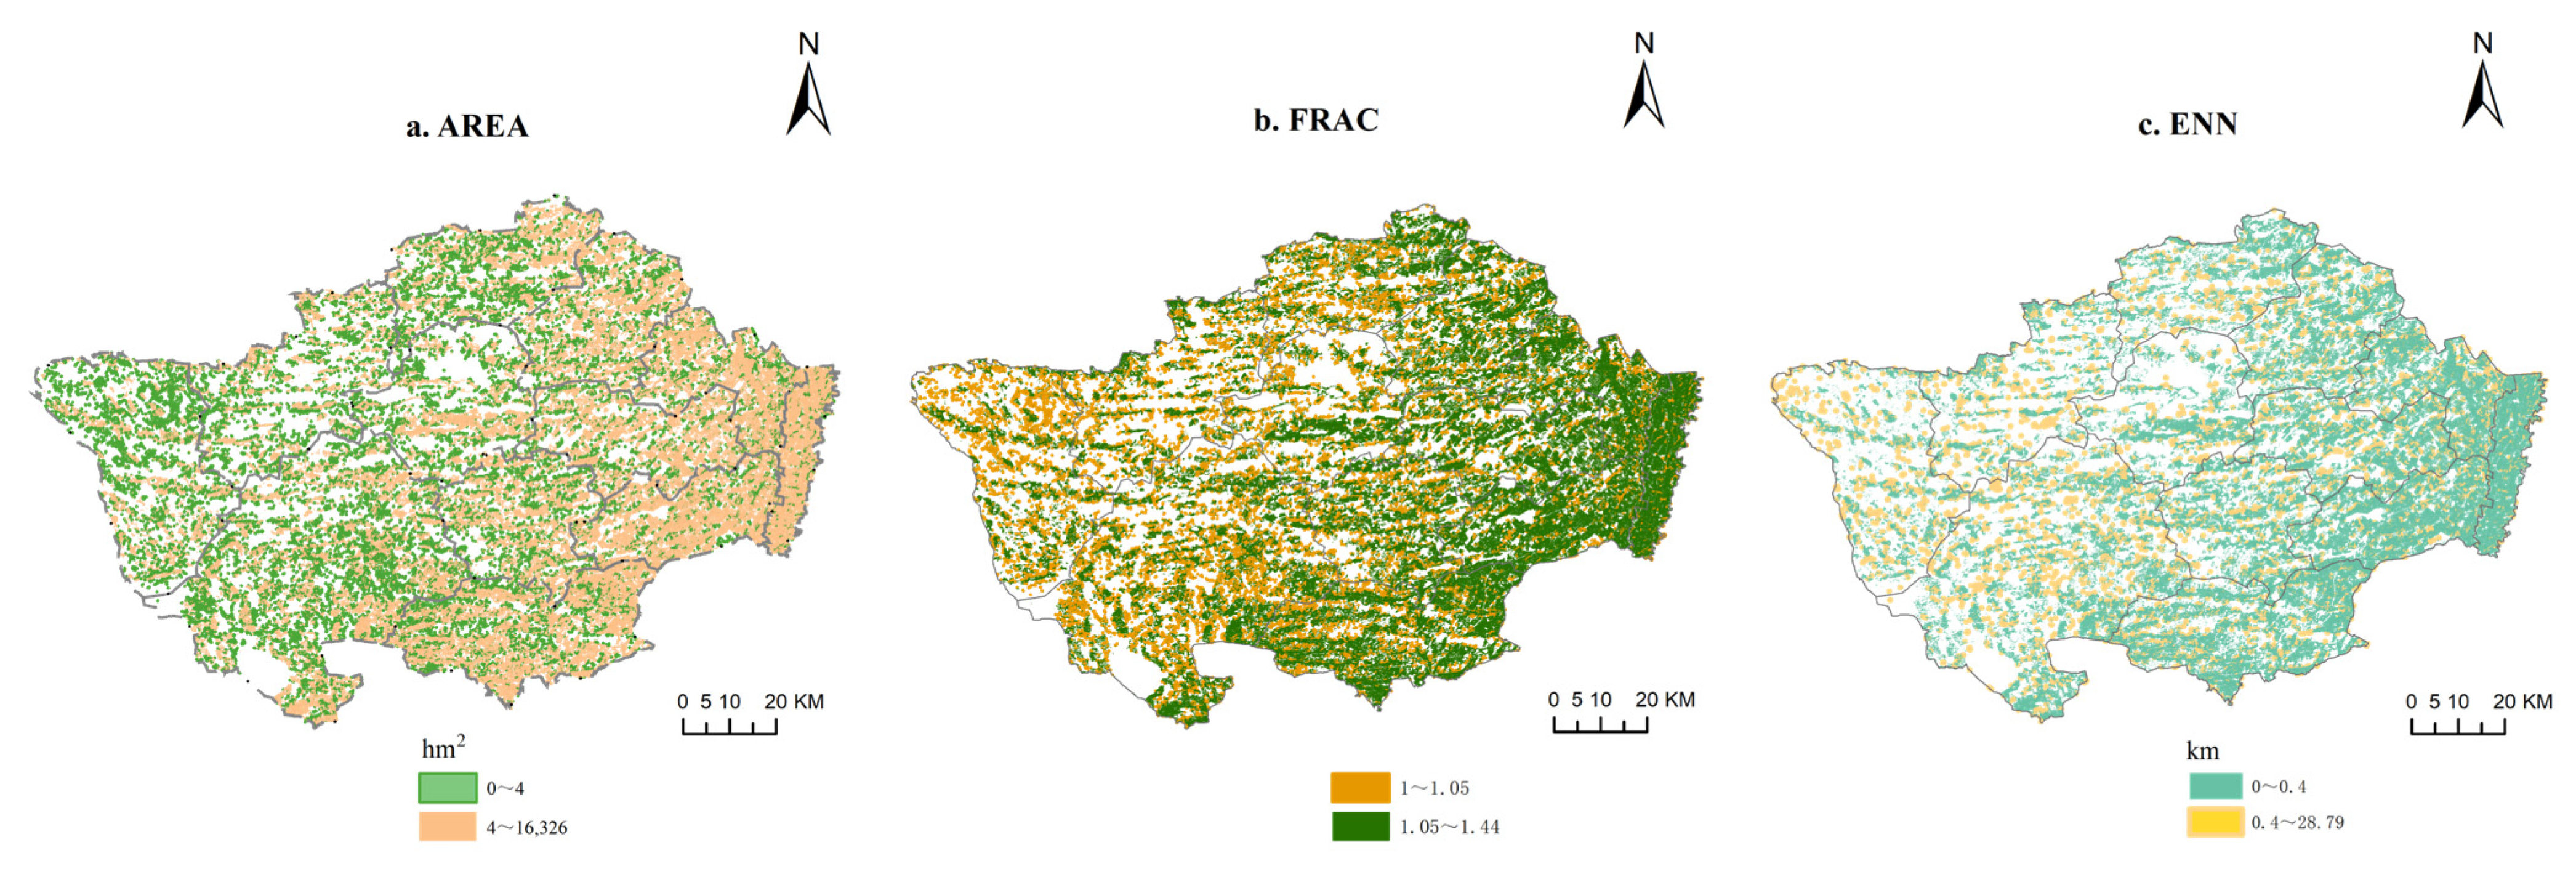
In summary, large plots (simple large plots and complex large plots) were the most widely distributed, accounting for 95.38% of the total cultivated land area, and complex plots were predominant. The area of small plots (simple small plots and complex small plots) accounted for 3.48% of the total cultivated land, and the distribution was concentrated in the western, southern, and northern parts of the study area. The area of simple plots (simple large plots and simple small plots) accounted for 2.02% of the total cultivated land, mainly as small plots, concentrated in the central and western parts of the study area. The area of complex plots (complex large plots and complex small plots) accounted for 96.84% of the total cultivated land area, among which large plots were dominant and mainly distributed in the eastern part of the study area. Clustered plots account for 98.87% of the total cultivated land area, and their distribution covers most of the study area. The area of scattered plots only accounts for 1.13% of the total cultivated land area, which is mainly distributed in the dune–meadow–dune area in the middle and west of the continuous dunes and depressions. The distribution of cultivated land is relatively scattered due to the prominent feature of terrain segmentation. In summary, grassland and sandy land are widely distributed in the western and central areas, and the dune–meadow–dune area landform is widely distributed, leading to cultivated lands being mainly scattered plots and small plots. The eastern region is flat and suitable for the development and expansion of cultivated land. Approximately 80% of paddy land is distributed here, with a high intensity of use and a high proportion of large plots (Figure 3 and Figure 4).
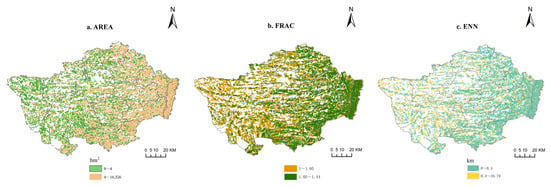
Figure 3.
Results of cultivated land morphology index calculation. (a) The calculation result of index AREA; (b) The calculation result of index FRAC; (c) The calculation result of index ENN.

Figure 4.
Classification of cultivated land morphological types in the study area.
3.2. Spatial Clustering Relationship of Cultivated Land Morphology
Through the analysis of the LISA clustering diagram in Figure 5, it can be seen that cultivated land morphology presents the following clustering characteristics:
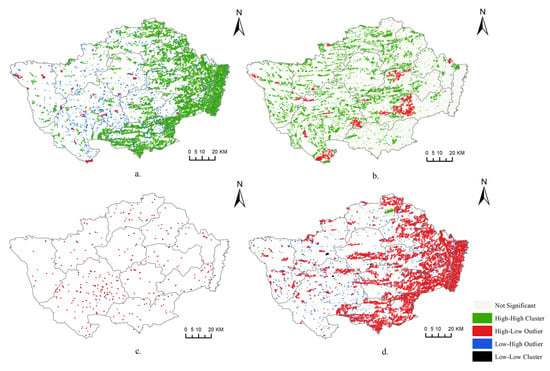
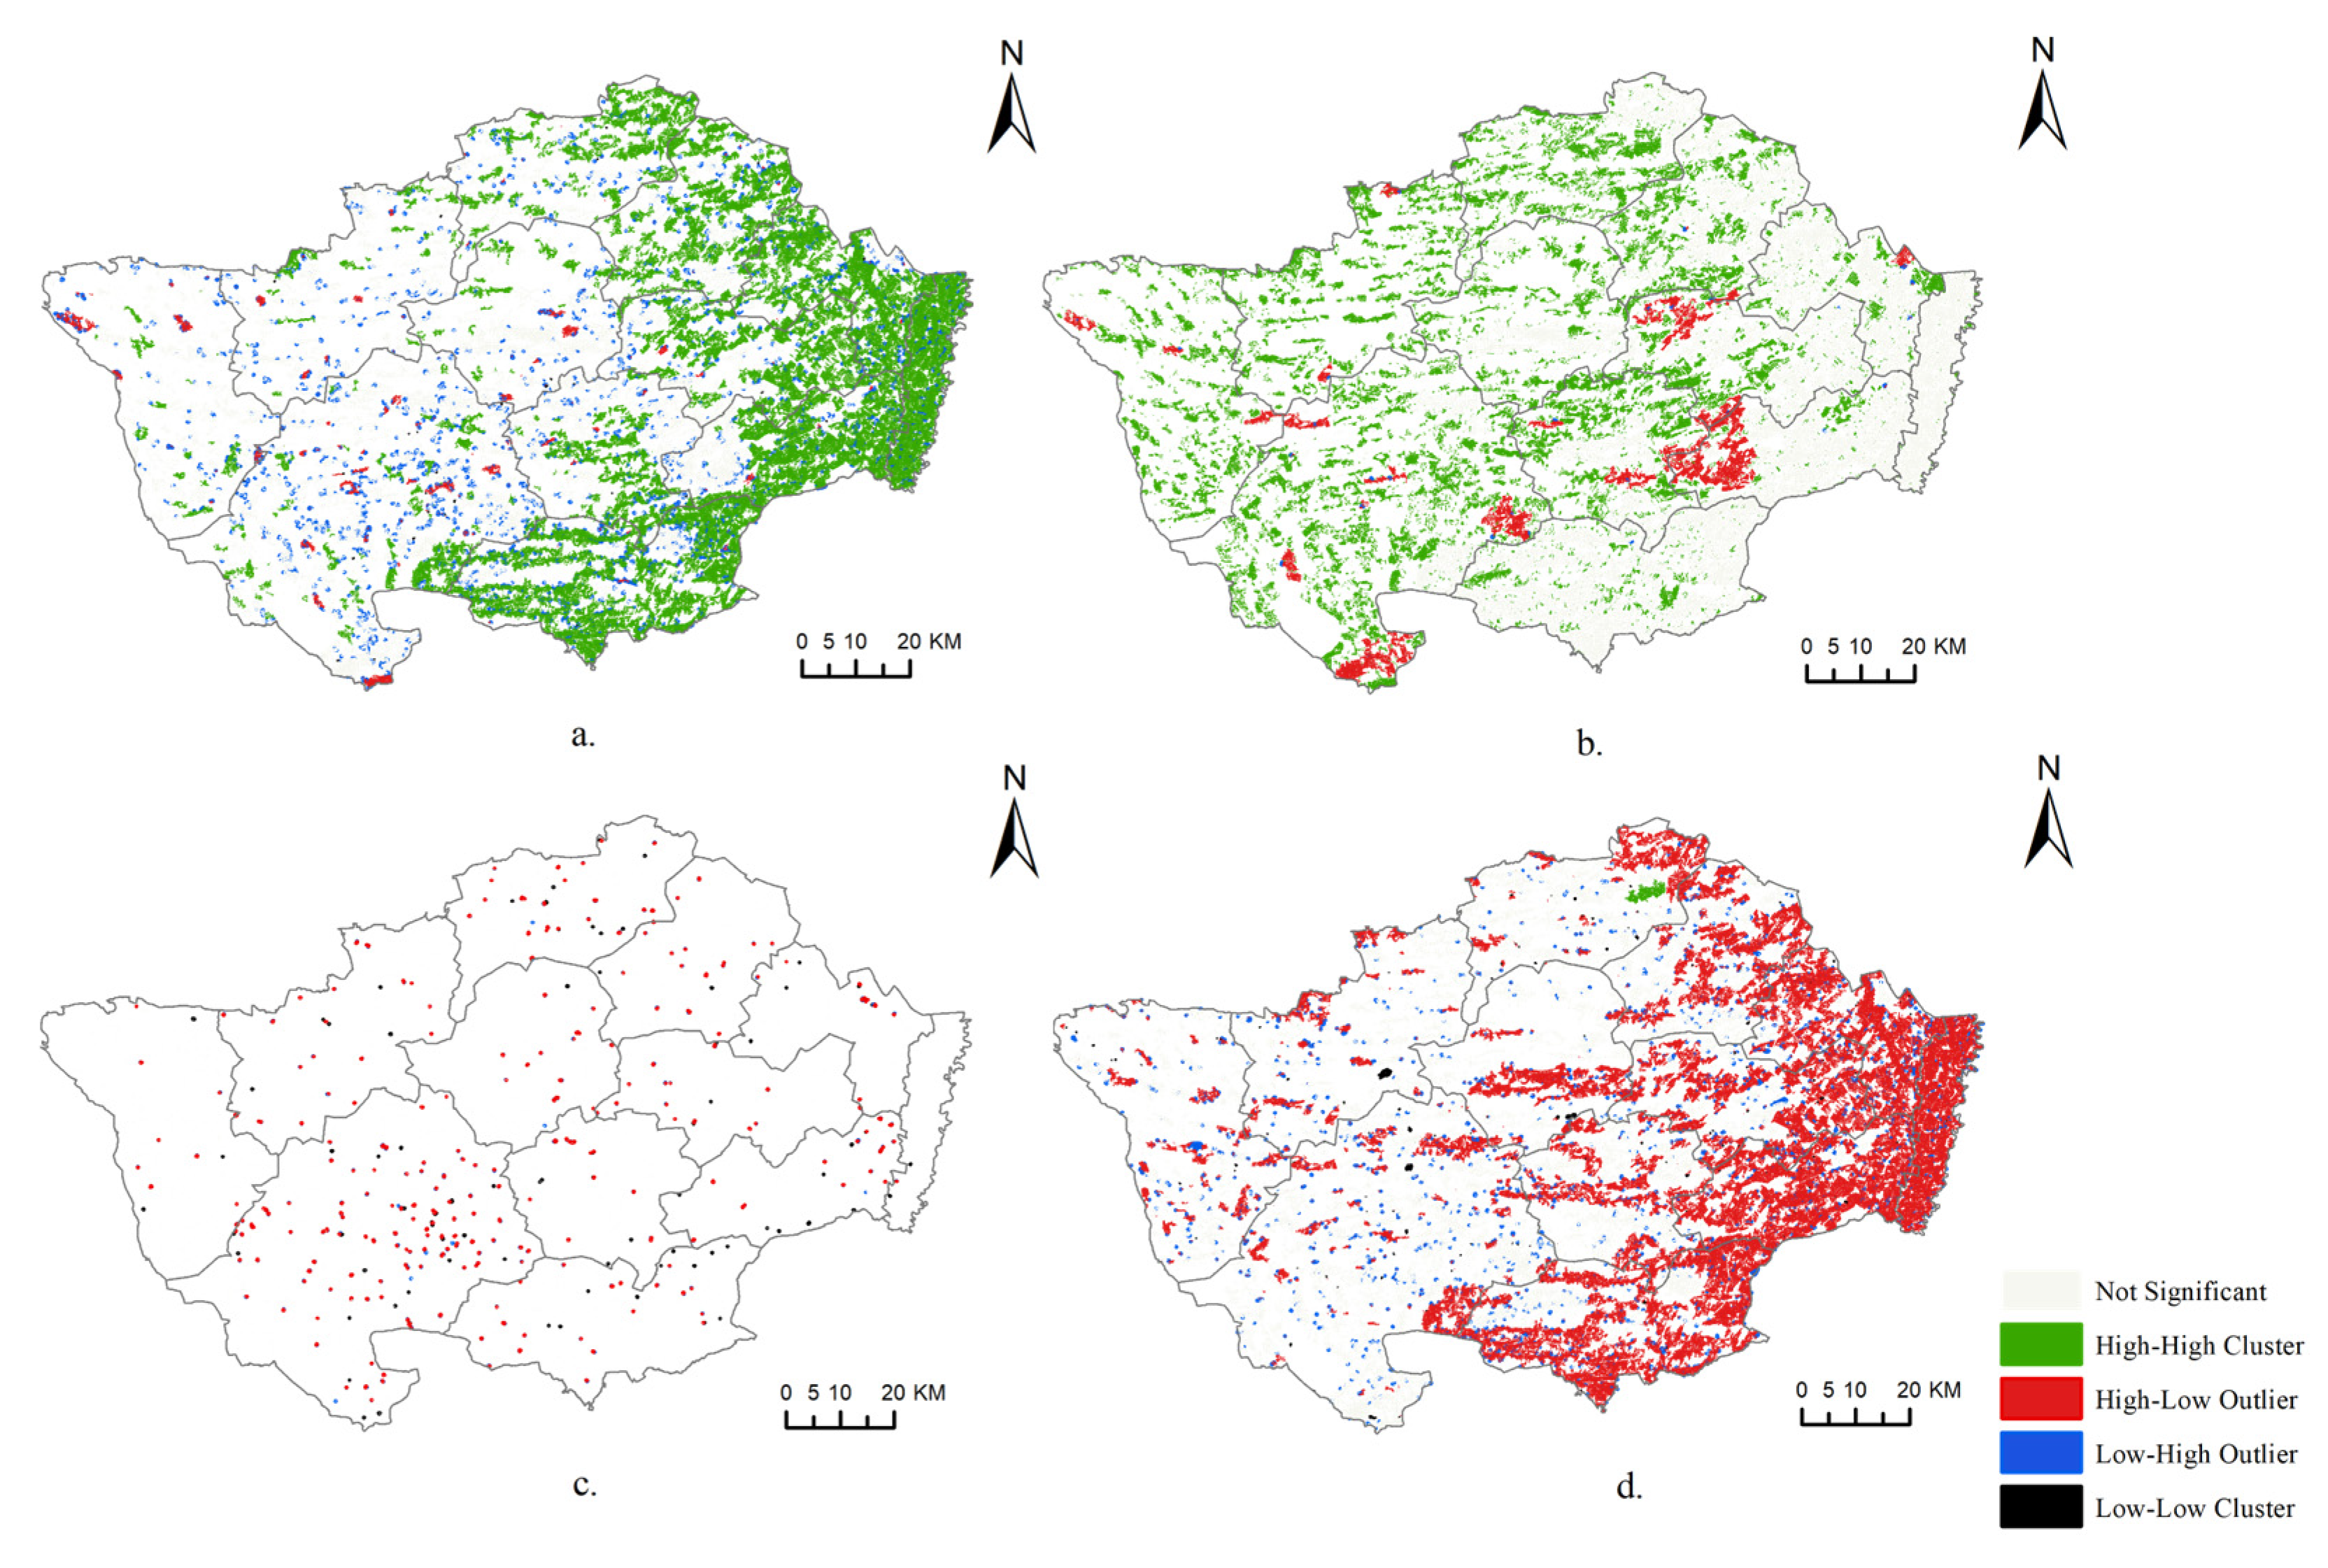
Figure 5.
Cluster map showing cultivated land morphologies based on the spatial correlation local index (LISA). (a) Between large and small plots; (b) Inside the large plots; (c) Inside the small plots; (d) Between clustered and scattered plots.
Within the clustered plots, the “H–H” type area accounted for 56.36%, the “H–L” type, “L–L” type, and “L–H” type accounted for 2.29%, and the nonsignificant type accounted for 41.35% (Figure 5a). The dominant “H–H” type area is mainly distributed in the eastern region and Changsheng Town in the south; that is, the degree of clustering in large plots in this region is high. There are some “H–L” type areas appearing in the west, with large plots scattered and surrounded by small plots. The “L–L” type and “L–H” type areas are only sporadically distributed with low area proportions.
Within the large plots, the “H–H” type accounted for 41.10%, the “H–L” type accounted for 6.83%, the “L–H” type accounted for only 0.05%, and the nonsignificant type accounted for 52.01% (Figure 5b). There was no “L–L” type distribution. The “H–H” type is the aggregation area of complex plots, which is more common in the central and western farming–pastoral ecotone and grassland area. The “H–L” type is scattered among “H–H” type areas, showing a pattern of complex plots scattered and surrounded by simple plots. The “L–H” type only accounts for 0.05%, and there is some distribution near the “H–L” type, showing that simple plots are scattered and surrounded by complex plots. There is no “L–L” type distribution, indicating that simple large plots have difficulty forming aggregation areas in the dune–meadow–dune area. Nonsignificant types accounted for more than half of the total, indicating that the random distribution of plots was more common.
Within the small plots, nonsignificant types accounted for 96.96%, while other types accounted for a relatively small proportion, and there was no “H–H” type distribution (Figure 5c), indicating that the random distribution of geomorphic features within the small plots was relatively significant. This is mainly due to the severe terrain cutting into the distribution area of small plots, leading to a high degree of cultivated land fragmentation, discontinuity, and distance between plots. Other clustering types are mainly distributed in Ganqika Town in the southwest of the study area. As the town with the most abundant cultivated land resources in the study area, Ganqika has no shortage of rolling sand and dunes, and the cultivated land mainly presents the characteristics of complex small plots surrounded by simple small plots.
In terms of the spatial relationship between clustered plots and scattered plots, “H-L” is the dominant type, accounting for 58.17%. Nonsignificant types accounted for 40.92% (Figure 5d), while other types accounted for less. Clustered plots are generally surrounded by scattered plots, which are more obvious in the eastern region. Influenced by the geographical pattern of the dune-meadow-dune area, the “H-L” type in the central and western regions presents an east-west zonal distribution. Other clustering types are distributed randomly.
4. Discussion
The scale, identification, and classification methods used for research in cultivated land plot morphology need to be supplemented and improved constantly to adapt to morphological studies performed under different geographical environments and better promote land consolidation and land use management. Most current studies focus on the integrated morphological analysis of contiguous cultivated land or a variety of land types and pay little attention to semiarid sandy lands in fragile ecological environments and do not consider including the morphological characteristics of plots in the rolling dune area. The potential of cultivated land utilization in semiarid sandy areas is large, but the utilization efficiency is low at present, so it is necessary to determine the morphological characteristics of cultivated land on a microscale. Different from previous studies, this paper, on the basis of focusing on the size, shape, and other natural morphologies of cultivated land plots, comprehensively considers the important indicators for calculating cultivated land morphology indices, adopts the morphology classification method to more intuitively present the morphological characteristics of different plots and differentiate between them, and further analyses the spatial organizational characteristics of different morphology types of land plots. The cultivated land in the semiarid sandy region has different morphologies due to terrain conditions and the influence of land use, which can be divided into five main types. The main pattern is that large plots are obviously clustered in the eastern alluvial plain area, and large plots are surrounded by small plots. This method is an important supplement to the research on cultivated land morphology, but further discussion is needed regarding the selection of the plot correction index and weight determination to depict plot morphology characteristics more accurately.
In addition, the clustering zoning of cultivated land plots is discussed based on morphological types, which expands the basis of cultivated land zoning and can be included in the research of cultivated land protection zoning in subsequent studies [34,35], thus providing new ideas for differentiated protection and scientific management of cultivated land. At the same time, plots of different morphologies can support different scales and types of agriculture. Thus, differentiated and distinctive development strategies should be considered to explore the production potential of the different cultivated land morphology types and to explore how they can be classified and used based on morphology in semiarid sandy areas [26]. For example, large plots are more conducive to large-scale farming, so prioritizing the location of contiguously cultivated land that is aggregated into large plots in the east and developing high-quality agriculture according to local conditions should be considered. However, the central and western parts of the study area have relatively unstable agricultural production in scattered and small plots. To achieve the sustainable development of the agricultural and animal husbandry ecotone, we can combine planting and animal husbandry. At the same time, land consolidation plays an important role in solving the fragmentation problem of cultivated land and optimizing the layout of cultivated land [36,37,38,39,40]. Therefore, we can combine small plots surrounding large plots through land consolidation projects, improve the degree of concentrated contiguous farmland, and transform scattered and small plots to concentrated contiguous high-quality farmland. In addition, considering that the semiarid sandy area is ecologically fragile and prone to desertification [41,42,43], we should take measures to return farmland to forest and grassland for small isolated scattered plots to promote the sustainable utilization of cultivated land in the semiarid sandy areas and desertification control at the same time.
Semiarid sandy areas are unique geographically and fragile ecologically, but they are also an important reserve resource for cultivated land. Therefore, land morphology information is important for using and managing cultivated land. On the basis of identifying the land morphology, large plots and small plots should be classified for disposal and use based on the identified morphologies to ensure the spatial layout of agricultural production is more consistent with the natural geographical pattern of semiarid sandy areas and the law of agricultural production. In addition, we should determine the areas in need of land consolidation to optimize the cultivated land morphology and spatial pattern of the small plots, which will be conducive to improving land use efficiency, promoting agricultural production, and ensuring food security. Centralized contiguous plots will improve the efficiency of production and management and shorten the transportation distance in the process of land use, which will also be of great significance for reducing carbon emissions. At the same time, cultivated land is also a landscape element, and its morphological characteristics and changes are a comprehensive reflection of the regional ecological environment. Especially in ecologically fragile areas, we should pay more attention to protecting cultivated land, carrying out the conversion of farmland to forest or grassland, and conducting comprehensive land consolidation according to local conditions. We should strive to improve the balance between the ecological environment and land productivity to maintain ecological security and achieve a balanced development of the economy, society, and ecology.
5. Conclusions
This paper takes Horqin Left Wing Rear Banner, a typical reclamation area in a semiarid sandy area, as an example. We studied the cultivated land morphological type and its spatial clustering relationship in the study area through morphological characteristics analysis and spatial correlation analysis. The main conclusions are as follows:
- (1)
- There are five types of cultivated land morphology in semiarid sandy areas: simple large plots, complex large plots, simple small plots, complex small plots, and scattered plots. Among them, complex large plots dominate and are widely distributed throughout the territory, followed by complex small plots, and simple large plots have the smallest area.
- (2)
- In areas with significant relief, such as the central and western topographic regions, the dune–meadow–dune area has a notable impact on the segmentation of cultivated land plots. As a result, the distribution of plots becomes more scattered, leading to a greater prevalence of small plots and scattered plots. In the eastern Liaohe alluvial plain, the terrain is relatively flat with a high availability of soil and water resources, and cultivated land is well developed, so the cultivated land morphology is dominated by large plots. Overall, the land distribution pattern of “grassland in the west, cultivated land in the east, and mixed land classes in the middle” in the study area, along with the shaping influence of the dune–meadow–dune area on cultivated land morphology, had a significant impact on the morphology and distribution of cultivated land. This resulted in discontinuity of cultivated land in the central and western regions, as well as significant differences in the morphology of eastern and western lands.
- (3)
- Different morphology types of plots formed a variety of aggregation patterns, with large plots clustering in the eastern alluvial plain and small plots scattered around them. In addition, small plots have an obvious random distribution, and simple large plots do not tend to form aggregation areas. In general, clustered plots and scattered plots are closely related in the eastern region, and clustered plots are surrounded by scattered plots, showing a staggered distribution pattern.
Considering the morphological characteristics and spatial distribution characteristics of cultivated land in the study area, under the constraints of the ecological environment and morphological pattern, the utilization of cultivated land in semiarid sandy areas should be adapted to local conditions. This involves recognizing the status quo of cultivated land morphology and optimizing it, as well as constructing a zoning plan for cultivated land utilization and protection based on morphological differentiation. These measures will promote the harmonious development of the human–land interaction in semiarid sandy areas. In future work, the classification of cultivated land morphology and the formulation of its constraints can be further quantitatively analyzed, and fuzzy clustering algorithms can be added to improve the science and accuracy of morphological classification. Meanwhile, combining the unique geographical environment of semiarid sandy areas, future research can explore the formation mechanism of different morphology types of land plots and investigate the regularity of morphological changes in cultivated land at different spatial and temporal scales. This will enable a more comprehensive and accurate understanding of the morphological characteristics of cultivated land.
Author Contributions
Y.X. designed the research; X.Z. performed the data analysis and wrote the main manuscript text; W.Y. and K.W. wrote the main manuscript text and made figures and tables; H.Z. and Z.S. provided conceptualization, investigation, and methodology. All authors have read and agreed to the published version of the manuscript.
Funding
This work was supported by the National Natural Science Foundation of China (grant number 41301614) and the Special Scientific Research of the Ministry of Land and Resources of China—Key Technology and Demonstration based on Protective Development of Sandy Land in Inner Mongolia (grant number 201411009).
Institutional Review Board Statement
The authors declare that the submitted manuscript is original and unpublished elsewhere and that this manuscript complies with the Ethical Rules applicable for this journal.
Informed Consent Statement
The authors give their permission to participate. The authors consent to publish this article in your journal and to transfer copyright to the publisher once the paper has been accepted.
Data Availability Statement
The datasets generated during the current study are available from the corresponding author on reasonable request.
Acknowledgments
We are grateful for the comments and criticisms of the journal’s anonymous reviewers and our colleagues.
Conflicts of Interest
The authors declare no conflict of interest. The opinions expressed here are those of the authors and do not necessarily reflect the position of the government of China or of any other organization.
References
- Ntihinyurwa, P.D.; de Vries, W.T. Farmland fragmentation, farmland consolidation and food security: Relationships, research lapses and future perspectives. Land 2021, 10, 129. [Google Scholar] [CrossRef]
- Kong, X. China must Protect High—Quality Arable Land: Figures from a National Survey of Land Use Seem Positive, but the Effort Exposed some Worrying Trends. Nature 2014, 505, 7–8. [Google Scholar] [CrossRef] [PubMed]
- Willy, D.K.; Muyanga, M.; Jayne, T. Can economic and environmental benefits associated with agricultural intensification be sustained at high population densities? A farm level empirical analysis. Land Use Policy 2019, 81, 100–110. [Google Scholar] [CrossRef] [PubMed]
- Moran, E.; Ojima, D.S.; Buchmann, B.; Canadell, J.G.; Coomes, O.; Graumlich, L.; Jackson, R.; Jaramillo, V.; Lavorel, S.; Leadley, P.; et al. Global Land Project: Science Plan and Implementation Strategy; IGBP Secretariat: Stockholm, Sweden, 2005. [Google Scholar]
- Müller, D.; Leitão, P.J.; Sikor, T. Comparing the determinants of cropland abandonment in Albania and Romania using boosted regression trees. Agric. Syst. 2013, 117, 66–77. [Google Scholar] [CrossRef]
- Liu, J.; Kuang, W.; Zhang, Z.; Xu, X.; Qin, Y.; Ning, J.; Zhou, W.; Zhang, S.; Li, R.; Yan, C.; et al. Spatiotemporal characteristics, patterns, and causes of land-use changes in China since the late 1980s. J. Geogr. Sci. 2014, 24, 195–210. [Google Scholar] [CrossRef]
- Guzha, A.; Rufino, M.; Okoth, S.; Jacobs, S.; Nóbrega, R. Impacts of land use and land cover change on surface runoff, discharge and low flows: Evidence from East Africa. J. Hydrol. Reg. Stud. 2018, 15, 49–67. [Google Scholar] [CrossRef]
- Slee, B.; Brown, I.; Donnelly, D.; Gordon, I.J.; Matthews, K.; Towers, W. The ‘squeezed middle’: Identifying and addressing conflicting demands on intermediate quality farmland in Scotland. Land Use Policy 2014, 41, 206–216. [Google Scholar] [CrossRef]
- Gao, S.; Liu, S. Exploration and Analysis of the Aesthetic Cognitive Schema of Contemporary Western Urban Landscapes. Int. J. Environ. Res. Public Health 2021, 18, 5152. [Google Scholar] [CrossRef]
- Mansourian, S. From landscape ecology to forest landscape restoration. Landsc. Ecol. 2021, 36, 2443–2452. [Google Scholar] [CrossRef]
- Qian, F.; Wang, W.; Zhang, X.; Zhang, J.; Bian, Z. Dominant landscape characteristics of the arable land red line in Donggang, China. Earth Sci. Res. J. 2022, 26, 83–89. [Google Scholar] [CrossRef]
- Ju, H.; Zuo, L.; Zhang, Z.X.; Zhao, X.; Wang, X.; Wen, Q.; Liu, F.; Xu, J.; Liu, B.; Yi, L.; et al. Methods research on describing the spatial pattern of land use types in China. Acta Geogr. Sin. 2020, 75, 143–159. [Google Scholar]
- Sang, Z.; Liang, J.; Zheng, H.; Wang, K.; Xu, Y.; Liu, Y. Identification of fragmented cropland in arid and semiarid sandy areas: A case study of horqin left rear banner. Front. Environ. Sci. 2022, 10, 1141. [Google Scholar] [CrossRef]
- Jiang, P.; Cheng, Q.; Zhuang, Z.; Tang, H.; Li, M.; Cheng, L.; Jin, X. The dynamic mechanism of landscape structure change of arable landscape system in China. Agric. Ecosyst. Environ. 2018, 251, 26–36. [Google Scholar] [CrossRef]
- Latruffe, L.; Piet, L. Does land fragmentation affect farm performance? A case study from Brittany, France. Agric. Syst. 2014, 129, 68–80. [Google Scholar] [CrossRef]
- Chen, L.; Zhao, H.; Song, G.; Liu, Y. Optimization of cultivated land pattern for achieving cultivated land system security: A case study in Heilongjiang Province, China. Land Use Policy 2021, 108, 105589. [Google Scholar] [CrossRef]
- Heider, K.; Lopez, J.M.R.; Avilés, J.M.G.; Balbo, A.L. Land fragmentation index for drip-irrigated field systems in the Mediterranean: A case study from Ricote (Murcia, SE Spain). Agric. Syst. 2018, 166, 48–56. [Google Scholar] [CrossRef]
- Chen, F.; Liu, J.; Chang, Y.; Zhang, Q.; Yu, H.; Zhang, S. Spatial pattern differentiation of non-grain cultivated land and its driving factors in China. Chin. Land Sci. 2021, 35, 33–43. [Google Scholar]
- Zhang, L.; Zhang, F.R.; An, P.; Zhang, W.; Yan, L. Comparative study of cultivated land use intensive degree and its change law at different economic levels. Trans. CSAE 2008, 24, 108–112. [Google Scholar]
- Song, L.; Cao, Y.; Zhou, W.; Su, R.; Qiu, M. Scale effects and countermeasures of cultivated land changes based on hierarchical linear model. Environ. Monit. Assess. 2020, 192, 346. [Google Scholar] [CrossRef]
- Jiang, P.; Li, M.; Lv, J.; Macaulay, L.T. The causes of farmland landscape structural changes in different geographical environments. Sci. Total. Environ. 2019, 685, 667–680. [Google Scholar] [CrossRef]
- Irwin, E.G.; Bockstael, N.E. The evolution of urban sprawl: Evidence of spatial heterogeneity and increasing land fragmentation. Proc. Natl. Acad. Sci. USA 2007, 104, 20672–20677. [Google Scholar] [CrossRef] [PubMed]
- Su, S.; Ma, X.; Xiao, R. Agricultural landscape pattern changes in response to urbanization at ecoregional scale. Ecol. Indic. 2014, 40, 10–18. [Google Scholar] [CrossRef]
- Cunha, N.S.; Magalhães, M.R.; Domingos, T.; Abreu, M.M.; Withing, K. The land morphology concept and mapping method and its application to mainland Portugal. Geoderma 2018, 325, 72–89. [Google Scholar] [CrossRef]
- Wang, Y.; Zhang, J.; Tong, S.; Guo, E. Monitoring the trends of aeolian desertified lands based on time-series remote sensing data in the Horqin Sandy Land, China. Catena 2017, 157, 286–298. [Google Scholar] [CrossRef]
- Zhou, J.; Xu, Y.; Gao, Y.; Xie, Z. Land use model research in agro-pastoral ecotone in northern China: A case study of Horqin Left Back Banner. J. Environ. Manag. 2019, 237, 139–146. [Google Scholar] [CrossRef]
- Zhu, W.; Gao, Y.; Zhang, H.; Liu, L. Optimization of the land use pattern in Horqin Sandy Land by using the CLUMondo model and Bayesian belief network. Sci. Total. Environ. 2020, 739, 139929. [Google Scholar] [CrossRef]
- Jiang, P.; Li, M.; Sheng, Y. Spatial regulation design of farmland landscape around cities in China: A case study of Changzhou City. Cities 2020, 97, 102504. [Google Scholar] [CrossRef]
- Kuchma, T.; Tarariko, O.; Syrotenko, O. Landscape Diversity Indexes Application for Agricultural Land Use Optimization. Procedia Technol. 2013, 8, 566–569. [Google Scholar] [CrossRef]
- Liang, X.; Jin, X.; Ren, J.; Gu, Z.; Zhou, Y. A research framework of land use transition in Suzhou City coupled with land use structure and landscape multifunctionality. Sci. Total. Environ. 2020, 737, 139932. [Google Scholar] [CrossRef]
- Liu, C.; Deng, C.; Li, Z.; Liu, Y.; Wang, S. Optimization of Spatial Pattern of Land Use: Progress, Frontiers, and Prospects. Int. J. Environ. Res. Public Health 2022, 19, 5805. [Google Scholar] [CrossRef]
- Jiao, Y.; Xiao, D. Spatial neighboring characteristics among patch types in oasis and its ecological security. J. Appl. Ecol. 2004, 15, 31–35. [Google Scholar]
- Chen, H.; Zhu, D.; Yun, W.; Yang, L.; Tang, H.; Tang, C. Analysis on cultivated land fragmentation and spatial agglomeration pattern in Jiaxing city. Trans. Chin. Soc. Agric. Eng. 2012, 28, 235–242. [Google Scholar]
- Liu, H.F.; Bi, R.T.; Guo, Y.L.; Wang, J. Protection Zoning of Cultivated Land Based on Form-Structure-Function Multidimensional Evaluation System. Nongye Jixie Xuebao/Trans. Chin. Soc. Agric. Mach. 2021, 52, 168–177. [Google Scholar]
- Wei, S.; Xiong, C.; Luan, Q.; Hu, Y. Protection zoning of arable land quality index based on local spatial autocorrelation. Trans. Chin. Soc. Agric. Eng. 2014, 30, 249–256. [Google Scholar]
- Du, X.; Zhang, X.; Jin, X. Assessing the effectiveness of land consolidation for improving agricultural productivity in China. Land Use Policy 2018, 70, 360–367. [Google Scholar] [CrossRef]
- Zhang, B.; Niu, W.; Ma, L.; Zuo, X.; Kong, X.; Chen, H.; Zhang, Y.; Chen, W.; Zhao, M.; Xia, X. A company-dominated pattern of land consolidation to solve land fragmentation problem and its effectiveness evaluation: A case study in a hilly region of Guangxi Autonomous Region, Southwest China. Land Use Policy 2019, 88, 104115. [Google Scholar] [CrossRef]
- Gonzalez, X.P.; Alvarez, C.J.; Crecente, R. Evaluation of land distributions with joint regard to plot size and shape. Agric. Syst. 2004, 82, 31–43. [Google Scholar] [CrossRef]
- Gonzalez, X.P.; Marey, M.F.; Alvarez, C.J. Evaluation of productive rural land patterns with joint regard to the size, shape and dispersion of plots. Agric. Syst. 2007, 92, 52–62. [Google Scholar] [CrossRef]
- Liu, J.; Jin, X.; Xu, W.; Sun, R.; Han, B.; Yang, X.; Gu, Z.; Xu, C.; Sui, X.; Zhou, Y. Influential factors and classification of cultivated land fragmentation, and implications for future land consolidation: A case study of Jiangsu Province in eastern China. Land Use Policy 2019, 88, 104185. [Google Scholar] [CrossRef]
- Jiang, W.; Li, J.; Li, J.; Chen, Y.; Wu, Y. Changes and spatial patterns of eco-environment in the farming-pastoral region of northern China. J. Geogr. Sci. 2005, 15, 329–336. [Google Scholar] [CrossRef]
- Peng, Y.; Mi, K.; Qing, F.; Xue, D. Identification of the main factors determining landscape metrics in semi-arid agro-pastoral ecotone. J. Arid. Environ. 2016, 124, 249–256. [Google Scholar] [CrossRef]
- Xu, D.; Li, C.; Song, X.; Ren, H. The dynamics of desertification in the farming-pastoral region of North China over the past 10years and their relationship to climate change and human activity. Catena 2014, 123, 11–22. [Google Scholar] [CrossRef]

Disclaimer/Publisher’s Note: The statements, opinions and data contained in all publications are solely those of the individual author(s) and contributor(s) and not of MDPI and/or the editor(s). MDPI and/or the editor(s) disclaim responsibility for any injury to people or property resulting from any ideas, methods, instructions or products referred to in the content. |
© 2023 by the authors. Licensee MDPI, Basel, Switzerland. This article is an open access article distributed under the terms and conditions of the Creative Commons Attribution (CC BY) license (https://creativecommons.org/licenses/by/4.0/).