1. Introduction
The Industrial Revolution unleashed human productivity and led to the development of a factor input model of economic development. However, this development model has led to problems such as inefficient land use in developing countries. Land is considered to be a major non-renewable factor of production [
1], and its morphological changes reflect the characteristics of human economic and social activities at different times [
2]. Currently, the scarcity of land resources [
3] and the uneven spatial distribution of land use efficiency [
4,
5] are problems that need to be addressed in the process of achieving sustainable land use in developing countries. One viewpoint is that sustainable land use should not be at the expense of future generations, and the key to improving land use efficiency is through high-quality land development [
6]. As China is a developing country with a vast and diverse area of land, sustainable development has become one of the core policies of the Chinese government. However, decades of rapid urbanization have gradually exposed China’s lack of land use efficiency [
7,
8,
9]. Therefore, exploring a high-LUE development model would be valuable for China and many developing countries.
Policies are important drivers for improving LUE [
10]. As LUE-related research involves many fields such as politics, economics, environment, and society [
11], synergistic progress in several fields is required to improve LUE. Governments at all levels guide the synergistic progress of each field by providing legal frameworks or by formulating detailed planning policies [
12]. In practice, land use governance can vary considerably, considering factors such as mutual cooperation and competition between local governments on land use issues, the locational characteristics of cities, and the types of actors involved in land use governance. For example, in some regions, there is a clear hierarchy in the levels of planning, with each of the agencies involved having their own responsibilities [
13]. This also means that the impacts of policy on LUE are the result of the coordination among multiple parties. In academic research, more studies have been conducted to discuss the contribution of policies to improvements in LUE [
14,
15,
16]. To date, researchers have mainly discussed the effects of different types of policies on LUE. Tang et al. found that trading carbon emissions promotes the transformation of land use [
16]. Nguyen-Anh et al. found that land accumulation policies contributed to improvements in LUE [
17]. Nizalov et al. discussed the relationship between tenure security and land use [
18]. Van Meijl et al. found that the impact of policies on LUE was confounded by the environment of policy [
19]. This present work focused on the mechanism of FCS policies on LUE from the perspective of the drivers of policy implementation for the following reasons.
China’s forestry area is vast and rich in carbon sinks [
20], and the study of FCS policy is beneficial to the full utilization of its forestry resources, which is of great practical value for achieving sustainable development. At the same time, the study of FCS is of great significance at a time when countries around the world are emphasizing carbon neutrality and peak carbon.
There are still insufficient studies discussing the impact of FCS policies on LUE. In terms of the effects, Olschewski et al. and Kallio et al. found that the economic benefits of land can be improved by FCS policies [
21,
22]. Raihan et al., on the other hand, analyzed the effect of different vegetation types on the economic output of FCS [
23]. Similarly, the study by Pugh et al. pointed out that the tropical rainforest climate is not the best environment for the development of forestry carbon sinks [
24]. Liu and He found that FCS policies contribute to the sustainable utilization of land resources [
25]. After examining 26 industrial countries, Røttereng emphasized the environmental contribution of FCS policies [
26]. The study of Walker et al. also confirmed that FCS improves LUE from the environmental dimension [
27]; however, there are concerns about the impact of forestry carbon sinks forests on the surrounding environment (e.g., the water table) [
28]. In terms of constraints, the important role of infrastructure in land-related policies was emphasized [
29]. Røttereng indicated the important influence of political factors on FCS [
26]. Fatichi et al. discussed the effects of climate on the policy utility of FCS [
30]. In addition, external factors such as the quality of the soil [
31] and CO
2 concentrations [
32] will also influence this role. However, few studies have empirically analyzed this role from the perspective of the drivers of policy implementation.
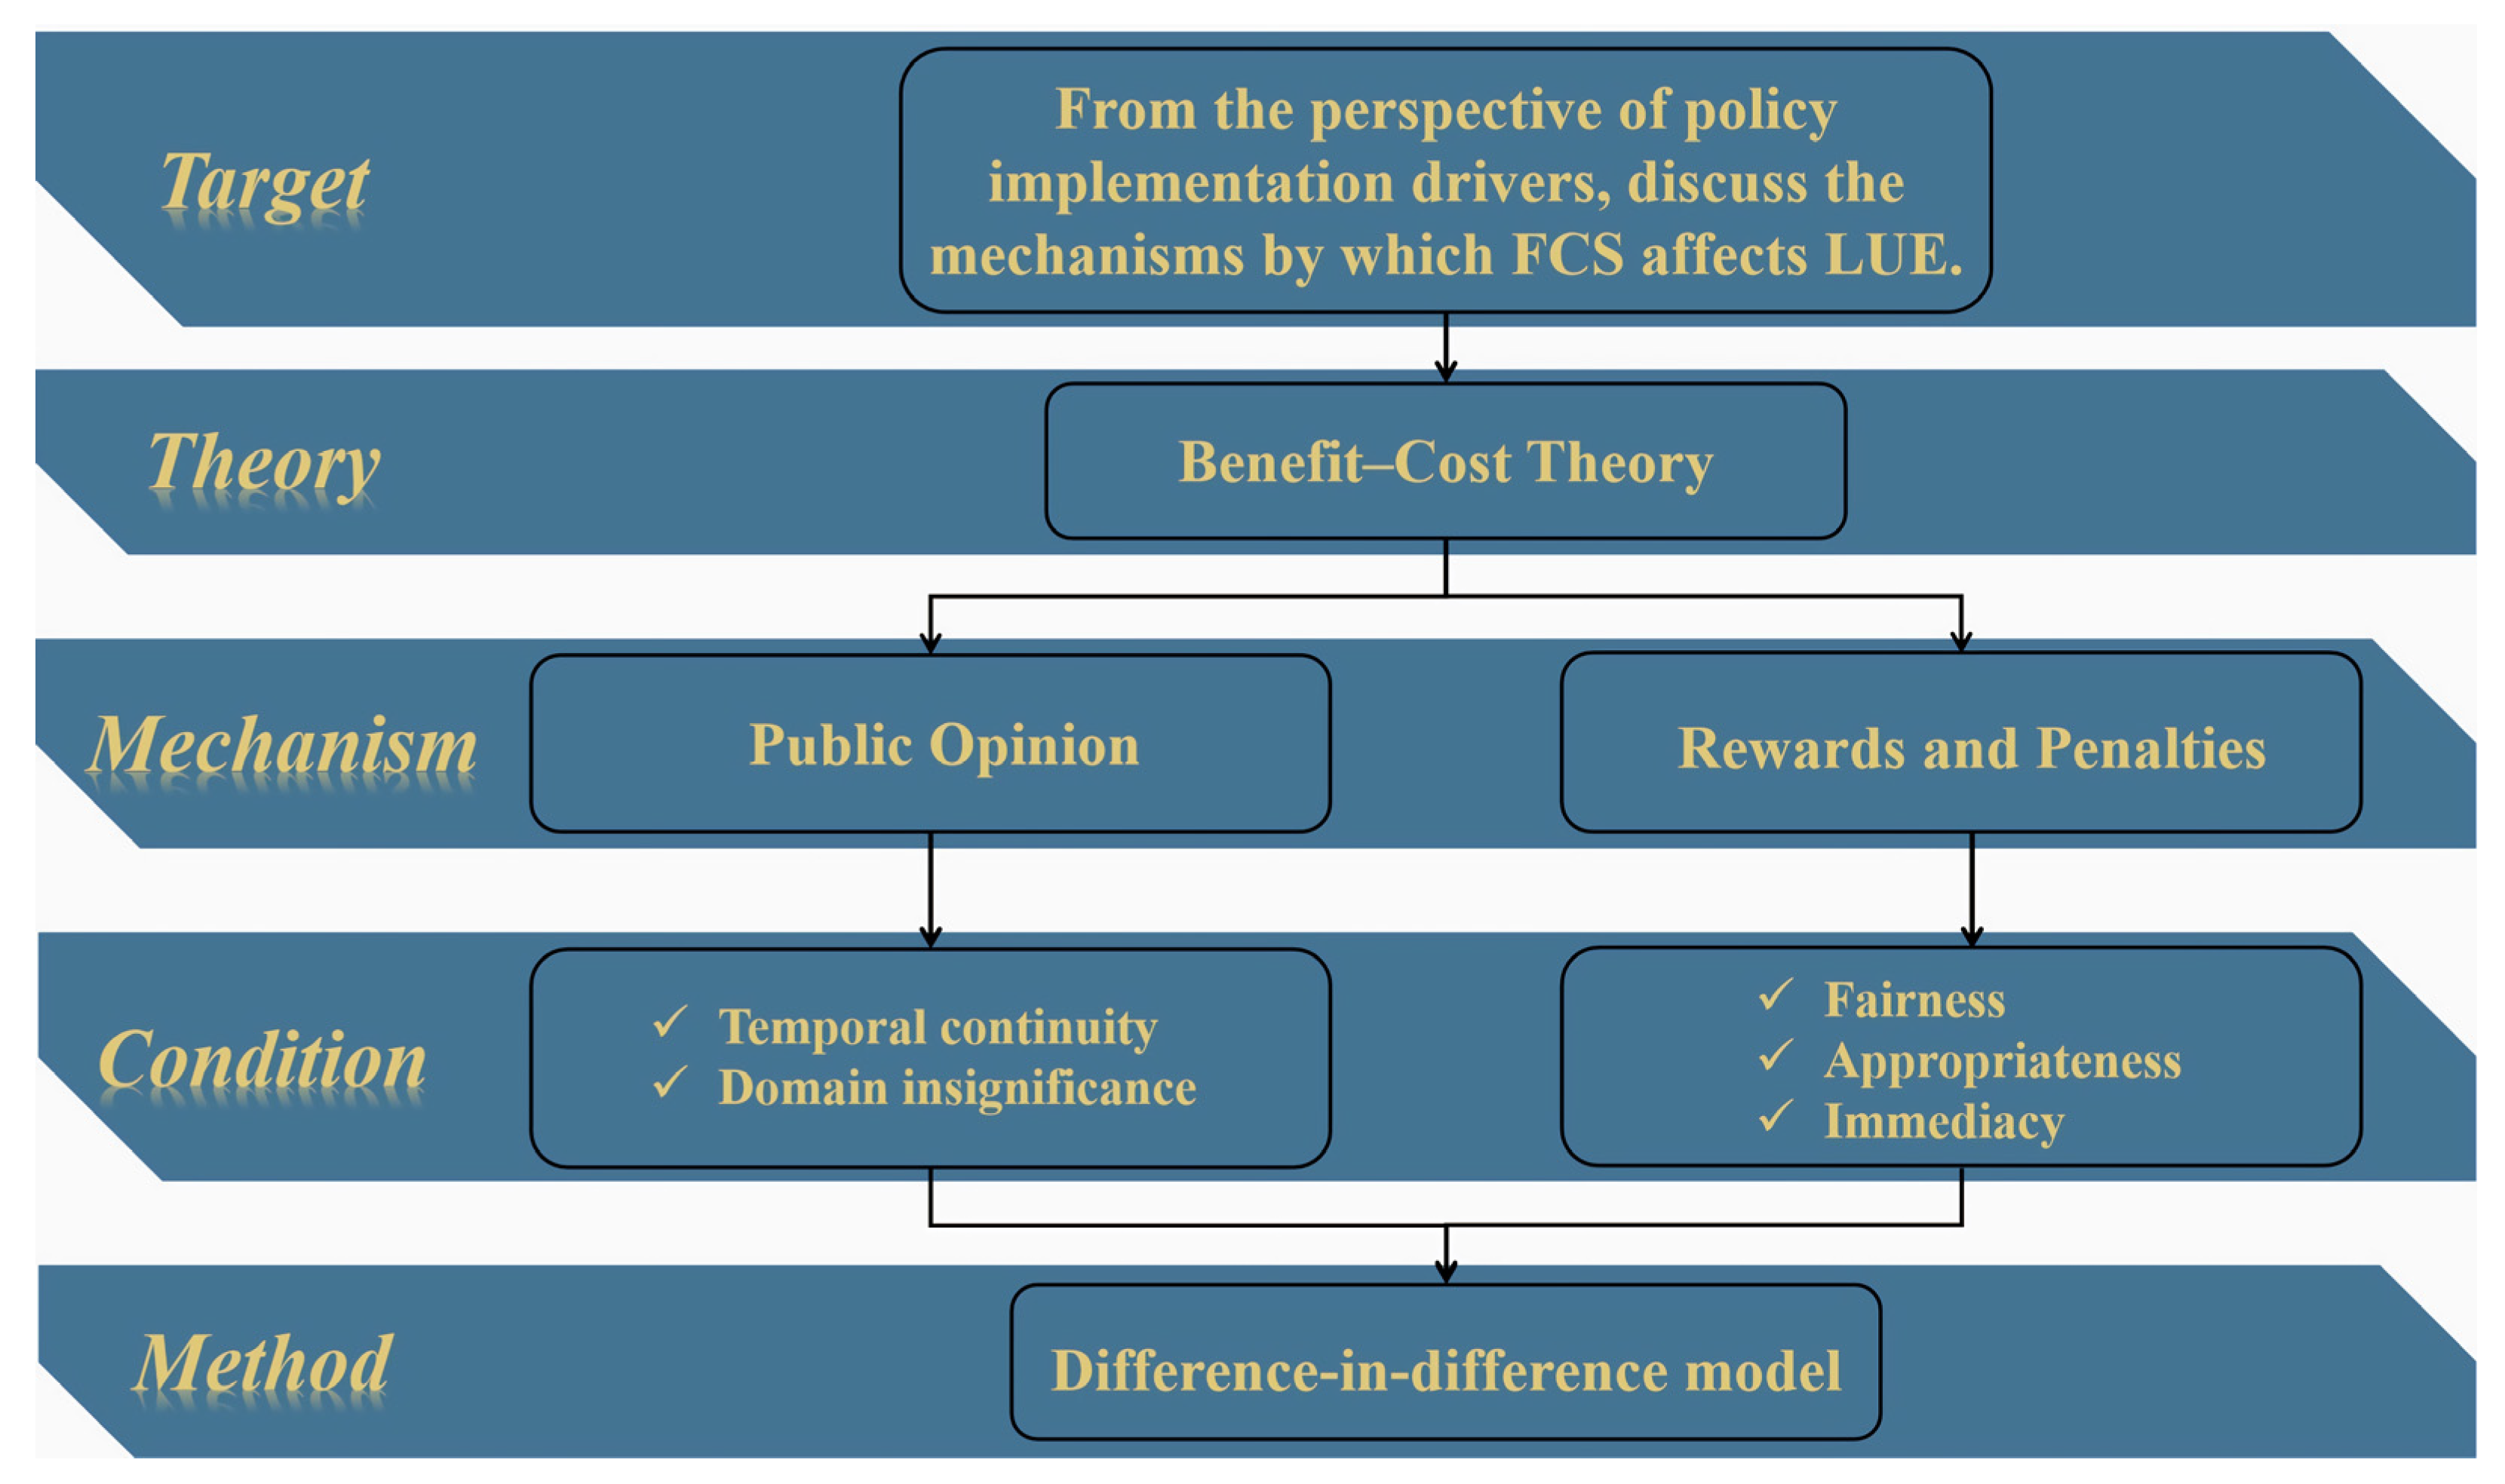
Based on the above analyses, this study aimed to use the benefit–cost theory as the theoretical foundation and the empirical model for discussing the mechanisms of the FCS policies on LUE from the perspective of the drivers of policy implementation. The main contributions of this study to the international literature are the following: (i) it analyzed the mechanism of FCS policies from the perspective of the drivers of policy implementation using the ideas of the benefit–cost theory; and (ii) it designed an identifiable strategy that can be used to test the mechanisms of the drivers of policy implementation (public opinion, and rewards and penalties) in order to assess the effects of FCS policies more accurately using the DID model.
2. Theory, Methods, and Data
2.1. Benefit–Cost Theory
The existing literature has tended to evaluate policies related to energy efficiency and reducing emissions from the perspective of economic output in terms of the endogenous growth theory. Based on the idea of the cost–benefit theory, this study developed the analysis from the perspective of the drivers of policy implementation.
Why are policies implemented? One widely accepted explanation is that the actors implement policies because of their own vested interests. In addition, policymakers improve or withdraw policies on the basis of their own interests. For example, policies may be formulated with a view to obtain immediate benefits at the expense of long-term benefits; policies may not deliver the expected benefits, or the actual costs can be much higher than expected. Policy implementation is therefore a matter of balancing long-term and short-term interests, individual interests, and national interests. Calculating and comparing the benefits, or the net value of the benefits and costs, is an important basis for deciding whether or not an actor will implement a policy.
Before the analysis, this study defined the main actors in the implementation of China’s FCS policy as the central government, local governments, and relevant enterprises.
The central government is in a position to oversee the whole situation. In accordance with the constitution and laws, the central government prescribes administrative measures, formulates administrative regulations, and issues decisions and orders. At the same time, it submits proposals to the National People’s Congress.
Local governments are mainly responsible for the duties of implementation and supervision. On the basis of the requirements from the higher level, the local government formulates appropriate local regulations and supervises their implementation.
Enterprises are in the position of implementers. Enterprises need to adjust their business strategies in a timely manner to comply with the laws and regulations enacted by the government to avoid illegal and unlawful business activities.
Utilitarianism views benefits and costs as two fundamental variables in the choices people make. From a rational perspective, not only enterprises but also governments can be seen as self-interested individuals. They are capable of identifying their own interests and maximizing their self-interest in the trade-off between benefits and costs [
33]. Therefore, in this study, both governments and enterprises were assumed to be self-interested rational individuals. This also means that all facts related to policy implementation were placed on the benefit–cost ratio. All decisions follow the principle of “benefits > costs”. It is worth noting that the definition of “benefit” varies according to the actor. For example, enterprises see profitability as their primary interest, while local governments see political performance as an important interest. Conversely, sufficiently high costs can influence the behavior of actors [
34]. These costs are usually economic losses, poor social image, or criminal offences.
Tyler summarized the mechanics of compliance from a benefit–cost perspective. Further, it can be argued that public opinion, and rewards and penalties are important in choosing whether or not to implement a policy [
35]. For example, it is widely believed that increasing penalties is an effective means of reducing the corresponding violations; negativity and reprimands from relatives, friends, and neighbors may correct the bad behavior of actors; and so on. Therefore, this study analyzed the drivers of FCS policy implementation based on the two main benefit–cost mechanisms: public opinion, and rewards and penalties.
Figure 1 gives an overview of the process.
2.1.1. Drivers of Policy Implementation: Public Opinion
Public opinion (PO) refers to the positive or negative opinion of the public about the social image of an actor.
For the central government, the positive and negative opinions of the individuals and international countries are related to the reputation and image of the country. For local governments, the positive and negative opinions of the people are related to the reputation, image, and even performance of the local government [
36]. For enterprises, the positive opinions of the people are beneficial for building the brand [
37]. Thus, for all three types of subjects, the PO mechanism of policy implementation will produce more consistent pressure and incentives. From the perspective of the drivers of policy implementation, the PO mechanism is effective.
The PO mechanism has two important conditions: temporal continuity and the insignificance of the domain.
Regarding temporal continuity, Cohen argued that the essence of the PO mechanism is the expectation of a discount rate, i.e., evaluating future returns over current returns [
38]. Non-material costs, such as a damaged image, condemnation, etc., cannot be properly assessed when a policy is examined statically. Therefore, policy effects should be assessed from a dynamic, long-term perspective. In addition, the temporal continuity is affected by the speed of the transfer of information between opinion makers, which may lead to a lag in the PO mechanism.
The insignificance of the domain refers to the case when the field covered by the PO mechanism is insignificant. In high-level political domains that are particularly important to the state, such as those faced by major political interests such as sovereignty, security, and domain, the PO mechanism will not be able to have a substantial impact [
39,
40]. The role of the PO mechanism is often greater in fields that are not vital to the state, such as economic trade and environmental protection. On the one hand, in these domains, it is relatively less difficult to assess the benefits and costs, which makes the benefit–cost mechanism work; on the other hand, these domains are closely related to the public and receive more attention.
In summary, these two conditions need to be met when examining effects of the PO mechanism on China’s FCS policy from the perspective of the drivers of policy implementation. As shown in
Table 1, this study met the conditions for the PO mechanism to apply.
2.1.2. Drivers of Policy Implementation: Rewards and Penalties
“Rewards” refer to the benefits that the actor receives for better implementation of the policy, and penalties are the costs incurred for violating the policy’s requirements.
For the central government, the rewards can be an increase in the country’s overall strength, an increase in its international status, etc., while the penalties are the opposite. For local governments, the rewards can be improvements in the local economy [
41,
42], a better living environment [
43], or the promotion of the actors (local officials) [
44]. However, the penalties received by local governments for violating policies are not necessarily reflected in areas such as the economy and the environment, but more in the penalties imposed on local officials for non-compliance. For enterprises, the rewards they receive can be in the form of an improved company image, subsidies, and support, etc. Of course, enterprises that violate a policy’s regulations will receive the corresponding penalties, such as fines and confiscation of illegal income, and the executives may even face criminal penalties. On the whole, the mechanisms of rewards and penalties (RP) are relatively consistent for the three levels of implementers.
The RP mechanism has three important conditions—fairness, appropriateness, and immediacy.
The condition of fairness requires that those who are rewarded or penalized are treated fairly. If rewards are not evenly distributed, actors will weaken this incentive. If punishments are not evenly applied, the actors will engage in rent-seeking activities and weaken compliance with the rules of the policy.
Appropriateness refers to the ability of the reward to cover the losses and the ability of the penalties to outweigh the benefits of violating the policy. If an implementer finds that the benefits of violating the policy outweigh the benefits of complying with it, then breaking the law is the appropriate choice for a self-interested rational agent. Similarly, a self-interested rational agent will be happy to implement a policy if she/he finds that the benefits of doing so cover the costs.
Immediacy refers to the ability to give rewards and penalties as early as possible. Immediacy increases the efficiency with which violations can be corrected. As the negative impact of policy violations may increase over time, they need to be corrected in a timely manner. Similarly, the positive impact of implementing a policy may diminish over time, so timely incentives are needed.
In summary, these three conditions need to be met when examining China’s FCS policy through the RP mechanism from the perspective of the drivers of policy implementation. As shown in
Table 2, this study met the conditions of the RP mechanism.
2.2. Method for Downscaling the Indicators: Entropy Method
As LUE usually comprises several indicators, it needs to be downscaled to a single indicator. A number of methods have been used in the existing literature to achieve this, e.g., the stochastic frontier production function model [
45], locational entropy [
46], data envelopment analysis (DEA) [
47], the super efficiency slack-based measure (SBM) model [
48], and the entropy method [
16]. All of these methods are excellent, and researchers choose them mainly according to the characteristics and needs of the study.
This study measured the level of LUE using several indicators from different dimensions and did not emphasize the “input–output” function, so it was not suitable for the usual DEA and SBM methods. Meanwhile, the complexity of the indicators also precluded the use of production function models and location entropy methods. Furthermore, this study aimed to highlight the changes in the samples over time. For these reasons, this study proposed to use the entropy method to downscale the indicators. The entropy method is based on the value of entropy (the degree of difference) between the variables, and, therefore, it was possible to assign weights to the sub-indicators in an objective way. The distribution of weights could, therefore, indirectly reflect the importance (the relative magnitude of change) of the corresponding indicators. The following briefly describes this computational process, which was carried out in this study using the MATLAB R2021a (9.10.0.1739362) software.
Equations (1) and (2) are a normalization process. Through them, we could make the sub-indicators in the LUE indicator evaluation system dimensionless. Equation (1) deals with the positive indicators while Equation (2) deals with the negative indicators. Here,
i,
t, and
m represent the region, year, and sub-indicators of LUE, respectively. The
Nom_LUE represents the standardized LUE.
Equations (3) and (4) are used to calculate the information entropy (
It,m). The information entropy reflects the degree of the difference between the sub-indicators in a given period and in different regions.
Equation (5) calculates the weights of the sub-indicators (
Wt,m), where
Total is the total number of LUE sub-indicators.
2.3. Difference-in-Difference Estimation Model
An econometric model consists of one or more stochastic equations that allow economists to use mathematical models to simplify real-world scenarios in order to study their economic characteristics and patterns. The difference-in-difference (DID) estimation model is widely used in economics to identify the impact of shock events [
49]. As a result, the DID model is considered to better assess the causal relationships between variables. Equation (6) is the basic form of the DID model used in this study. In this study, the model was run using the Stata15.1 SE-64 (Revision 06 Jun 2018) software.
where
i is the city,
t is the year (2006 ≤
t ≤ 2019), and
τ is the initial year of the FCS policy shock.
LUEi,t is the dependent variable, which reflects the score of land use efficiency.
Treati ×
Postτ is an independent variable reflecting whether or not a region was affected by the FCS policy in a given period (Equation (7)). The coefficient
β was our focus, and the value of
β reflects the extent to which the FCS policy affected the LUE, and the significance of
β reflects the level of confidence in the effect of the FCS policy on the LUE.
Conti,t represents the control variable, and
Cons represents a constant;
μi is the variable of individual fixed effects, and
εi,t is the error term.
The model did not incorporate the variable of time-fixed effects, which reflects the trend of changes over time only. In reality, improving the LUE often faces problems of path dependency [
50]. Therefore, this study concluded that there was no obvious time-related change trend in Equation (6) with LUE as the dependent variable.
2.4. Variables
2.4.1. Dependent Variable: The Land Use Efficiency Evaluation System
The dependent variable of this study was land use efficiency (LUE), which is a wide-ranging indicator. Scholars have constructed relatively unique systems for evaluating the indicator of LUE according to their own research needs. On the one hand, the research object of this study was FCS policy, and the construction of the system for evaluating the indicator of LUE was biased towards the environment and the economy, and related to FCS policy; on the other hand, this study was based on the benefit–cost theory, and the sub-indicators of LUE were mainly the indicators of “relative value” that can reflect the relationship between benefits and costs. Referring to the existing literature, the evaluation system for the LUE indicators constructed in this study is shown in
Table 3. Moreover, this study used the entropy method to assign weights to each sub-indicator.
The FPE indicator reflects the economic production capacity of forestry resources. Under the influence of an FCS policy, many forestry carbon sink projects have been completed. One of the products of forestry carbon sink projects is carbon sinks. The project’s owner can sell the carbon sinks through the national carbon emission trading market to make a profit, thus improving the LUE from the economic level.
The NIVAR indicator reflects the profitability of enterprises other than industry. The FCS policy indirectly requires companies to adjust their business strategies to reduce carbon emissions through production cuts or through technological innovations. Irrespective of the choice, the FCS policy will have some impact on the industrial output in the short to medium term. During this period, capital will flow into other industries, increasing their share of GDP. At the same time, the development of these industries will be conducive to sustainable land use, so the improvement in this indicator reflects the improvement in LUE from the economic level.
The EEIP indicator reflects the efficiency of energy use by industrial enterprises in the region. As an indirect effect of the FCS policy, industrial companies are required to include carbon emissions in their production costs. If a company exceeds the carbon emission limit, it must purchase carbon sinks to offset the excess or pay a hefty fine. In this situation, firms may increase their production efficiency (focusing on the marginal returns of their products); some inefficient firms may also simply reduce or cease production and make a profit by selling the carbon credits allocated to them. All of these situations will result in companies reducing their energy consumption and increasing their economic return per unit of energy consumed. An increase in this indicator therefore reflects an increase in LUE at an economic level.
The CEPC indicator reflects the level of pollution emissions in the region. As previously mentioned, reductions in production, shutdowns, or improvements in the efficiency of the output of the relevant businesses will lead to a reduction in pollution emissions. Reducing CO2 emissions is the main objective of the FCS policy. Considering that CO2 emissions are related to the population of the region and other factors, this study considered reductions in per capita CO2 emissions to be the result of the FCS policies to improve LUE at the environmental level.
The FLC indicator reflects the proportion of forests, including carbon sink forests, to the total area of the region. The FCS policy directly encourages enterprises to implement forestry carbon sink projects. With the completion of a large number of forestry carbon sink projects, the existing forest resources in the relevant regions have been protected and, at the same time, rich carbon sink forest resources have been added. These carbon sinks not only improve the environmental quality of the region and help to achieve “carbon neutrality”, but also contribute to the development of the local economy and play a role in alleviating poverty. Therefore, an increase in this indicator reflects an increase in LUE at the environmental level.
2.4.2. Independent Variables
This study examined the impact of FCS policies on LUE from the perspective of the drivers of policy implementation. On the basis of the analysis in
Section 2.1, this study intended to discuss the mechanisms of PO and RP. Therefore, the value of these mechanisms (PO and RP) needs to be reflected by the independent variables (
Treati ×
Postτ) in the DID model. As described in
Section 2.3,
Treati captures whether region
i has been affected by the FCS policy, while
Postτ captures whether a shock from the FCS policy has been generated in year
τ. Referring to the study of Liu and He [
25], we took 2014 as the starting year when the FCS policy generated a shock, i.e.,
τ = 2014. In this study, we designed the independent variables to reflect the mechanisms of PO and RP as follows.
With regard to PO, the “informedness” of an opinion maker and the speed of transmitting information influence the PO mechanism. The former determines the formation of public opinion and its correctness (whether society’s judgement of the event is correct or not); the latter determines the speed and extent of the creation of public opinion. Existing studies have usually used questionnaires to examine the attitudes of a sample group towards an event, but there has not yet been a suitable indicator that can reflect the abovementioned elements. We used China’s City Commercial Credit Environment Index (
CEI) to indirectly reflect the level of public opinion in a region, which is composed of 7 first-level indicators, 23 second-level indicators, and 42 third-level indicators regarding credit investment, enterprise credit management, credit collection system, credit violation, integrity education, and business sentiment, to comprehensively evaluate the credit environment of a city [
53]. The city’s credit environment was comprehensively evaluated, considering that entrepreneurship reflects, to a certain extent, the level of social responsibility in a region [
54] and the willingness to implement policies [
55]. For these reasons, this study argued that the
CEI is a qualified measure of the PO mechanism in a region, and that the higher the
CEI, the greater the influence of public opinion. As the independent variable (
Treati ×
Postτ) consists of two dummy variables, it was also necessary to convert the
CEI indicator into a “0–1” indicator. As the values of the
CEI indicator are more evenly distributed, this study divided it into three equal parts and selected the group with the highest value as the “treatment group” (
PO_Treati). Specifically, according to the average value of the
CEI in the two years before and after the event (2012–2016), the top third of the regions (10 regions) were assigned “
PO_Treati = 1” and the remaining regions were assigned to “
PO_Treati = 0”. In this way, an independent variable (
PO_Treati ×
Postτ) reflecting the PO mechanism was obtained.
With regard to RP, the fairness, appropriateness, and immediacy of the imposition of rewards and penalties affect the RP mechanism. If fairness and immediacy cannot be ensured, the implementer may not actively cooperate with the policy and this situation may even create room for rent-seeking. If appropriateness cannot be ensured, the behavior of the implementer cannot be changed effectively. At present, there is no suitable indicator that can reflect these factors well. Therefore, we used the indicator of “governmental target of reducing environmental emissions” (Target) to indirectly reflect the degree of rewards and penalties in a region. Since the Target indicator can reflect the importance of the government in environmental governance decisions, and the government is the one who implements the rewards and penalties of the FCS policy, we believe that Target can qualitatively reflect the RP mechanism in a region, i.e., the greater the value of Target, the stronger the level of RP. In a province, if the local government of each prefecture-level city sets a specific emission reduction target in the same year, the value of Target is increased by one. To transform the Target indicator into a “0–1” dummy variable (RP_Treati), we also divided the value of the Target indicator into three equal parts and selected the group of regions with the highest value as the “treatment group” (RP_Treati). The specific treatment procedure was the same as for CEI. In this way, we obtained an independent variable (RP_Treati × Postτ) which reflected the RP mechanism.
Table 4 shows the regions of the treatment group that were screened according to the above procedure. The columns “PO” and “RP” indicate the screening according to the RP and RP mechanisms, respectively. The “√” indicates that the region is a treatment region, while the “×” indicates that the region is a control region.
2.4.3. Control Variable
This study used several sub-indicators to construct the system of evaluating the indicators of LUE. Although the sub-indicators of LUE were processed by reducing the dimensionality, they still maintain the original characteristics of these data. In order to prevent too many variables from generating multicollinearity, this study only checked for disturbances from abroad. Foreign direct investment (FDI) not only affects the pollution emissions of the host country [
56], but may also bring in advanced technology [
57], which can help the invested enterprises to improve productivity and achieve their goals of saving energy and reducing emissions. For this reason, we adopted the logarithmic form of foreign direct investment (ln
FDI) as the control variable.
2.4.4. Data Sources
Due to limited data availability, 30 provincial-level regions (22 provinces, 4 municipalities directly under the central government, and 4 autonomous regions) were used for the study (
Figure 2). In December 2006, the State Council issued the “Decision on Implementing the Scientific Outlook on Development and Further Strengthening Environmental Protection”, which explicitly states that the performance of cadres in environmental management should be the basis for their appointment and selection, as well as for rewards and punishments. Since then, China’s emphasis on sustainable development has increased dramatically. As a result, the sample period for this study was from 2006 to 2019.
The data on carbon emissions were at the prefecture level and were aggregated to the provincial level in this study. The
CEI data for constructing the
PO_Treati variable were taken from
Bluebook on China City Commercial Credit Environment Index, and the
Target data for constructing the
RP_Treati variable were taken from the working reports of each local government. All three types of data were collated from PPMAN Data (
http://www.ppmandata.cn/, accessed on 12 June 2023). The rest of the data were from the
China Statistical Yearbook (2007–2020) and the
China Energy Statistical Yearbook (2007–2020), which are statistically collated by CNKI (
https://data.cnki.net/, accessed on 12 June 2023). Some missing data were supplemented by interpolation.
Table 5 reports the descriptive statistics of the relevant data. It is worth mentioning that, although the value of FPE is large, the entropy method has made it dimensionless (Equations (1) and (2)).
3. Results
3.1. Weights of the Land Use Efficiency Evaluation System
With the entropy method, it was possible to obtain the distribution of the weights of the LUE sub-indicators in each year during 2006–2019, as shown in
Table A1.
The FPE indicator had a decreasing weighting trend with a maximum value of 68.28% and a minimum value of 25.51%. This shows that the FPE indicator had the most drastic change compared to the other four sub-indicators, but it decreased year by year. This reflects the economic significance of how the gaps in forest production efficiency among Chinese provinces, municipalities, and autonomous regions is decreasing year by year.
The weight of the NIVAR indicator showed an overall increasing trend, with the highest value of NIVAR being 23.13% and the lowest value being 6.74%. This indicates that the magnitude of change in NIVAR has increased over the years compared to the other indicators. This reflects the economic importance of the relative stability of the structure of industrial production in the provinces, municipalities, and autonomous communities during the period 2006–2019.
The weight of the EEIP indicator showed a trend of first increasing and then decreasing, but a generally increasing trend overall. The lowest value of EEIP was only 6.77%, but the highest value reached 27.48%. This shows that the rate of change of the EEIP increased from year to year compared to other indicators. The economic significance of this is that the gap in energy use efficiency between industrial enterprises in different regions of China has tended to widen and then narrow.
The change trend of the weight of CEPC was similar to that of NIVAR, with a maximum of 22.47% and a minimum of 7.61%. This indicates that the CEPC indicator changed little between 2006 and 2019. This reflects the economic significance of the fact that the level of carbon emissions per capita is more consistent across China’s regions.
The weight of the FLC indicator tended to be stable overall, but there was a sudden increase between 2014 and 2016: the highest value of the weight of FLC was 22.47%, and the lowest value was only 7.61%. This was due to the increase in forestry carbon sink projects during the implementation of the FCS policy, which led to a significant increase in the amount of forestry land in some of these regions that were suitable for forestry carbon sink projects between 2014 and 2016. This phenomenon is in line with the previous analysis.
3.2. Baseline Regression Results of the DID Model
Table 6 reports the results of the baseline regression. In particular, Column (1) verifies the effect of the FCS policy on LUE under the PO mechanism, and Column (2) verifies the effect of the FCS policy on LUE under the RP mechanism.
In Column (1) of
Table 6, the coefficient of PO is 0.0075 and it passed the significance test at the 5% significance level, indicating that, under the PO mechanism, the implementation of the FCS policy had a significant positive impact on the improvement in LUE, i.e., the stronger the public opinion, the stronger the promotion of LUE by the FCS policy.
In Column (2) of
Table 6, the coefficient of RP is 0.0056 and it passed the significance test at the 10% significance level, indicating that, under the RP mechanism, the implementation of the FCS policy had a significant positive impact on the improvement in LUE, i.e., the stronger the government’s emphasis on rewards and penalties, the stronger the promotion of LUE by the FCS policy.
3.3. Robustness Test: Parallel Trend Assumption Test of the DID Model
The parallel trend assumption test is important to ensure the validity of the results of DID. This study used event analysis to construct a parallel trend test. Assuming that the treatment group (
Treati = 1) and the control group (
Treati = 0) were comparable and consistent before the shock event, we included the interaction term between the dummy variable (
Dummy) and the treatment variable (
Treat) for each period. If the interaction term is insignificant before the shock event, it indicates a clear parallel trend. Equation (8) reflects this.
The parallel trend assumption test of Equation (8) was executed using the Stata15 SE-64 software and transformed into
Figure 3a,b, which show the results for the PO mechanism and RP mechanism, respectively, and the significance of
β in Equation (8). It was found that
β was not significant in either mechanism before 2014, while it was significant overall in 2014 and afterwards. This indicates that the results of the regression passed the parallel trend test, i.e., the results of the baseline regression in
Table 6 are valid.
In addition, it can be noted that the β of both was insignificant in 2014, but there was a significant improvement. This suggests that the effect of the FCS policy was lagged and that the lag of the PO mechanism was stronger than that of the RP mechanism, which is consistent with the previous analysis. The highly consistent β values up to 2014 are also consistent with the previous speculation that LUE is stable over time and has a path-dependency problem. It can also be seen that, from 2019 onwards, the effect of the PO mechanism increased from year to year, while the effect of the RP mechanism decreased from year to year.
3.4. Spatio–Temporal Characteristic of Land Use Efficiency
According to the analysis in
Section 3.3, we concluded that the LUE at the provincial level changed significantly before and after the implementation of the FCS policy. However, this conclusion only indicates that, within the overall sample (30 provincial districts), the LUE has changed significantly. It does not indicate which regions experienced significant changes and which did not. To answer these questions, we mapped the spatio–temporal evolution of LUE using the ArcMap 10.2 software. In this study, taking the starting point of the implementation of the policy (2014) as the node, the average value of LUE from 2006 to 2013 was used to reflect the overall distribution patterns of LUE before the implementation of the FCS policy (
Figure 4a); similarly, the average value of LUE from 2014 to 2019 was used to reflect the overall distribution patterns of LUE after the implementation of the FCS policy (
Figure 4b).
Figure 4a shows the spatial distribution of the mean LUE before the implementation of the FCS policy. It can be seen that the LUE showed clear spatial clustering from the southeast to the northwest, and from high to low. The top 10 regions are mainly distributed along the southeast coast, while the regions ranking in the middle (11–20) are mainly distributed in central China.
Figure 4b shows the spatial distribution of the LUE after the implementation of the FCS policy. It can be seen that the LUE still showed obvious spatial clustering, but the characteristics of its distribution changed significantly compared with the previous period. The change is manifested in the fact that the agglomeration of the top 10 regions on the southeast coast was broken and that the LUE in provinces such as Yunnan and Hunan increased significantly. In the new distribution pattern, the boundary between the top 10 regions and the middle-ranking regions was broken, but the distribution pattern of the bottom 10 regions remained unchanged. It can be seen that the FCS policy changed the spatial distribution patterns of LUE. It mainly affected the eastern and central regions, but had a weaker effect on the northwestern region.
Table 7 also shows the changes in ranking. Under the influence of FCSs, the rankings of 10 regions in terms of the average LUE increased; 12 regions decreased; and the rankings of the remaining eight regions remained unchanged. From
Table 7, it can be seen that the number of regions whose ranking increased was almost the same in the eastern, central, and western regions, but the western region had the highest number of unchanged regions (6, 75%). It can be concluded that (1) the northwest region may not have been affected by the FCS policy, but the southwest region was significantly affected by the FCS policy, which may be related to the environment in which the forestry carbon sink projects were implemented.
4. Discussion
The results of this study clearly show that China’s FCS policy can improve LUE through PO and RP mechanisms, and that there are lags and spatial clustering of such effects. It differs from existing studies that focus on the industry level (agriculture [
58], tourism [
59], etc.), the environmental level [
48], and the policy level [
16,
60,
61]. This study fills the gap in this branch of literature by mainly validating the mechanisms by which FCSs affect LUE (“public opinion (PO)” and “rewards and penalties (RP)”). In terms of findings:
Firstly, this study found that FCSs significantly improved the LUE level of the treatment regions through the PO and RP mechanisms, and, furthermore, FCSs contributed to the improvement of economic output efficiency, the reduction of carbon pollution, and the promotion of green building. This has some similarities with the findings of Liu and He [
25]. They found that the FCS was able to increase the total output value of forestry as well as the forest area. However, their study only considered the changes of a single indicator, neglecting the fact that comprehensive indicators may better reflect the real situation of LUE. In addition, this paper does not only consider the economic output (total forestry output value), but also puts more emphasis on the efficiency of the economic output, i.e., the improvement of energy use and industrial structure through FCSs. The study by Kallio et al. on EU countries shows that the implementation of FCS policies leads to an increase in market demand for forest products, but then the policy constraints lead to a decrease in related investments (limited resources), which further reduces the number of forest workers. This situation also led to higher prices for forest products in the context of supply and demand. Unlike the EU countries, China’s FCS policy has significantly increased the per capita forestry output, which suggests that forestry-related investments (forestry carbon sink projects) have significantly increased, which also implies that forestry staff, especially those related to forestry carbon sinks, will be provided with more employment opportunities. At the same time, the supply of forestry products will also increase with the increase of forestry carbon sink projects, which will stabilize or even reduce the price of forestry products. From this level, the benefits gained from the implementation of the FCS policy in China are significantly higher than those in EU countries. This may be due to China’s large land area and the large area available for tree planting, as well as the fact that the FCS policies of the two sides are different. In addition, Tang et al. studied the sister policy of FCS—CETS, and they found that the policy suppressed economic output in the pilot areas and reduced the level of LUE at the economic level [
16]. However, this finding does not contradict our study. In fact, the FCS policy raises forestry output while, at the same time, lowering industrial output (a change in industrial structure). The difference is that their study only examined six pilot regions (Beijing, Tianjin, Shanghai, Chongqing, Hubei, and Guangdong), whereas this paper not only includes almost all of these pilot regions, but also finds that more regions are affected by the policy under the PO and RP mechanisms.
Secondly, this study finds that there is a time lag when a FCS improves the LUE through the PO and RP mechanisms; Liu and He’s study not only fails to point out that there is a time lag in the FCS policy, but even finds that the policy takes effect earlier than expected [
25], while Tang et al.’s study points out that the policy takes effect in the year of implementation [
16]. However, in this study, the time lag for the FCS policy to take effect was two years under the PO mechanism, while the time lag for the FCS policy to take effect was one year under the RP mechanism. This is partly due to the natural lag between the PO and RP mechanisms and partly due to the fact that this study has a larger number of pilot districts, and some districts are slower to respond.
Finally, the spatial agglomeration characteristics of LUE have changed slightly under the influence of the policy—the overall trend of “southeast → northwest, high → low” remains unchanged, but the high-SLU regions have shifted towards the central regions. This is quite different from existing studies, which more often find that the high LUE regions are clustered at the “urban agglomeration” level, such as the Chengdu–Chongqing urban agglomeration. This is a reflection of the spillover effect (spatial neighborhoods promoting each other), but this phenomenon is not evident in this paper. It is hypothesized that this is due to the fact that this paper examines the PO and RP mechanisms, whereas the efficiency of information transfer through current online media far outweighs the impact of ‘spatial proximity’ on information transfer. As a result, this study identifies more areas that have previously been overlooked as being affected by FCS policies.
The main shortcomings of this study are the following:
Data were missing at the level of prefecture-level cities, which prevented the study from being detailed down to the level of prefecture-level cities. Local governments’ decisions are made at the level of prefecture-level cities, and changes in CO
2 are more obvious at the city level [
62]. Therefore, more useful information will be obtained if the study can be conducted at the level of prefecture-level cities.
Existing studies have not yet designed indicators that can better reflect the OP and RP mechanisms, and the indicators in this study could only reflect them somewhat indirectly.
Based on this study, future works that could be conducted include the following:
If the data of prefecture-level cities can be added, prefecture-level research can be conducted to compensate for the limitations of this study. At the same time, since an urban agglomeration is a basic unit of policy interventions and enterprises’ production, a more detailed discussion of the conclusions of this study will certainly lead to more interesting conclusions if a specific urban agglomeration is used as the study’s object.
Similar studies on FCS policies could be conducted in other types of countries (e.g., developed countries), and then the results could be compared with this study in order to draw conclusions on similar policies in developed and developing countries. This will enrich research in the field and better guide the implementation of FCS policies in countries with different levels of development.
5. Conclusions
In pursuit of carbon neutrality and to address the problem of land use inefficiency, China has developed the FCS policy. This study discusses the mechanism by which FCS affects LUE from the perspective of policy-implementation drivers. Taking the benefit–cost theory as the theoretical basis and using the DID model, this paper examines the above issues with a sample of 30 provincial-level regions in China from 2006 to 2019. It was found, firstly, that the FCS policy can improve LUE through the PO and RP mechanisms, and that the PO mechanism is more effective. This reflects the importance of public opinion in the effective implementation of the FCS policy. Secondly, there is a lag in the effect of the FCS policy on LUE, and the lag of the PO mechanism was greater than that of the RP mechanism. Thirdly, the LUE indicator based on economic and environmental dimensions showed that the change in China’s LUE was smaller when it was not affected by the shock of the FCS policy. This may be due to path dependency.
To better harness the impact of the FCS policy, this study makes the following recommendations:
Promote forestry carbon sink projects: In terms of economic and environmental dimensions, the FCS policy has been effective in improving LUE, but the existing scale of carbon sink forests in China, as well as the scope of radiation, still needs to be adjusted. Local governments can encourage forestry carbon sink projects in regions with natural endowments by increasing subsidies and reducing or exempting taxes, but there is no need to further increase support for regions without natural endowments.
Improve the mechanisms of constructing and regulating forestry carbon sink policies: This study found that the effect of the FCS policy had a lag of 1–2 years because the construction of forestry carbon sink projects and accounting for carbon sinks take more time. The government can encourage regions to take the initiative to report the natural endowment for constructing local carbon sink forests by building a carbon sink forest resource base so that forestry carbon sink investors can efficiently search for projects to target. At the same time, improving and simplifying the mechanism of accounting for carbon sinks will also help speed up the completion of forestry carbon sink projects and reduce time costs.
Strengthen the driving force of the policy’s implementation: Public opinion can help to better harness the impact of the FCS policy. It can raise people’s awareness of the importance of forest carbon sinks and facilitate their access to information on forest carbon sink projects. Rewards and penalties can help one to make better use of the effect of the FCS policy through education, training, and other means to increase local officials’ awareness and understanding of forestry carbon sinks, green development, and other issues. At the same time, it is important to maintain the impact of “green building” on political performance and to prevent the construction of carbon sink forests in regions that are not suitable for such developments.


