Abstract
The portfolio model provides a new framework that enables farmers to make tradeoffs between the returns and risks of agricultural production. However, it has only been used in cost allocation among resources and in farmland allocation among crops at present. Thus, we conducted a portfolio model analysis based on an independent, mixed cross-section of data accounting for 1650 rural households in Minqin county, China, over a timescale of three years; the goal was to explore the feasibility and actuating extent of the portfolio model in optimizing the allocation of agricultural resources among crops other than farmland. The results showed that, by optimizing resource allocation among crops using a portfolio model, the return per unit resource of farmland, water, and labor increased by CNY 4.03 thousand per hectare, CNY 0.38 per cubic meter, and CNY 39.75 per day, without increasing risk, and with corresponding increases in use efficiency of 14.64%, 9.25%, and 13.55%, respectively, in the study area. Therefore, the portfolio model is a good tool for agricultural resource allocation optimization. Policy makers can manage agricultural resources according to their risk preference using this model. This study provides new insights into agricultural resource allocation and critical empirical evidence for return and risk management, as well as resource use efficiency improvement in agricultural production.
1. Introduction
With the rapid expansion of the global population and the increase in food consumption, the shortage of agricultural resources, including farmland, water, and labor, becomes more and more severe. Limited agricultural resources restrict the capacity of grain production [1]. The limitation and non-renewability of farmland and agricultural water resources make them critical constraints in food production [2]. Improper use of farmland has been intensifying the conflicts between continuously increasing food demand and decreasing availability of farmland [3,4,5]. Additionally, agriculture, as one of the most water-intensive human activities [6], is facing big challenges, such as water resource shortages [7], unbalanced freshwater distribution [8], and discrepancies between supply and demand [9]. In addition, the transformation of labor from labor-intensive industries to capital-intensive industries caused a big shortage in agricultural production [10,11,12]. With economic growth and acceleration of the urbanization process, labor shortage has become one of the critical constraints for sustainable agricultural development, particularly in developing countries [13,14]. The question of how to produce more food with limited agricultural resources and develop sustainable agriculture is one of the most important global issues at present.
The formulation of a sustainable agricultural management strategy is critical in improving the use efficiency of agricultural resources [15,16]. To improve the use efficiency of agricultural resources, many countries have formulated relevant policies. Farmland transfer and consolidation has been strongly encouraged in northern Ethiopia, Europe, Kenya, and China [17,18,19,20]. To enhance water resource use efficiency, some advanced irrigation technologies such as drip and micro-irrigation have been advocated for [21]. Subsidies and technical support approaches have been supplied by the governments of India, Australia, and China [22,23]. Large-scale farming, mechanized production, and advanced agricultural resource management practices have been encouraged by various policies; these include agricultural machinery subsidies and large-scale planting subsidies, which reduce agricultural labor costs [24]. These policies have made a substantial contribution to the effective use of agricultural resources and agricultural sustainability.
In order to study the use efficiency improvement of agricultural resources, scholars have focused on resource allocation from many aspects. Mathematical programming models comprise the most popular methods of optimizing farmland allocation and improving land use efficiency [25,26]. An inexact fuzzy semi-infinite programming model has been proposed for optimizing the planting structure of the Shiyang river basin [27]. Some models for optimal water resource management have been built [28]. A study in northwest China found that, when water use efficiency is increased or an ideal value is achieved, households’ net profit improved significantly [29]. Additionally, some other studies focused on improving labor use efficiency. Balezentis proposed a framework built around the structure of agricultural labor productivity, land intensiveness, and land productivity to analyze the changes in agricultural labor productivity [30]. Ge found that there were multiple coupling relationships between grain yield and agricultural labor change in the process of agricultural development and transformation in China [31]. The above studies provide important references for improving the use efficiency of farmland, water, and labor through resource allocation.
Unfortunately, previous studies have mainly focused on agricultural resource allocation among different areas or households, with the resource allocation among different crops receiving little attention. Some studies have focused on the optimized allocation of total costs among different agricultural resource inputs (land, labor, fertilizer, etc.) based on the relationship between resource input risks and output in agricultural production [32,33]. Several scholars have studied farmland allocation among crops [25,26]. Thus, portfolio model analysis provides new insights to optimize agricultural resources allocation among crops, not only the optimal allocation of cost among agricultural resources. However, this model has only been used in optimizing resource allocation among crops on farmland [34,35,36], with the allocation of other agricultural resources among crops receiving little attention. Thus, problems of using the portfolio model to optimize the allocation of other agricultural resources, such as water and labor, among different crops, need to be explored.
Therefore, in this study, we aimed to answer the following questions: (1) Is it feasible to use the portfolio model to allocate agricultural resources among crops other than farmland (for example, water and labor)? (2) To what extent could the use efficiency of agricultural resources be improved through the use of the portfolio model? Results of this study should provide new insights into agricultural resource allocation among crops, not only for farmland, but also for other agricultural resources. They may also provide references for local policy makers and farmers on agricultural resources and risk management, as well as improvement of resource use efficiency in arid and semi-arid areas, particularly those facing severe water shortage.
The rest of this article is organized as follows: Section 2 presents an introduction to the study area and data. Section 3 presents a description of the theoretical framework and econometric model used. Section 4 presents our empirical results. Section 5 presents the discussion. In the last section, we present our conclusions.
2. Data
2.1. The Study Area
Minqin county, China was selected as the study area since it is a typical example of an arid–semi-arid agricultural area with serious shortages in farmland and water, while having a critical ecological status (Figure 1). Minqin county is located in the lower reaches of the Shiyang river in northwestern China. It is a line of defense between the Badain Jaran Desert and the Tengger Desert [37,38], which makes it an arid and semi-arid region, and it possesses a vital ecological strategic status in China. The economic development of Minqin county mainly depends on agricultural production, but farmland and water resources are scarce. Its local irrigation water mainly comes from the Shiyang river. In recent years, the runoff of the Shiyang river has decreased significantly, and its irrigation capacity has been exhausted [39]. With the increase in water consumption in agricultural production, the contradiction between planting structure and limited water resources needs to be adjusted [8]. Water crises and the weak drought environment have destroyed the oasis ecosystem. As a result, people living in the oasis need to ensure careful management of land and water resources. Otherwise, poor management could easily lead to land and water degradation [40]. Therefore, the rational utilization of agricultural resources in Minqin, especially the water resources, is critical to both agricultural development and ecological sustainability across the whole of China [41]. The issue of developing sustainable agricultural practices through improvements in agricultural resource efficiency is a big challenge faced by local policy makers. Thus, studies on the efficient utilization of agricultural resources in Minqin have great ecological significance.
Figure 1.
The study area and sample distribution. Note: The base is map sourced from the Resource and Environment Science and Data Center of Chinese Academy of Sciences.
2.2. The Survey
The survey was conducted across three years, from 2021 to 2023, and focused on five irrigation areas, as divided by the local Minqin government: Huanhe, Changning, Ba, Quanshan, and Hu (Figure 1). These irrigation areas primarily depend on agricultural production, excluding the towns named Hongshagang and Nanhu, due to their small planting areas. The 2021 survey was based on stratified random sampling in only three of the irrigation areas; the 2022 and 2023 surveys were based on stratified random sampling in all five irrigation areas. In total, 16 sample towns were randomly selected from the five irrigation areas (Figure 1). I each sample town, 1–2 sample villages were selected, and about 25 sample households were selected in each sample village. College teachers and students carried out the survey after three training sessions on the questionnaires. The survey was conducted using face-to-face interviews with the heads of the randomly selected households. The basic situations of the families and their agricultural production, including information about agricultural resource use, were investigated. There were 150, 733, and 767 sample households in 2021, 2022, and 2023, respectively (Table 1). There were 303, 268, 424, 341, and 314 sample households in the Huanhe, Changning, Ba, Quanshan, and Hu irrigation areas, respectively (Table 1). In total, 1650 valid questionnaire responses were obtained.

Table 1.
Distribution of observations.
The main crops in the study area are grains, oil crops, and fruits, due to planting history and climatic and soil conditions (Table 2). The top four crops with the largest planting areas are maize, sunflower, wheat, and melon, covering 1474.29, 202.90, 174.11, and 160.10 hectares, respectively. They accounted for 62.38%, 8.58%, 7.37%, and 6.77% of the total planting area in the survey, respectively. There were 1307, 197, 578, and 162 households planting maize, sunflower, wheat, and melon, respectively, with ratios of 79.21%, 11.94%, 35.03%, and 9.82%, respectively. These data indicate that grain crops were dominant in Minqin; still, more than a third of farmland was planted with cash crops. Hence, cash crops, including oil crops and melon crops, have an important status in Minqin’s agriculture.
Table 2.
Planting area and household number of main crops.
Apart from farmland, the biggest restrictive factor for agricultural production in Minqin is water. As an extreme water shortage area, Minqin has a strict water quota system. The water quotas per unit area were only 5325, 4875, 6000, 6225, and 6795 cubic meter per hectare for the Huanhe, Changning, Ba, Quanshan, and Hu irrigation areas, respectively, in 2023 [42]. It is interesting to note that areas with a higher water quotas tend to plant more cash crops. This may be reflective of the high irrigation water demand of cash crops, especially melons of all kinds.
3. Theoretical Framework and Econometric Model
3.1. Resource Allocation Theory
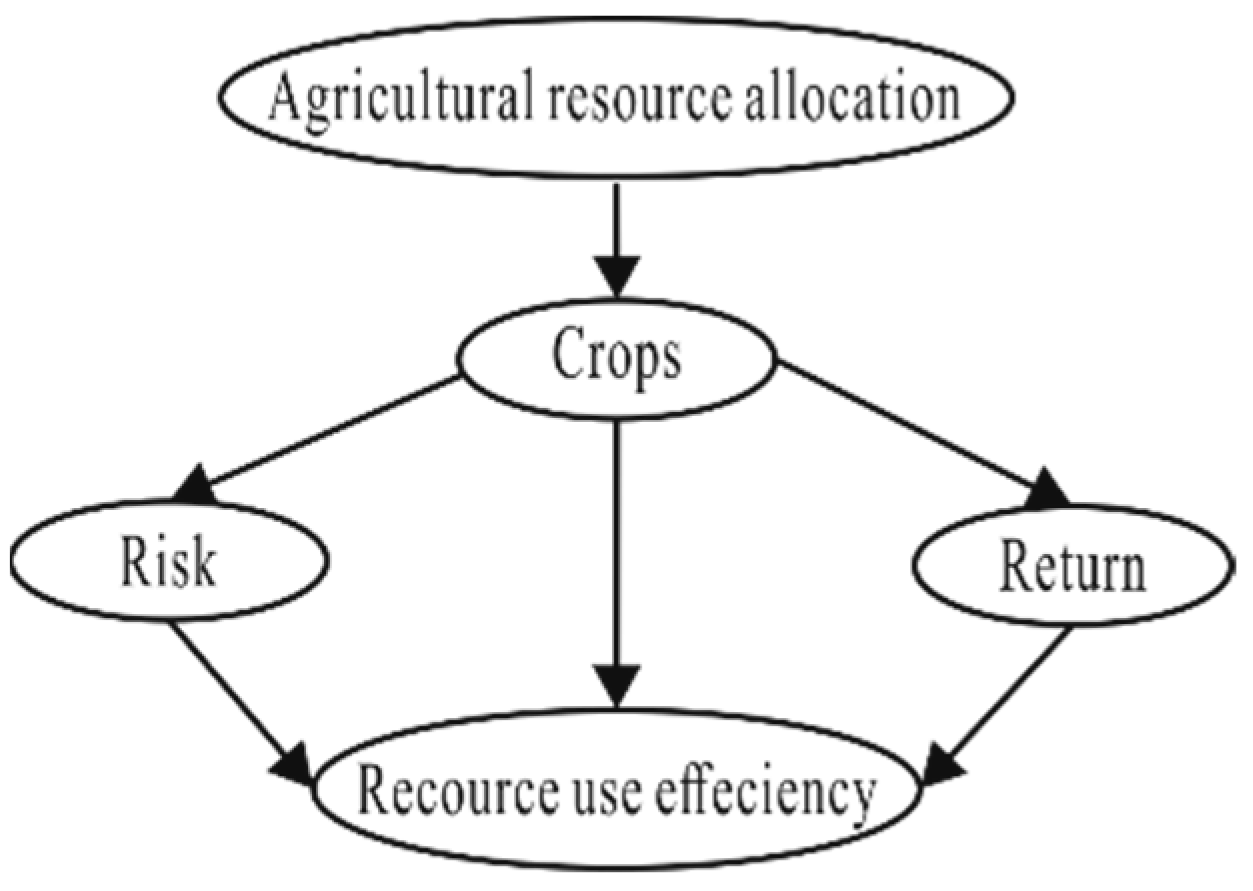
The portfolio model was initially employed for investors to choose among asset portfolios for those with maximized return or minimized risk when selecting assets in the financial market. Theoretically speaking, the problem of farmers choosing the optimal resource input portfolio among crops for a given amount of agricultural resource can also be considered as a special case of investors choosing financial assets. Some studies have applied the portfolio model to optimize the allocation of farmland among crops [34,35,36]. Lence used a standard portfolio model with additional land constraints to solve the land resource allocation problem [43]. Nalley used the portfolio theory for wheat variety selection to minimize risk at the historical yield levels [44]. In agricultural production, the allocation of a limited agricultural resource is essentially similar to the investment behavior of investors in the financial market. According to the resource allocation theory, the use efficiency of agricultural resources can be improved by resource reallocation among different crops, which will change the risk and return of agricultural production (Figure 2). Thus, optimal resource allocation among different crops should exist. We hypothesize that agricultural resources allocation optimization among crops should have larger improvement potential in resource use efficiency (Figure 2).

Figure 2.
Relationship between resource allocation and use efficiency.
3.2. Portfolio Model
In this study, the portfolio model was applied to optimize the allocation of the main agricultural resources, namely farmland, water, and labor. This model enables stakeholders to make tradeoffs between return and risk among different investment mixes, where the risk is estimated by the variance of return [45]. The greater the variance, the greater the variability of risk, and the greater the investment return.
Agricultural resource allocation across different crops can be considered as a process of choosing an investment mix for investors. The portfolio model has been used in crop mix choice [34,35,36]; thus, it can be seen as an appropriate model for allocating agricultural resources.
Assuming that a rural household grows n kinds of crops, the net return from farming can be calculated as:
where R is the average net return per unit resource of farming for this household; all returns in this study are net returns; xi is the proportion of an agricultural resource (farmland, water, or labor) invested in crop, i; ri is the net return per unit resource of crop, i; i = 1, 2…n.
Then, the investment risk is:
where V is the investment risk measured by variance, and without unit; xi is the proportion of an agricultural resource invested in crop i; xj is the proportion of an agricultural resource invested in crop j; σij is the covariance of net return per unit resource between crop i and j; i, j = 1, 2…n.
The covariance of net return per unit resource between two crops is:
where ri is the net return per unit resource of crop i; rj is the net return per unit resource of crop j; i, j = 1, 2…n.
To minimize the risk of farming under a certain return level, the objective equation is expressed as follows:
where θ is the actual average net return per hectare of farming.
To maximize the net return of farming under a certain risk level, the objective equation is built as follows:
where γ is the actual average risk per hectare of faming.
According to the above models, we can estimate the minimized risk (or maximized net return) of farming under current return (or risk) levels by changing certain agricultural resource allocation among different crops.
The descriptive statistics of net return per unit resource for main crops is shown in Table 3. The returns of farmland, water, and labor are defined as the average net return per hectare, the average net return per cubic meter, and the average net return per day, respectively. In general, cash crops had a higher net return per unit resource than grain crops. For instance, chili had the highest mean net return of CNY 57,137.77 per hectare, while the mean net return of wheat was only CNY 7801.16 per hectare. Similar conditions were also found in the net returns of water and labor. Wheat had the lowest returns per unit of water (CNY 1.32 per cubic meter) and per unit of labor (CNY 93.84 per day). Chili had the highest returns per unit of water (CNY 7.95 per cubic meter) and per unit of labor (CNY 535.17 per day). It is worth noting that maize, as a grain crop, still had relatively higher returns per unit of farmland (CNY 20,622.76 per hectare), per unit of water (CNY 3.30 per cubic meter), and per unit of labor (CNY 241.09 per day), respectively, than cash crops, such as sunflower and cucurbit. As a result, maize was the most popular grain crop in the study area.
Table 3.
Descriptive statistics of net return per unit resource.
4. Results
4.1. Optimization Analysis on Risk and Return
The optimized resource allocation combinations with minimizing risk under fixed current return level (or maximizing return under fixed current risk level) were calculated separately for farmland, water, and labor.
The optimized crop planting ratios and corresponding risks of the five irrigation areas, as well as for the whole of Minqin, were estimated by fixing the net return of the portfolio model at the current actual average return per hectare (Table 4). The results showed that, under the current return level, the risks of each irrigation area and the whole of Minqin could be decreased to a large extent. By optimizing farmland resource allocation using the portfolio model, the farming risk for a hectare farmland within the Huanhe, Changning, Ba, Quanshan, and Hu irrigation areas could be reduced from 666.49 million, 66.82 million, 67.14 million, 80.98 million, and 42.02 million to 581.25 million, 38.13 million, 45.43 million, 32.55 million, and 7.22 million, respectively. The decreasing scale of farming risk for the whole of Minqin could be as high as 32.94 million per hectare. The data indicate that the risk of agricultural production in the study area could be largely reduced with present technology and management levels, without losing return. The condition of maximizing return per hectare under current risk levels showed a similar result (Table 4). Under current risk levels, the returns of Huanhe, Changning, Ba, Quanshan, and Hu irrigation areas could be increased from CNY 44.92 thousand, 26.62 thousand, 27.91 thousand, 26.76 thousand, and 23.96 thousand per hectare to CNY 46.46 thousand, 30.26 thousand, 32.89 thousand, 33.51 thousand, and 32.00 thousand per hectare, respectively. The increasing scale of farming return for the whole of Minqin could be as high as CNY 4.03 thousand per hectare. Thus, the return of agricultural production in the study area could also be raised substantially without increasing risk. These results are consistent with previous studies on optimizing crop mix [34,36].
Under current return levels, the risks of the five irrigation areas and the whole of Minqin could also be largely decreased through water resource reallocation among different crops (Table 4). With optimized water allocation, the farming risk of the Huanhe, Changning, Ba, Quanshan, and Hu irrigation areas could be reduced from 8.34, 1.81, 1.73, 2.30, and 2.16 per cubic meter to 4.06, 0.77, 1.12, 0.92, and 0.51 per cubic meter, respectively. The farming risk for the whole of Minqin could be reduced by 0.69 per cubic meter through optimizing water resource allocation. This indicates that a relatively large reduction in farming risk is possible without losing profit, through the optimization of water resource allocation. The condition of maximizing return per cubic meter under the current risk levels also showed consistent results (Table 4). Under the current risk levels, the returns of Huanhe, Changning, Ba, Quanshan, and Hu irrigation areas could be increased from CNY 5.29, 3.78, 4.12, 4.17, and 3.46 per cubic meter to CNY 5.85, 4.48, 4.92, 4.94, and 4.23 per cubic meter, respectively. The farming return of the whole of Minqin could be increased by CNY 0.38 per cubic meter through water resource reallocation. Thus, the farming return in the study area could also have relatively high growth without increasing risk. These results indicate that the portfolio model can be appropriately used for the optimization of water resource allocation.
Table 4.
The optimized risk and return.
Table 4.
The optimized risk and return.
| Item | Huanhe | Changning | Ba | Quanshan | Hu | Minqin | |||||||||||||||||
|---|---|---|---|---|---|---|---|---|---|---|---|---|---|---|---|---|---|---|---|---|---|---|---|
| Actual | Min. Risk | Max. Return | Actual | Min. Risk | Max. Return | Actual | Min. Risk | Max. Return | Actual | Min. Risk | Max. Return | Actual | Min. Risk | Max. Return | Actual | Min. Risk | Max. Return | ||||||
| Risk and return per hectare in farmland analysis | |||||||||||||||||||||||
| Risk (×106) | 666.49 | 581.25 | 666.49 | 66.82 | 38.13 | 66.82 | 67.14 | 45.43 | 67.14 | 80.98 | 32.55 | 80.98 | 42.02 | 7.22 | 42.02 | 73.34 | 40.40 | 73.34 | |||||
| Difference on risk (×106) | -- | −85.24 | -- | -- | −28.68 | -- | -- | −21.71 | -- | -- | −48.43 | -- | -- | −34.80 | -- | -- | −32.94 | -- | |||||
| Return (×103 CNY) | 44.92 | 44.92 | 46.46 | 26.62 | 26.62 | 30.26 | 27.91 | 27.91 | 32.89 | 26.76 | 26.76 | 33.51 | 23.96 | 23.96 | 32.00 | 27.54 | 27.54 | 31.57 | |||||
| Difference on return (×103 CNY) | -- | -- | 1.54 | -- | -- | 3.64 | -- | -- | 4.99 | -- | -- | 6.75 | -- | -- | 8.04 | -- | -- | 4.03 | |||||
| Risk and return per cubic meter in water analysis | |||||||||||||||||||||||
| Risk | 8.34 | 4.06 | 8.34 | 1.81 | 0.77 | 1.81 | 1.73 | 1.12 | 1.73 | 2.30 | 0.92 | 2.30 | 2.16 | 0.51 | 2.16 | 1.77 | 1.08 | 1.77 | |||||
| Difference on risk | -- | −4.28 | -- | -- | −1.04 | -- | -- | −0.61 | -- | -- | −1.38 | -- | -- | −1.65 | -- | -- | −0.69 | -- | |||||
| Return (CNY) | 5.29 | 5.29 | 5.85 | 3.78 | 3.78 | 4.48 | 4.12 | 4.12 | 4.92 | 4.17 | 4.17 | 4.94 | 3.46 | 3.46 | 4.23 | 4.11 | 4.11 | 4.49 | |||||
| Difference on return (CNY) | -- | -- | 0.56 | -- | -- | 0.70 | -- | -- | 0.80 | -- | -- | 0.77 | -- | -- | 0.77 | -- | -- | 0.38 | |||||
| Risk and return per day in labor analysis | |||||||||||||||||||||||
| Risk (×103) | 29.00 | 13.65 | 29.00 | 19.12 | 7.61 | 19.12 | 9.23 | 5.34 | 9.23 | 17.43 | 4.65 | 17.43 | 3.99 | 1.38 | 3.99 | 10.29 | 5.37 | 10.29 | |||||
| Difference on risk (×103) | -- | −15.35 | -- | -- | −11.51 | -- | -- | −3.89 | -- | -- | −12.78 | -- | -- | −2.61 | -- | -- | −4.92 | -- | |||||
| Return (CNY) | 377.70 | 377.70 | 428.07 | 270.57 | 270.57 | 329.87 | 290.71 | 290.71 | 362.42 | 297.09 | 297.09 | 365.92 | 248.80 | 248.80 | 305.30 | 293.30 | 293.30 | 333.05 | |||||
| Difference on return (CNY) | -- | -- | 50.37 | -- | -- | 59.30 | -- | -- | 71.71 | -- | -- | 68.83 | -- | -- | 56.50 | -- | -- | 39.75 | |||||
Note: “--” indicates that the corresponding crop was not planted in the irrigation area. The differences in return indicate differences between returns under the optimized conditions with a fixed risk and the actual return. The differences in risk indicate differences between the risk under the optimized condition with a fixed return and the actual risk. Crops with a household number less than 3% of the sample size were excluded from the model.
When agricultural labor resource allocation was optimized, the farming risk of Huanhe, Changning, Ba, Quanshan, and Hu irrigation areas could be reduced from 29.00 thousand, 19.12 thousand, 9.23 thousand, 17.43 thousand, and 3.99 thousand per day to 13.65 thousand, 7.61 thousand, 5.34 thousand, 4.65 thousand, and 1.38 thousand per day, respectively (Table 4). The decreasing scale of farming risk for the whole of Minqin showed a reduction of 4.92 thousand per day. The condition of maximizing return per day under current risk levels showed a similar result. Under current risk levels, the net returns of Huanhe, Changning, Ba, Quanshan, and Hu irrigation areas could be increased from CNY 377.70, 270.57, 290.71, 297.09, and 248.80 per day to CNY 428.07, 329.87, 362.42, 365.92, and 305.30 per day, respectively (Table 4). The increasing scale of farming return for the whole of Minqin could be as high as CNY 39.75 per day. With the current labor input, the risk and return could also be optimized by labor reallocation across different crops. Compared with the improvements from farmland and water resources reallocation, those from labor reallocation were lower. This implied that labor resource allocation in the study area was relatively rational.
The returns per unit of risk for three kinds of resources before and after optimization are shown in Figure 3. The returns per unit of risk for three kinds of resources was increased in all areas after optimization. In general, the increase made by minimizing risk was larger than that made by maximizing return. The return per unit of risk for farmland for Huanhe, Changning, Ba, Quanshan, Hu, and the whole of Minqin was increased from CNY 0.067 × 10⁻³, 0.398 × 10⁻³, 0.416 × 10⁻³, 0.330 × 10⁻³, 0.570 × 10⁻³, and 0.375 × 10⁻³ per hectare to CNY 0.077 × 10⁻³, 0.698 × 10⁻³, 0.614 × 10⁻³, 0.822 × 10⁻³, 3.317 × 10⁻³, and 0.682 ×10⁻³, respectively, per hectare by minimizing risk, and to CNY 0.070 × 10⁻³, 0.498 × 10⁻³, 0.490 × 10⁻³, 0.414 × 10⁻³, 0.761 × 10⁻³, and 0.430 ×10⁻³, respectively, per hectare by maximizing return (Figure 3). The return per unit of risk for water for Huanhe, Changning, Ba, Quanshan, Hu, and the whole of Minqin was increased from CNY 0.63, 2.09, 2.38, 1.81, 1.60, and 2.32 per cubic meter to CNY 1.30, 4.91, 3.68 4.53, 6.78, and 3.81, respectively, per cubic meter by minimizing risk, and to CNY 0.70, 2.48, 2.84, 2.15, 1.96, and 2.54, respectively, per cubic meter by maximizing return (Figure 3). The return per unit of risk for labor for Huanhe, Changning, Ba, Quanshan, Hu, and the whole of Minqin was increased from CNY 0.001, 0.01, 0.03, 0.02, 0.06, and 0.03 per day to CNY 0.03, 0.04, 0.05, 0.06, 0.18, and 0.05, respectively, per day by minimizing risk, and to CNY 0.002, 0.02, 0.04, 0.02, 0.08, and 0.03, respectively, per day by maximizing return (Figure 3).
From the perspective of risk per unit resource, the biggest reduction was observed in the Huanhe irrigation area for the farmland, water, and labor analyses, with the risk being reduced by 85.24 million per hectare, 4.28 per cubic meter, and 15.35 thousand per day, respectively (Table 4). The biggest increase in return per unit resource was observed in the Hu irrigation area for farmland and in the Ba irrigation area for water and labor, with the return being increased by CNY 8.04 thousand per hectare, CNY 0.80 per cubic meter, and CNY 71.71 per day, respectively (Table 4).

Figure 3.
Return per unit risk before and after optimization.
Figure 3.
Return per unit risk before and after optimization.
However, the biggest improvement of return per unit risk was observed in the Hu irrigation area for the farmland, water, and labor analyses with minimizing risk, with the return per unit risk being increased by CNY 3.32 × 10⁻³ per hectare, CNY 6.78 per cubic meter, and CNY 0.18 per day, respectively (Figure 3). The optimized agricultural resource allocation is different according to different optimizing criteria. This implies that when rural households or local governments face problems of resource reallocation, the primary target should be clearly determined.
4.2. The Optimal Resource Allocation Ratio
The optimized resource allocation ratio was calculated in this study (Table 5). Under the condition of minimizing risk, the most suitable crops for planting were chili (55.67%) in the Huanhe irrigation area, maize in the Changning irrigation area (66.03%) and the Quanshan irrigation area (36.10%), wheat (27.95%) in the Ba irrigation area, and fennel (66.79%) in the Hu irrigation area. These data indicated that those were low-risk crops in the study areas. Under the condition of maximizing return, the most suitable crops for planting were chili (55.95%) in the Huanhe irrigation area, maize (51.00%) in the Changning irrigation area, melon in the Ba irrigation area (34.21%) and the Quanshan (54.25%) irrigation area, and fennel (68.00%) in the Hu irrigation area. Thus, these crops had a relatively high return in the study areas. Before and after optimization, the adjustment of land resource allocation ratio in the Huanhe irrigation area was small, while that in the Hu irrigation area was larger, which might be because there were only three main crops in the Huanhe irrigation area, and because the ratio distribution of cash crops (55.67%) and grain (44.43%) was relatively balanced. However, the planting ratio of wheat was reduced to zero through maximizing return (except in the Ba irrigation area). This may be because of the low net return of planting wheat. For the whole of Minqin, the optimal ratio of farmland in wheat, maize, sunflower, cucurbit, melon, chili, and fennel are 0.00%, 32.17%, 1.01%, 10.51%, 27.09%, 5.43%, and 23.80%, respectively, through minimizing risk, and 0.00%, 27.22%, 0.00%, 5.38%, 41.13%, 8.77%, and 17.51%, respectively, by maximizing return. The actual allocation of farmland is more balanced than that in the irrigation areas. Compared with the actual condition, farmland allocation after optimization in Minqin was enhanced in local dominant crops like maize, melon, and fennel.
In the actual conditions of allocation of water resources, more water was allocated to cash crops such as melon and chili. After optimization using the portfolio model, under the condition of minimizing risk (Table 5), the crop with the largest ratio of water resource allocation was maize in the Huanhe (70.92%) and Changning (72.39%) irrigation areas, chili (33.25%) in the Ba irrigation area, melon (43.68%) in the Quanshan irrigation area, and fennel (58.82%) in the Hu irrigation area. Under the condition of maximizing return (Table 4), the crop with the largest ratio of water resource allocation was maize in the Huanhe (57.68%) and Changning (48.97%) irrigation areas, chili (42.50%) in the Ba irrigation area, melon (67.67%) in Quanshan irrigation area, and fennel (52.03%) in the Hu irrigation area. The optimized water allocation ratios for the whole of Minqin for wheat, maize, sunflower, cucurbit, melon, chili, and fennel are 0.00%, 29.71%, 9.53%, 9.19%, 22.93%, 8.39%, and 20.25%, respectively, through minimizing risk, and 0.00%, 22.74%, 0.35%, 7.72%, 31.27%, 12.96%, and 24.96%, respectively, through maximizing return (Table 5). Water resource was mainly allocated to high-water-demand crops such as chili and melon in the actual condition, while water resource allocation was increased for maize and decreased for sunflower after optimization.
Table 5.
Optimal resource allocation ratios.
Table 5.
Optimal resource allocation ratios.
| Item | Huanhe | Changning | Ba | Quanshan | Hu | Minqin | |||||||||||||||||
|---|---|---|---|---|---|---|---|---|---|---|---|---|---|---|---|---|---|---|---|---|---|---|---|
| Actual | Min. Risk | Max. Return | Actual | Min. Risk | Max. Return | Actual | Min. Risk | Max. Return | Actual | Min. Risk | Max. Return | Actual | Min. Risk | Max. Return | Actual | Min. Risk | Max. Return | ||||||
| Planting ratio (%) | |||||||||||||||||||||||
| Wheat | 10.07 | 0.00 | 0.00 | 6.28 | 0.00 | 0.00 | 7.74 | 27.95 | 11.67 | 7.82 | 0.00 | 0.00 | 5.00 | 10.71 | 0.00 | 4.98 | 0.00 | 0.00 | |||||
| Maize | 34.26 | 47.86 | 44.05 | 27.23 | 66.03 | 51.00 | 26.34 | 24.86 | 28.84 | 24.39 | 36.10 | 32.30 | 11.27 | 3.77 | 0.00 | 18.64 | 32.17 | 27.22 | |||||
| Sunflower | -- | -- | -- | 10.16 | 0.00 | 0.00 | 26.32 | 3.38 | 4.53 | 17.68 | 0.21 | 0.00 | 24.89 | 2.82 | 0.00 | 17.04 | 1.01 | 0.00 | |||||
| Cucurbit | -- | 0.00 | 0.00 | 13.10 | 1.56 | 0.48 | -- | -- | -- | 10.73 | 6.08 | 0.19 | 10.71 | 10.59 | 0.00 | 12.65 | 10.51 | 5.38 | |||||
| Melon | -- | -- | -- | 28.12 | 14.34 | 21.13 | 26.32 | 27.50 | 34.21 | 12.18 | 27.56 | 54.25 | 24.98 | 0.82 | 32.00 | 16.44 | 27.09 | 41.13 | |||||
| Chili | 55.67 | 52.14 | 55.95 | 15.11 | 18.07 | 27.04 | 13.28 | 16.31 | 20.50 | 14.01 | 3.63 | 9.02 | -- | -- | -- | 15.28 | 5.43 | 8.77 | |||||
| Fennel | -- | -- | -- | -- | -- | -- | -- | -- | -- | 13.19 | 26.42 | 4.25 | 23.15 | 66.79 | 68.00 | 14.97 | 23.80 | 17.51 | |||||
| Water allocation ratio (%) | |||||||||||||||||||||||
| Wheat | 26.52 | 0.00 | 0.00 | 14.82 | 0.00 | 0.00 | 18.63 | 29.29 | 11.56 | 13.88 | 0.00 | 0.00 | 17.58 | 14.01 | 0.00 | 13.34 | 0.00 | 0.00 | |||||
| Maize | 32.69 | 70.92 | 57.68 | 16.90 | 72.39 | 48.97 | 19.79 | 16.69 | 19.34 | 14.46 | 21.27 | 0.00 | 15.76 | 9.23 | 0.00 | 14.51 | 29.71 | 22.74 | |||||
| Sunflower | -- | -- | -- | 12.90 | 0.00 | 0.00 | 15.34 | 3.19 | 3.83 | 12.36 | 3.75 | 0.00 | 13.59 | 7.89 | 0.00 | 11.57 | 9.53 | 0.35 | |||||
| Cucurbit | -- | -- | -- | 16.22 | 0.53 | 0.00 | -- | -- | -- | 13.14 | 3.82 | 1.05 | 16.02 | 10.34 | 21.03 | 13.62 | 9.19 | 7.72 | |||||
| Melon | -- | -- | -- | 20.40 | 12.22 | 21.06 | 24.14 | 17.58 | 21.76 | 18.95 | 43.68 | 67.67 | 23.29 | 0.00 | 26.94 | 19.28 | 22.93 | 31.27 | |||||
| Chili | 41.78 | 29.08 | 42.32 | 18.77 | 14.85 | 29.97 | 22.10 | 33.25 | 42.50 | 14.97 | 5.63 | 15.23 | -- | -- | -- | 16.19 | 8.39 | 12.96 | |||||
| Fennel | -- | -- | -- | -- | -- | -- | -- | -- | -- | 12.23 | 21.84 | 16.05 | 13.77 | 58.82 | 52.03 | 11.84 | 20.25 | 24.96 | |||||
| Labor allocation ratio (%) | |||||||||||||||||||||||
| Wheat | 31.27 | 0.00 | 23.78 | 14.97 | 0.00 | 0.00 | 17.53 | 21.90 | 0.00 | 13.99 | 0.00 | 0.00 | 15.10 | 15.35 | 0.00 | 13.31 | 0.00 | 0.00 | |||||
| Maize | 31.74 | 76.12 | 63.33 | 16.48 | 63.11 | 31.19 | 18.03 | 23.93 | 26.78 | 13.87 | 28.80 | 13.14 | 16.14 | 4.53 | 0.00 | 13.75 | 28.29 | 14.84 | |||||
| Sunflower | -- | -- | -- | 14.66 | 0.00 | 0.00 | 16.83 | 7.39 | 7.04 | 13.47 | 0.00 | 0.00 | 15.94 | 0.00 | 0.00 | 13.17 | 0.00 | 0.00 | |||||
| Cucurbit | -- | -- | -- | 14.54 | 4.06 | 5.64 | -- | -- | -- | 12.62 | 3.84 | 2.28 | 15.69 | 4.19 | 12.29 | 12.75 | 8.48 | 7.41 | |||||
| Melon | -- | -- | -- | 17.80 | 25.49 | 47.34 | 23.04 | 38.81 | 54.06 | 12.74 | 30.44 | 69.85 | 22.58 | 6.02 | 33.25 | 16.55 | 22.42 | 35.65 | |||||
| Chili | 36.98 | 23.88 | 36.67 | 21.56 | 7.35 | 15.83 | 24.58 | 7.97 | 12.12 | 20.29 | 3.73 | 14.73 | -- | -- | -- | 18.27 | 6.69 | 13.80 | |||||
| Fennel | -- | -- | -- | -- | -- | -- | -- | -- | -- | 13.01 | 33.19 | 0.00 | 14.55 | 69.87 | 54.46 | 12.21 | 28.12 | 28.30 | |||||
Note: “--” indicates the corresponding crop was not planted in the irrigation area; “fixed return” indicates the condition of minimizing risk under the current return level; “fixed risk” indicates the condition of maximizing return under the current risk level.
Compared with farmland and water, the allocation of labor resources was relatively balanced under the actual conditions. However, the allocation ratio of labor resources was decreased for wheat, sunflower, and cucurbit; it was increased for melon after optimization. In all irrigation areas except for Huanhe, the labor allocation ratio for wheat was reduced to zero under the maximizing return condition (Table 5). Meanwhile, under two optimum proposals (Table 5), labor allocation was mainly focused on maize in the Huanhe (76.12% for minimizing risk and 63.33% for maximizing return) and Changning (63.11% for minimizing risk) irrigation areas, on melon in the Changning irrigation area (47.34% for maximizing return), the Ba irrigation area (38.81% for minimizing risk and 54.06% for maximizing return), and the Quanshan irrigation area (69.85% for maximizing return), on fennel in the Quanshan irrigation area (33.19% for minimizing risk) and in the Hu irrigation area (69.87% for minimizing risk and 54.46% for maximizing return). The optimized labor allocation ratio in the whole of Minqin for wheat, maize, sunflower, cucurbit, chili, melon, and fennel were 0.00%, 28.29%, 0.00%, 8.48%, 22.42%, 6.69%, and 28.12%, respectively, through minimizing risk, and 0.00%, 14.84%, 0.00%, 7.41%, 35.65%, 13.80%, and 28.30%, respectively, through maximizing return for the whole of Minqin (Table 5). The decrease in labor allocated for wheat and sunflower may be because of through relatively low returns of 93.84 and 182.75 per day, respectively (Table 3).
4.3. Return–Risk Effective Frontier
The return–risk effective frontiers of farmland, water, and labor were also estimated for the study area, which was the locus of optimal resource allocation combinations (Figure 4). The results showed that all the actual values were below the corresponding frontier curves. Thus, the allocation of farmland, water, and labor resources still has some improvement potential in the study area.
Compared with farmland and water, the actual values of labor allocation for five irrigation areas were far from those of their corresponding frontier curves (Figure 4). This implied that practitioners should pay more attention to the improvement of labor resource allocation. The five irrigation areas all had relatively rational allocation combinations for farmland and water.
However, the whole of Minqin county exhibited a different result from those of the five irrigation areas (Figure 4). Relatively rational allocations were found for water for the whole of Minqin. Meanwhile, an adjustment should be made for its planting structure and labor resources. It is easy to imagine that this might comprise an integration of the features of all the five irrigation areas. Thus, the results of the whole of Minqin cannot be used to represent any single irrigation area.
From the perspective of risk preference, the different irrigation areas showed different risk preferences for the same resource; meanwhile, each irrigation area also had different risk preferences for different resources (Figure 4). The Hu irrigation area showed a risk-averse attitude in resource allocation for all the three kinds of agricultural resources, because their actual resource allocation points were relatively close to the origin. These data confirm that farmers are conservative in their resource allocation in agricultural production processes [46]. On the contrary, the Huanhe irrigation area had a relatively higher risk preference in all the three kinds of agricultural resource allocation. This may be due to the fact that the Huanhe irrigation area is close to Wuwei city; here, it is convenient for rural household members to pursue non-farming jobs. Off-farm jobs should be the main resource of income for rural households in this area. This fact allows households in the Huanhe irrigation area to take more risks in agricultural production. Besides, the Changning, Ba, and Quanshan irrigation areas presented with similar risk preferences. These three irrigation areas all showed a preference for low-risk approaches in farmland and water allocation, but a preference for relatively high-risk approaches in labor allocation. This is potentially reflective of the scarcity of farmland and water resource in these areas.
Figure 4.
Return–risk effective frontiers for the allocations of farmland, water, and labor.
Figure 4.
Return–risk effective frontiers for the allocations of farmland, water, and labor.
4.4. Resource Use Efficiency
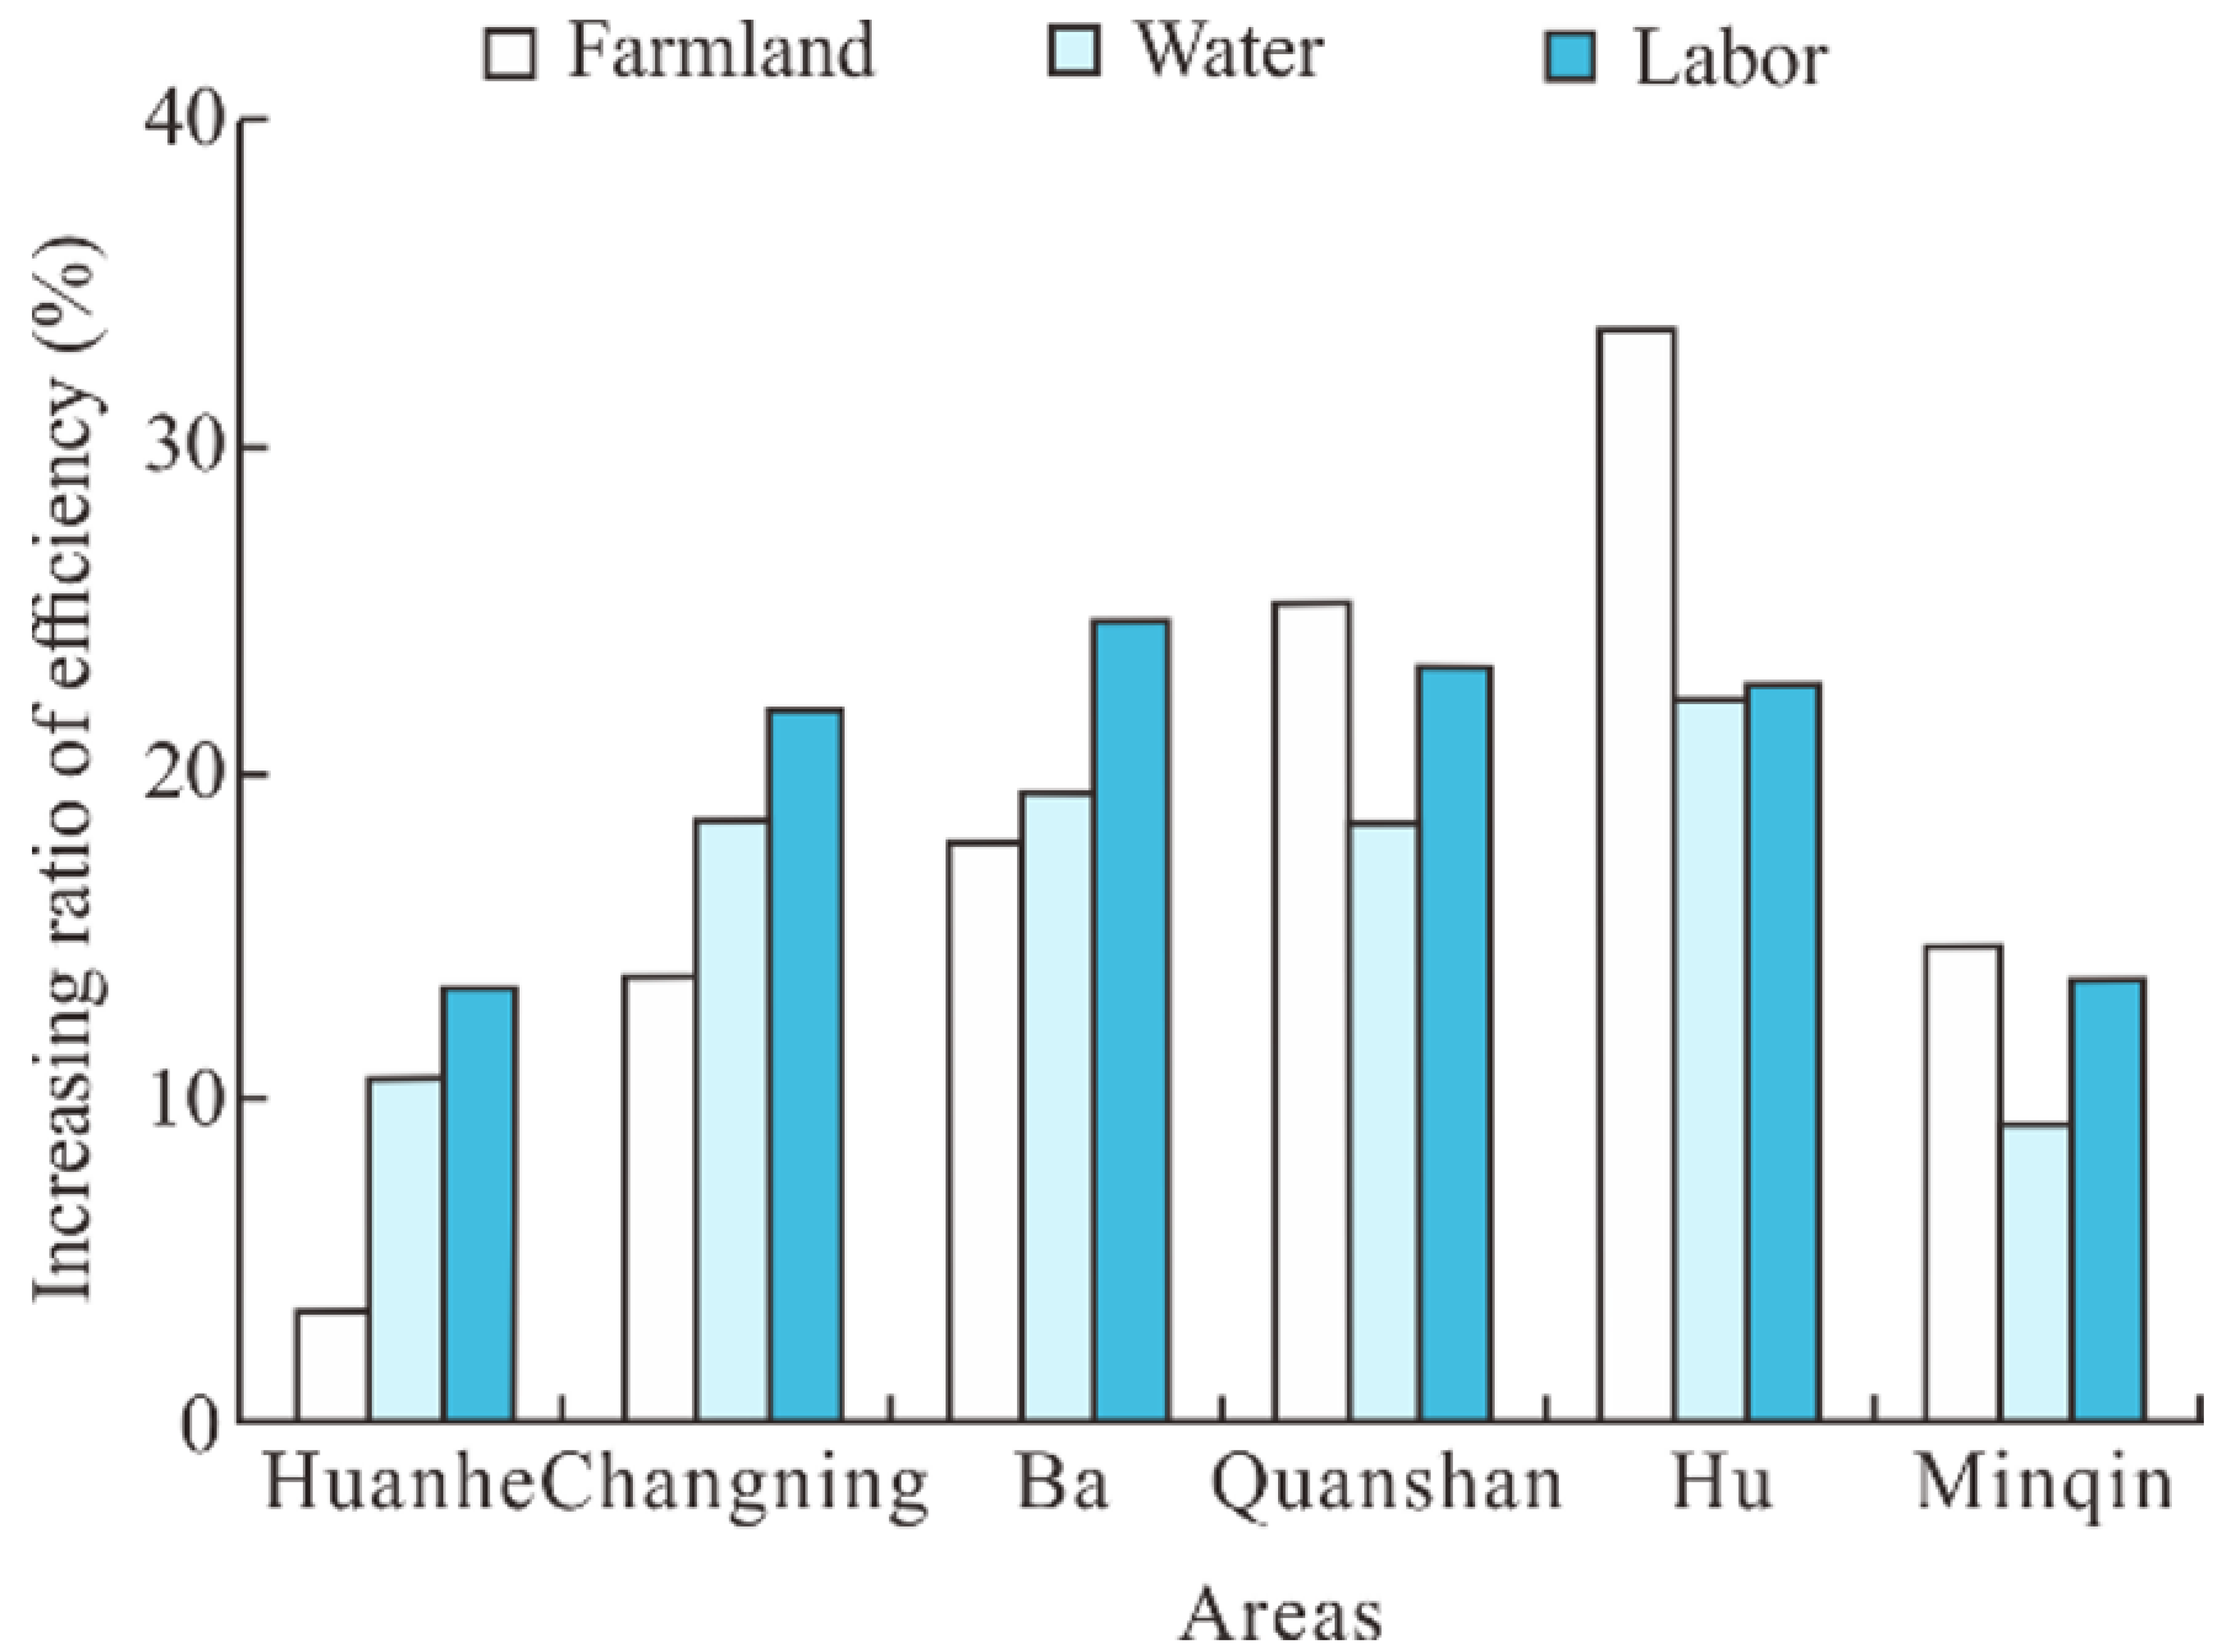
The use efficiency values for farmland, water, and labor were calculated under both the optimized condition at current risk levels and the actual condition (Figure 5). The results of resource use efficiency remained in line with those of maximized returns in the current risk level. The Hu irrigation area showed the largest improvement in its use efficiency of farmland (33.55%) and water (22.25%). This may contribute to its relatively unbalanced planting structure; the planting area of cash crops is large, with the area for grain planting accounting for less than 1/5. The Ba irrigation area had the largest improvement in labor resource allocation (24.64%). However, the Huanhe irrigation area had lower levels of improvement in the use efficiency of farmland (3.43%), water (10.59%), and labor (13.34%). This may be because there are only three crops in the Huanhe irrigation area, and the distribution ratio is balanced among cash crops (55.67%) and grain (43.33%) (Table 5). In terms of the whole of Minqin county, the use efficiencies of farmland, water, and labor could be enhanced by 14.64%, 9.25%, and 13.55%, respectively. This indicated that, in the view of the whole of Minqin county, the allocation of agricultural resources was already relatively reasonable.

Figure 5.
The actual and optimized use efficiencies of farmland, water, and labor. Note: The use efficiency was calculated by the return per unit of resources.
5. Discussion
With the rapid growth of food consumption along with the increase in the global population, the shortage of agricultural resources is becoming more and more serious [47,48]. Meanwhile, climate extremes are exacerbating uncertainty in agricultural production [49]. In this context, the issue of improving return and resource use efficiency in farming, under conditions characterized by limited resources, is critical to the development of modern agriculture. Optimizing resource allocation provides an important approach to enhancing farming return and agricultural resource use efficiency [50]. Conventionally, rural households allocate their agricultural resources based on intuition, experience, and average yield [51], which leads to unreasonable agricultural resource allocation for most households. In the process of agricultural production, farmers are always facing all kinds of risks, which lead to great uncertainty in farming return [52,53]. Thus, in this study, the optimal allocation among crops of farmland, water, and labor were estimated using a portfolio model analysis.
The main finding of this study is that the portfolio model is appropriate for the optimization of allocation of agricultural resources, including farmland, water, labor, and others, among crops of any kind. It is not only the return and risk that can be improved by using the portfolio model, but also the use efficiency of agricultural resources. The results showed that the return per unit of farmland, water, and labor resources in the whole of the Minqin area increased by CNY 4.03 thousand per hectare, CNY 0.38 per cubic meter, and CNY 39.75 per day (Table 4), without increasing risk, and with corresponding increases in use efficiency of 14.64%, 9.25%, and 13.55% (Figure 5), respectively, through optimizing resource allocation using a portfolio model. Similar conclusions were obtained on economic land use of organic bananas in Ecuador [54]. A 7% increase was found without increasing the risk level when farmers changed their crop mix with a higher organic banana ratio than that which was previously used [54]. A study from California, USA, showed that a return–risk frontier was created by changing crop mix following the use of a portfolio model [34]. Additionally, the portfolio model estimates a 1–2% increase in wheat yield per acre at fixed risk, and a 21–33% reduction in annual yield variance at fixed yield in a study conducted in Mexico [44]. Therefore, the application of the portfolio model can be beneficial for agricultural returns and increase efficiencies of resource use. The improvement of resource use efficiency can aid in avoiding excessive use of agricultural resources by farmers in order to maximize returns [55]. Thus, optimizing agricultural resources among crops with a portfolio model is also beneficial for sustainable agricultural goals through an increase in returns without increasing resource consumption; this is conducive to local economic development and environmental protection [56,57,58].
For the frontier curves, the conditions of minimizing risk and maximizing return only corresponded to two optimal resource allocation combinations at two different risk levels. Rural households and local policy makers can choose any point on the frontier curve to optimize the allocation of agricultural resources according to their risk preferences, not only the above two risk levels [54]. Resource allocation combinations which are close to the origin should be chosen by those who are averse to risk. On the contrary, resource allocation combinations which are distant from the origin can be chosen by those who are risk seekers. Thus, the portfolio model provides a good tool for return and risk management in agricultural production. Therefore, rural households and local policy makers can choose any agricultural resource allocation combination in the frontier curves to optimize their risk, return, and resource use efficiency in their agricultural production. This shows that the portfolio model provides a good tool for the return and risk management of agricultural resources.
The portfolio model will often suggest the elimination of crops with very low profit margins, such as wheat. Considering the importance of grain security, wheat acreage should be kept above a certain level. The estimation of the portfolio model may contain some biases between the goal of grain security and optimum proposals. Thus, some fine adjustments would be helpful when optimizing resource allocation with multiple objectives. Additionally, the return of grain planting should be ensured by certain policies to improve farmers’ enthusiasm for planting grain. Although policies in this field, such as grain subsidies, have already been implemented, their effects in increasing grain profits are far from being effective [59]. More effective policies are needed to ensure grain security [60].
As for the extent to which the portfolio model should be applied, accounting for the great differences between the results of different irrigation areas as well as under different optimization objects (minimizing risk or maximizing return), the optimization of resource allocation should be applied according to the specific optimal objects. Agricultural resource endowments vary across different regions, which will lead to different plant cultivation systems. As a result, the adjustment of agricultural planting structure and the allocation of agricultural resources should vary across regions [61]. A study in the North China Plain found that neglecting the heterogeneity of agricultural productivity leads to a serious resource mismatch, resulting in huge output loss [62]. Thus, the allocation scheme of agricultural resources should be made in a reasonable coverage range according to local conditions to ensure optimal agricultural production.
6. Conclusions
This study sheds light on the optimization of agricultural resource allocation. The optimal allocation among crops of farmland, water, and labor in five irrigation areas and the whole of Minqin county was estimated using a portfolio model analysis. The results indicate that the portfolio model is appropriate for the optimization of agricultural resource allocation, including farmland, water, labor, and others, among crops of any kind. Return and risk can be improved through the use of the portfolio model, in addition to the use efficiency of agricultural resources. Considering the differences in optimized resource combinations under different optimization objects, as well as in different areas, the optimization of resource allocation among crops should be applied according to the specific optimal goals.
This study provides new insights into the optimization of agricultural resources allocation through a portfolio model. The results are helpful for policymakers in their adaptation to some strategies with regard to agricultural resource management. It is worth noting that the current study was based on three years of data in a specific country. Thus, in order to reduce the impacts of unobserved household heterogeneity and the fluctuations in the prices of agricultural products, further studies can provide more robust results based on long-panel datasets with more study areas. Additionally, the present study shows that resources can be allocated separately by portfolio model. Thus, a most scare resource will often be allocated optimally, and other resources should be allocated in correspondence with the optimized allocation of this resource. For example, water resources should be allocated optimally with a portfolio model in arid and semi-arid areas, and then other resources (such as farmland and labor) can be allocated according to the optimized allocation of water. In further research, a model which simultaneously optimizes the allocation of multiple agricultural resources among crops is worth exploring.
Author Contributions
Investigation, B.-L.M., X.-Y.J. and Z.T.; resources, Y.L.; data curation, B.-L.M.; writing—original draft preparation, B.-L.M.; writing—review and editing, Y.L. and Y.-B.F.; supervision, Y.L. and Y.-B.F.; project administration, Y.L. and X.-J.N.; funding acquisition, Y.L. All authors have read and agreed to the published version of the manuscript.
Funding
This study was supported financially by the National Natural Science Foundation of China (32001406 and 72204102) and Strategic Research and Consulting Project of Chinese Academy of Engineering (2022-XY-139).
Data Availability Statement
The data presented in this study are available on request from the first author.
Acknowledgments
The authors thank the editors and the anonymous reviewers for their valuable comments, which helped to improve our manuscript.
Conflicts of Interest
The authors declare no conflict of interest.
References
- Godfray, H.C.; Beddington, J.R.; Crute, I.R.; Haddad, L.; Lawrence, D.; Muir, J.F.; Pretty, J.; Robinson, S.; Thomas, S.M.; Toulmin, C. Food security: The challenge of feeding 9 billion people. Science 2010, 327, 812–818. [Google Scholar] [CrossRef] [PubMed]
- Liu, H.; Soares-Filho, B.S.; Leite-Filho, A.T.; Zhang, S.; Du, J.; Yi, Y. How to balance land demand conflicts to guarantee sustainable land development. iScience 2023, 26, 106641. [Google Scholar] [CrossRef] [PubMed]
- Amundson, R.; Berhe, A.A.; Hopmans, J.W.; Olson, C.; Sztein, A.E.; Sparks, D.L. Soil and human security in the 21st century. Science 2015, 348, 1261071. [Google Scholar] [CrossRef] [PubMed]
- Xie, H.; Zhang, Y.; Wu, Z.; Lv, T. A bibliometric analysis on land degradation: Current status, development, and future directions. Land 2020, 9, 28. [Google Scholar] [CrossRef]
- Chen, W. China’s arable land wasting problem. China Agric. Econ. Rev. 2021, 13, 521–527. [Google Scholar] [CrossRef]
- Harmel, R.D.; Chaubey, I.; Ale, S.; Nejadhashemi, A.P.; Irmak, S.; DeJonge, K.C.; Evett, S.R.; Barnes, E.M.; Catley-Carlson, M.; Hunt, S.; et al. Perspectives on global water security. Trans. ASABE 2020, 63, 69–80. [Google Scholar] [CrossRef]
- Meng, X.; Wu, L. Prediction of per capita water consumption for 31 regions in China. Environ. Sci. Pollut. Res. 2021, 28, 29253–29264. [Google Scholar] [CrossRef]
- Yue, Q.; Zhang, F.; Guo, P. Optimization-based agricultural water-saving potential analysis in Minqin county, Gansu Province, China. Water 2018, 10, 1125. [Google Scholar] [CrossRef]
- Ale, S.; Harmel, R.D.; Nejadhashemi, A.P.; DeJonge, K.C.; Irmak, S.; Chaubey, I.; Douglas-Mankin, K.R. Global water security: Current research and priorities for action. Trans. ASABE 2020, 63, 49–55. [Google Scholar] [CrossRef]
- Otsuka, K.; Liu, Y.; Yamauchi, F. Growing advantage of large farms in Asia and its implications for global food security. Glob. Food Secur. 2016, 11, 5–10. [Google Scholar] [CrossRef]
- Lu, H.; Xie, H.; Yao, G. Impact of land fragmentation on marginal productivity of agricultural labor and non-agricultural labor supply: A case study of Jiangsu, China. Habitat Int. 2019, 83, 65–72. [Google Scholar] [CrossRef]
- Hill, A.E.; Ornelas, I.; Taylor, J.E. Agricultural labor supply. Annu. Rev. Resour. Econ. 2021, 13, 39–64. [Google Scholar] [CrossRef]
- Zhang, S.; Song, X.; Wan, J.; Liu, Y.; Deng, W. The features of rural labor transfer and cultural differences: Evidence from China’s southwest mountainous areas. Sustainability 2019, 11, 1522. [Google Scholar] [CrossRef]
- Kuiper, M.; Shutes, L.; van Meijl, H.; Oudendag, D.; Tabeau, A. Labor supply assumptions—A missing link in food security projections. Glob. Food Secur. 2020, 25, 100328. [Google Scholar] [CrossRef]
- Zhang, F.; Guo, S.; Liu, X.; Wang, Y.; Engel, B.A.; Guo, P. Towards sustainable water management in an arid agricultural region: A multi-level multi-objective stochastic approach. Agric. Syst. 2020, 182, 102848. [Google Scholar] [CrossRef]
- Tarolli, P.; Zhao, W. Drought in agriculture: Preservation, adaptation, migration. Innov. Geosci. 2023, 1, 100002. [Google Scholar] [CrossRef]
- Benin, S.; Ahmed, M.; Pender, J.; Ehui, S. Development of land rental markets and agricultural productivity growth: The case of northern Ethiopia. J. Afr. Econ. 2005, 14, 21–54. [Google Scholar] [CrossRef]
- Pašakarnis, G.; Maliene, V. Towards sustainable rural development in Central and Eastern Europe: Applying land consolidation. Land Use Policy 2010, 27, 545–549. [Google Scholar] [CrossRef]
- Jin, S.; Jayne, T.S. Land rental markets in Kenya: Implications for efficiency, equity, household income, and poverty. Land Econ. 2013, 89, 246. [Google Scholar] [CrossRef]
- Liu, Y.; Wang, C.; Tang, Z.; Nan, Z. Will farmland transfer reduce grain acreage? Evidence from Gansu province, China. China Agric. Econ. Rev. 2018, 10, 277–292. [Google Scholar] [CrossRef]
- Xu, H.; Yang, R.; Song, J. Agricultural water use efficiency and rebound effect: A study for China. Int. J. Environ. Res. Public Health 2021, 18, 7151. [Google Scholar] [CrossRef] [PubMed]
- Misquitta, K.; Birkenholtz, T. Drip irrigation as a socio-technical configuration: Policy design and technological choice in Western India. Water Int. 2021, 46, 112–129. [Google Scholar] [CrossRef]
- Langarudi, S.P.; Maxwell, C.M.; Fernald, A.G. Integrated policy solutions for water scarcity in agricultural communities of the American Southwest. Systems 2021, 9, 26. [Google Scholar] [CrossRef]
- Yang, M.; Li, M.; Luo, X. 50 years of agricultural mechanization in China. Ama-Agric. Mech. Asia Afr. Lat. Am. 2020, 51, 86–92. [Google Scholar]
- Lu, H.W.; Huang, G.H.; Zhang, Y.M.; He, L. Strategic agricultural land-use planning in response to water-supplier variation in a China’s rural region. Agric. Syst. 2012, 108, 19–28. [Google Scholar] [CrossRef]
- Palash, M.S.; Bauer, S. Diversification of farmland use in Bangladesh: Land allocation impacts on farm profitability. Open Agric. 2017, 2, 175–188. [Google Scholar] [CrossRef]
- Gui, Z.; Li, M.; Guo, P. Simulation-based inexact fuzzy semi-infinite programming method for agricultural cultivated area planning in the Shiyang river basin. J. Irrig. Drain. Eng. 2017, 143, 05016011. [Google Scholar] [CrossRef]
- Zhang, D.; Guo, P. Integrated agriculture water management optimization model for water saving potential analysis. Agric. Water Manag. 2016, 170, 5–19. [Google Scholar] [CrossRef]
- Fan, Y.; Wang, C.; Nan, Z. Comparative evaluation of crop water use efficiency, economic analysis and net household profit simulation in arid Northwest China. Agric. Water Manag. 2014, 146, 335–345. [Google Scholar] [CrossRef]
- Balezentis, T.; Li, T.X.; Chen, X. Has agricultural labor restructuring improved agricultural labor productivity in China? A decomposition approach. Socio-Econ. Plan. Sci. 2021, 76, 100967. [Google Scholar] [CrossRef]
- Ge, D.; Long, H.; Zhang, Y.; Tu, S. Analysis of the coupled relationship between grain yields and agricultural labor changes in China. J. Geogr. Sci. 2018, 28, 93–108. [Google Scholar] [CrossRef]
- Kumbhakar, S.C.; Tsionas, E.G. Estimation of production risk and risk preference function: A nonparametric approach. Ann. Oper. Res. 2010, 176, 369–378. [Google Scholar] [CrossRef]
- Li, Z.; Rejesus, R.M.; Zheng, X. Nonparametric estimation and inference of production risk. Am. J. Agric. Econ. 2021, 103, 1857–1877. [Google Scholar] [CrossRef]
- Collins, R.A.; Barry, P.J. Risk analysis with single–index portfolio models: An application to farm planning. Am. J. Agric. Econ. 1986, 68, 152–161. [Google Scholar] [CrossRef]
- Lowenberg-DeBoer, J.; López-Pereira, M.A. Risk assessment for herbaceous biomass crops: The case of perennial grasses. Biomass 1990, 23, 263–274. [Google Scholar] [CrossRef]
- Rădulescu, M.; Rădulescu, C.Z.; Zbăganu, G. A portfolio theory approach to crop planning under environmental constraints. Ann. Oper. Res. 2011, 219, 243–264. [Google Scholar] [CrossRef]
- Yang, H.; Du, T.; Qiu, R.; Chen, J.; Wang, F.; Li, Y.; Wang, C.; Gao, L.; Kang, S. Improved water use efficiency and fruit quality of greenhouse crops under regulated deficit irrigation in northwest China. Agric. Water Manag. 2017, 179, 193–204. [Google Scholar] [CrossRef]
- Ren, X.; Yin, Q.; Zhang, H. Comprehensive water resource management strategies in arid oasis regions: Taking Minqin county as an example. In Proceedings of the IOP Conference Series: Earth and Environmental Science, International Conference on Green Development and Environmental Science and Technology (ICGDE), Changsha, China, 18–20 September 2020. [Google Scholar]
- Kang, S.; Su, X.; Tong, L.; Shi, P.; Yang, X.; Abe, Y.; Du, T.; Shen, Q.; Zhang, J. The impacts of human activities on the water–land environment of the Shiyang river basin, an arid region in northwest China. Hydrol. Sci. J. 2009, 49, 413–427. [Google Scholar]
- Xue, X.; Liao, J.; Hsing, Y.; Huang, C.; Liu, F. Policies, land use, and water resource management in an arid oasis ecosystem. Environ. Manag. 2015, 55, 1036–1051. [Google Scholar] [CrossRef]
- Tan, Q.; Zhang, S.; Li, R. Optimal use of agricultural water and land resources through reconfiguring crop planting structure under socioeconomic and ecological objectives. Water 2017, 9, 488. [Google Scholar] [CrossRef]
- Minqin County Government. Available online: http://www.minqin.gov.cn/art/2023/4/28/art_29130_1126312.html (accessed on 1 September 2023).
- Lence, S.H.; Hart, C. Index models and land allocation reconsidered. Can. J. Agric. Econ./Rev. Can. D’Agroeconomie 1997, 45, 267–284. [Google Scholar] [CrossRef]
- Nalley, L.L.; Barkley, A.P. Using portfolio theory to enhance wheat yield stability in low-income nations: An application in the Yaqui Valley of northwestern Mexico. J. Agric. Resour. Econ. 2010, 35, 334–347. [Google Scholar]
- Markowitz, H.M. Portfolio selection. J. Financ. 1952, 7, 71–91. [Google Scholar]
- Ullah, R.; Shivakoti, G.P.; Ali, G. Factors effecting farmers’ risk attitude and risk perceptions: The case of Khyber Pakhtunkhwa, Pakistan. Int. J. Disaster Risk Reduct. 2015, 13, 151–157. [Google Scholar] [CrossRef]
- Fullbrook, D. Food as security. Food Secur. 2010, 2, 5–20. [Google Scholar] [CrossRef]
- Li, M.; Xu, W.; Zhu, T. Agricultural water allocation under uncertainty: Redistribution of water shortage risk. Am. J. Agric. Econ. 2019, 101, 134–153. [Google Scholar] [CrossRef]
- Yin, Z.; Zhou, B.; Duan, M.; Chen, H.; Wang, H. Climate extremes become increasingly fierce in China. Innov. 2023, 4, 100406. [Google Scholar] [CrossRef]
- Wu, J.; Huang, R.; Fang, T.; Han, Y. Multi-objective model of irrigation water distribution based on particle swarm optimization. In Proceedings of the IOP Conference Series: Earth and Environmental Science, 5th International Conference on Water Resource and Environment (WRE), Macao, China, 16–19 June 2019. [Google Scholar]
- Nalley, L.L.; Barkley, A.; Watkins, B.; Hignight, J. Enhancing farm profitability through portfolio analysis: The case of spatial rice variety selection. J. Agric. Appl. Econ. 2015, 41, 641–652. [Google Scholar] [CrossRef]
- Troost, C.; Berger, T. Dealing with uncertainty in agent-based simulation: Farm-level modeling of adaptation to climate change in southwest Germany. Am. J. Agric. Econ. 2015, 97, 833–854. [Google Scholar] [CrossRef]
- Wu, C.; Cai, Y.; Hu, B.; Wang, J. Classification and evaluation of uncertain influence factors for farm machinery service. Int. J. Agric. Biol. Eng. 2017, 10, 164–174. [Google Scholar]
- Castro, L.M.; Calvas, B.; Knoke, T. Ecuadorian banana farms should consider organic banana with low price risks in their land-use portfolios. PLoS ONE 2015, 10, e0120384. [Google Scholar] [CrossRef] [PubMed]
- Ciampi, L.; Plumpton, H.J.; Osbahr, H.; Cornforth, R.J.; Petty, C. Building resilience through improving groundwater management for sustainable agricultural intensification in African Sahel. CABI Agric. Biosci. 2022, 3, 63. [Google Scholar] [CrossRef]
- Robinson, J. Squaring the circle? Some thoughts on the idea of sustainable development. Ecol. Econ. 2004, 48, 369–384. [Google Scholar] [CrossRef]
- Nazari, B.; Liaghat, A.; Akbari, M.R.; Keshavarz, M. Irrigation water management in Iran: Implications for water use efficiency improvement. Agric. Water Manag. 2018, 208, 7–18. [Google Scholar] [CrossRef]
- Liu, L.; Liu, B.; Song, W.; Yu, H. The Relationship between Rural Sustainability and Land Use: A Bibliometric Review. Land 2023, 12, 1617. [Google Scholar] [CrossRef]
- Yi, F.; Sun, D.; Zhou, Y. Grain subsidy, liquidity constraints and food security—Impact of the grain subsidy program on the grain-sown areas in China. Food Policy 2015, 50, 114–124. [Google Scholar] [CrossRef]
- Qian, J.; Ito, S.; Mu, Y.; Zhao, Z.; Wang, X. The role of subsidy policies in achieving grain self-sufficiency in China: A partial equilibrium approach. Agric. Econ. 2018, 64, 23–35. [Google Scholar] [CrossRef]
- Zheng, X.; Liu, W.; Xu, Z.; Ying, R.; Ye, C. Restructuring grain production in China: Regional heterogeneity and its causality. China Agric. Econ. Rev. 2018, 10, 647–665. [Google Scholar] [CrossRef]
- Chen, M.; Heerink, N.; Zhu, X.; Feng, S. Do small and equally distributed farm sizes imply large resource misallocation? Evidence from wheat-maize double-cropping in the North China Plain. Food Policy 2022, 112, 102350. [Google Scholar] [CrossRef]

Disclaimer/Publisher’s Note: The statements, opinions and data contained in all publications are solely those of the individual author(s) and contributor(s) and not of MDPI and/or the editor(s). MDPI and/or the editor(s) disclaim responsibility for any injury to people or property resulting from any ideas, methods, instructions or products referred to in the content. |
© 2023 by the authors. Licensee MDPI, Basel, Switzerland. This article is an open access article distributed under the terms and conditions of the Creative Commons Attribution (CC BY) license (https://creativecommons.org/licenses/by/4.0/).