Abstract
Revealing the multidimensional value of cultivated land resources, improving calculation methods, and exploring their spatial distribution characteristics and influencing factors are crucial for the enhancement of natural resource accounting systems and the protection of cultivated land resources. This study takes Guangxi, China, as an example and constructs a comprehensive multidimensional value evaluation system for cultivated land resources at the county scale. The income capitalization method, substitution market method, and value equivalent correction method were applied to calculate the economic, social, and ecological values of cultivated land resources in 111 counties in 2020. Furthermore, spatial autocorrelation analysis was employed to study their distribution characteristics and influencing factors. The results show that: (1) In 2020, the total value of cultivated land resources in Guangxi was USD 2859.3 billion, with the economic, social, and ecological values were USD 1674.2 billion, USD 417.7 billion and USD 767.3 billion USD, respectively. (2) The economic and social value of cultivated land per hectare at the county scale in Guangxi demonstrates similar spatial distribution patterns. High-value counties exhibit a strip-like distribution along the eastern edge, following a north–south orientation, while low-value counties form clusters in the central and western regions. (3) There is a significant spatial clustering effect of all values of cultivated land resources in local space, with “high-high” and “low-low” clustering. (4) The level of economic development in counties has a negative impact on the ecological value of cultivated land resources, while it has a positive impact on their social value. (5) Natural conditions, agricultural infrastructure conditions and agricultural development approaches are the key factors affecting the value of cultivated land resources.
1. Introduction
Since the 18th National Congress of the Communist Party of China, the Party Central Committee has attached great importance to the protection of natural resources. It has put forward new topics such as exploring the preparation of a natural resource balance sheet and implementing natural resource asset audits for leading cadres [1]. In April 2019, the General Office and the State Council issued the Guiding Opinions on Coordinating and Promoting the Reform of the Natural Resource Property Rights System, which proposed studying the establishment of a natural resource accounting and evaluation system. This system aims to conduct both physical quantity statistics and explore value-based calculations. As an integral part of natural resource assets, cultivated land plays a crucial role in ensuring food security, maintaining ecosystem integrity, and promoting integrated urban–rural development, which cannot be replaced by other resources [2,3,4]. Establishing a sound valuation system for cultivated land resources is an important component of China’s exploration in preparing a natural resource balance sheet. However, the value of cultivated land resources is multidimensional and highly influenced by external factors, making it challenging to comprehensively account for their value [5].
Guangxi, as a border province in China, is a typical karst landform area with limited cultivated land resources and pronounced vulnerability. Despite these challenges, it has become one of the top ten agricultural provinces in China. In recent years, it has undertaken the transfer of industrial chains from the Pearl River Delta, resulting in significant industrialization and urbanization. However, issues such as land occupation, agricultural restructuring, and the abandonment of cultivated land have led to a decline in both the quantity and quality of cultivated land, exacerbating the contradiction between land protection and development. The prevailing mindset of sacrificing cultivated land for economic development has not been fully transformed, primarily due to the insufficient recognition of the value of cultivated land resources [6]. In this context, it is of utmost importance to advocate for the multifunctional values of cultivated land, precisely delineate the essence and value of cultivated land resource assets, and enhance the accounting methodology system. These actions are particularly crucial for China’s border provinces, especially those in ecologically fragile areas, as they endeavor to protect their cultivated land resources, establish a compensation system for ecological preservation, and effectively manage their natural resource assets.
The study of the value of cultivated land abroad originated from the exploration of agricultural land rent theory [7]. Since the 20th century, foreign scholars, led by the United States, have extensively applied market valuation methods to assess the value of agricultural land. They have estimated the value of domestic and regional cultivated land and explored influencing factors [8,9,10], resulting in methodologies such as soil productivity approach, income capitalization approach, market-based approach, and cost-based approach. With the emergence of sustainable development concepts, scholars began to focus on the non-market values of cultivated land. They recognized that cultivated land possesses landscape and aesthetic value, native habitat value, biodiversity value, soil and water conservation value, as well as recreational and spiritual value [11,12]. Building on economic theories, scholars developed preference-revealing valuation methods (such as cost analysis, travel cost method, and hedonic pricing) and stated preference valuation methods (such as the contingent valuation method and choice modeling) [13].
In recent years, the ecosystem services value of cultivated land has become a research hotspot. Scholars have not only evaluated the overall ecological value of cultivated land [8,14] but also calculated micro-values such as scenic and ecological values and biodiversity value for specific agricultural lands [15,16]. Various methods have been developed, including hedonic pricing, contingent valuation, substitution market, and equivalent factor methods. Among these, the most widely accepted is the equivalent factor method proposed by Costanza [4] to determine the ecosystem services value. Overall, extensive research on various values of cultivated land has been conducted abroad, covering scales ranging from individual plots to national levels. However, few studies have established a comprehensive framework for evaluating the overall value of cultivated land, with only some focusing on land appraisal frameworks [17,18]
In contrast to foreign scholars, research on the value of cultivated land resources in China did not begin until the late 21st century. Early studies mainly focused on the connotation and economic value of cultivated land resources. According to various theories [19], different scholars categorized cultivated land value into use value and non-use value [19], market value and non-market value [20], and economic value, social value, and ecological value [21]. In terms of economic value estimation, methods such as the income capitalization approach, market comparison approach, cost approximation approach, residual approach, and benchmark plot approach were developed. For example, He Xiping [22] and Huang Xianjin [23] conducted zonal valuations of cultivated land nationwide and obtained correction coefficients and unit prices for different agricultural regions in China. Scholars such as Yu Fengqing, Cai Yunlong [21], systematically elaborated on the connotation of cultivated land value from economic, ecological, social, and perceptual perspectives.
Since 2000, researchers have started paying attention to the non-market value of cultivated land. Most scholars have used market substitution methods to estimate the social value of cultivated land at the city or provincial scale [24]. The ecological value and comprehensive value of cultivated land have become hot topics. Regarding ecological value, Chinese scholars often modify the national ecosystem service value table developed by Xie Gaodi [25] to obtain the ecological value of cultivated land in their study areas [26,27]. Meanwhile, some scholars have constructed accounting systems for evaluating the value of cultivated land resources [28]. They calculate various values of cultivated land based on an “economic-social-ecological” value model and explore the spatial distribution characteristics and influencing factors of these values [29,30].
In summary, scholars both domestically and internationally have experienced a development process in assessing the value of cultivated land, transitioning from a single focus on production and nurturing functions to considering economic, social, and ecological values. Various accounting methods have been employed. However, there is currently no unified understanding of the connotation of cultivated land value among scholars, and the construction of accounting methods and correction coefficients lacks a scientific framework, making it difficult to make cross-comparisons. Most studies have focused on large-scale regions such as provinces and cities, with relatively few studies conducted at the county level. Furthermore, there is a lack of exploration into the spatial distribution heterogeneity and influencing factors of value. Research areas tend to concentrate on regions with abundant cultivated land resources, such as the middle and lower reaches of the Yangtze River, Northeast China, and North China, while less attention has been paid to areas with fragile ecological environments. The lack of consistency in accounting systems, limitations in research areas, and inadequate studies at the county level all pose obstacles to the establishment of a comprehensive evaluation system for cultivated land value in China, hindering the progress of local government’s efforts in land protection. Therefore, it is urgently necessary to strengthen relevant academic research in this field.
Therefore, taking Guangxi as an example and 2020 as the research year, this paper carried out a multidimensional value assessment of county cultivated land resources, conducted global and local spatial autocorrelation analysis via ArcGIS and Geoda to reveal the distribution characteristics and the influencing factors of county cultivated land, so as to provide an objective reference for establishing a natural resource value accounting system and improving the compensation mechanism for cultivated land protection in China.
2. Study Area Overview and Data Sources
2.1. Study Area Overview
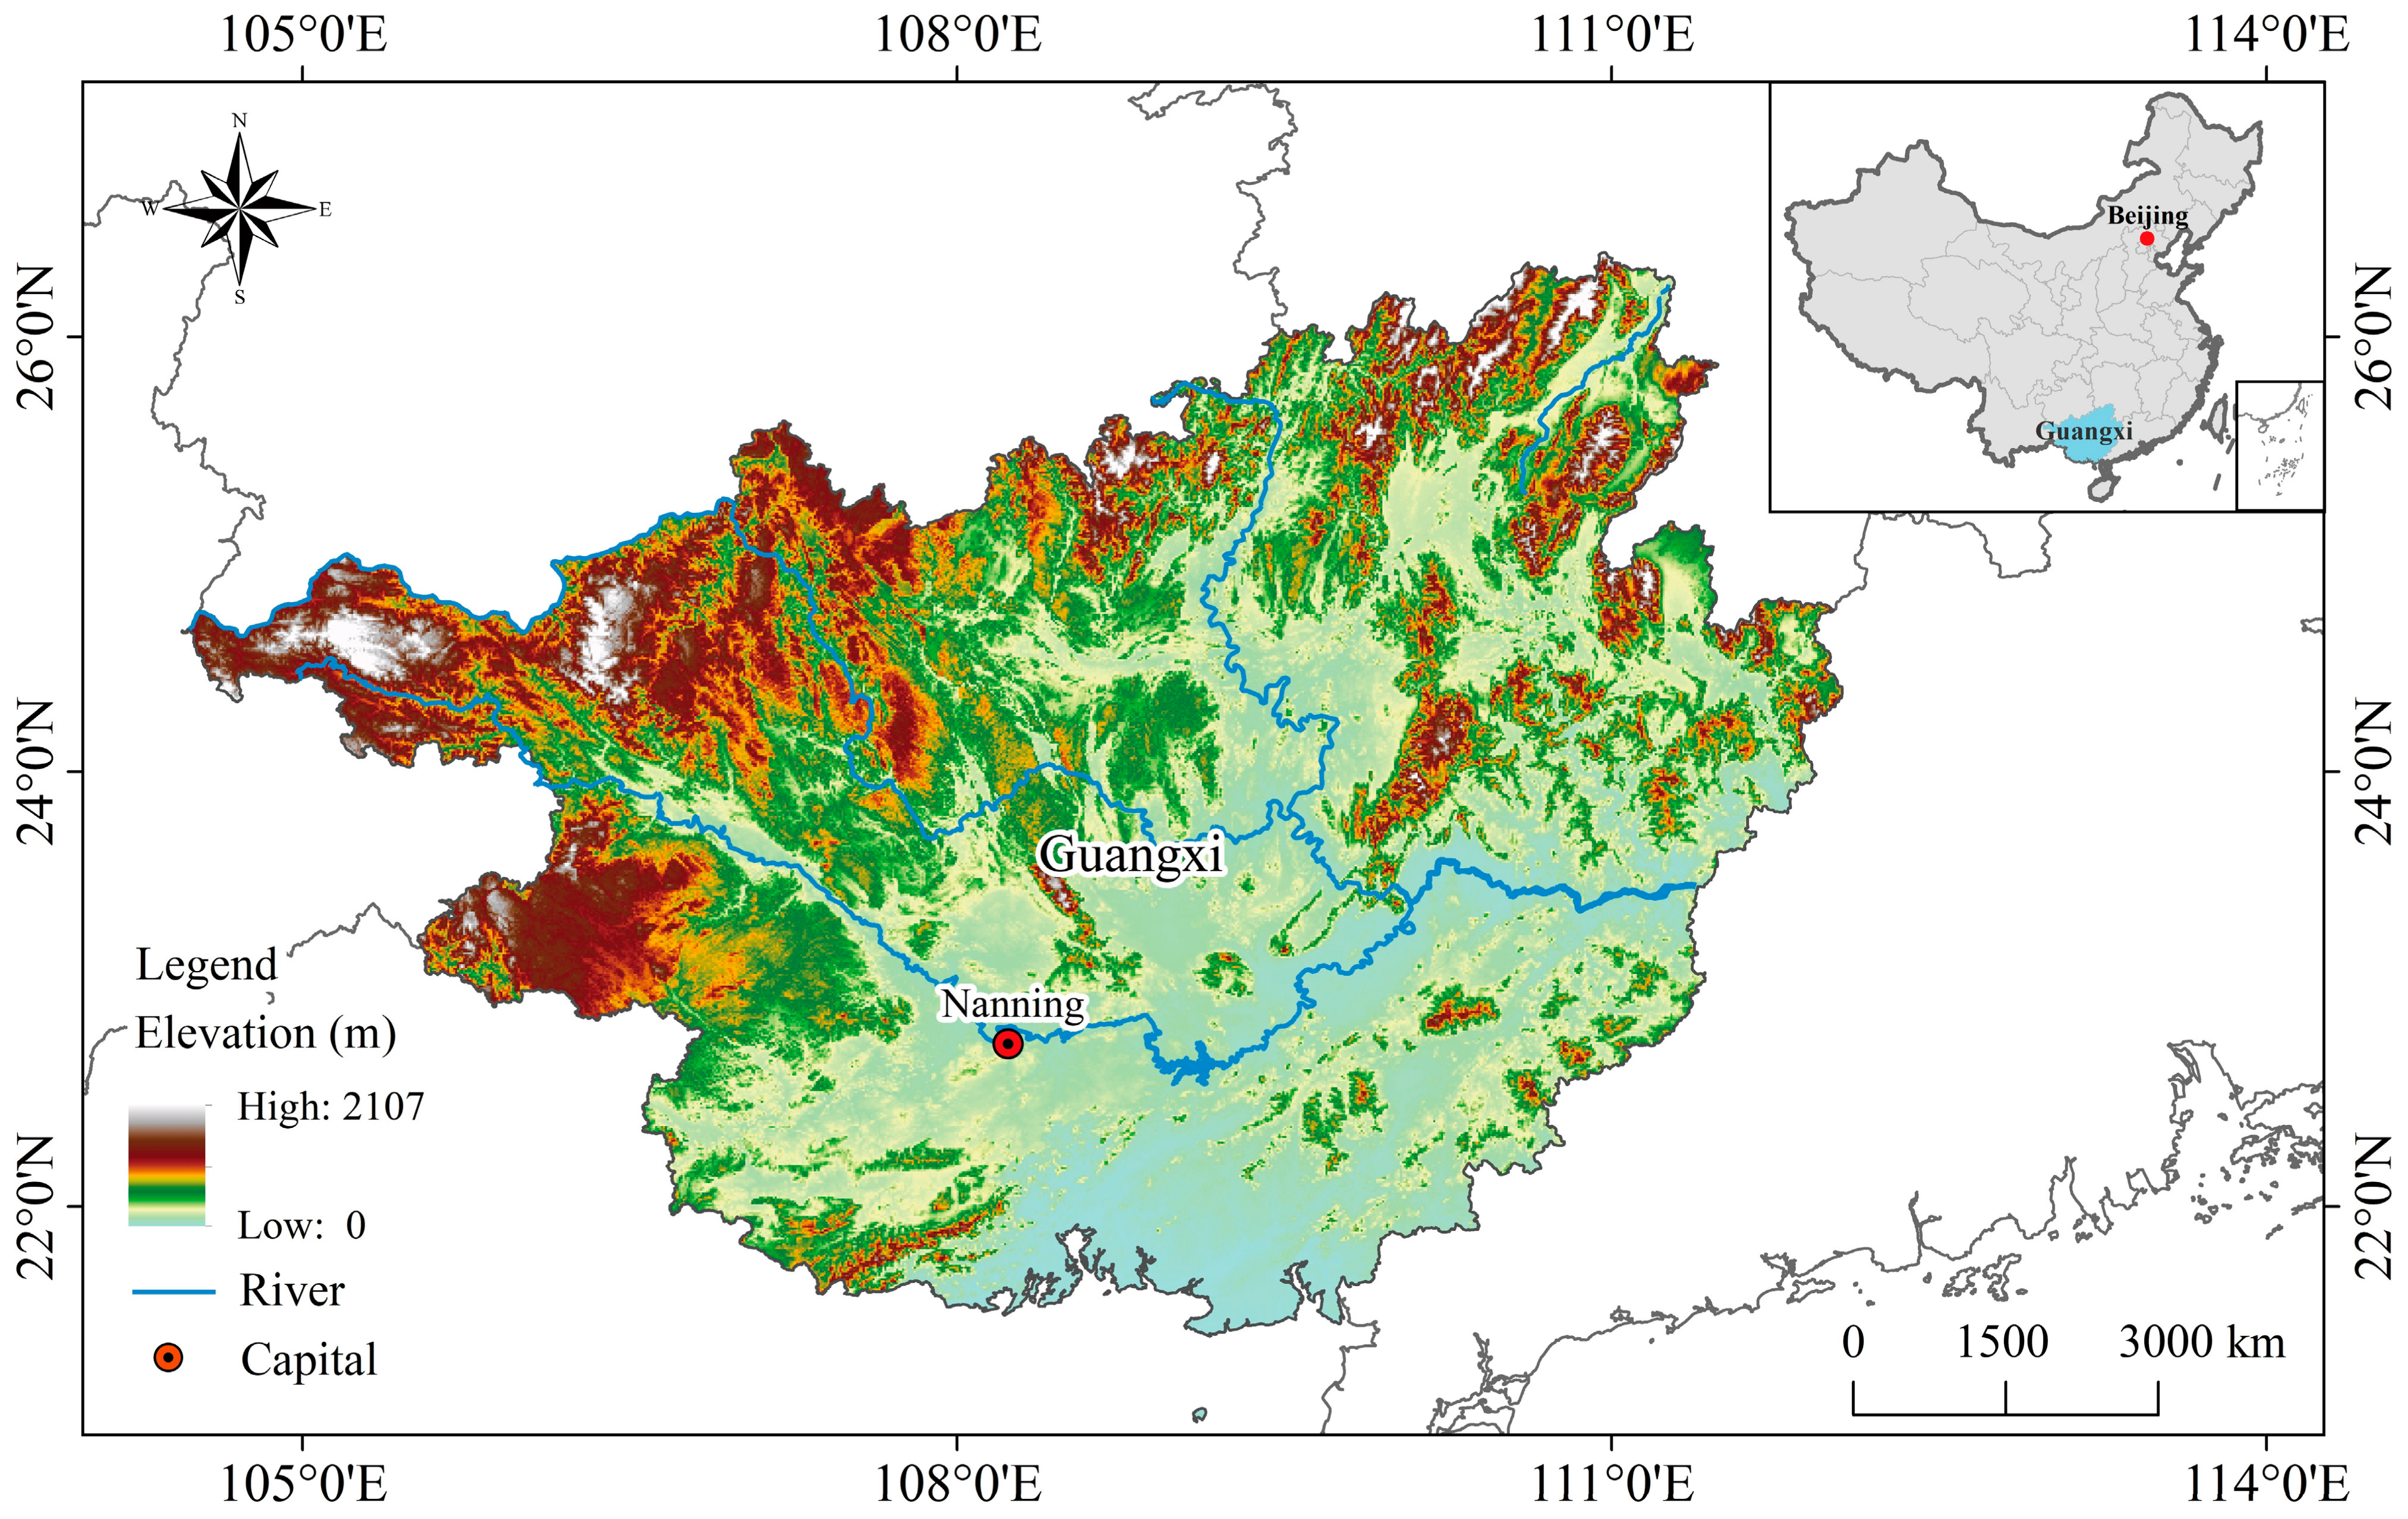
Guangxi is located in southern China, which governs 14 prefecture-level cities, containing a total of 111 counties with an area of 2.38 × 10⁵ km2 (Figure 1). Guangxi is predominantly characterized by a subtropical monsoon climate, with the terrain generally higher in the northwest and lower in the southeast. The topography mainly comprises mountains and hills, with fewer plains. By the end of 2020, Guangxi had a permanent resident population of 50.13 million, a reginal GDP of USD 321.2 billion, and a cultivated land area of 3.31 × 10⁶ hm2. Approximately 70% of cultivated land is distributed in the plains, plateaus, and hilly areas of the eastern and southeastern regions, mainly paddy fields. In the mountainous dis of western and northwest Guangxi, especially in karst areas, cultivated land is scattered in valleys and mostly rain-fed. The main soil type of Guangxi’s cultivated land is red soil, which is relatively infertile due to its low content of organic matter and mineral elements, with fewer high-quality soils [31]. The grain yield per unit area is approximately 10% lower than the national average [32].

Figure 1.
Schematic diagram of the study area.
2.2. Data Sources
The basic data required for this study, including the disposable income of rural and urban residents in each county, the added value of the primary industry, the income composition of rural residents, per capita consumption expenditure and food expenditure of rural residents, the annual resident population, and the cultivated land area of each county were mainly acquired from the “Guangxi Statistical Yearbook 2021”. The agricultural value added was derived from the 2020 government work reports of each county. The data on grain production in the past five years were taken from the “Guangxi Statistical Yearbook” (2017–2021). The land fertility subsidy and grain consumption data were obtained from documents released by the local agricultural bureaus and governments. The per capita minimum living allowance amount was obtained from the “List of Minimum Living Allowance Standards for Urban and Rural Areas in Guangxi in 2020”, published by the Department of Civil Affairs of the Guangxi Zhuang Autonomous Region. The pension insurance and employment security funds were mainly taken from the websites of each county government. The consumer price index was taken from the statistical yearbooks of each city (2017–2021), and the deposit interest rate was sourced from the official website of the People’s Bank of China (http://www.pbc.gov.cn/, accessed on 1 April 2022).
3. Research Methodology
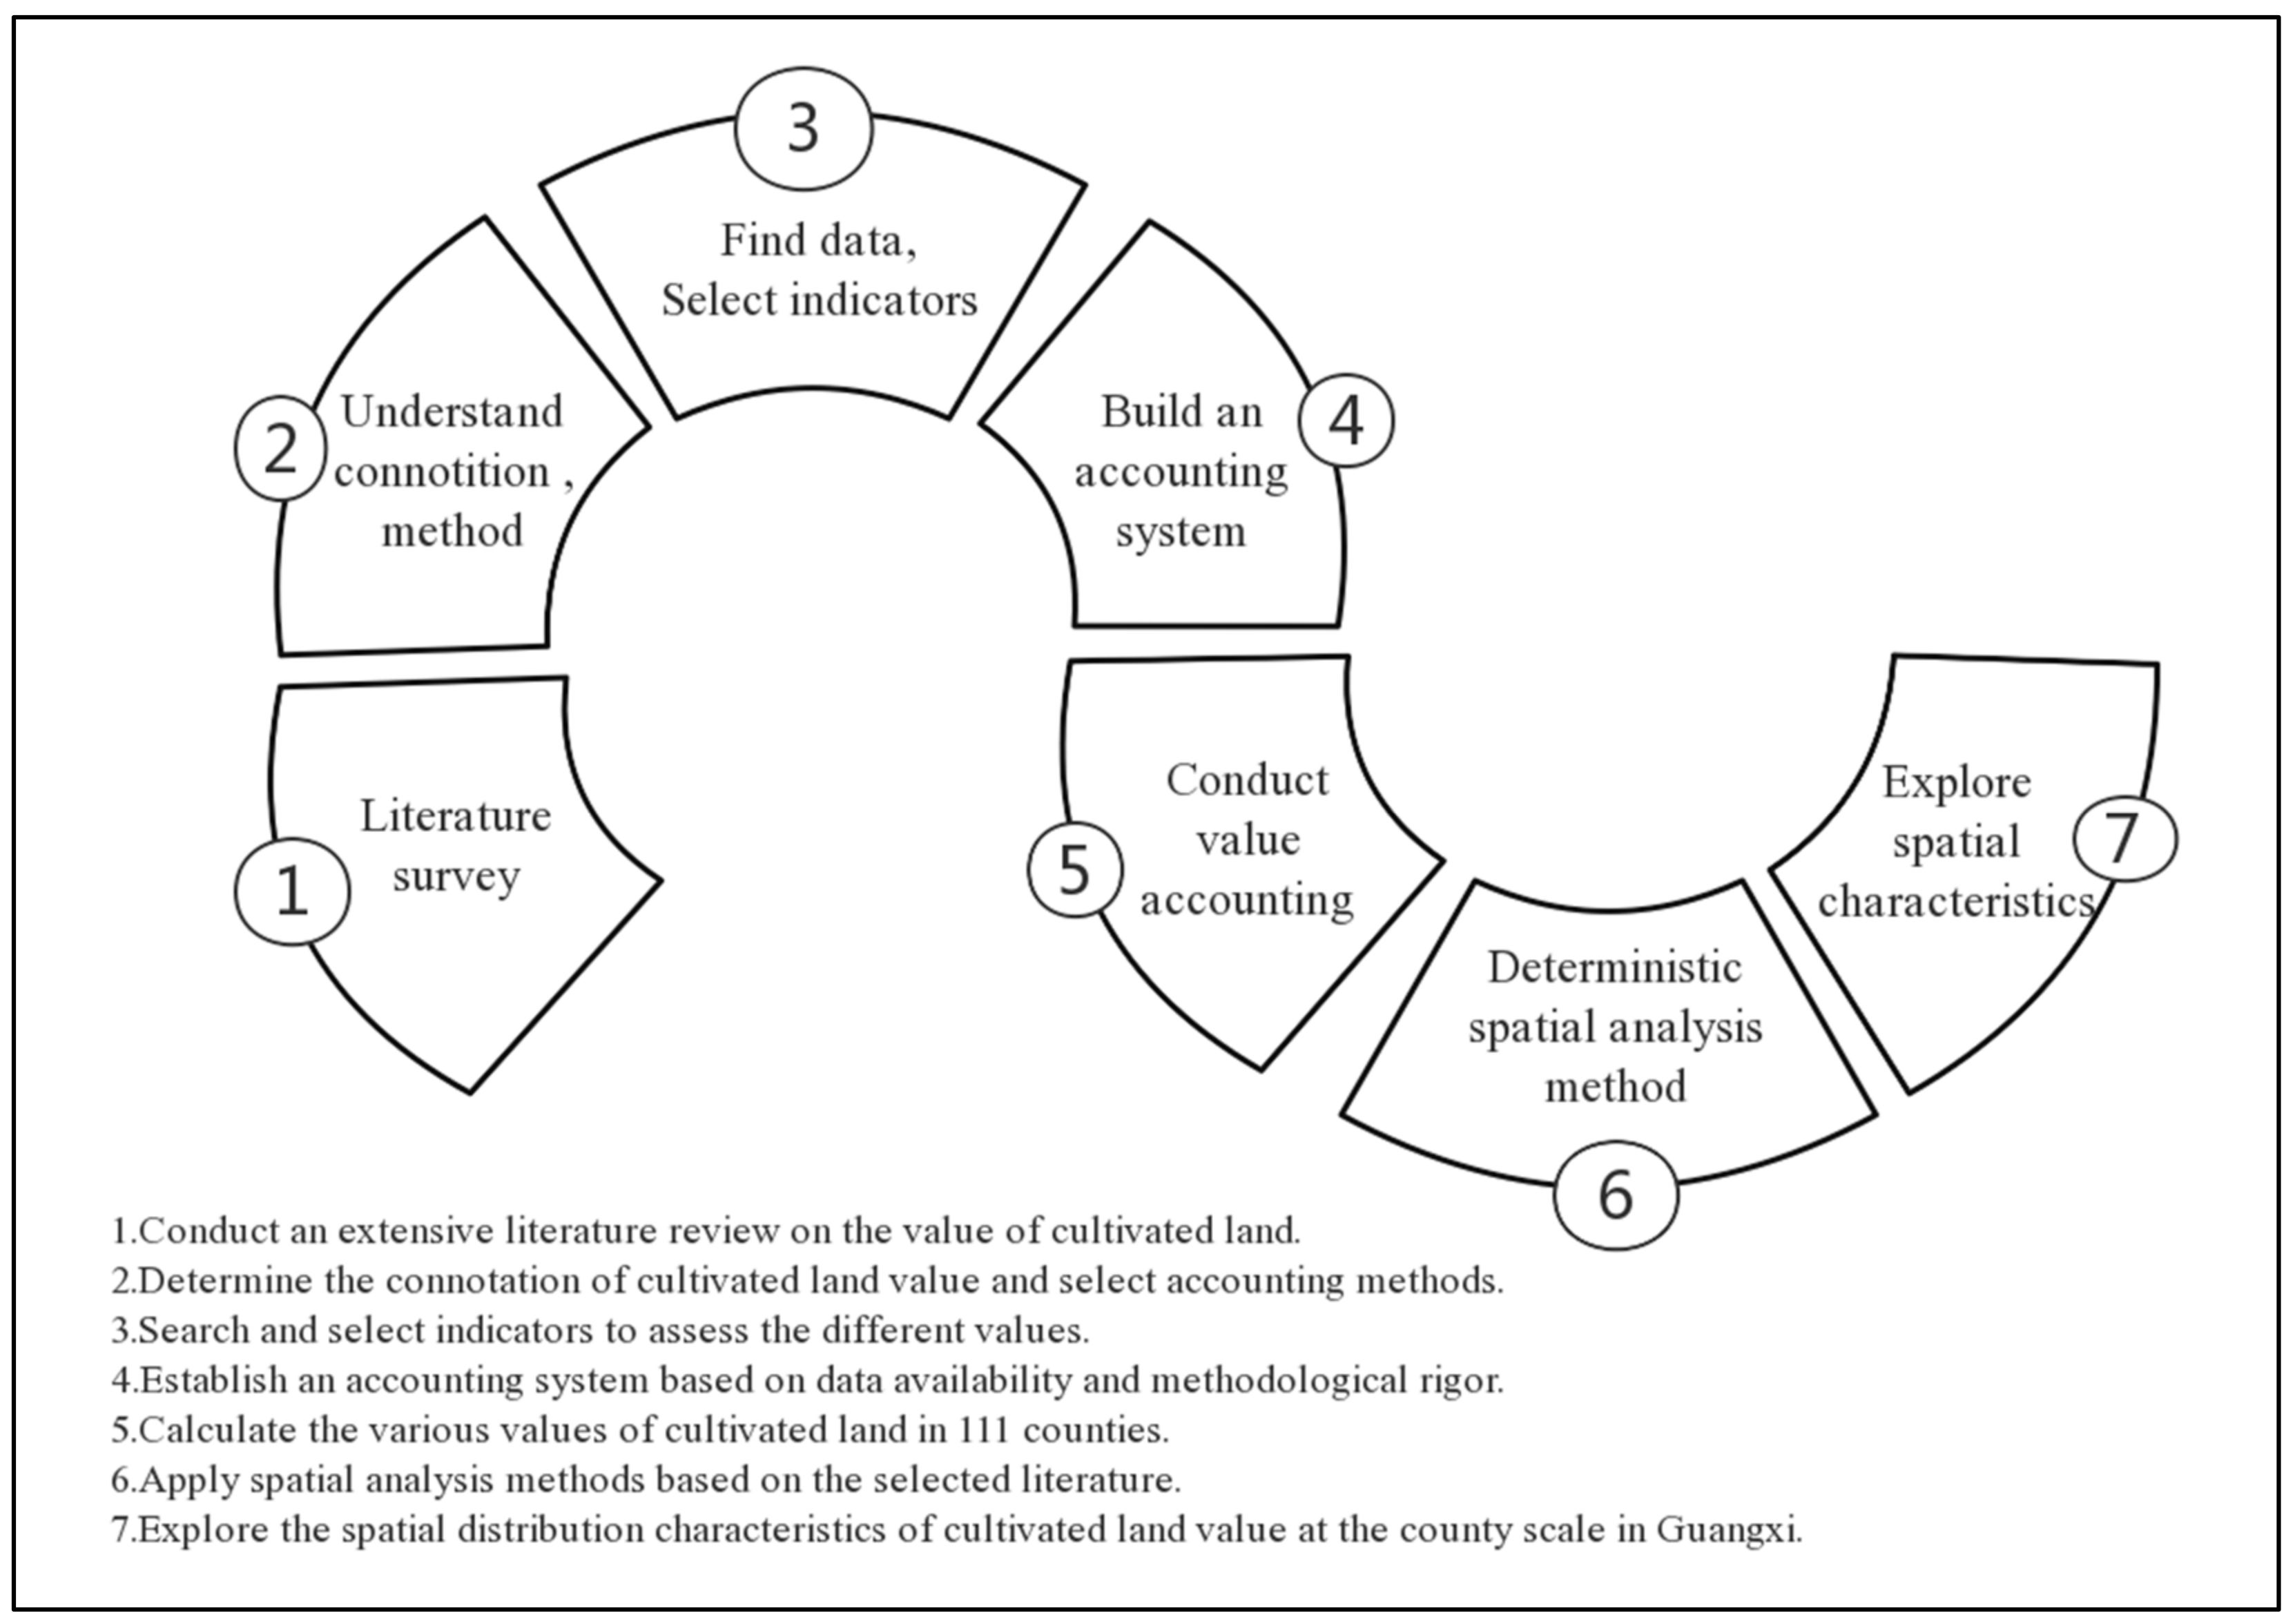
After thoroughly reviewing the pertinent literature regarding the value of cultivated land resources, the underlying connotation of cultivated land value was ascertained. Based on this, indicators reflecting the value of cultivated land were searched for and selected. Taking into account data accessibility and methodological precision, a county-level accounting system for cultivated land value was developed. By employing this system, the multidimensional value of cultivated land was calculated. Finally, spatial analysis methods were chosen to examine the spatial distribution patterns of cultivated land value. The specific methodology flow can be outlined as follows (Figure 2):

Figure 2.
Research method process.
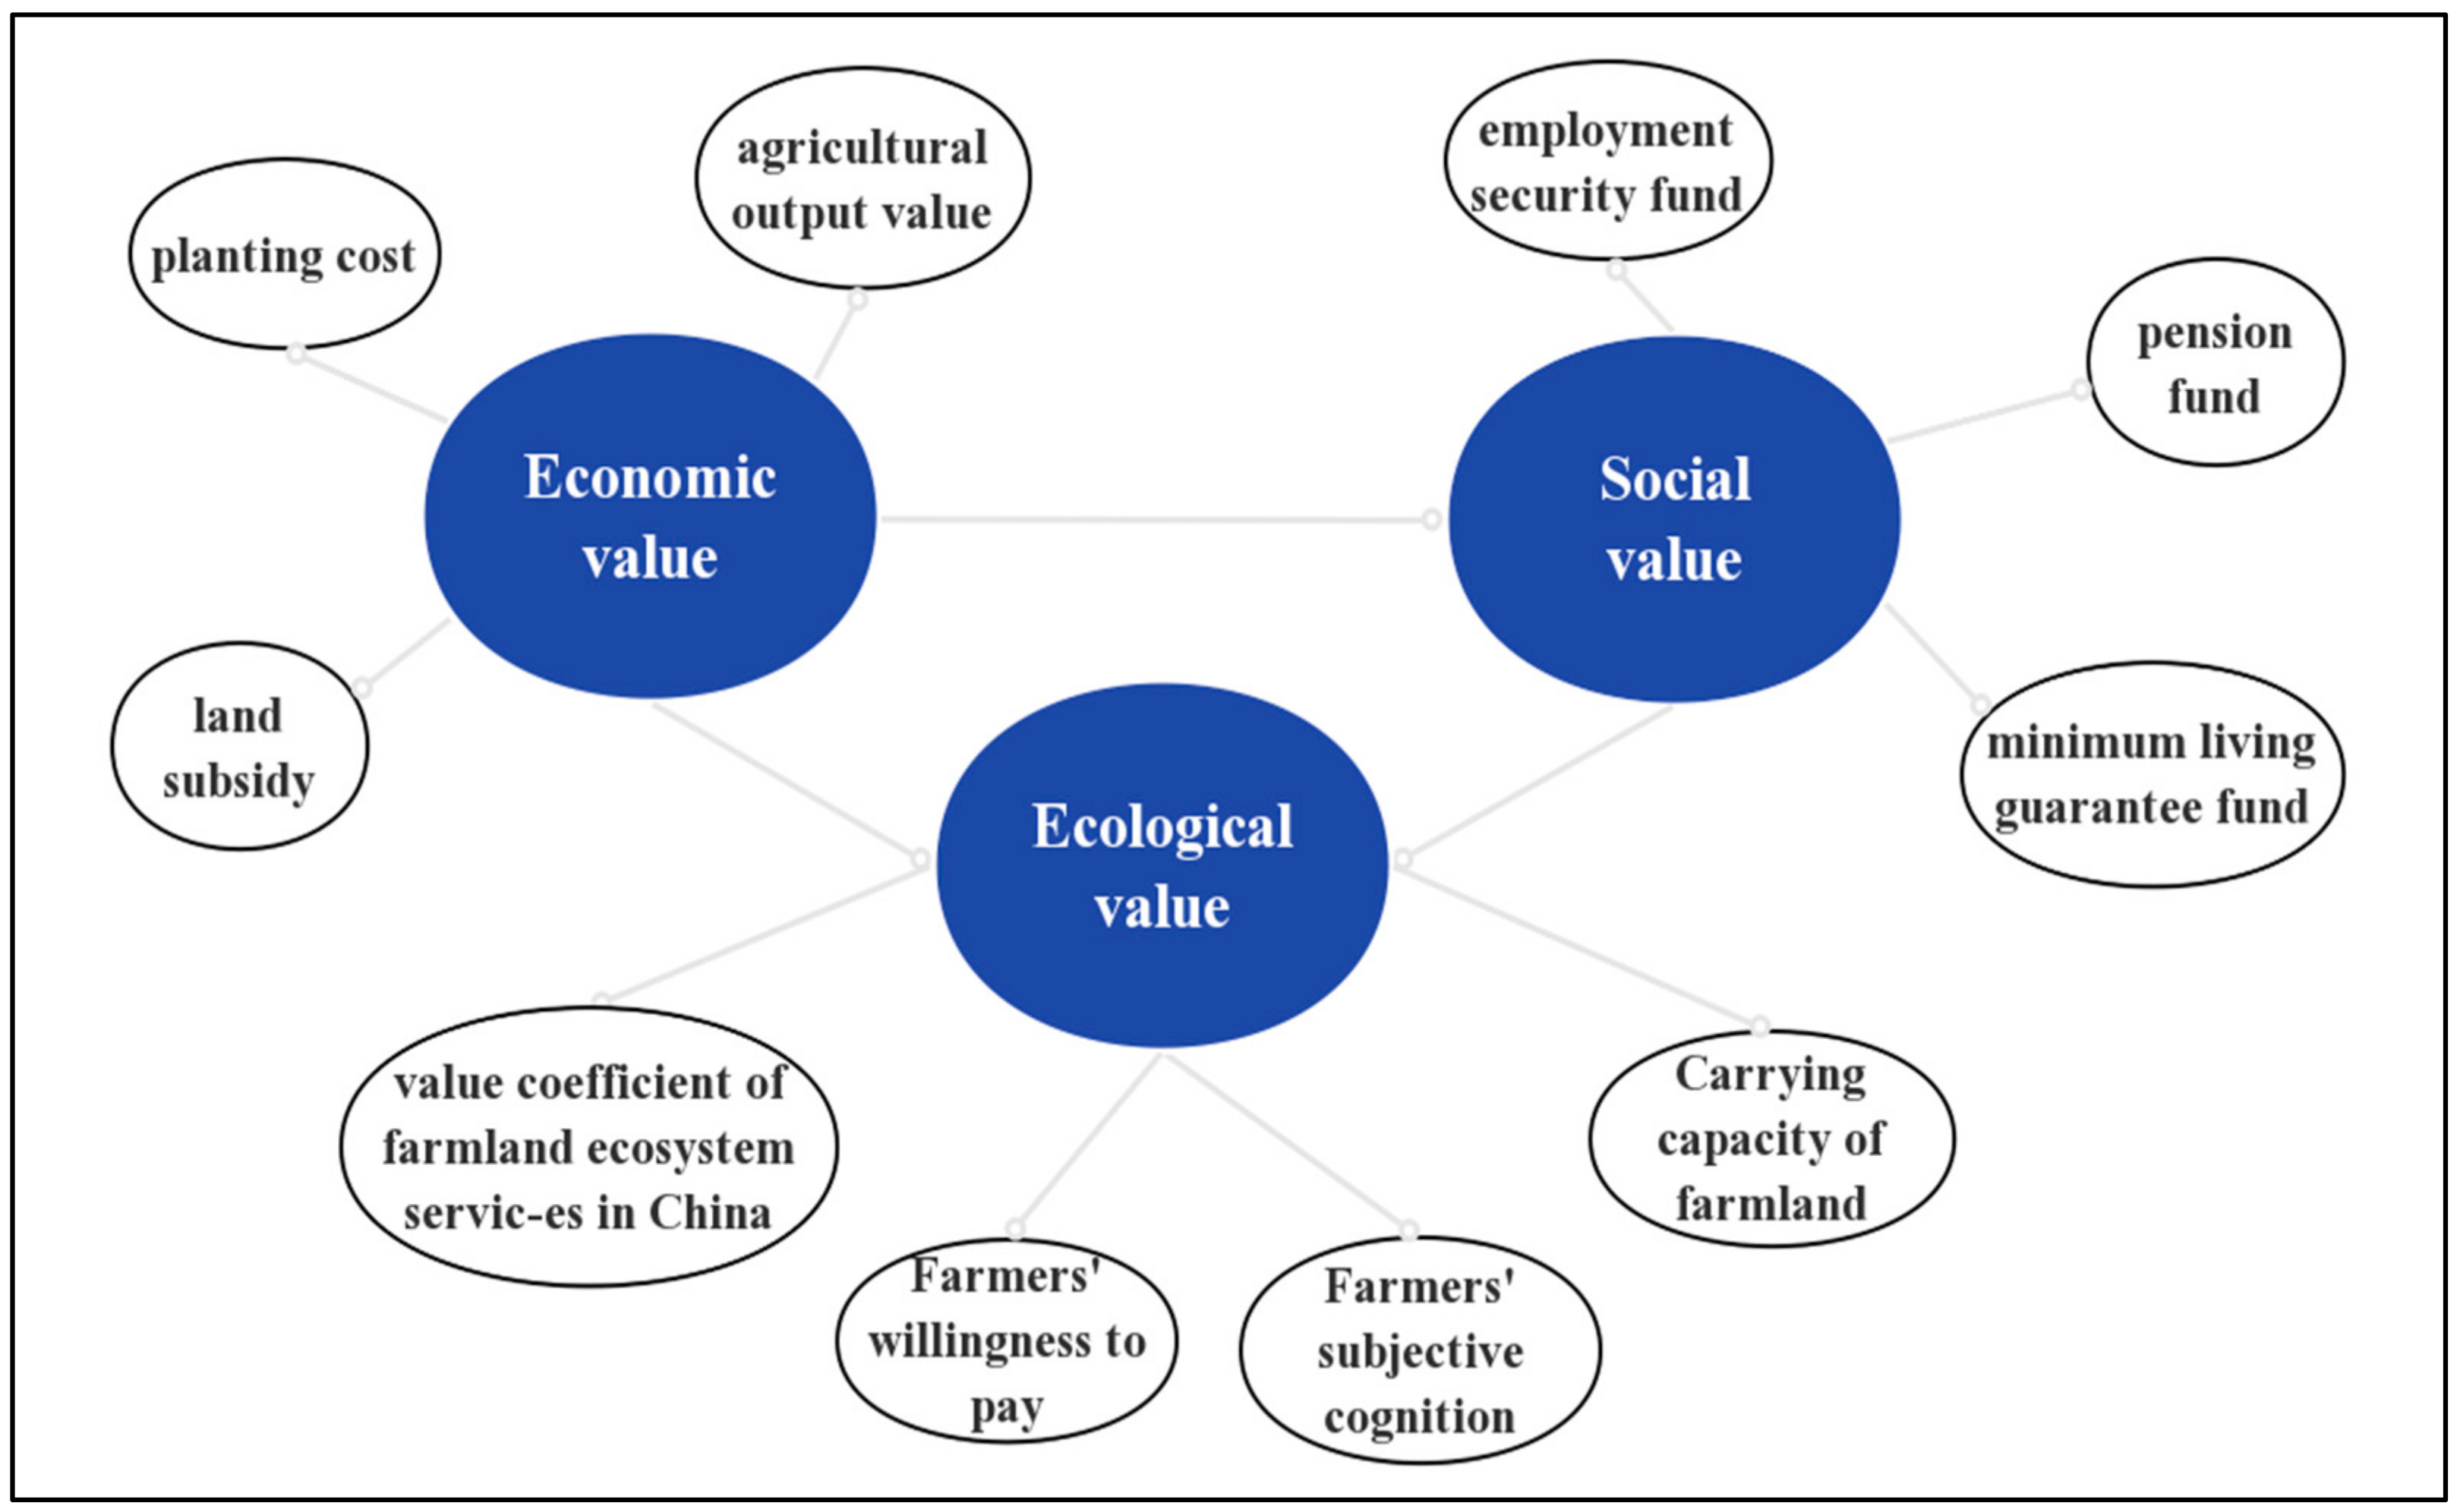
Firstly, we determined the connotation of cultivated land resource value based on a literature review.
Based on an extensive literature review, the study posits that the value of cultivated land resources encompasses three dimensions: economic value, social value, and ecological value. The economic value of cultivated land refers to the worth or economic benefits derived from the allocation of resources and labor in agricultural activities. It is primarily associated with crop production value and cultivation costs. The social value of cultivated land encompasses its role in providing essential support to farming households, such as livelihood, healthcare, and employment opportunities, while also contributing to social stability. This value is closely linked to the economic returns generated by cultivated land, the population that can be sustained through agricultural output, and the provision of employment opportunities. The ecological value of cultivated land pertains to its functional contributions to various aspects of environmental conservation, including climate regulation, water conservation, environmental purification, landscape enhancement, erosion prevention, waste management, and cultural recreation. This value is primarily influenced by factors such as cultivated land quality, specifically its capacity to withstand pressure, as well as subjective perceptions and willingness to pay for the ecological value attached.
Second, we selected accounting methods and indicators (Figure 3) to construct a county-scale accounting system for cultivated land resource value.

Figure 3.
Major indicators of cultivated land value.
The economic value of cultivated land primarily lies in its net income. Currently, accounting methods for assessing this value include income capitalization, cost approximation, and soil generation potential approaches. Among these, the income capitalization method is the most widely used and mature. It offers the advantage of easy data acquisition. Therefore, this study adopted the income capitalization approach to determine the economic value of cultivated land resources in each county. This is achieved by calculating the annual net income of cultivated land resources in each county and applying the discount rate derived from land markets.
The social value of cultivated land reflects the support it provides to planting farmers in terms of livelihood, employment, healthcare, and other aspects. Directly measuring this value proves difficult. Hence, this study employs the market substitution method, selecting indicators such as government-provided pension benefits, unemployment compensation, and minimum living assistance to approximate the social value.
Measuring the ecological value of cultivated land directly is a challenging task. Currently, domestic scholars widely amend the calculated value of the ecological service system for cultivated land resources by Xie Gaodi [31] to determine the ecological value within the study area. Therefore, this study employs the value equivalent correction method, using the coefficients of cultivated land bearing capacity and social development as adjustment criteria. It aims to assess and modify the service value of the cultivated land ecosystem, as computed by Xie Gaodi under average conditions. Consequently, the ecological value of cultivated land resources in various counties of Guangxi is derived.
Based on the above indicators, this study adopted the income capitalization method, market substitution method and value equivalent correction method to construct the value accounting system of cultivated land resources at the county level in Guangxi.
Third, we selected the spatial analysis method to explore the spatial distribution characteristics of cultivated land resources value.
According to the first law of geography, “everything is related to everything else, but near things are more related than distant things”. Due to the natural conditions, the value of cultivated land resources often exhibits spatial dependence. Adjacent areas influence each other in terms of cultivated land value, while significant differences exist across different geographical locations. Spatial autocorrelation can be employed to identify spatial clustering patterns and spatial heterogeneity of cultivated land values, revealing underlying geographic rules and trends. This helps in better analyzing the influencing factors of cultivated land value and formulating measures for its protection.
Commonly used indicators and methods for global spatial autocorrelation include Global Moran’s I, Geary’s C, and Getis’ C. Geary’s C is more sensitive to outliers, making it suitable for situations with data containing outliers or significant variations. Getis’ C is primarily used to detect local spatial clustering and dispersion phenomena. Global Moran’s I provides a comprehensive analysis and assessment of spatial clustering, allowing for intuitive interpretation of results and significance testing. It is more suitable for exploring the spatial distribution characteristics of cultivated land value at the county scale, while Local Moran’s Index can pinpoint specific locations of clustering.
Therefore, in this study, based on the results of value calculation, ArcGIS software is used to perform spatial zoning of cultivated land value using the natural breaks method. Furthermore, Geoda software was employed to conduct both global and local spatial autocorrelation analysis of these values. The Moran’s I index was utilized to explore regional differentiation characteristics.
3.1. Methodology for Measuring the Economic Value of Cultivated Land Resources
The income capitalization method is a valuation method that converts the future total income into the total value of cultivated land at a specific rate. This method relies on estimating the anticipated annual net income of the cultivated land in the future. Considering that the current family land contract can be extended for another 30 years after the expiration, thus the correction coefficient of the use life is about 1, the formula can be simplified as follows:
where V1 represents the economic value of cultivated land per unit area, a represents the net income per unit area of cultivated land, and r represents the land capitalization rate.
3.1.1. The Formula for Measuring the Net Income of Cultivated Land (a)
The net income of cultivated land is related to the total income and total costs. Moreover, in recent years, the government’s subsidy for cultivated land has also increased the net income of cultivated land to some extent. Therefore, we improved the original formula by incorporating the subsidy for cultivated land, making the results more closely related to the actual value of cultivated land resources. The revised formula is as follows:
where a represents the net income per unit area of cultivated land. Gc represents the total agricultural output value in the county, Gf represents the total cost of cultivated land, and “Gc − Gf” can be replaced by the local agricultural added value in the county. m represents the area of cultivated land in the county, and L represents the subsidy per unit area of cultivated land in Guangxi.
3.1.2. The Formula for Measuring Land Capitalization Rate (r)
The land capitalization rate represents the proportion of anticipated annual net income from cultivated land, restored uniformly, to the total evaluated land value. Essentially, it serves as an indicator of capital investment return and provides an estimate of the future annual yield rate of the land. Considering the actual situation of the research area and referring to existing research results [33,34], we adopted the model of safety rate plus risk adjustment value to calculate the land capitalization rate, as follows:
where r represents the land capitalization rate, N represents the total number of months in a year (12 months), ri represents the one-year fixed deposit interest rate for the i month within a year, and t represents the risk adjustment value, which is calculated by estimating the average rate of change in the Consumer Price Index (CPI) for residential consumers in the selected city from 2015 to 2020.
3.2. Methodology for Measuring the Social Value of Cultivated Land Resources
Social value can be divided into social security value and social stability value, of which the social security value can be further divided into pension security value and employment security value. However, farmers may also participate in non-agricultural activities to earn income. Therefore, we use the ratio of per capita annual agricultural net income to other income as a correction factor to reflect the degree of farmers’ dependence on cultivated land. The formula is as follows: V2 represents the social value of cultivated land:
3.2.1. The Formula for Calculating the Value of Social Security (Vb)
Social security value (Vb) includes pension security value (Vby) and employment security value (Vbj). Due to the incomplete social security system in rural areas of China, most rural elderly people rely on cultivated land as their pension and economic source. Therefore, cultivated land plays a significant role in providing pension security value for rural residents. In this study, we use the substitution market method to replace the pension security value of cultivated land with the pension insurance income of new rural residents based on the land capitalization rate with the following formula:
where Vby represents the amount of pension security value, Y represents the amount of new rural social pension insurance in Guangxi (in USD/person), P represents the per capita cultivated land area in the county (in hectare/person), and r is the land capitalization interest rate in the city.
3.2.2. The Formula for Calculating the Value of Employment Security (Vbj)
On the other hand, as most rural residents make their living by growing crops, cultivated land also plays the role of employment security. Since China’s rural employment security system is not yet perfect, we refer to the urban residents’ unemployment insurance system and use the ratio of urban and rural residents’ disposable income to correct urban residents’ unemployment insurance benefits with the following formula:
where I1 represents the per capita disposable income of rural residents in the county (in USD/person/year), I2 represents the per capita disposable income of urban residents in the county (in USD/person/year), and U represents the unemployment insurance benefit for urban residents in Guangxi (in USD/person/year). P and r are the same as those in Equation (6).
3.2.3. The Formula for Calculating the Value of Social Stability (Vs)
The social stability value of cultivated land is to ensure national food security and maintain social stability. From the perspective of food security, we choose the minimum subsistence guarantee per capita for rural residents as an indicator; the formula is as follows:
where Vs represents the social stability value of cultivated land, B represents the minimum living guarantee amount per capita in rural areas of the county (in USD/person/year), k represents the population that can be supported by cultivated land per unit area of the county (in person/hectare), and r is the same as in Equation (6).
3.3. Methodology for Measuring Ecological Value of Cultivated Land Resources
Xie Gaodi [25] developed a national, regional land ecosystem services value assessment system. However, this system has significant limitations in studying the ecological value of cultivated land in small-scale areas (e.g., county and township areas). Therefore, referring to the existing research [30], we adopt the value equivalent correction method and use the social development stage coefficient and cultivated land carrying capacity coefficient as correction coefficients. The social development coefficient reflects people’s subjective understanding of the cultivated land ecosystem services value and their willingness to pay, while the cultivated land carrying capacity coefficient reflects the ecological relationship between the supply and demand of cultivated land per unit area. The formula is as follows:
where V represents the ecological value of cultivated land resources (in USD /hm2), Ve represents the value coefficient of cultivated land ecosystem services in China (745.06 USD /hm2), D represents the cultivated land carrying capacity coefficient, L represents the social development coefficient, and r is the same as above.
3.3.1. The Formula for Calculating Social Development Coefficient (L)
The changing process of people’s subjective perception of ecological value of cultivated land and willingness to pay is very similar to that of biological growth, so this paper adopted the Peel growth curve [35] as a model for estimating the coefficient of ecological value development stages, the formula is as follows:
where L represents the coefficient of social development stage, e represents the base number of natural logarithms, and En represents the Engel coefficient of the county in 2020.
3.3.2. The Formula for Calculating Carrying Capacity Coefficient (D)
The carrying capacity coefficient of cultivated land is measured using the ratio of local food supply (EC) [36] to demand (EF) [37] with the following equation:
where D represents the coefficient of cultivated land carrying capacity, EC represents ecological supply, EF represents ecological demand, W is the annual grain production of the county in 2020 (kg), P represents the average annual grain production in the past five years of the county (kg), eF means the equivalent factor of cultivated land, which follows the standard proposed by the World Wildlife Fund, i.e., 2.21. T represents the per capita annual grain consumption of the county (kg/person), Y represents the resident population (people), and yF is the production factor, which is based on the international standard of 2.8 [37].
3.4. Spatial Autocorrelation Analysis Method to Explore the Distribution of Cultivated Land Value
3.4.1. Determination of the Spatial Weight Matrix
The spatial weight matrix can represent the degree of association between different spatial objects, which is expressed as follows:
The adjacency matrix is the preferred method to create a spatial weight matrix. The adjacency matrix can be further divided into Bishop adjacency, Rock adjacency, and Queen adjacency, where Queen adjacency is a combination of Bishop adjacency and Rock adjacency, so we used the Queen weight method in the adjacency matrix as follows:
3.4.2. Global Moran Index
The global Moran index can be used to describe the average correlation of all small units in the whole space with the surrounding area, and to detect spatial differences caused by spatial correlation, which is calculated as follows:
In Equation (16), n is the total number of spatial units, yi and yj represent the value of county i and county j, respectively, is the average value of cultivated land in all counties, and wij is the spatial weight value. In addition, the global Moran index value is between −1 and 1. A value greater than 0 indicates that the attribute values of all regions have a positive spatial correlation, while a negative value means a negative correlation, and when the value equals to 0, the regions are randomly distributed and there is no spatial correlation.
The index for testing the global Moran index is the z-value; the formula is as follows:
where the expected value E(I) and variance Var(I) are calculated as follows:
3.4.3. Local Moran Index Statistics
By decomposing the global space into local or individual spaces, the local Moran index can calculate the spatial correlation of individual units in the region and the local characteristic differences existing in the distribution and reflect the spatial heterogeneity and instability of the local region. It is usually represented by the Moran scatter diagram and Lisa agglomeration diagram; the calculation formula is as follows:
and
Ii is the local Moran index of the county i, wij is the spatial weight value, n is the total number of counties, yi, yj and are the same as the above.
The formula for calculating the indicators for testing the local Moran’s I index are the same as that in Equations (17)–(19).
4. Results and Analysis of Cultivated Land Resource Value
4.1. Calculation Results
The value of cultivated land per hectare in 111 counties in Guangxi in 2020 was calculated via the income capitalization method, substitution market method and the value equivalent correction method. ArcGIS software was used to output the distribution of cultivated land resource values in Guangxi at the county level using the natural breakpoint method (Figure 4).
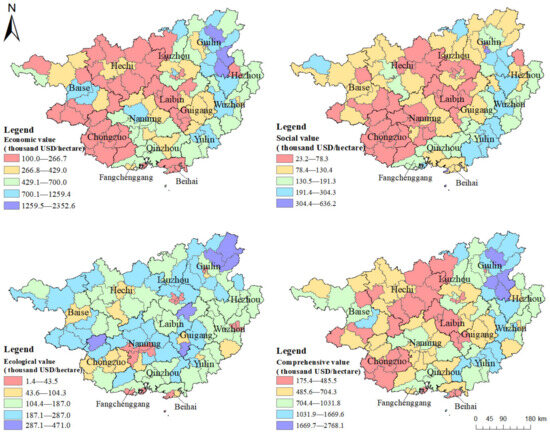
Figure 4.
Distribution of cultivated land resource values at the county scale in Guangxi.
4.2. Analysis of Results
(1) The cultivated land resources in Guangxi possess enormous value, with a total value of USD 2859.3 billion in 2020. Economic value constitutes the largest proportion, accounting for a total of USD 1674.2 billion, while the social and ecological values are USD 417.7 billion and USD 767.3 billion, respectively. The three values are in a ratio of approximately 6:1:2. Furthermore, the economic, social, ecological, and comprehensive values of cultivated land resources per hectare are USD 485,000, USD 133,000, USD 157,000, and USD 775,500, respectively.
(2) In general, the value of cultivated land per hectare in Guangxi County is predominantly influenced by its economic worth, while social and ecological values tend to be comparatively lower, displaying significant differences in their internal distribution across functional values. Counties with high economic value exhibit a north–south strip-like distribution along the eastern border of Guangxi, encompassing areas from the southern region of Guilin City to the Xunjiang Delta and Yulin Basin. These counties possess flat topography and abundant water and heat resources, resulting in a higher economic value for cultivated land. Conversely, low-value counties are concentrated in the western and central regions, especially in Chongzuo and Hechi cities. The natural conditions in these areas impose limitations that result in a generally lower economic value of cultivated land.
(3) The social value of cultivated land in Guangxi’s counties is generally low, and its per hectare social value exhibits distribution patterns similar to that of economic value. This observation suggests that higher economic benefits derived from cultivated land correspond to stronger social security provided for farmers. Overall, regions characterized by relatively underdeveloped economic conditions, such as the counties in Hechi, Chongzuo, and Laibin cities, exhibit limited social benefits derived from cultivated land. However, in the central urban areas of Nanning and Liuzhou, where industrial development is advanced and rural residents are primarily involved in secondary and tertiary sector activities, there is a reduced reliance on cultivated land. Consequently, the social security value provided by cultivated land is also relatively lower.
(4) In terms of the ecological value of cultivated land per hectare, the municipal districts of Guangxi are generally low, while the counties far from the city center have obvious ecological advantages due to their low urbanization level and high quality of cultivated land. The spatial distribution pattern of comprehensive value is similar to that of economic value. In addition, the quantity as well as the quality of cultivated land is decreasing because of the continuous urban expansion, so the comprehensive value of cultivated land in most municipal districts is lower.
5. Spatial Distribution Characteristics of Cultivated Land Resource Values
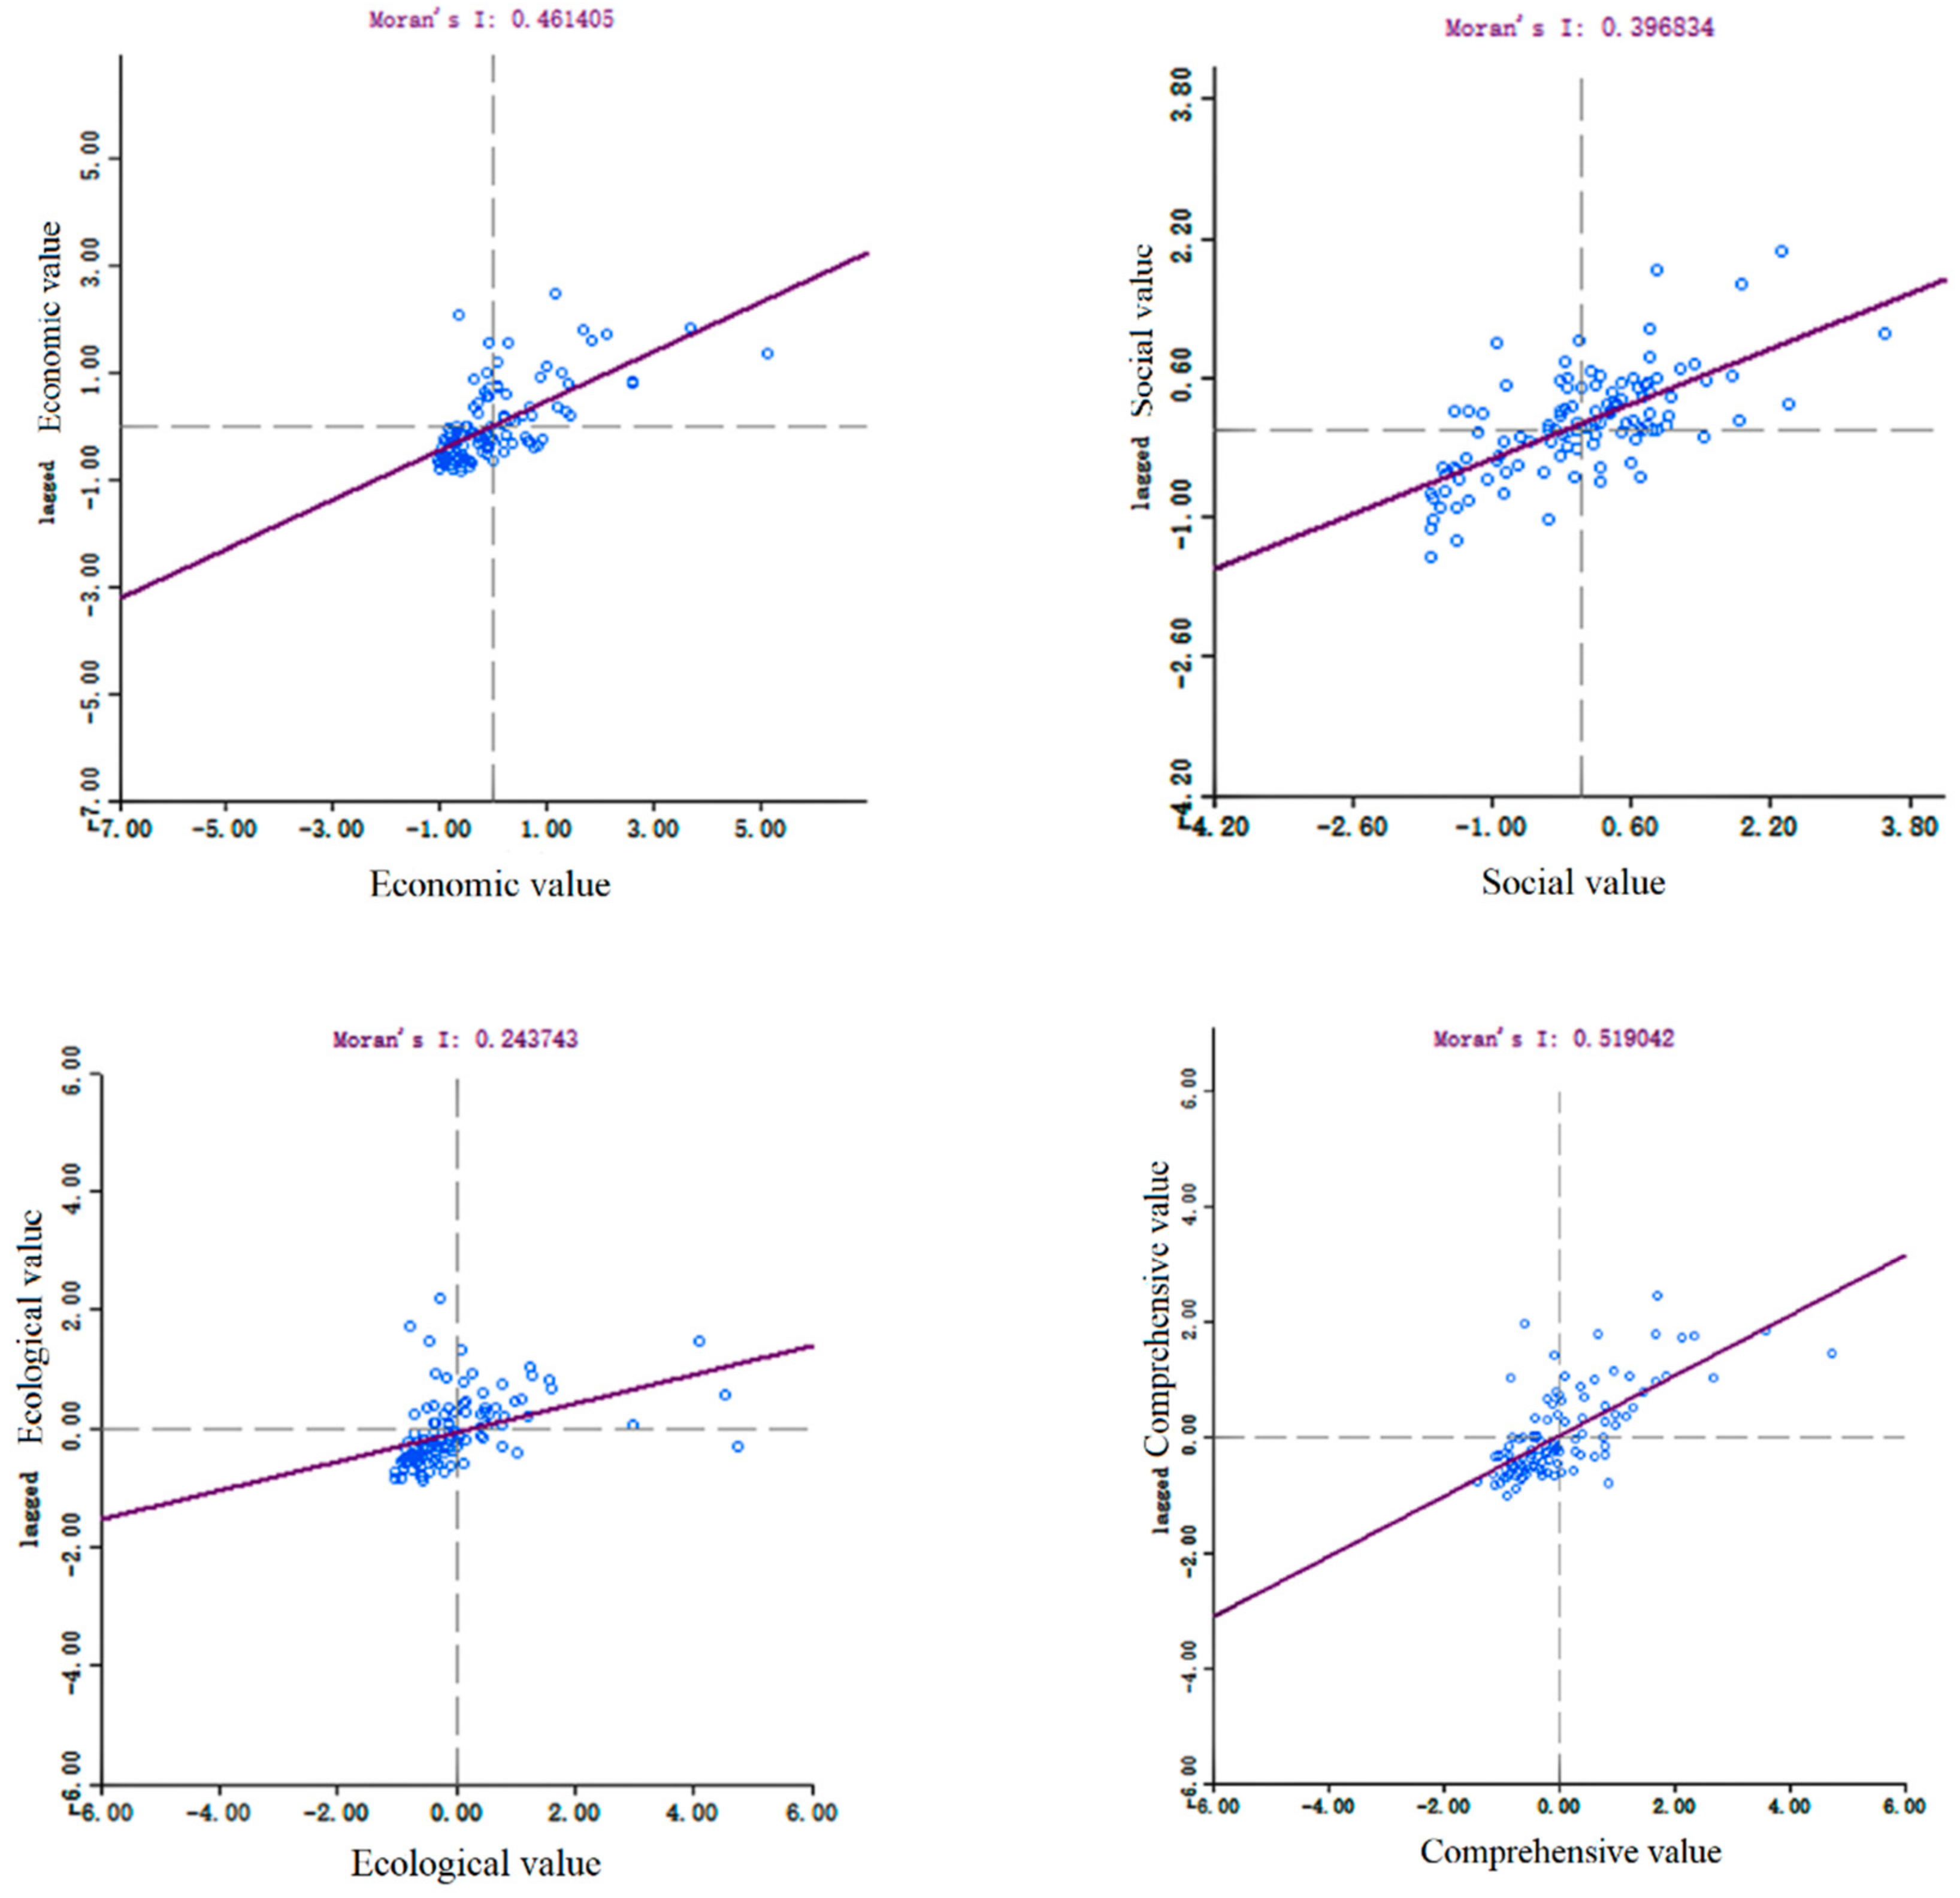
5.1. Global Spatial Autocorrelation Characteristics of the Value Distribution
As shown in Table 1, the global Moran’s I index of the four values of cultivated land resources in Guangxi are all greater than 0, and the Z-scores are all greater than 1.96, indicating a positive spatial correlation. Moreover, Montecarlo simulation tests all passed in the 99.9% confidence interval (i.e., all p-values were 0.001), showing that significant spatial agglomeration characteristics exist. Additionally, Moran’s I indices of the average economic value and comprehensive value are significantly higher than those of the other two values, indicating that the agglomeration phenomenon of these two values is more prominent.

Table 1.
Global spatial autocorrelation characteristic index of cultivated land resource value in Guangxi counties.
5.2. Local Spatial Autocorrelation Characteristics of the Value Distribution
The global Moran’s I index reveals the overall correlation of cultivated land resource values in Guangxi counties but cannot identify the specific agglomeration areas. Therefore, this paper conducts local spatial autocorrelation analysis via GeoDa, draws a local Moran scatter plot (Figure 5) at the 0.05 significance level, and counts the points in each quadrant (Table 2). It can be seen that except for the counties that are not significant, the values of cultivated land resources in Guangxi counties are unevenly distributed in the four quadrants, showing four agglomeration patterns: high–high, low–low, high–low, and low–high. Among them, the first quadrant and the third quadrant have the highest number of points, indicating that the “high-high” and “low-low” agglomeration patterns are the most common. This further confirms that the phenomenon of “polarization” between high-value areas and low-value areas is more pronounced.
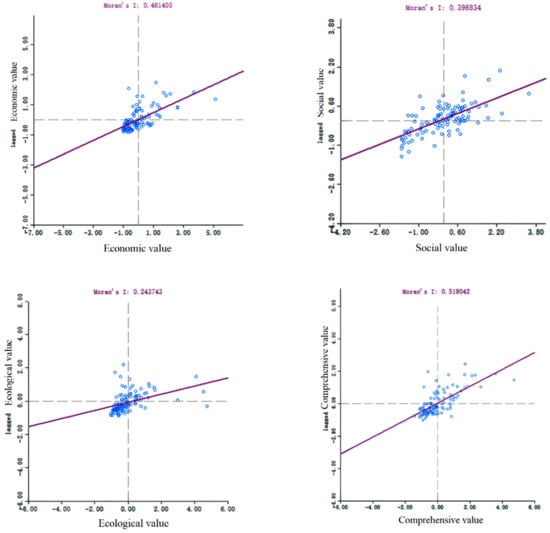
Figure 5.
Moran scatter plot of average value of cultivated land resources in Guangxi counties.
Table 2.
Local spatial autocorrelation characteristics of the average value of cultivated land resources in Guangxi counties.
To represent the areas of value clustering more intuitively, the Lisa clustering map of cultivated land resource values was exported via GeoDa (Figure 6).
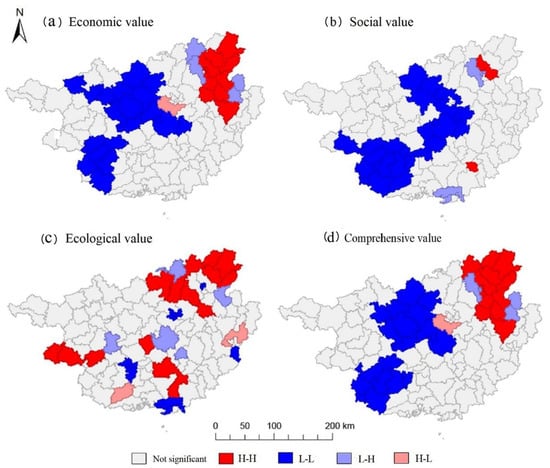
Figure 6.
LISA agglomeration map of average value of cultivated land resources in Guangxi counties.
From Figure 6, we can see that the spatial clustering of each value of cultivated land resources in Guangxi varies, with the economic, social and comprehensive values clustered in “low-low” and the ecological values in “high-high”. The “high-low” and “low-high” clustering areas of the four values are relatively few and show a sporadic distribution.
(1) In terms of economic value, the “high-high” agglomeration areas are concentrated in the northeastern region. This area benefits from multiple rivers like the LiJiang River, has abundant hydrothermal resources and fertile land, so the natural conditions are superior.. Counties such as Ziyuan, Guanyang, and Quanzhou serve as significant food production bases, while Gongcheng and Yangshuo County excel in specialty agriculture. For instance, Gongcheng County focuses on leading industries like persimmons, oil-tea camellia and plums. Yangshuo County has successfully combined agriculture with tourism, and Lipu County specializes in crops like taro. These efforts have greatly boosted the economic benefits derived from cultivated land. Conversely, the “low-low” agglomeration areas are predominantly found in central and northern Guangxi, as well as the southwestern region. Most counties in these areas are situated in karst landform regions, where cultivated land is limited and fragmented, with steep slopes posing challenges for irrigation. Additionally, severe rocky desertification has led to poor soil quality. In the southwestern border areas, which are mountainous and complex due to their proximity to Vietnam, these counties face unfavorable natural conditions, underdeveloped transportation infrastructure, low levels of economic development, and limited agricultural technology. Farmers primarily rely on traditional cultivation methods, resulting in lower overall economic efficiency.
(2) In terms of social value, the “high-high” agglomeration areas are mainly located in Yangshuo County and Yanshan County. These two counties, serving as pilot areas for the integration of urban and rural subsistence allowances, have achieved a unified minimum living guarantee standard of USD 1304 per person per year. It has significantly increased the social security value of cultivated land and has positive spillover effects on the surrounding counties. Additionally, the surrounding counties of the city center in Yulin are also “high-high” agglomeration areas in terms of social value. The local topography is flat, with abundant water and heat resources, and the majority of rural residents rely on agriculture for their livelihoods; they have obtained higher economic returns. Therefore, cultivated land has given full play to its social security function. Conversely, the “low-low” agglomeration areas are mainly located in Hechi, Laibin, and Chongzuo, which are relatively less developed in terms of economy. The counties in Hechi and Chongzuo are mountainous, with less flatlands, steep slopes, poor farming conditions, and backward agricultural technology. Therefore, rural residents mostly use traditional grain farming methods, resulting in low productivity of cultivated land. Laibin City’s industrial structure is dominated by secondary and tertiary industries, with a large outflow of rural labor and a low quality of labor force. Rural residents have less income from operating cultivated land, and cultivated land has failed to fully play its social security function.
(3) In terms of ecological value, the “high-high” agglomeration areas are distributed in a circular pattern around the center of Guilin City, located in the northeastern corner of Guangxi. These counties are relatively distant from urban areas and have a lower level of urbanization. They are blessed with multiple rivers, such as the LiJiang River, Xiang River, and Gui River, resulting in a favorable ecological environment and high-quality cultivated land. Although the terrain is predominantly mountainous and the cultivated land is somewhat scattered, local governments prioritize agricultural development, continuously improving rural land through measures like constructing high-standard farmland and transforming low-productivity fields. These efforts have significantly enhanced the ecological benefits derived from cultivated land. Furthermore, Jingxi County and Tiandeng County in the southwestern part of Guangxi, along with Heng County in Nanning City, are also considered “high-high” agglomeration areas. These counties have abundant water and heat resources, are remote from city centers, and boast a conducive ecological environment for cultivated land, resulting in higher ecological benefits. The “low-low” agglomeration areas are primarily concentrated in the central counties of Guilin, Liuzhou, Nanning, and Wuzhou, as well as the coastal counties along the Beibu Gulf. Guilin is an international tourist city, Liuzhou is renowned for its industrial activities, and the Beibu Gulf serves as an important port for Guangxi’s import and export trade. These urban center counties have high levels of economic development and urbanization, with a primary focus on the growth of secondary and tertiary industries. However, the limited area of cultivated land has been severely damaged during the process of urban expansion, leading to weaker ecological advantages. Therefore, the supply of grain falls far short of the demand, further diminishing the ecological value of cultivated land.
(4) In terms of comprehensive value, the spatial distribution pattern is similar to that of economic value but with a stronger spatial clustering. Due to the karst landform in the central and northern parts of Guangxi, most counties there have poor natural conditions and agricultural infrastructure, resulting in low ecological quality of cultivated land and low agricultural productivity. As a result, cultivated land is not fully realized in terms of its economic, social, and ecological security roles, making it the main “low-low” agglomeration area. Counties with a high comprehensive value of cultivated land are concentrated in the northeastern part of Guilin, Guangxi. Although this region has a widespread karst landscape and fragmented and scattered cultivated land, as an international tourist city, it has always prioritized the protection of the ecological environment. The region’s industrial development focuses on tourism and agriculture, with each county actively promoting distinctive agricultural brands. With the implementation of tailored agricultural development policies based on local conditions, cultivated land in this area exhibits high ecological and economic benefits.
6. Conclusions and Recommendations
6.1. Conclusions
The paper evaluated the value of cultivated land resources in 111 counties of Guangxi using the income capitalization method, the substitution market method, and the value-equivalent correction method and then conducted global and local spatial autocorrelation analysis on the results. The findings indicate that:
(1) The cultivated land resources in Guangxi possess enormous value, with a total value of USD 2859.3 billion in 2020. Economic value constitutes the largest proportion, accounting for a total of USD 1674.2 billion, while the social and ecological values are USD 417.7 billion and USD 767.3 billion, respectively. Furthermore, the economic, social, ecological, and comprehensive values of cultivated land resources per hectare are USD 485,000, USD 133,000, USD 157,000, and USD 775,500, respectively. However, there are significant internal differences in the distribution of these values, which are closely related to the complex and diverse terrain and natural geographical conditions within Guangxi.
(2) The various values of cultivated land resources in Guangxi exhibit certain spatial distribution patterns. The economic and ecological high-value areas of cultivated land per hectare are mainly distributed in areas with excellent cultivation conditions far away from city centers. On the other hand, the economic low-value areas of cultivated land are mainly distributed in areas with more mountains and with underdeveloped economies and transportation conditions. The ecological low-value areas of cultivated land are mainly distributed in the central areas of developed cities and coastal regions. The social value of the cultivated land is generally low.
(3) All values have significant clustering effects in the local spatial, with “high-high” and “low-low” clustering patterns. Among them, economic, social, and comprehensive values are mainly clustered in “low-low” agglomeration, while ecological values are in “high-high” agglomeration. Guilin is the city with the largest distribution of “high-high” agglomerations, and Chongzuo is the city with the largest distribution of “low-low” agglomerations.
(4) The level of economic development in counties has a negative impact on the ecological value of cultivated land resources, while it has a positive impact on their social value. For Guangxi, in the counties with advanced economies and high urbanization levels, cultivated land resources possess low ecological value as well as high social value, and vice versa.
(5) The value of cultivated land is influenced by key factors such as natural resource endowment, agricultural development path, and agricultural infrastructure conditions. Land quality, climate conditions, and water resources directly impact crop growth. Adapting agricultural policies according to local conditions can enhance farmers’ enthusiasm and promote the cultivation of advantageous agricultural products. Improving agricultural infrastructure, technological advancements (such as India’s Green Revolution in rice) and raising the educational level of farmers can increase the efficiency and benefits of agricultural cultivation [38]. Furthermore, since natural resource endowments are difficult to change in a short period, the importance of subsequent measures becomes even more prominent.
6.2. Recommendations
We conclude that, in the case of Guangxi, the social value of cultivated land is generally low due to the low business income of farmers and the massive loss of rural labor. Therefore, the government should continue to increase the policy of strengthening agriculture and enriching farmers, attracting intellectual youths to return to their hometowns to start their own businesses and employment, helping to revitalize the countryside and improving the various values of cultivated land.
For areas of low ecological value, such as counties with poor natural conditions and backward agricultural conditions, local governments should increase policy support and capital investment, promote comprehensive improvement of cultivated land, water, roads, forests and villages, build high-standard cultivated land and renovate low and medium-yield fields, improve the quality of cultivated land and, on this basis, introduce good varieties and agricultural technologies and encourage popularization and training in terms of agricultural technology. In counties near the city center, particularly in Guilin, Nanning, and Liuzhou urban areas, it is essential to establish a comprehensive regulatory framework for cultivated land protection. By leveraging technology, we can establish a dynamic monitoring and risk assessment mechanism for land cultivation while also adopting various channels to increase the inflow of cultivated land and implementing techniques to remediate polluted farmland.
For regions with high ecological value but low economic value, it is advisable to introduce the cultivation of advantageous agricultural products based on local conditions, taking inspiration from Lipu County and Yangshuo County. This approach will help create distinctive agricultural geographical brands and expedite the establishment of an ecological product certification system. Through initiatives such as “Good Product Markets” and “Agricultural Cultural Ecological Festivals,” effective links can be forged between the market and farmers, thereby enhancing the economic benefits of cultivated land while preserving the existing ecological environment. On the other hand, relying on cultivated land resources to promote the development of emerging industries such as “agricultural eco-tourism” can be a viable policy option. This can be achieved through various business models such as rural tourism and recreational activities at farmhouse restaurants, which can fully utilize the value of cultivated land in terms of eco-tourism, cultural experiences, health care for the elderly, and ultimately realizing value-added benefits of agricultural diversification. This can promote the transformation towards ecological agriculture, ultimately achieving a win–win situation of economic growth and environmental protection.
Author Contributions
Conceptualization, Z.C. and L.R.; Data curation, Z.C.; Formal analysis, L.R.; Methodology, L.R. and Q.X.; Project administration, Q.X.; Validation, L.R. and L.X.; Visualization, L.R. and L.X.; Writing, original draft, L.R.; Writing, review and editing, Z.C. and L.R. All authors have read and agreed to the published version of the manuscript.
Funding
This research was funded by Natural Science Foundation of Guangxi, grant no. 2021JJA150154; and by Social Science Foundation of Guangxi, grant no. 21FYJ057.
Data Availability Statement
Not applicable.
Acknowledgments
Thank you to everyone who contributed to this study.
Conflicts of Interest
The authors declare no conflict of interest.
References
- Zhang, J. Historical Significance of Compiling the Natural Resource Balance Sheet. People’s Trib. 2018, 24, 74–75. (In Chinese) [Google Scholar]
- Matin, S.; Sullivan, C.A.; Finn, J.A.; Huallacháin, D.O.; Green, S.; Meredith, D.; Moran, J. Assessing the distribution and extent of High Nature Value farmland in the Republic of Ireland. Ecol. Indic. 2020, 108, 105700. [Google Scholar] [CrossRef]
- Huang, S.; Hu, X. The Impact of Farmland Quality on Food Production under the Balanced Land Use System. Financ. Econ. 2019, 12, 121–129. (In Chinese) [Google Scholar]
- Sun, H.; Shi, Y.; Cui, S. Coordinated Protection of Cultivated Land and Ecological Construction. China Land 2020, 1, 58–59. (In Chinese) [Google Scholar]
- Zhu, D.; Du, T. Calculation Method and Result Analysis of China’s Cultivated Land Resource Assets. China Land Sci. 2017, 31, 23–31. (In Chinese) [Google Scholar]
- Zhong, X.; Li, H. Exploring the Calculation Path of Cultivated Land Resource Value in China. China Land 2021, 2, 41–43. (In Chinese) [Google Scholar]
- Petty, W. Selected Economic Writings of William Petty; The Commercial Press: Beijing, China, 1981; pp. 45–56. (In Chinese) [Google Scholar]
- Bastian, C.T.; McLeod, D.M.; Germino, M.J.; Reiners, W.A.; Blasko, B.J. Environmental amenities and agricultural land value hedonic model using geographic information systems data. Ecol. Econ. 2002, 40, 337–349. [Google Scholar] [CrossRef]
- Patton, M.; Kostov, P.; McErlean, S.; Moss, J. Assessing the influence of direct payments on the rental value of agricultural land. Food Policy 2008, 33, 74–83. [Google Scholar] [CrossRef]
- McCormark, D.E.; Stoking, M.A. Soil Potential Rating: An Evaluation Form of Land Evaluation. Soil Surv. Eval. 1986, 6, 37–41. [Google Scholar]
- Jeanne, D.B.; Tina, R. Choice experiment, multiple programs contingent valuation and landscape preferences: How can we support the land use decision-making process? Land Use Policy 2012, 29, 846–854. [Google Scholar]
- Jin, J.; Jiang, C.; Truong Dang, T.; Li, L. Public preferences for cultivated land protection in Wenling City, China: A choice experiment study. Land Use Policy 2013, 30, 337–343. [Google Scholar]
- Li, G.; Qiu, D.; Wang, P. Evaluation of non-market value of cultivated land in Three Gorges Eco-Fragile Areas. Acta Geogr. Sin. 2011, 66, 562–575. (In Chinese) [Google Scholar]
- Ma, S.; Swinton, S.M. Valuation of ecosystem services from rural landscapes using agricultural land prices. Ecol. Econ. 2011, 70, 1649–1659. [Google Scholar] [CrossRef]
- Balmford, R.D.A.; Bruner, A.; Cooper, P. Ecology-economic reasons for conserving wild nature. Science 2002, 297, 950–953. [Google Scholar] [CrossRef] [PubMed]
- Costanza, R.; d’Arge, R.; De Groot, R.; Farber, S.; Grasso, M.; Hannon, B.; Limburg, K.; Naeem, S.; O’neill, R.V.; Paruelo, J.; et al. The value of the world’s ecosystem services and natural capital. Nature 1997, 387, 253–260. [Google Scholar] [CrossRef]
- Demetriou, D. The assessment of land valuation in land consolidation schemes: The need for a new land valuation framework. Land Use Policy 2016, 54, 487–498. [Google Scholar] [CrossRef]
- Deininger, K.; Selod, H.; Burns, A. The Land Governance Assessment Framework: Identifying and Monitoring Good Practice in the Land Sector; World Bank Publications: Washington, DC, USA, 2012; pp. 39–51. [Google Scholar]
- Zhu, P.; Qu, F. Analysis of the Composition of Land Expropriation Compensation Prices from the Perspective of Resource and Environmental Economics. China Land Sci. 2003, 3, 10–14. (In Chinese) [Google Scholar]
- Wang, R.; Zhang, A.; Yan, T. Review and Commentary on the Research Progress of Foreign Agricultural Land Value Evaluation Methods in Recent Years. China Land Sci. 2005, 3, 59–64. (In Chinese) [Google Scholar]
- Yu, F.; Cai, Y. Discussion on the Value of Cultivated Land Resources. China Land Sci. 2003, 3, 3–9. (In Chinese) [Google Scholar]
- He, X.; Zhang, X. Accounting Methods and Case Analysis of Cultivated Land Assets. China Land Sci. 1994, 6, 23–27. (In Chinese) [Google Scholar]
- Huang, X. Research on Accounting for the Value of China’s Cultivated Land Resources. Issues Agric. Econ. 1997, 3, 40–42. (In Chinese) [Google Scholar]
- Chang, X. Discussion on the Social Value of Cultivated Land Resources: A Case Study of Shenyang City. Agric. Jilin 2011, 6, 69–71. (In Chinese) [Google Scholar]
- Xie, G.; Lu, C.; Leng, Y.; Zheng, D.; Li, S. Evaluation of the Value of Ecological Assets on the Qinghai-Tibet Plateau. J. Nat. Resour. 2003, 2, 189–196. (In Chinese) [Google Scholar]
- Huang, H.; Lei, M.; Kong, X.; Wen, L. Spatial Pattern Changes of China’s Cultivated Land and Response of Ecosystem Services Value. Res. Soil Water Conserv. 2022, 29, 339–348. (In Chinese) [Google Scholar]
- Ruan, X.S.; Li, T.; Zhang, O.X.; Yao, Z. Quantitative Study on Ecological Compensation of Cultivated Land in the Yangtze River Economic Belt Based on Ecological Service Value. Chin. J. Agric. Resour. Reg. Plan. 2021, 42, 68–76. (In Chinese) [Google Scholar]
- Zhu, W.; Li, J.; Gao, Y.; Zou, N.; Li, F.; Yu, B.; Sun, H. Calculation of Cultivated Land Value Based on Economic-Social-Ecological Value: A Case Study of Y City. Resour. Environ. Yangtze Basin 2022, 31, 2086–2095. (In Chinese) [Google Scholar]
- Shan, Y.; Miao, Y.; Yuan, W.; Wei, S. Spatial Differences and Influencing Factors of Cultivated Land Resource Value in Jinzhong City, Shanxi Province from 2015 to 2020. Bull. Soil Water Conserv. 2022, 42, 238–246. (In Chinese) [Google Scholar]
- Wang, X.; Hu, S.; Tong, L. Value and Spatial Distribution of Cultivated Land Resources in Tuanfeng County. Resour. Sci. 2016, 38, 206–216. (In Chinese) [Google Scholar]
- Chen, Z.; Ren, L.; Liang, W. Calculation of Ecological Value of Cultivated Land in Guangxi County Based on Equivalent Value Adjustment Method. South. Land Resour. 2021, 6, 32–36. (In Chinese) [Google Scholar]
- Chen, L.; Zuo, X.; Duan, Z. Current Situation and Suggestions for Improving the Production Capacity of Agricultural Land (Cultivated Land) in Guangxi. South. Land Resour. 2020, 8, 55–57. (In Chinese) [Google Scholar]
- Liu, S.; Geng, J.; Lv, X. Natural Resource Asset Accounting and Management: A Case Study of Land Resource Accounting Practice in County A. Fudan J. Soc. Sci. Ed. 2020, 62, 165–173. (In Chinese) [Google Scholar]
- Luo, Y.; Zhang, H.; Luo, X.; Luo, Y. Research on the Estimation of Agricultural Land Resource Asset Value in Sichuan Province. Nat. Resour. Econ. China 2021, 34, 51–57. (In Chinese) [Google Scholar]
- Liu, Q.; Li, G.; Zhang, C.; Zhao, L.; Zhu, Y. Dynamic Changes in Ecosystem Service Value of Qinglong County Based on Coefficient Correction. Chin. J. Eco-Agric. 2019, 27, 971–980. (In Chinese) [Google Scholar]
- Shi, H.; Shi, X.; Liu, L.; He, J.; Liu, W.; Wan, H. Comparison of Evaluation Methods and Results of Urban Ecosystem Service Value in Lanzhou. China Popul. Resour. Environ. 2013, 23, 30–35. (In Chinese) [Google Scholar]
- Bi, M.; Yao, C.; Xie, G.; Liu, J.; Qin, K. Improvement and Application of Ecological Footprint Evaluation Model; Chemical Industry Press: Beijing, China, 2008; pp. 54–60. (In Chinese) [Google Scholar]
- Reddy, A.A.; Rani, C.R.; Cadman, T.; Reddy, T.P.; Battarai, M.; Reddy, A.N. Rural Transformation of a Village in Telangana, a Study of Dokur since 1970s. Int. J. Rural Manag. 2016, 12, 143–178. [Google Scholar] [CrossRef]


Disclaimer/Publisher’s Note: The statements, opinions and data contained in all publications are solely those of the individual author(s) and contributor(s) and not of MDPI and/or the editor(s). MDPI and/or the editor(s) disclaim responsibility for any injury to people or property resulting from any ideas, methods, instructions or products referred to in the content. |
© 2023 by the authors. Licensee MDPI, Basel, Switzerland. This article is an open access article distributed under the terms and conditions of the Creative Commons Attribution (CC BY) license (https://creativecommons.org/licenses/by/4.0/).