


Assessing Urban Resilience with Geodesign: A Case Study of Urban Landscape Planning in Belgrade, Serbia

Abstract
:1. Introduction
2. Materials and Methods
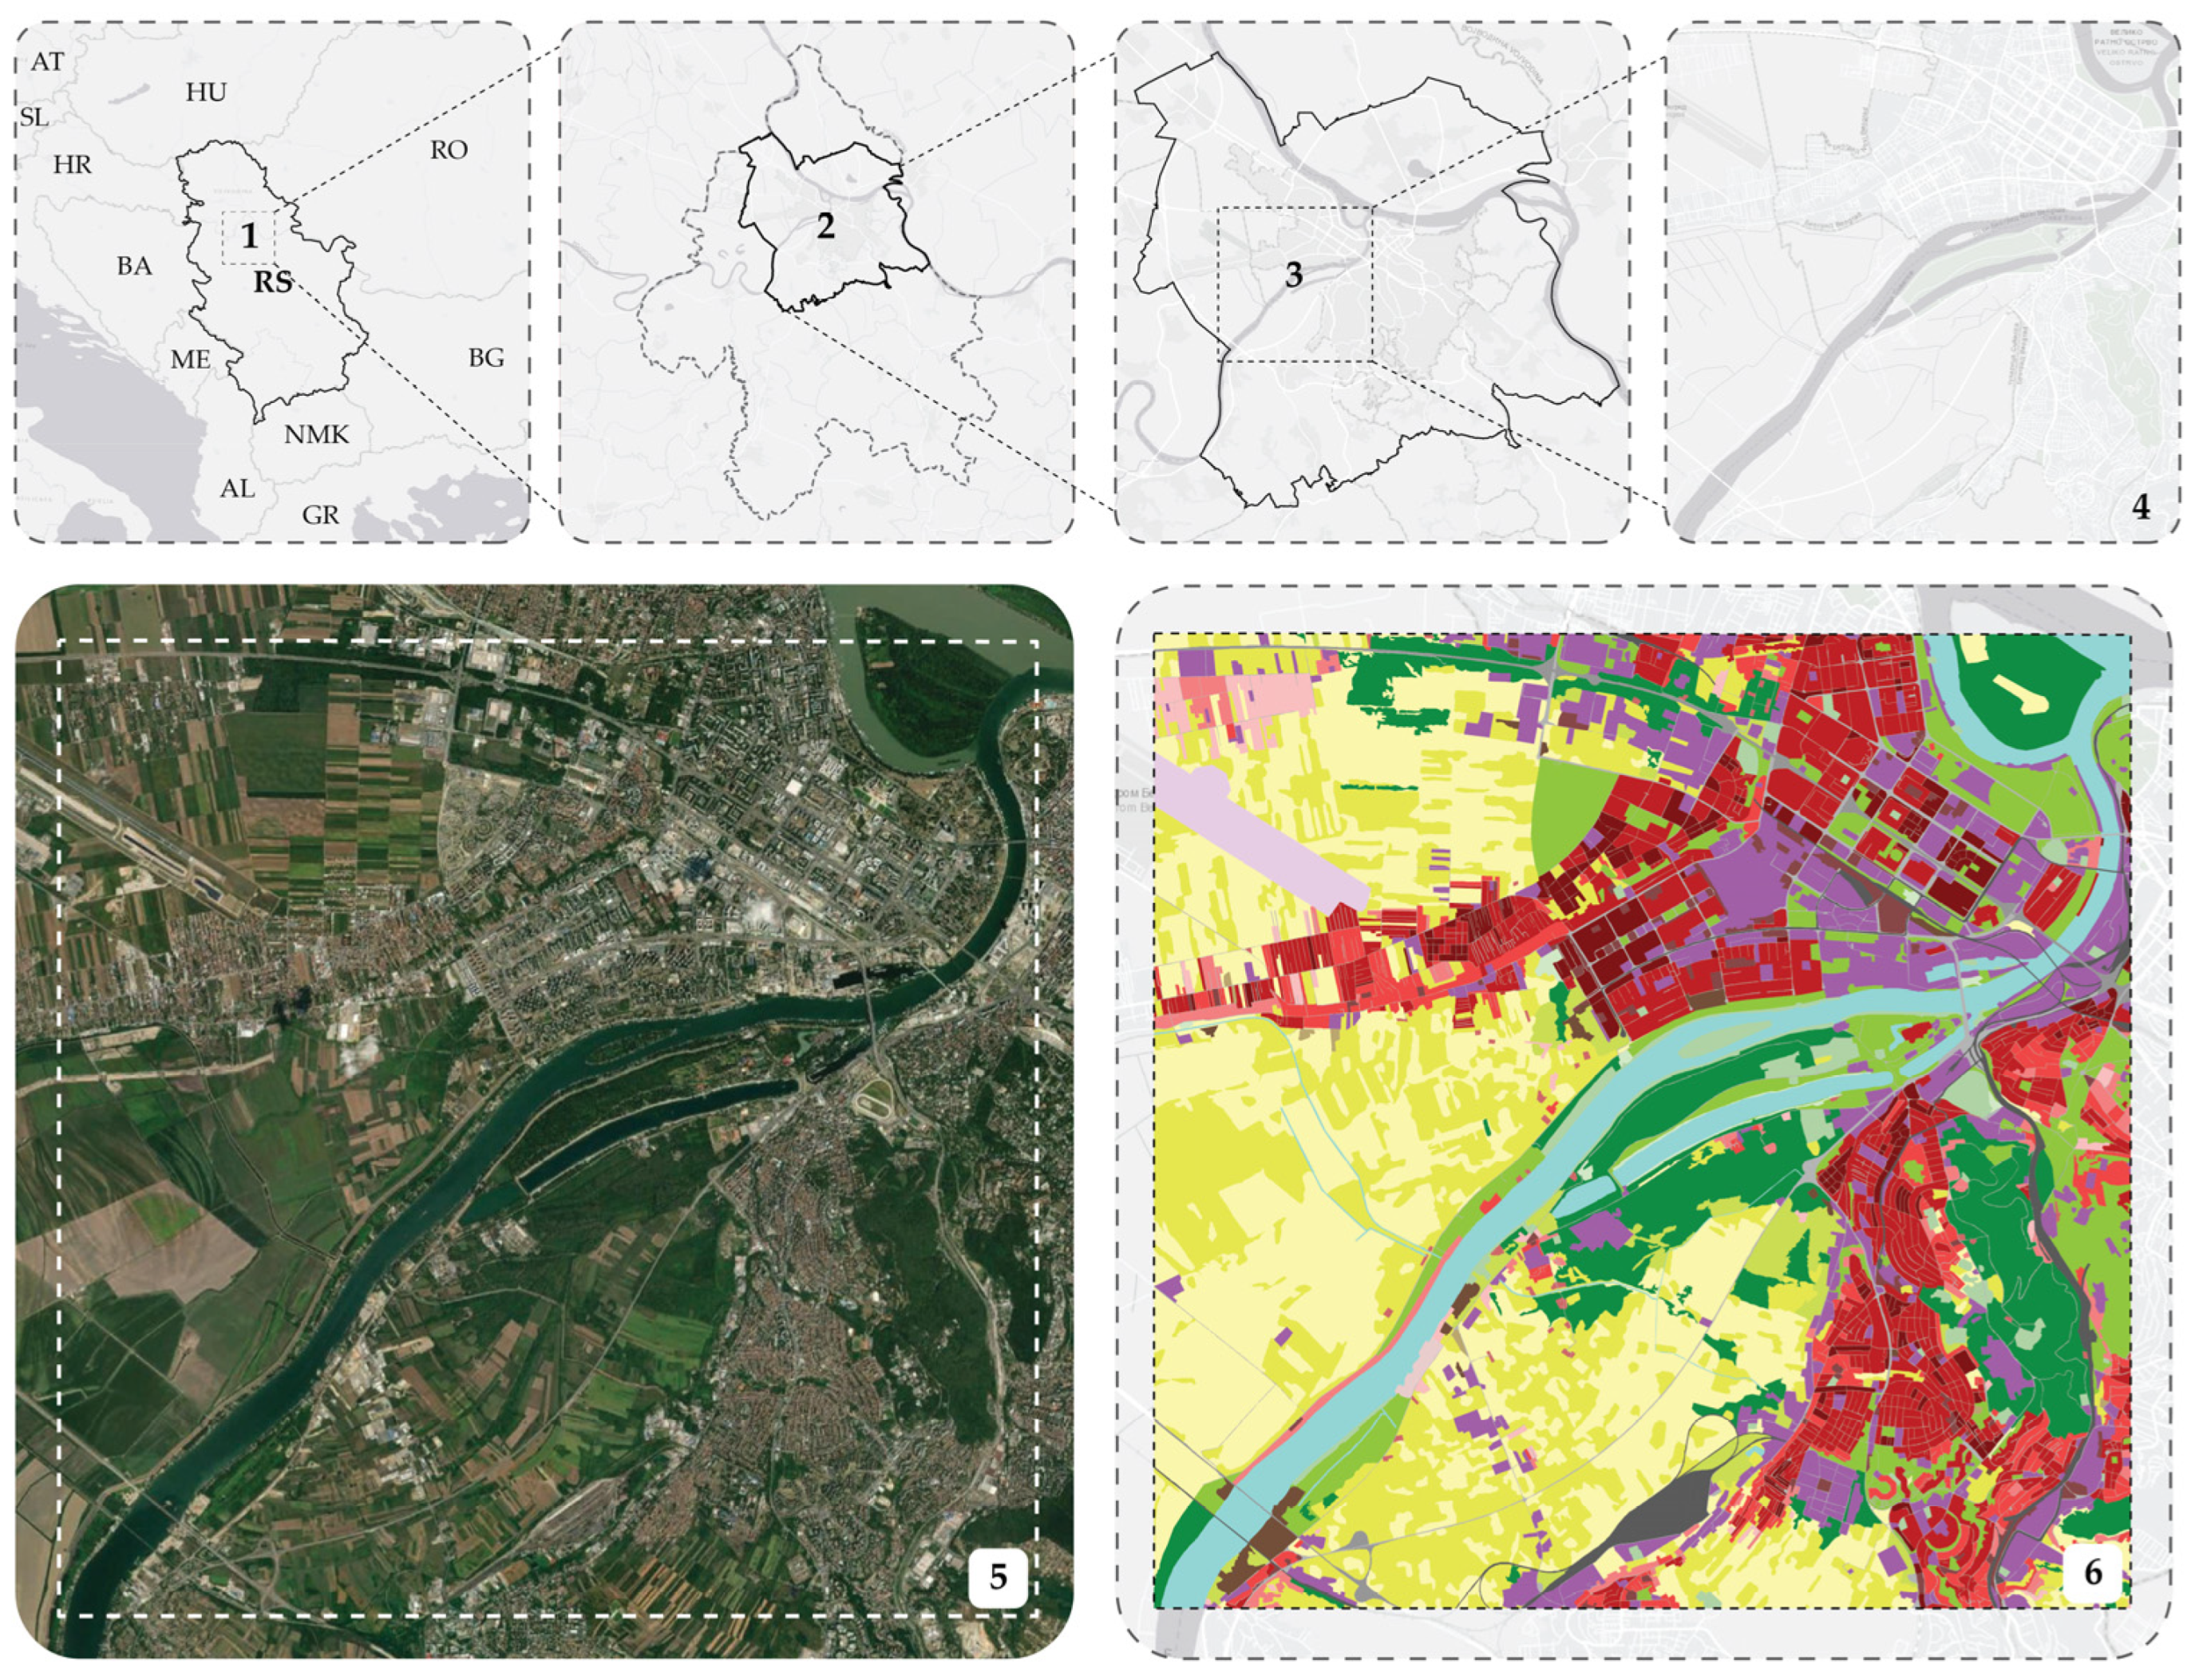
2.1. Research Area and Data
- -
- The open residential blocks of New Belgrade (Figure 2f) and its public green spaces;
- -
- The arable lands of Surčin (Figure 2i), for which the special purpose area of the National Football Stadium was adopted in the Master Plan of Belgrade for 2041;
- -
- Arable land in CM Čukarica in the settlement of Železnik;
- -
- A constant construction pressure is exerted on the free/open areas of the wider zone of protection of the sanitary water sources of the Sava River (Municipality of Čukarica—Topčiderska river basin—Figure 2e, Ada Ciganlija, and Makiš—Figure 2h; Stari Grad municipality—lower plateaus, Beton Hall, Sava Mala—Figure 2c,g; New Belgrade—from the Belgrade Fair to the confluence of the Sava and Danube Rivers—Figure 2a, Zemun) [20].
2.2. The Theoretical Background of Urban Resilience Assessment
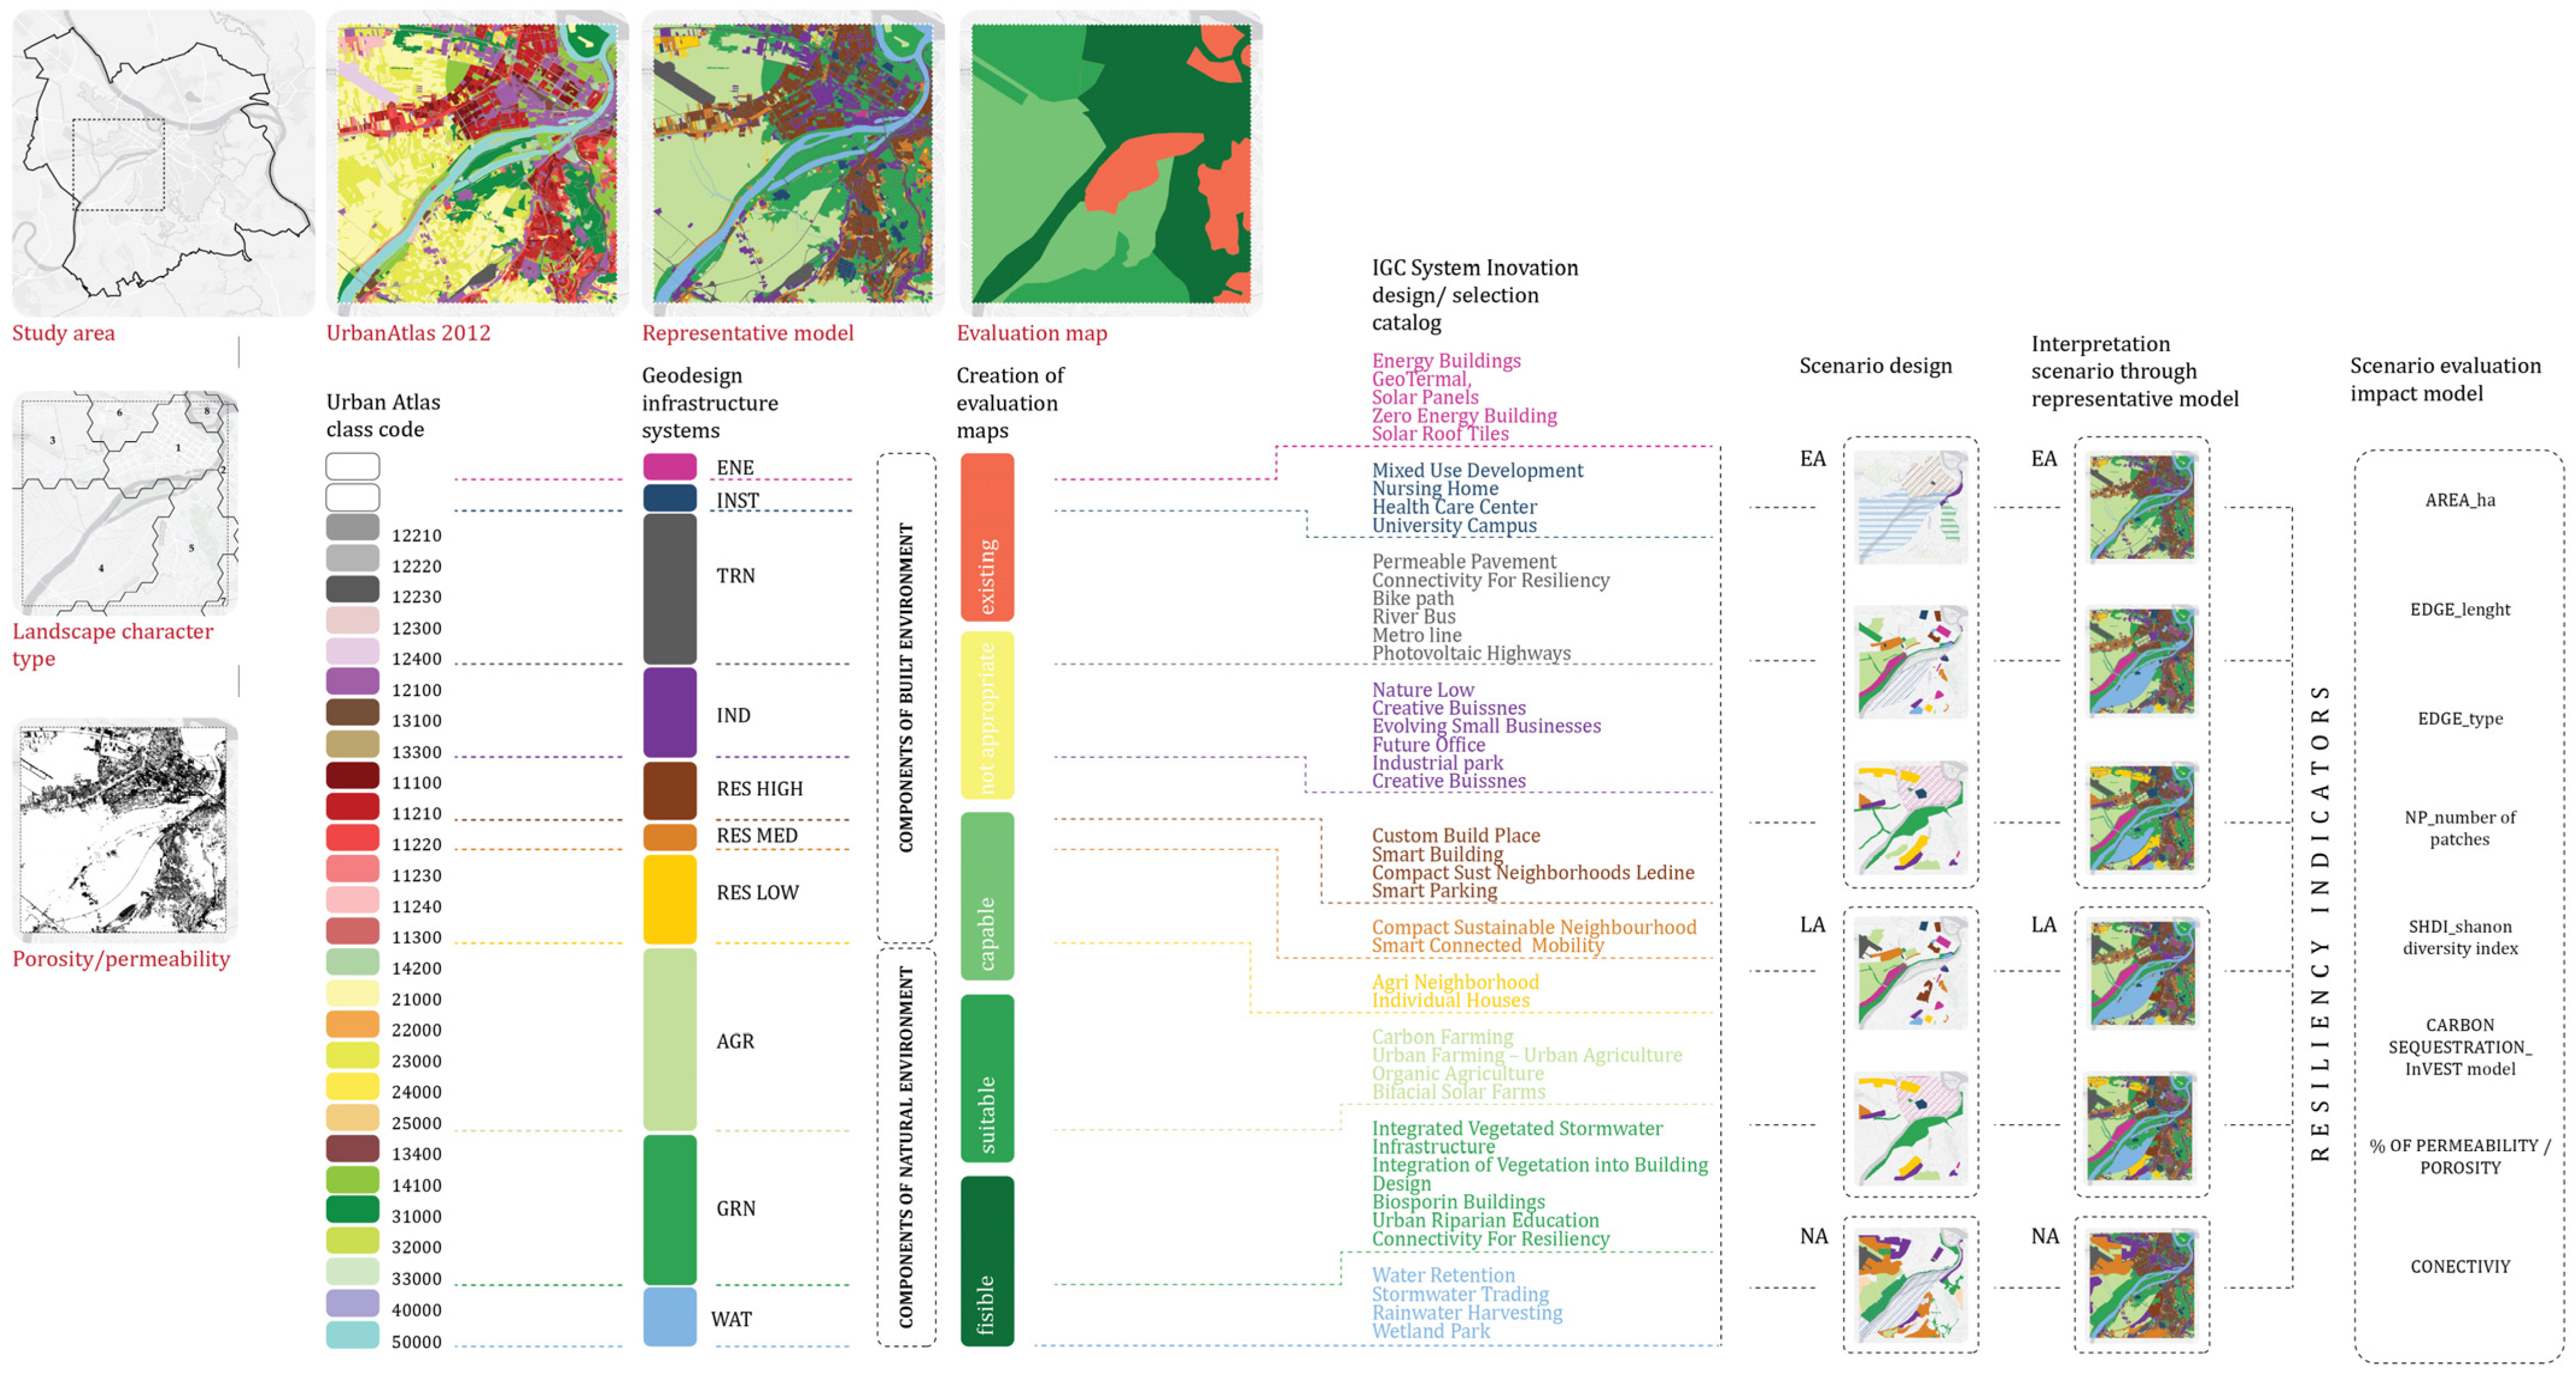
2.3. Research Methodology
3. Results
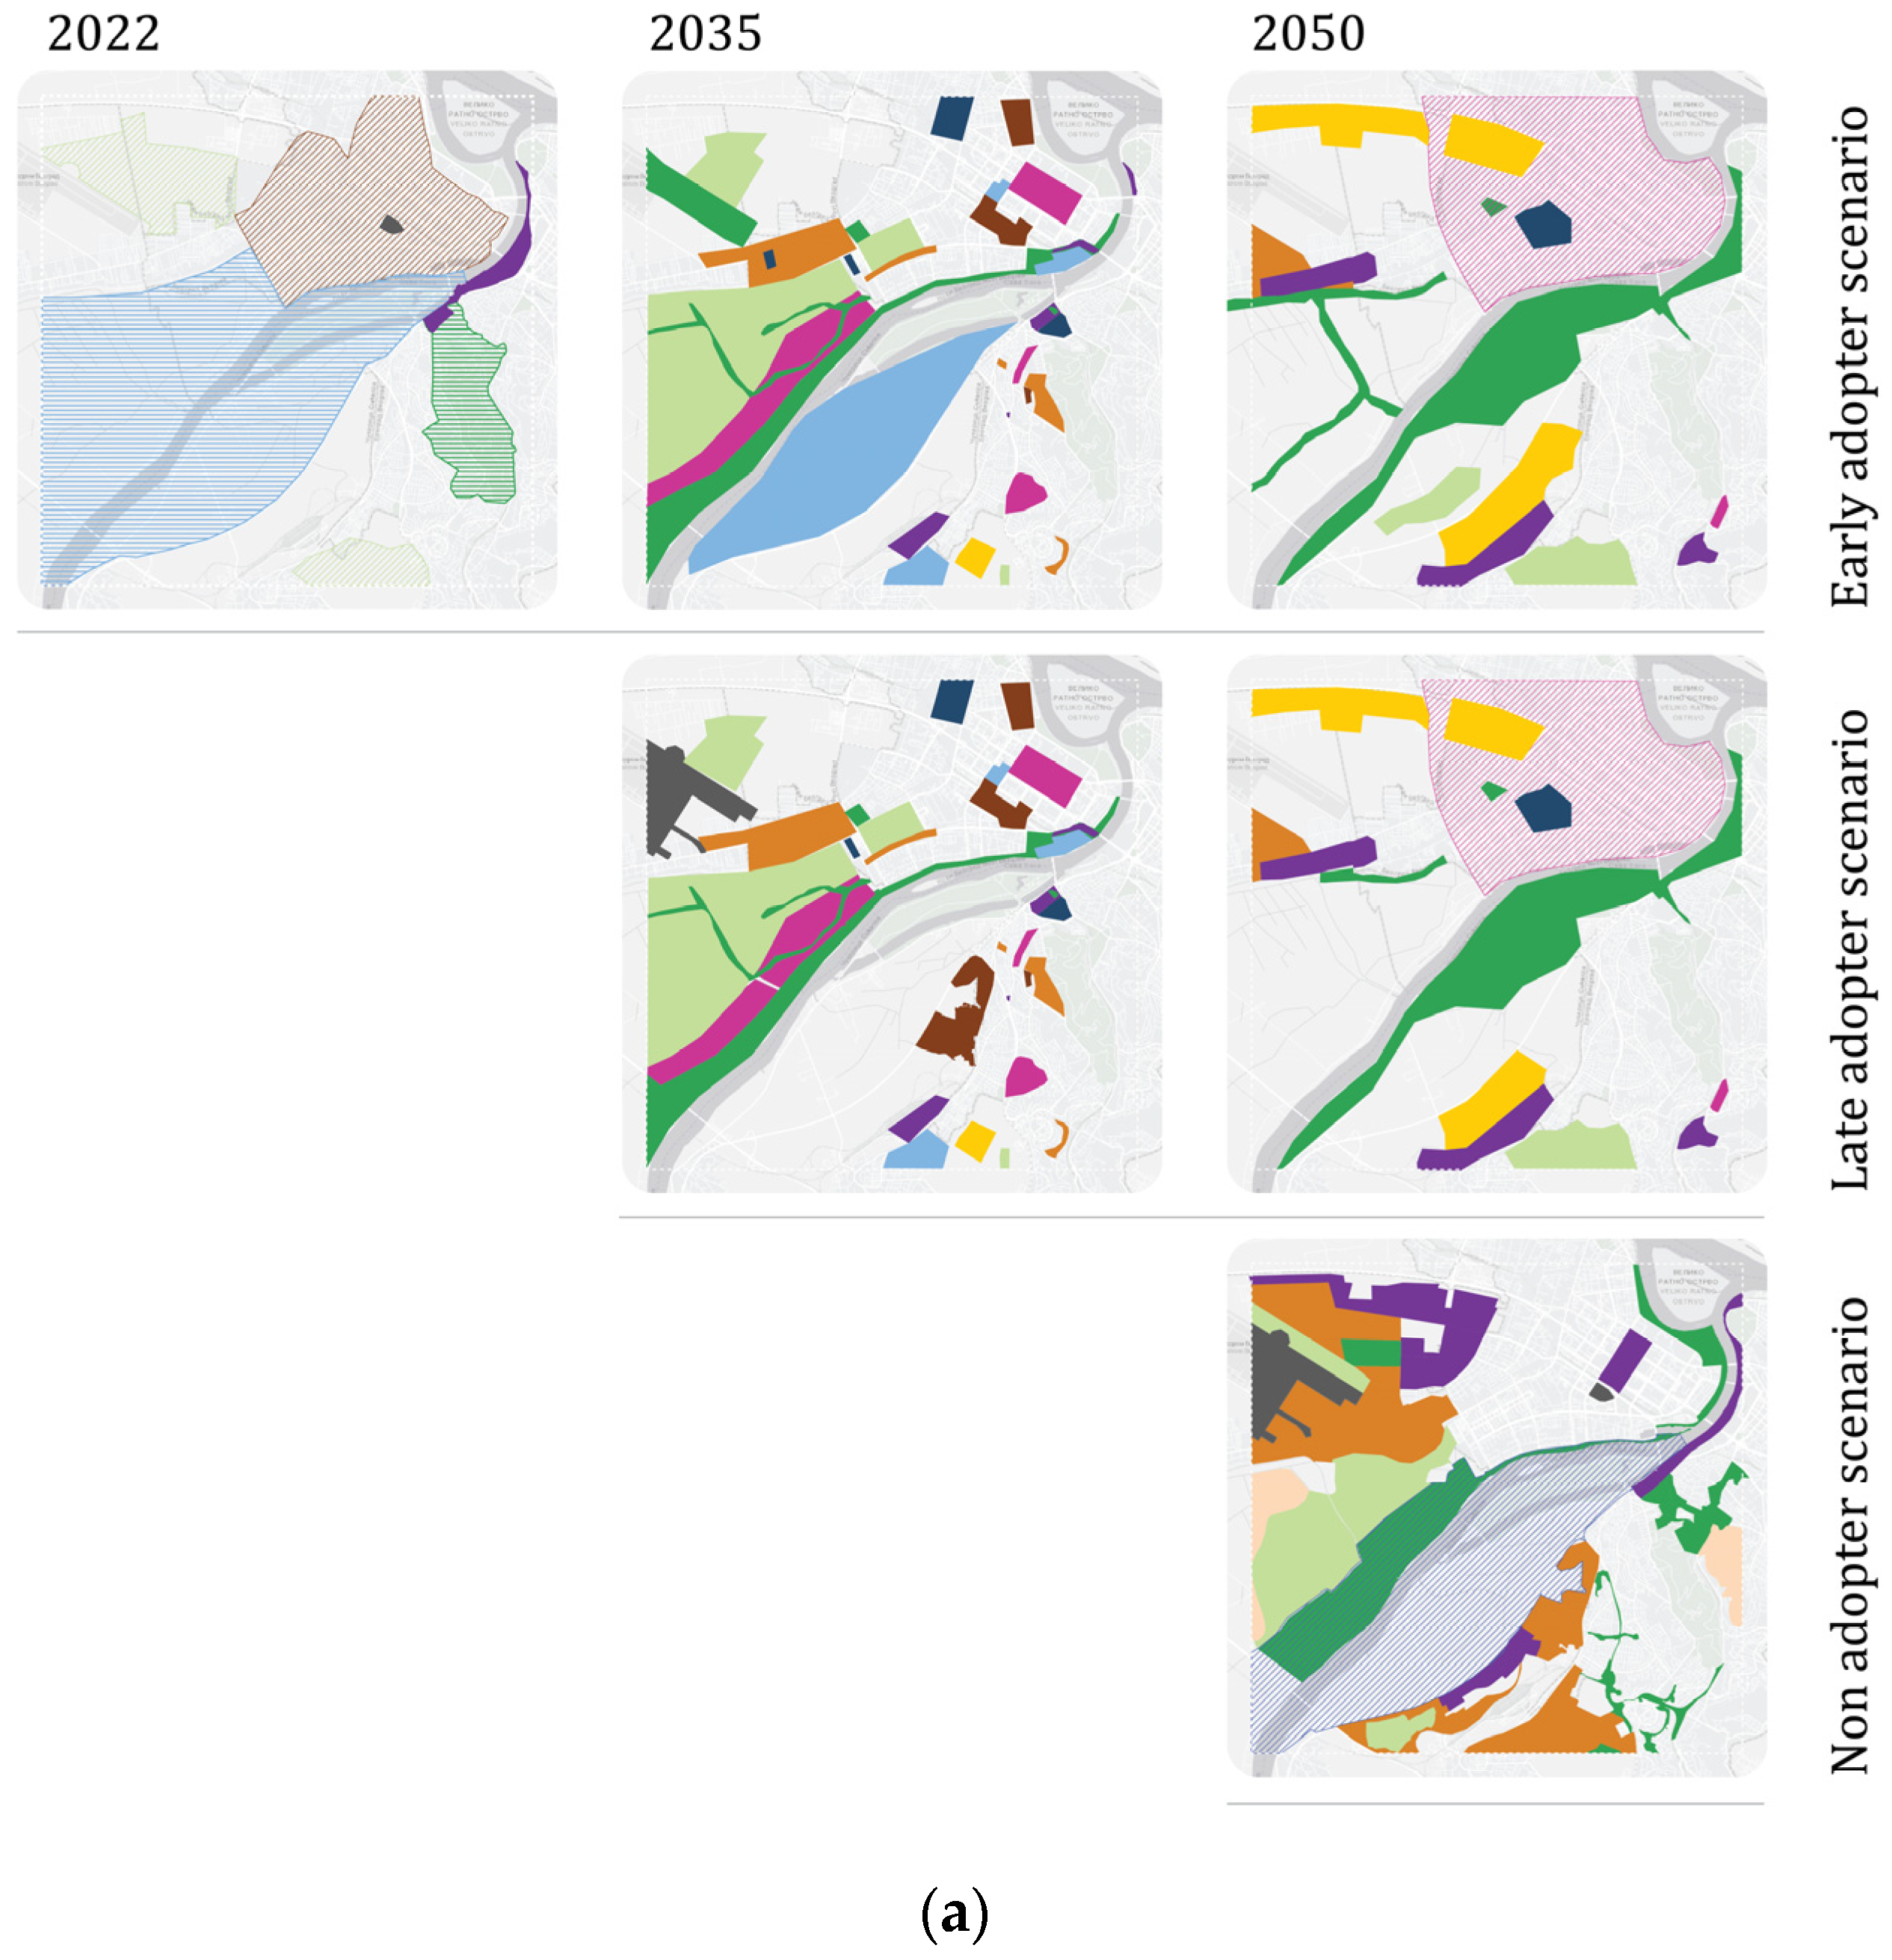
3.1. Scenario Proposals Desctiption
3.1.1. Early Adopter (EA) Scenario
3.1.2. Late Adopter Scenario (LA)
3.1.3. Non-Adoption Scenario (NA)
3.2. Results of Scenario Evaluation
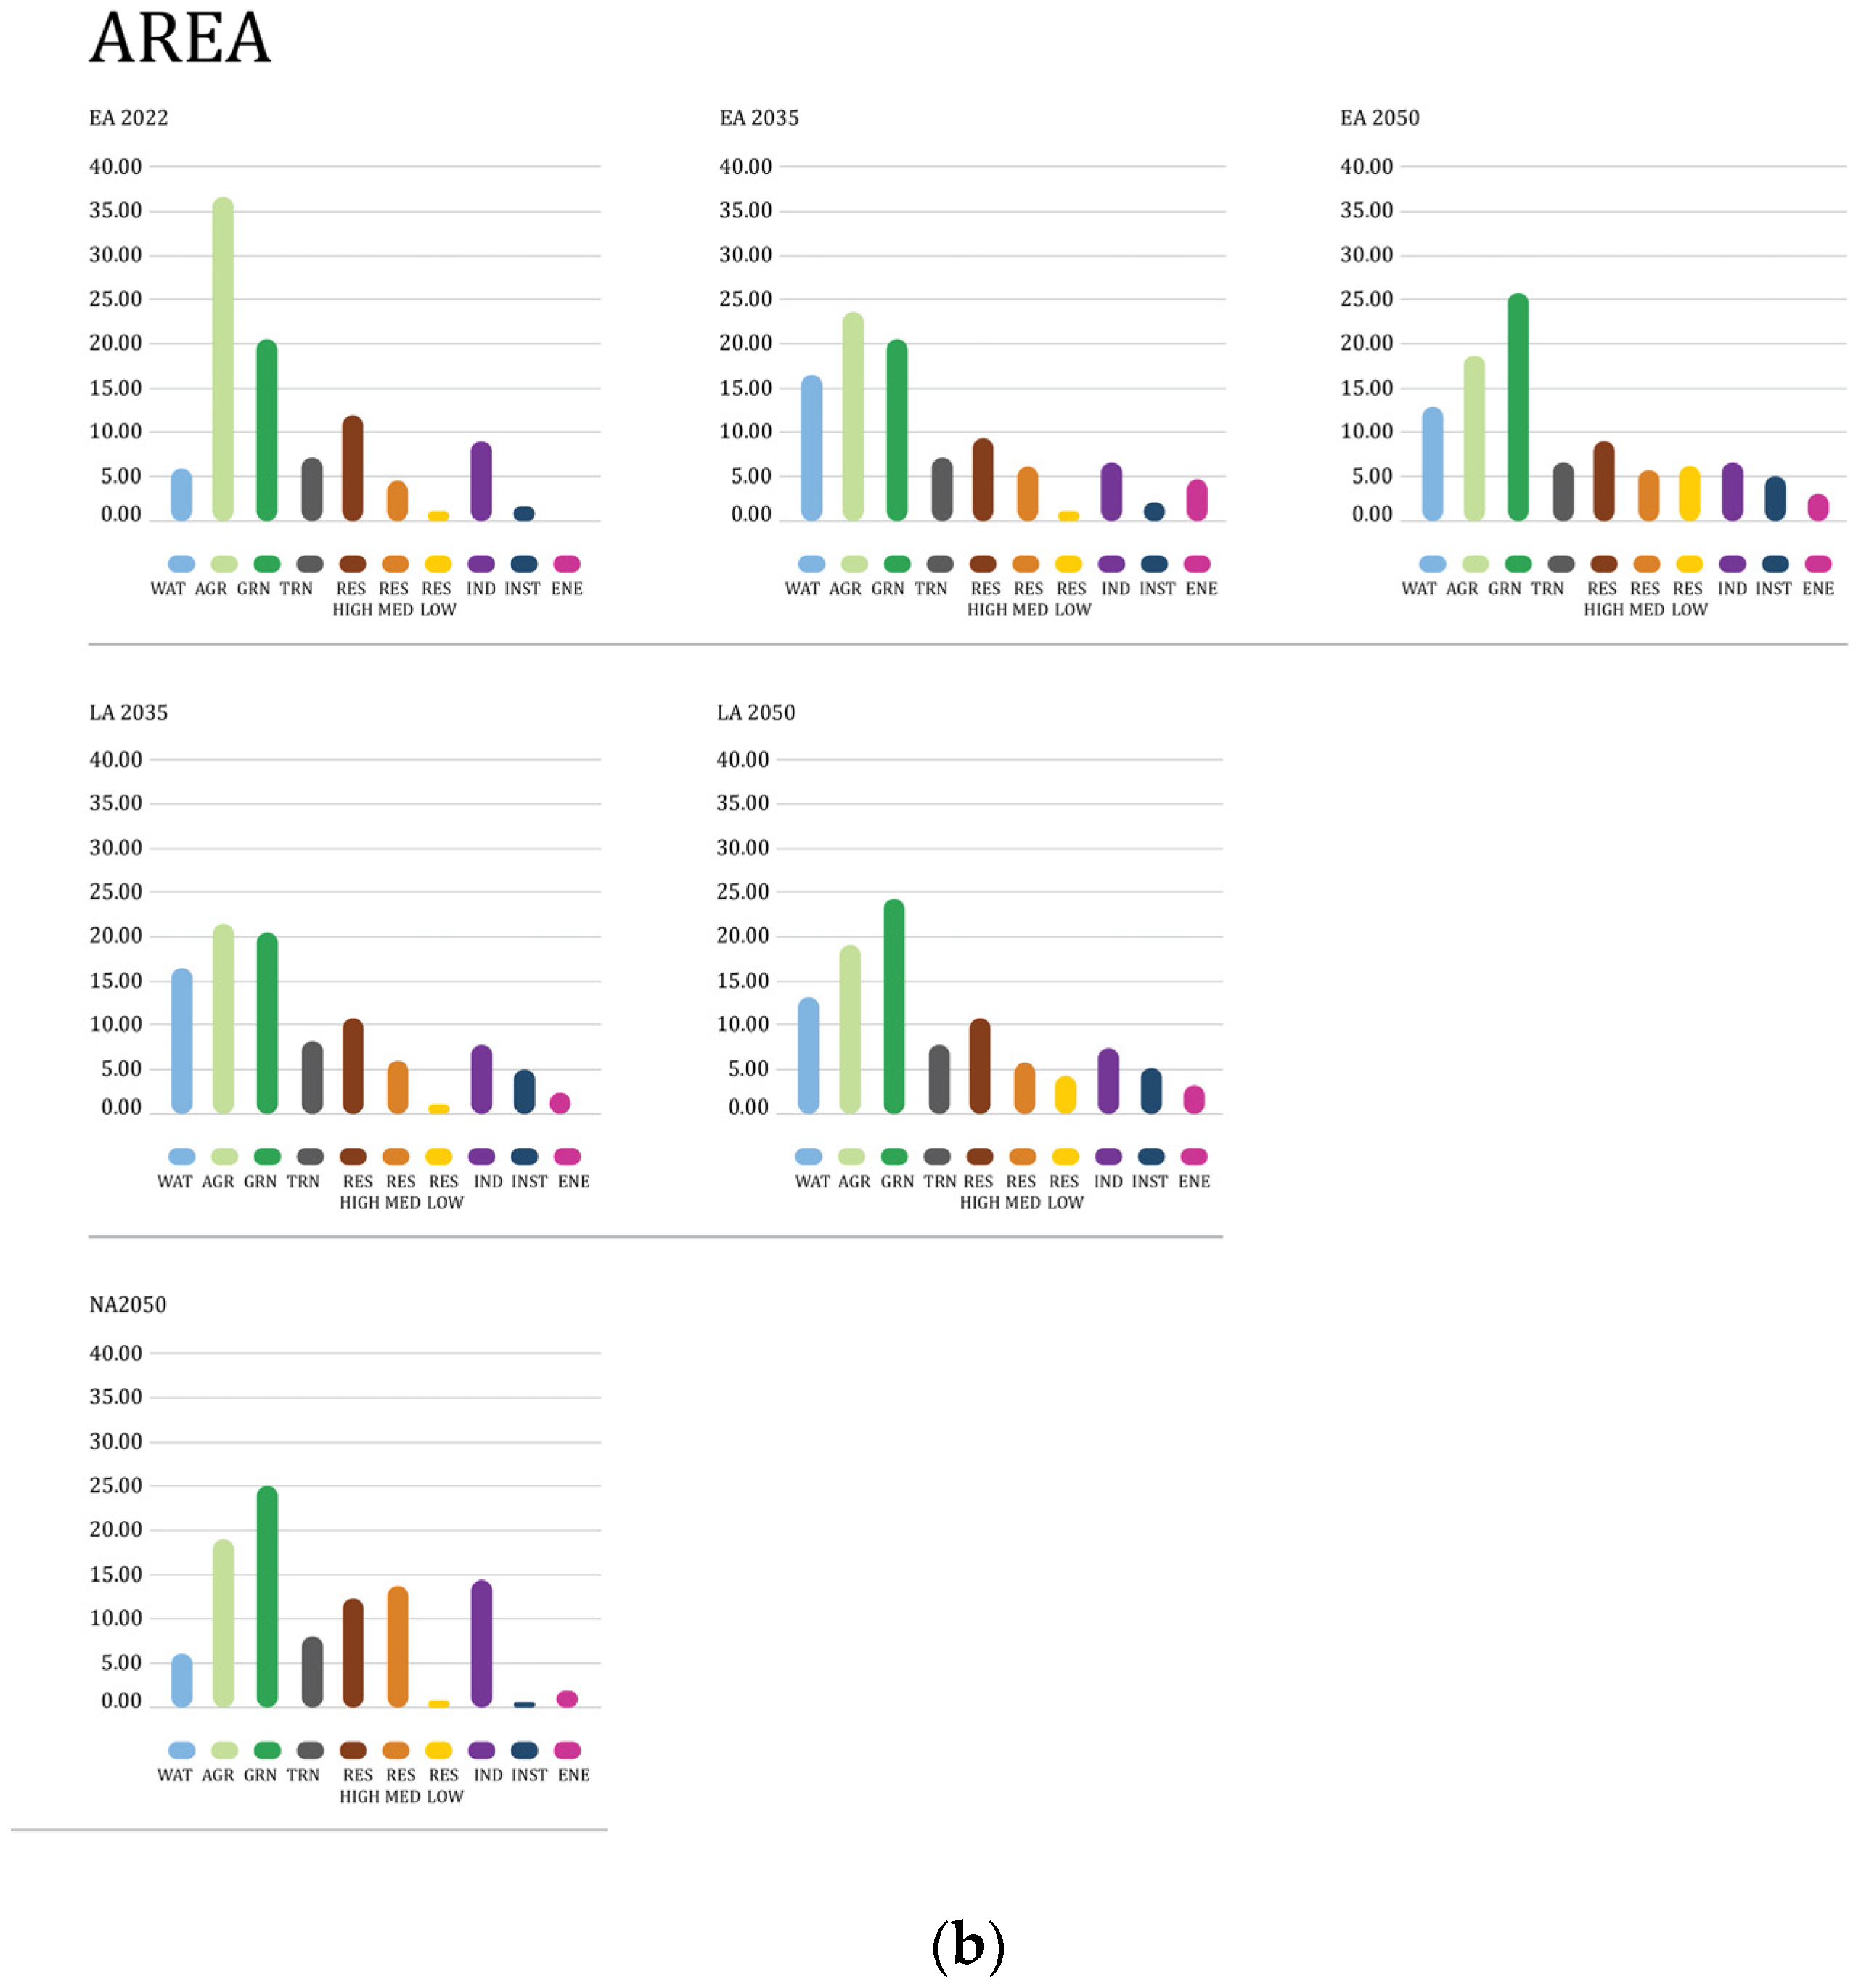
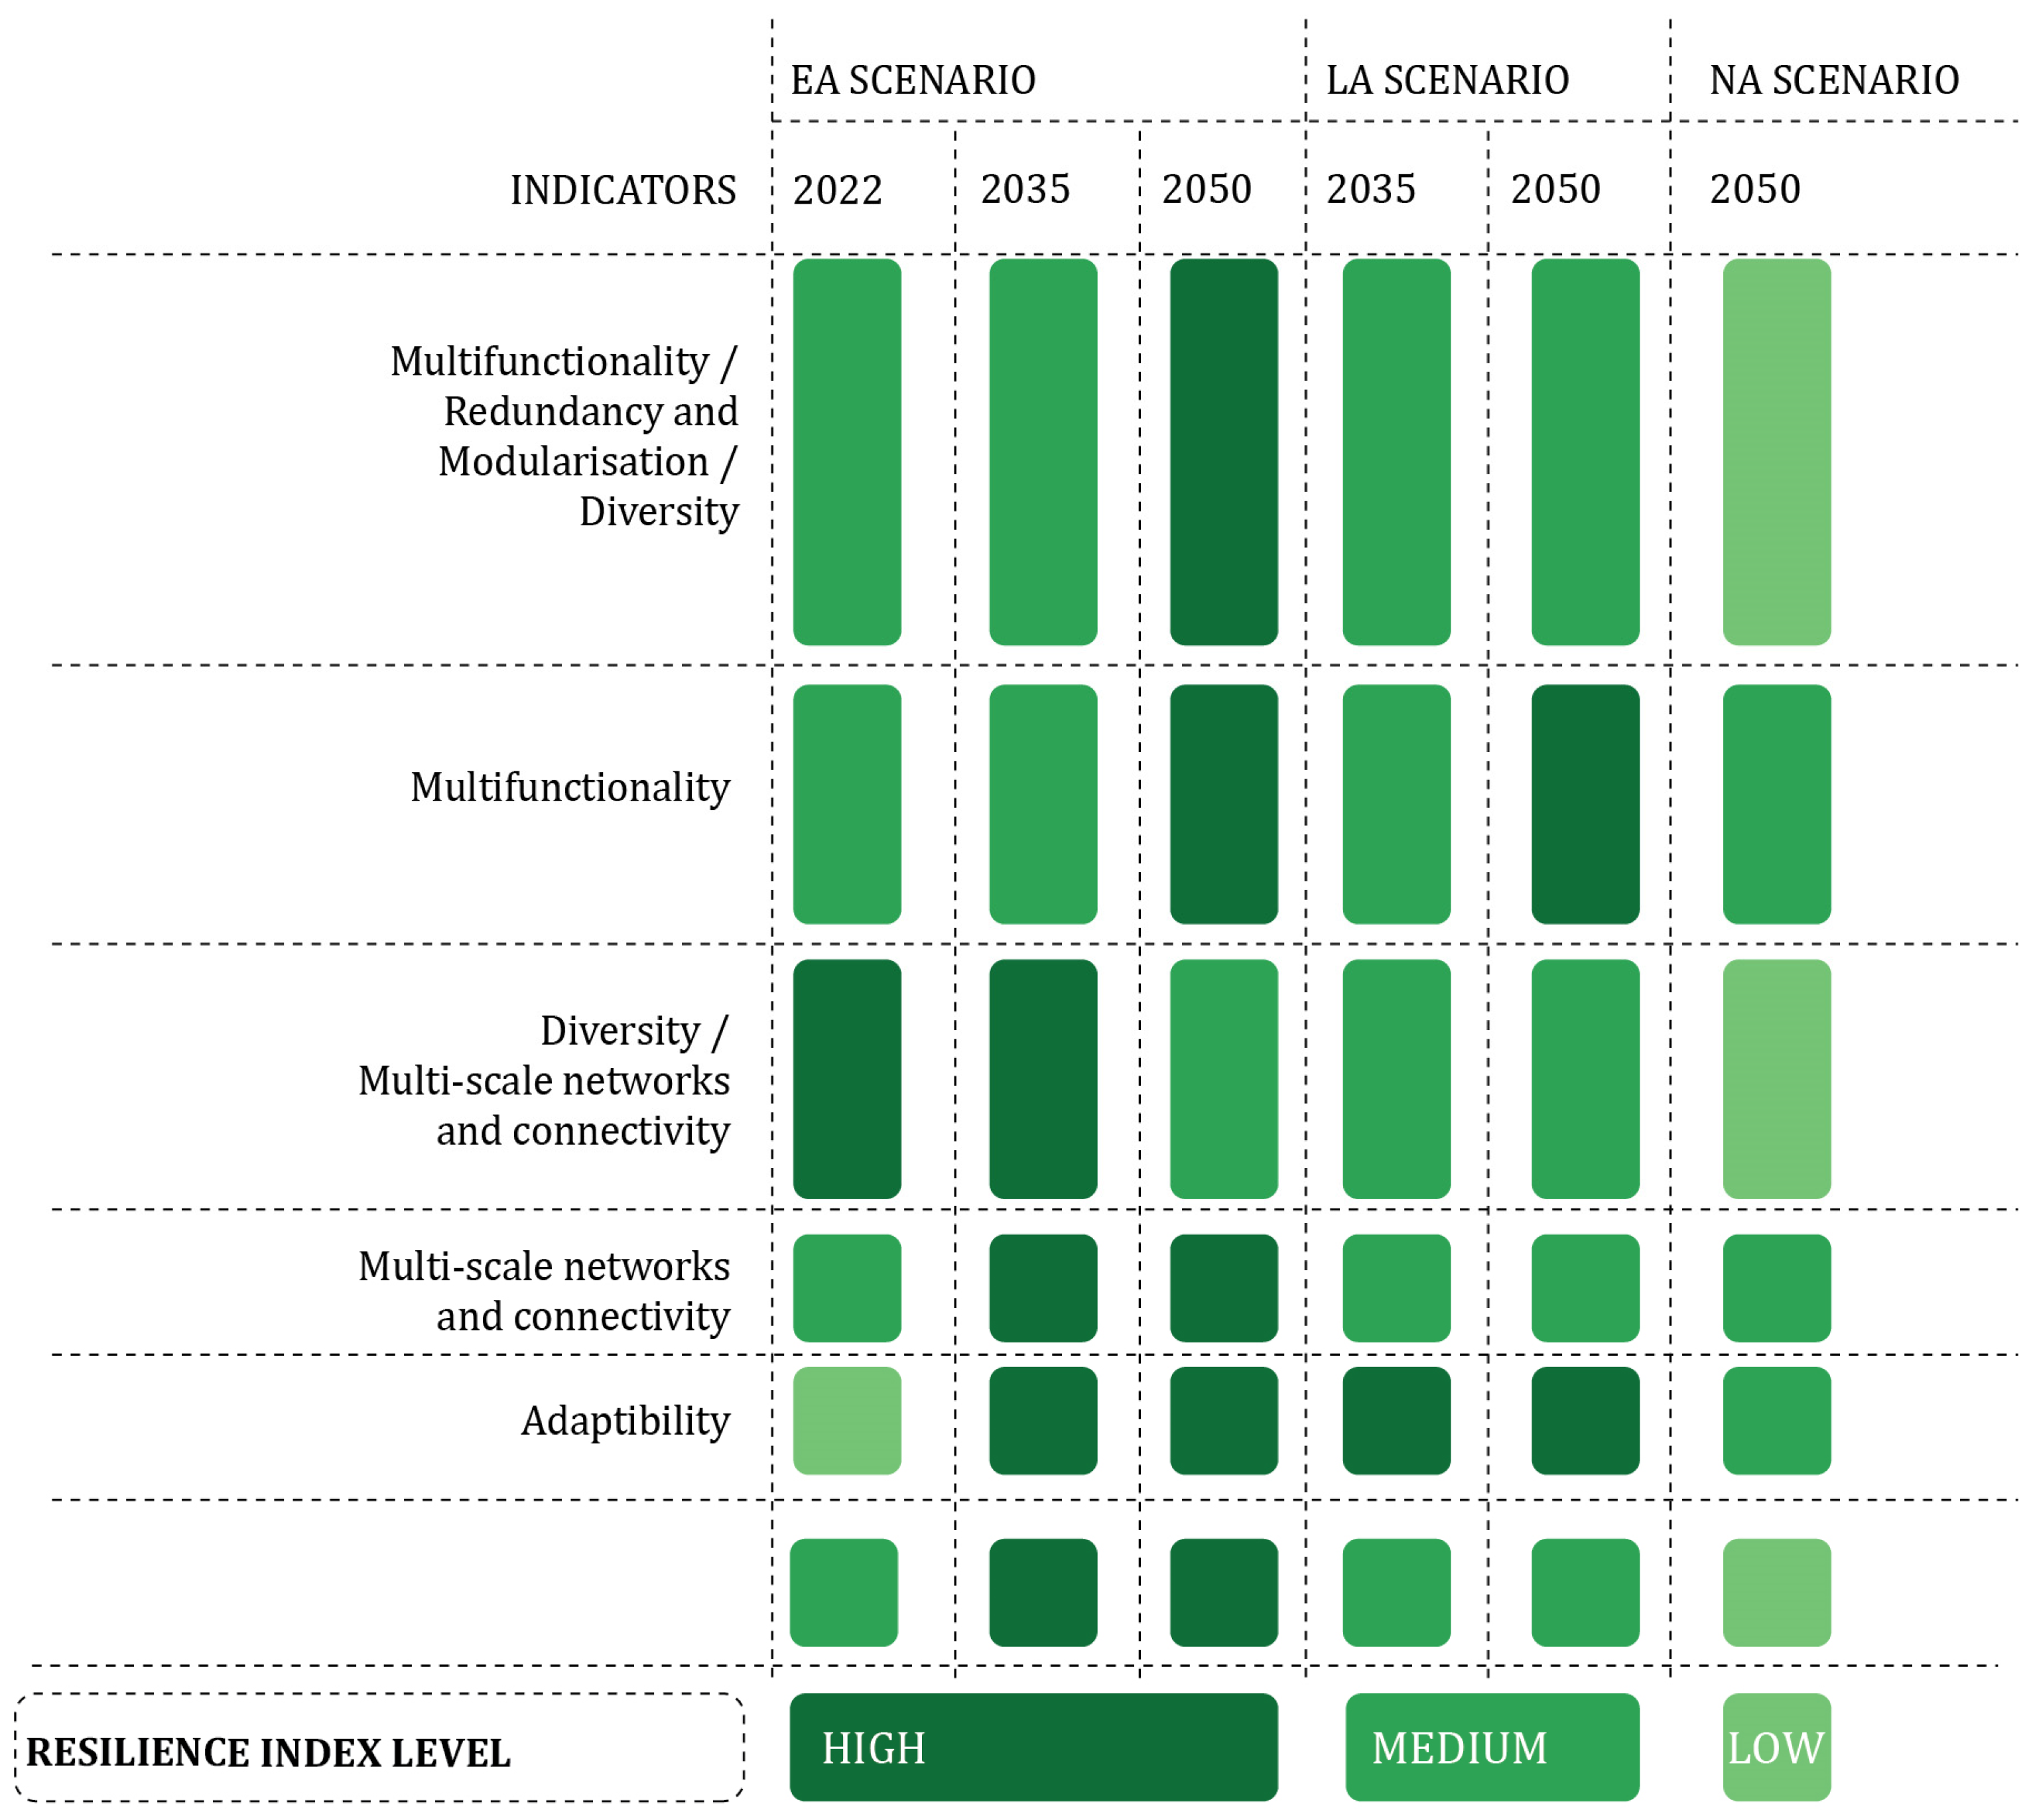
3.2.1. Results of the Measurement of Multifunctionality, Redundancy and Modularization, and Diversity
3.2.2. Results of Measurement of Indicators of Diversity and Multi-Scale Network and Connectivity
3.2.3. Results of the Measurement of Indicators of Multi-Scale Networks and Connectivity
3.2.4. Results of the Measurement of the Indicator of Adaptability
3.3. Resilience Index Operationalisation
4. Discussion
5. Conclusions
- The resilience level of the urban landscape structure can be effectively measured by using IGC geodesign scenarios in conjunction with resilience indicators. This model provides a quantitative assessment of resilience levels;
- The selected landscape metric parameters have proven their effectiveness in measuring changes within various indicators and parameters and provide valuable support to landscape planners and designers. These parameters facilitate the assessment of the resilience levels of planned activities and allow for a comparative evaluation of different planning scenarios. However, careful consideration should be given to the selection of these parameters;
- Instead of focusing on already resilient systems such as WAT, AGR, and GRN, there should be a deliberate focus on ‘’non-resilient’’ infrastructure systems of the built environment components in order to increase their resilience;
- System innovations play a critical role in strengthening the link between landscape planning and design across different planning scales. They serve as a direct link between the planning and design processes. However, for the concept of resilience, a more detailed description and definition of system innovations are essential;
- From a landscape studio education perspective, geodesign appears to be a useful teaching tool to help students understand environmental issues at different scales. Important tasks for students were understanding the methods and terminology of the IGC framework, and because they are trained as environmental planners, they were able to apply the approach in practice.
Author Contributions
Funding
Data Availability Statement
Conflicts of Interest
References
- Ahern, J. Novel Urban Ecosystems: Concepts, Definitions and a Strategy to Support Urban Sustainability and Resilience. Landsc. Archit. Front. 2016, 66, 10–21. [Google Scholar]
- Prokop, G.; Jobstmann, H.; Schönbauer, A. Overview on Best Practices for Limiting Soil Sealing and Mitigating Its Effects in EU-27 (Environment Agency Austria); Technical Report 2011-50; EU Publications: Luxembourg, 2011; ISBN 9789279206696. Available online: https://op.europa.eu/en/publication-detail/-/publication/c20f56d4-acf0-4ca8-ae69-715df4745049 (accessed on 9 May 2023).
- Ahern, J. Urban Landscape Sustainability and Resilience: The Promise and Challenges of Integrating Ecology with Urban Planning and Design. Landsc. Ecol. 2012, 28, 1203–1212. [Google Scholar] [CrossRef]
- Spirn, A.W.; Pickett, S.; Cadenasso, M.; McGrath, B. The Granite Garden: Urban Nature and Human Design. In Resilience in Ecology and Urban Design; Basic Books: New York, NY, USA, 1984; p. 245. [Google Scholar]
- Holling, C.S. Resilience and Stability of Ecological Systems. Annu. Rev. Ecol. Syst. 1973, 4, 1–23. [Google Scholar] [CrossRef]
- Kong, L.; Mu, X.; Hu, G.; Zhang, Z. The Application of Resilience Theory in Urban Development: A Literature Review. Environ. Sci. Pollut. Res. 2022, 29, 49651–49671. [Google Scholar] [CrossRef] [PubMed]
- Tobin, G.A. Sustainability and Community Resilience: The Holy Grail of Hazards Planning? Environ. Hazards 1999, 1, 13–25. [Google Scholar]
- Motesharrei, S.; Rivas, J.; Kalnay, E.; Asrar, G.R.; Busalacchi, A.J.; Cahalan, R.F.; Cane, M.A.; Colwell, R.R.; Feng, K.; Franklin, R.S.; et al. Modeling Sustainability: Population, Inequality, Consumption, and Bidirectional Coupling of the Earth and Human Systems. Natl. Sci. Rev. 2016, 3, 470–494. [Google Scholar] [CrossRef]
- Ahern, J. From Fail-Safe to Safe-to-Fail: Sustainability and Resilience in the New Urban World. Landsc. Urban Plan. 2011, 100, 341–343. [Google Scholar] [CrossRef]
- Brunetta, G.; Salata, S. Mapping Urban Resilience for Spatial Planning—A First Attempt to Measure the Vulnerability of the System. Sustainability 2019, 11, 2331. [Google Scholar] [CrossRef]
- Vasiljević, N.; Radić, B.; Gavrilović, S.; Šljukić, B.; Medarević, M.; Ristić, R. The Concept of Green Infrastructure and Urban Landscape Planning: A Challenge for Urban Forestry Planning in Belgrade, Serbia. Iforest-Biogeosci. For. 2018, 11, 491–498. [Google Scholar] [CrossRef]
- Bajić, L.; Vasiljević, N.; Čavlović, D.; Radić, B.; Gavrilović, S. A Green Infrastructure Planning Approach: Improving Territorial Cohesion through Urban-Rural Landscape in Vojvodina, Serbia. Land 2022, 11, 1550. [Google Scholar] [CrossRef]
- Pickett, S.T.A.; Cadenasso, M.L.; Grove, J.M. Resilient Cities: Meaning, Models, and Metaphor for Integrating the Ecological, Socio-economic, and Planning Realms. Landsc. Urban Plan. 2004, 69, 369–384. [Google Scholar] [CrossRef]
- Vale, L.J.; Campanella, T.J. (Eds.) The Resilient City: How Modern Cities Recover from Disaster; Oxford University Press: Oxford, UK; New York, NY, USA, 2005. [Google Scholar]
- Steinitz, C. A Framework for Geodesign: Changing Geography by Design; Esri Press: Redlands, CA, USA, 2012; ISBN 978-1-58948-333-0. [Google Scholar]
- Albert, C.; von Haaren, C.; Vargas-Moreno, J.; Steinitz, C. Teaching Scenario-Based Planning for Sustainable Landscape Development: An Evaluation of Learning Effects in the Cagliari Studio Workshop. Sustainability 2015, 7, 6872–6892. [Google Scholar] [CrossRef]
- Urban Planning Institute of Belgrade—URBEL. Plan of General Regulation of Belgarde 2041, Elaborate for Early Public Inspection. Available online: https://www.urbel.com/srp/javni-uvidi/2977/detaljnije/w/0/rani-javni-uvid-u-generalni-urbanisticki-plan-beograda-2041 (accessed on 16 June 2023).
- Đurđić, S.; Stojković, S.; Šabić, D. Nature conservation in urban conditions: A case study from Belgrade, Serbia. Maejo Int. J. Sci. Technol. 2011, 5, 129–145. [Google Scholar]
- Vasiljević, N.; Radić, B.; Matić, A.; Medojević, E.; Gavrilović, S.; Tutundžić, A.; Krč, M.; Ćorović, D.; Galečić, N.; Mitrović, S.; et al. The Atlas of Landscape Character Types of Belgrade; University of Belgrade, Faculty of Forestry: Belgrade, Serbia, 2021; ISBN 978-86-7299-334-9. [Google Scholar]
- Đokić, N.; Grujić, M. (Eds.) Akcioni Plan Adaptacije na Klimatske Promene sa Procenom Ranjivosti; Gradska uprava Grada Beograda, Sekretarijat za Zaštitu Životne Sredine: Beograd, Srbija, 2015. (In Serbian) [Google Scholar]
- Holling, C.S. Engineering Resilience versus Ecological Resilience. In Engineering within Ecological Constraints; Schulze, P.C., Ed.; National Academy Press: Washington, DC, USA, 1996; pp. 31–41. [Google Scholar]
- Gharai, F.; Masnavi, M.R.; Hajibandeh, M. Urban Local-Spatial Resilience: Developing the Key Indicators and Measures, a Brief Review of Literature. Sci. J. NAZAR Res. Cent. (Nrc) Art Archit. Urban. 2018, 14, 19–32. [Google Scholar]
- Haimes, Y.Y. On the Definition of Resilience in Systems. Risk Anal. 2009, 29, 498–501. [Google Scholar] [CrossRef]
- Rana, I.A. Disaster and Climate Change Resilience: A Bibliometric Analysis. Int. J. Disaster Risk Reduct. 2020, 50, 101839. [Google Scholar] [CrossRef]
- IPCC. Climate Change 2022: Impacts, Adaptation, and Vulnerability. In Contribution of Working Group II to the Sixth Assessment Report of the Intergovernmental Panel on Climate Change; Pörtner, H.-O., Roberts, D.C., Tignor, M., Poloczanska, E.S., Mintenbeck, K., Alegría, A., Craig, M., Langsdorf, S., Löschke, S., Möller, V., et al., Eds.; Cambridge University Press: Cambridge, UK; New York, NY, USA, 2022; p. 3056. [Google Scholar] [CrossRef]
- Alberti, M.; Marzluff, J.M.; Shulenberger, E.; Bradley, G.; Ryan, C.; Zumbrunnen, C. Integrating Humans into Ecology: Opportunities and Challenges for Studying Urban Ecosystems. Urban Ecol. 2003, 53, 143–158. [Google Scholar] [CrossRef]
- Steiner, F.R. Metropolitan Resilience: The Role of Universities in Facilitating a Sustainable Metropolitan Future; Nelson, A.C., Allen, B.L., Trauger, D.L., Eds.; Toward a Resilient Metropolis; Metropolitan Institute Press: Alexandria, VA, USA, 2006; pp. 1–18. [Google Scholar]
- Folke, C. Resilience: The Emergence of a Perspective for Social–Ecological Systems Analyses. Glob. Environ. Change 2006, 16, 253–267. [Google Scholar] [CrossRef]
- Carlos, G.; Eduarda, M.D.C. Framework and Indicators to Measure Urban Resilience; AESOP-ACS P Joint Congress: Dublin, Ireland, 2013. [Google Scholar]
- Davoudi, S.; Shaw, K.; Haider, L.J.; Quinlan, A.E.; Peterson, G.D.; Wilkinson, C.; Fünfgeld, H.; McEvoy, D.; Porter, L.; Davoudi, S. Resilience: A Bridging Concept or a Dead End? “Reframing” Resilience: Challenges for Planning Theory and Practice Interacting Traps: Resilience Assessment of a Pasture Management System in Northern Afghanistan Urban Resilience: What Does It Mean in Planning Practice? Resilience as a Useful Concept for Climate Change Adaptation? The Politics of Resilience for Planning: A Cautionary Note. Plan. Theory Pract. 2012, 13, 299–333. [Google Scholar]
- Folke, C.; Colding, J.; Berkes, F. Synthesis: Building resilience and adaptive capacity in social-ecological systems. In Navigating Social-Ecological Systems: Building Resilience for Complexity and Change; Berkes, F., Colding, J., Folke, C., Eds.; Cambridge University Press: Cambridge, UK, 2003; pp. 352–387. [Google Scholar]
- Suárez, M.; Gómez-Baggethun, E.; Benayas, J.; Tilbury, D. Towards an urban resilience index: A case study in 50 Spanish cities. Sustainability 2016, 8, 774. [Google Scholar] [CrossRef]
- Zhang, Q.; Peng, X.; Bai, D. Research on the Strategies of Improving the Function of Community Green Infrastructure under the Concept of Resilience. Build. Econ. 2020, 41, 262–265. [Google Scholar]
- Sharifi, A.; Yamagata, Y. Resilient Urban Form: A Conceptual Framework. In Resilience-Oriented Urban Planning. Lecture Notes in Energy; Yamagata, Y., Sharifi, A., Eds.; Springer: Cham, Germany, 2018; Volume 65. [Google Scholar] [CrossRef]
- McGarigal, K.; Marks, B.J. FRAGSTATS: Spatial Pattern Analysis Program for quantifying landscape structure. In General Technical Report; US Department of Agriculture, Forest Service, Pacific Northwest Research Station: Portland, OR, USA, 1995. [Google Scholar]
- Leitao, A.B.; Miller, J.; Ahern, J.; Mc Garigal, K. Measuring Landscapes a Planner’s Handbook; Island Press: Washington, DC, USA, 2012. [Google Scholar]
- Billeter, R.; Liira, J.; Bugter, D.; Arens, R.; Augenstein, P.; Aviron, I.; Baudry, S.; Bukacek, J. Indicators for Biodiversity in Agricultural Landscapes: A Pan-European Study. J. Appl. Ecol. 2007, 45, 141–150. [Google Scholar] [CrossRef]
- Kumar, S.; Stohlgren, T.J.; Chong, G.W. Spatial heterogeneity influences native and non-native plant species richness. Ecology 2006, 87, 3186–3199. [Google Scholar] [CrossRef] [PubMed]
- Campagna, M.; Di Cesare, E.A.; Cocco, C. Integrating Green-Infrastructures Design in Strategic Spatial Planning with Geodesign. Sustainability 2020, 12, 1820. [Google Scholar] [CrossRef]


| Metric Parameter | Concept of Parameter | Calculation Equation | Indicators |
|---|---|---|---|
| AREA_ha | This indicator can be used as a quantitative measure of the transformation process of structural changes in the landscape from the perspective of landscape multifunctionality. | Multifunctionality/ Redundancy and Modularisation/Diversity | |
| NP | More patches and heterogeneity in a single IGC system class ensure redundancy within a landscape and a higher level of resilience and stability. | ||
| SHDI | It measures the diversity of patches within a landscape structure and is a way of measuring the uniformity of different land use patches within a landscape structure. The higher the value of H, the higher the diversity of species in a particular community. The lower the value of H, the lower the diversity. A value of H = 0 indicates a community that has only one species. | ||
| % of porosity | It indicates the percentage (%) of built and unbuilt area within the landscape structure, shows the capacity of the landscape to infiltrate atmospheric water and the amount of surface runoff, and regulates the local climate. | Multifunctionality | |
| Carbon Sequestration | It measures carbon storage in wood, other biomass, and soils. Ecosystems keep CO2 out of the atmosphere, where it would contribute to climate change. | ||
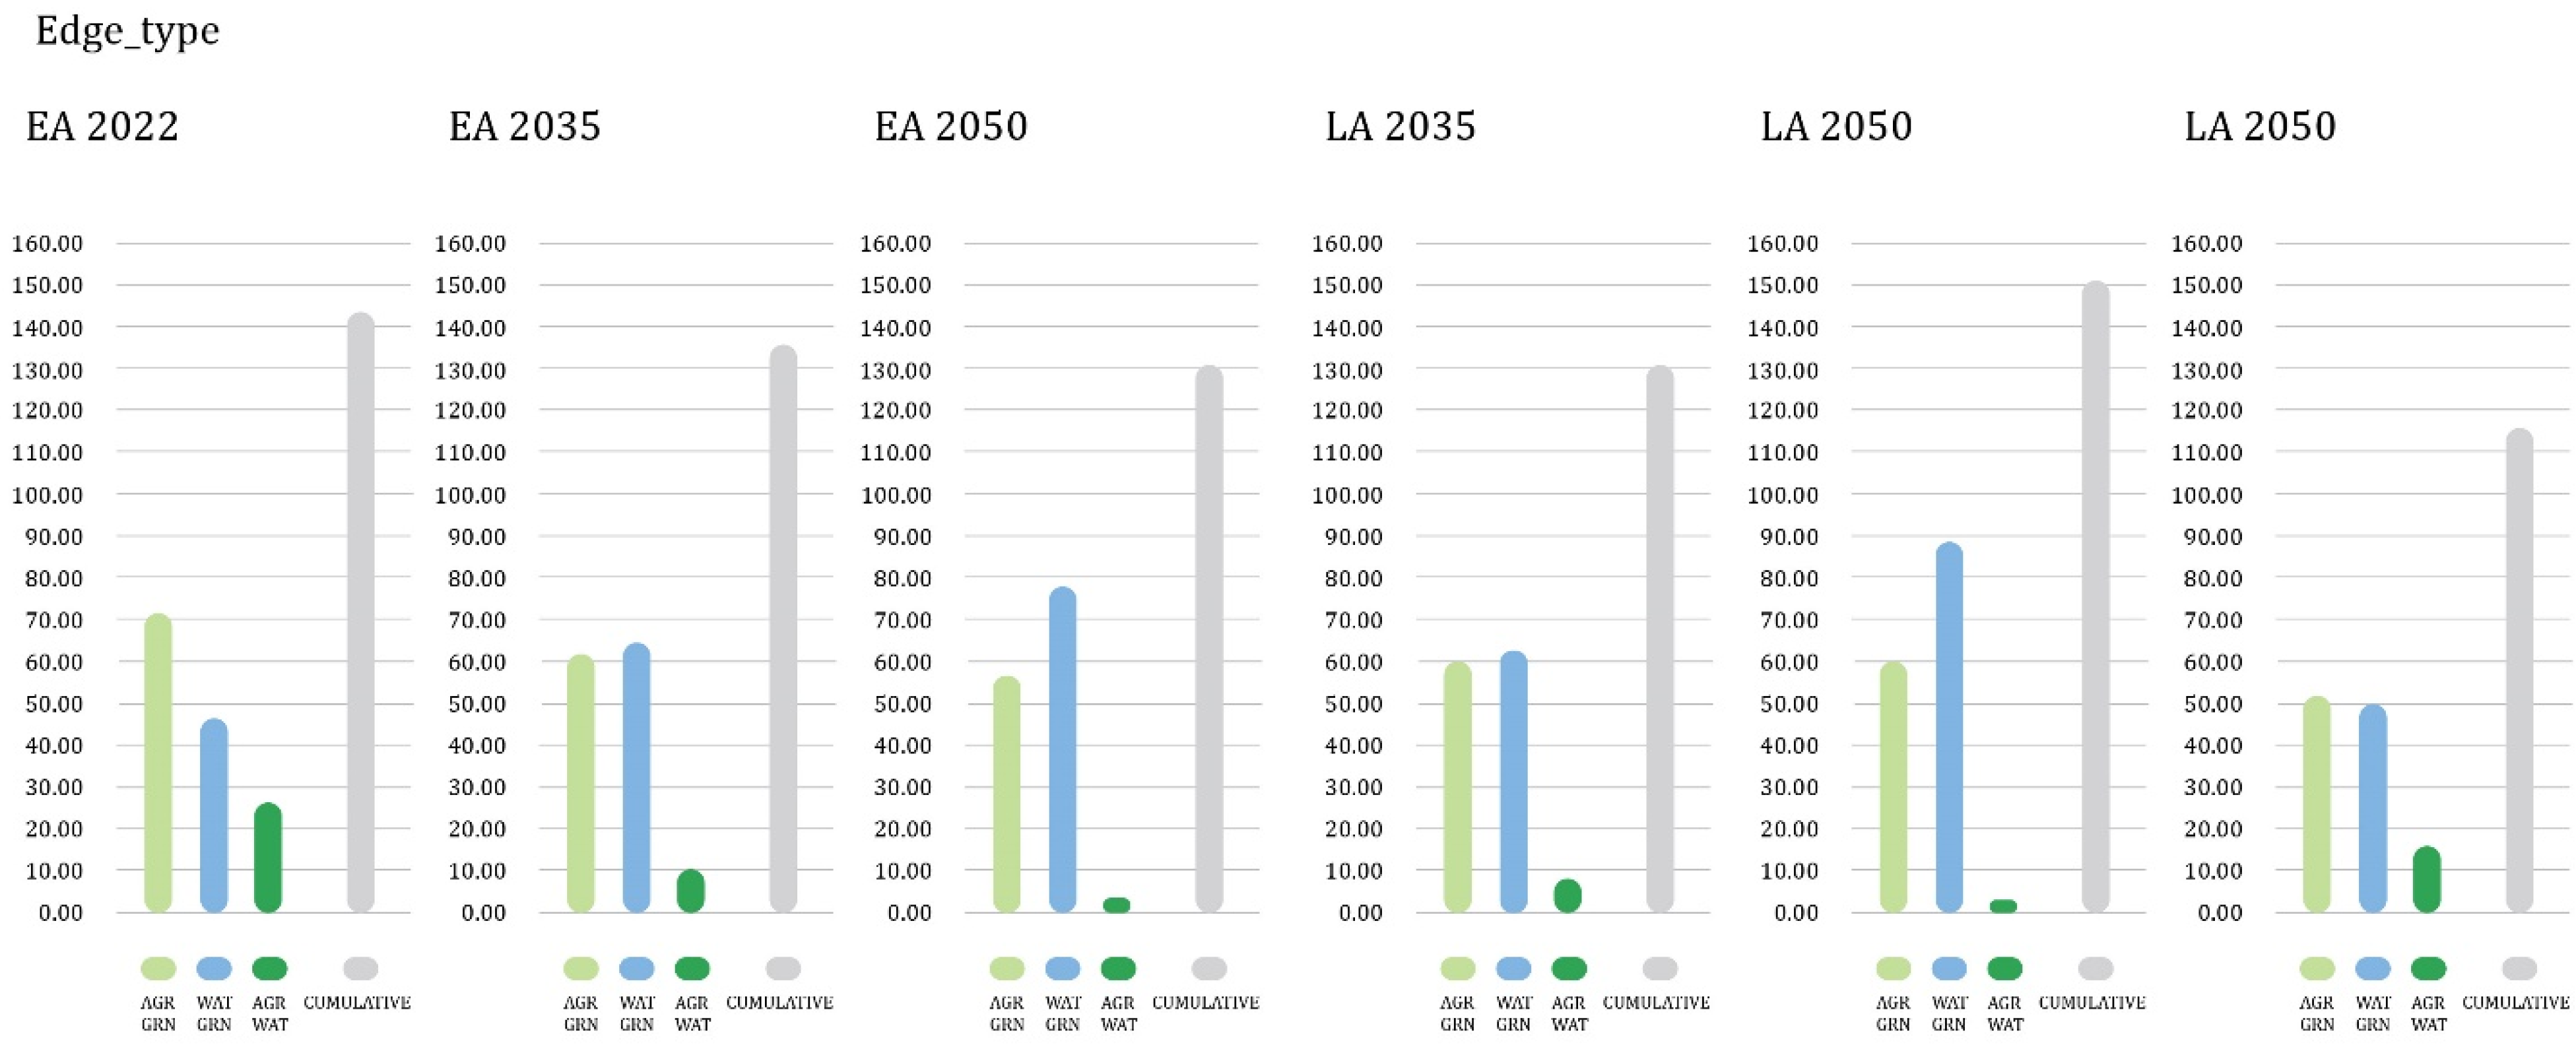
| EDGE TYPE | It indicates the transition or ecotone between two different systems, usually used in reference to the terrestrial area under the ecological influence of an adjoining aquatic environment. | Sum value of Edge length between AGR and GRN, AGR and WAT, GRN and WAT infrastructural system | Diversity/ Multi-scale networks and connectivity |
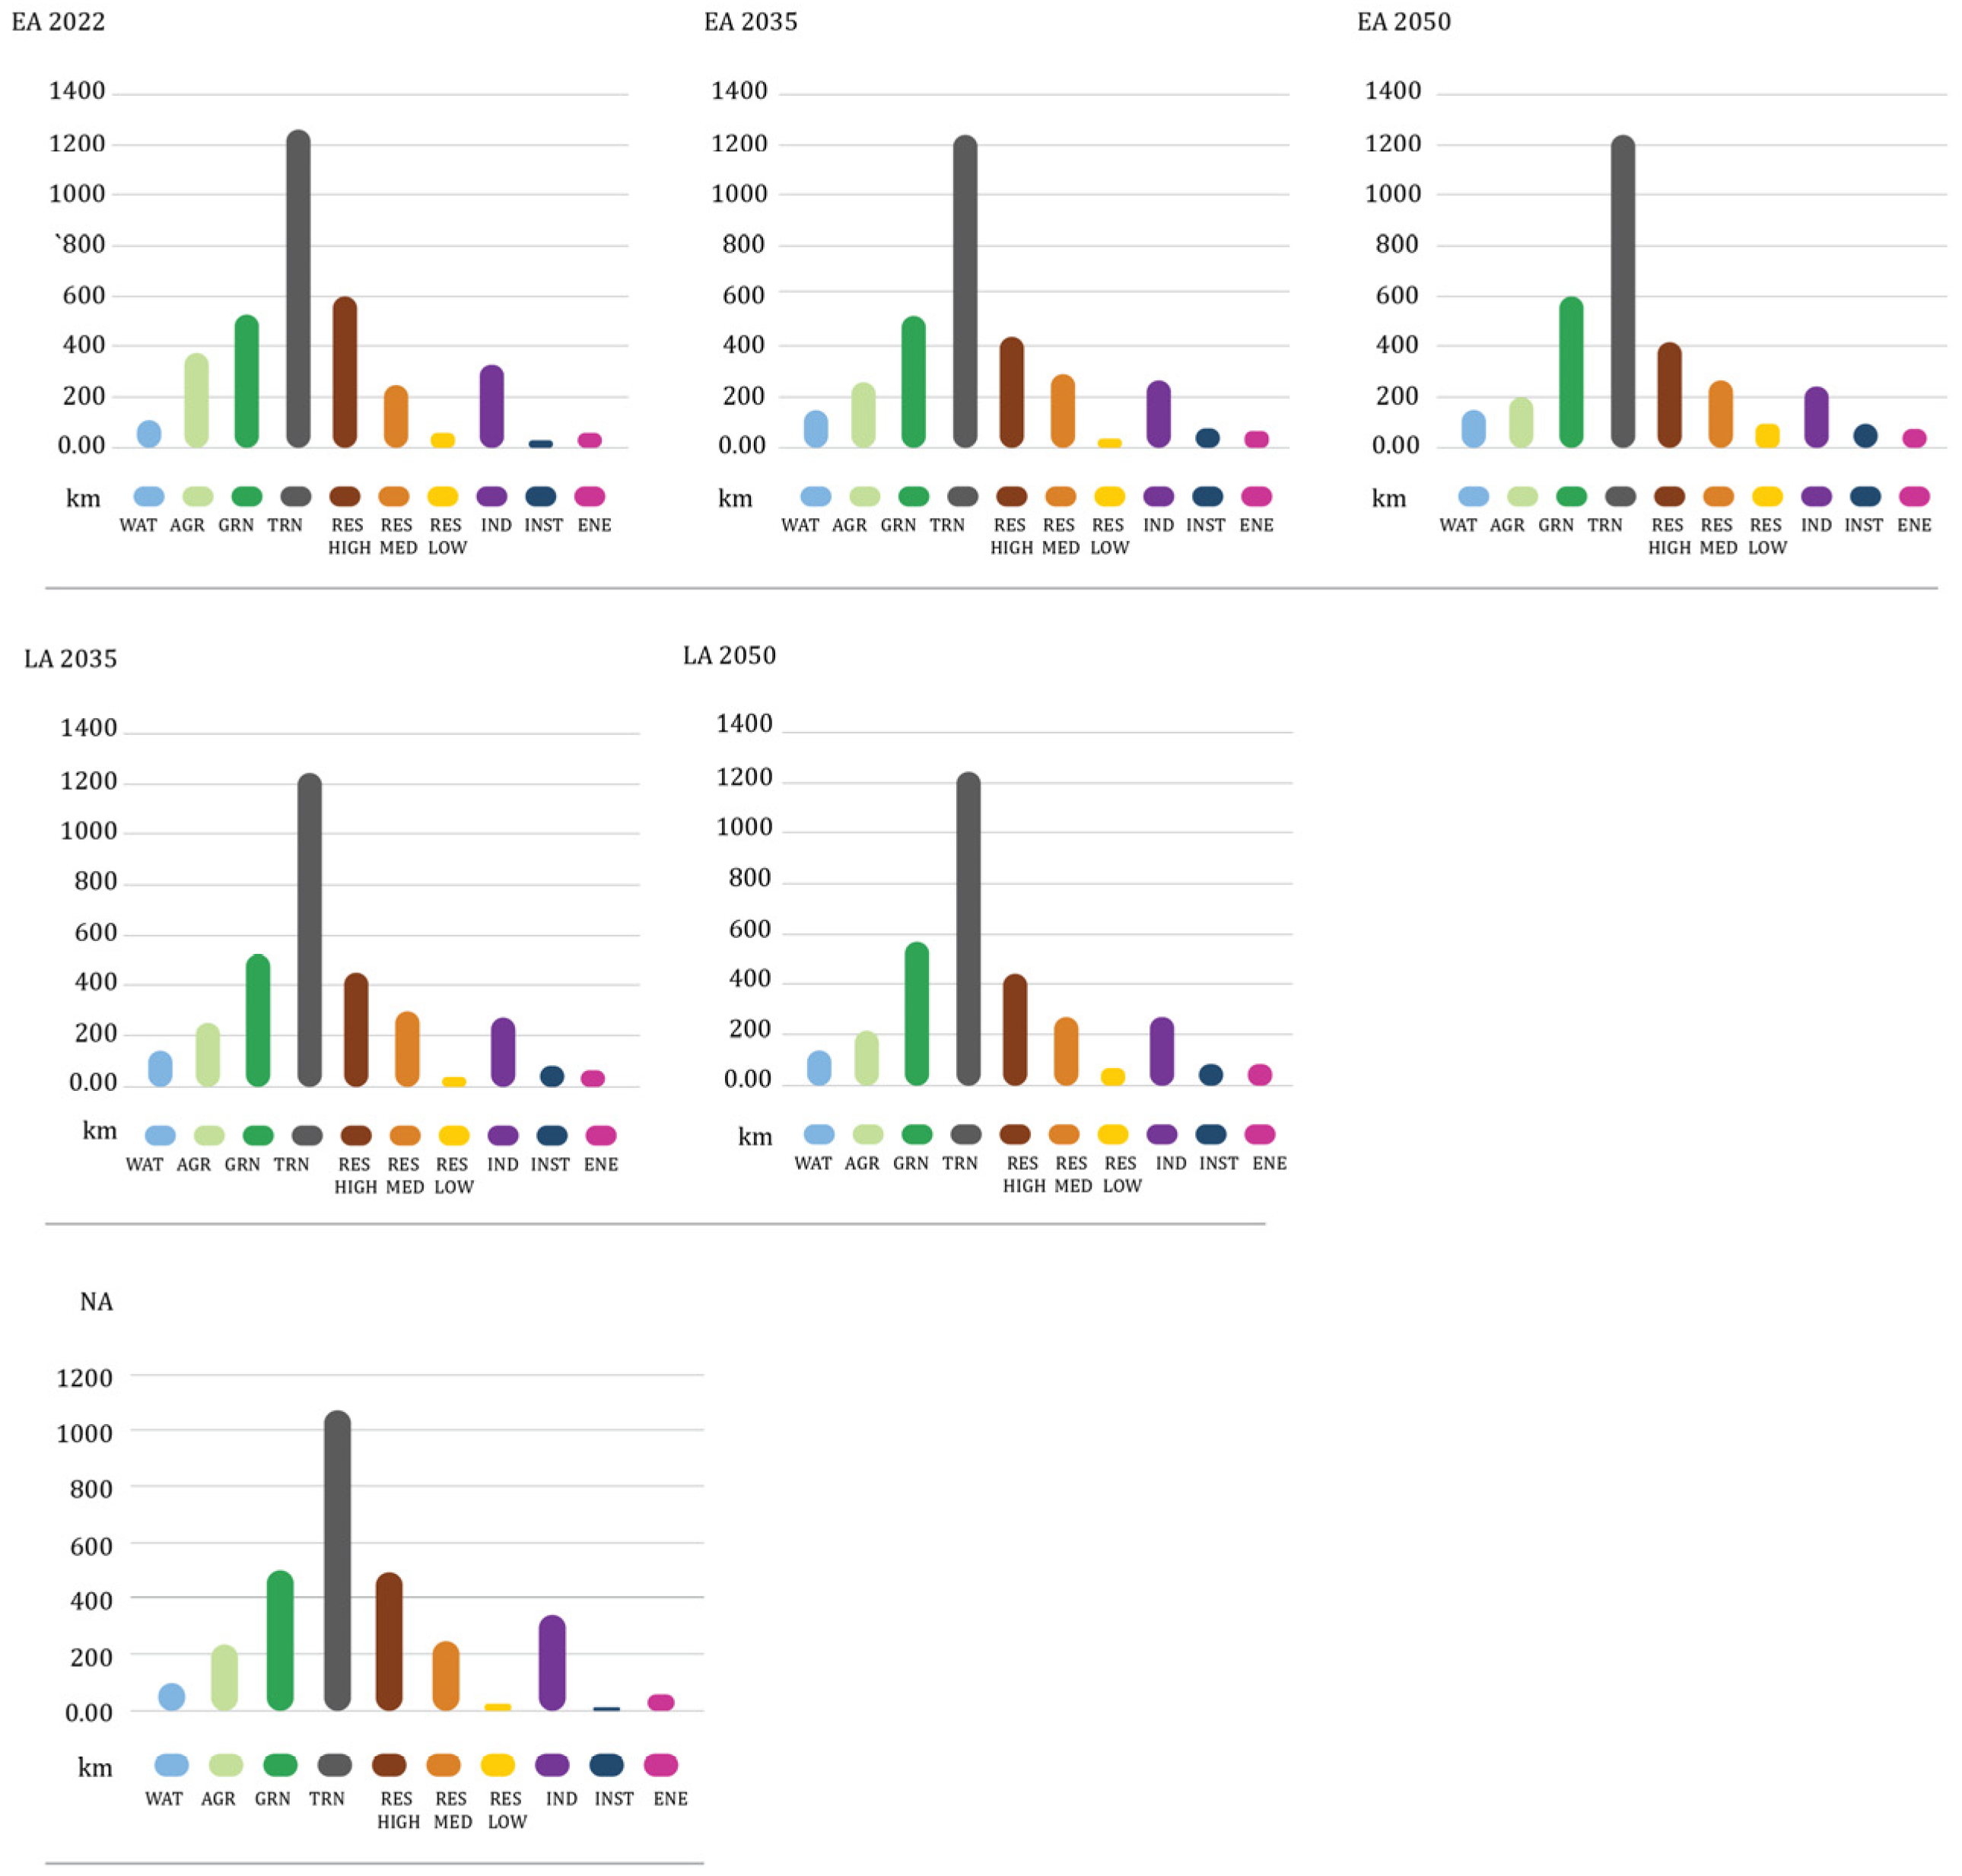
| TE_total edge lenght | It describes the patch area (larger perimeter for larger patches), but also the patch shape (larger perimeter for irregular shapes). | ||
| ENN | It indicates the spatial distribution of patches of a particular type and their proximity as a factor of ecological functionality. | Multi-scale networks and connectivity | |
| system innovations | It represents the possibility of a land use adopting/accepting one or several new functions/land uses/innovations. | Number of adopted inovations | Adaptibility |
| Parametri | EA | LA | NA | Indicators | |||||||||
|---|---|---|---|---|---|---|---|---|---|---|---|---|---|
| 2022 | 2035 | 2050 | 2035 | 2050 | 2050 | ||||||||
| CN | CB | CN | CB | CN | CB | CN | CB | CN | CB | CN | CB | ||
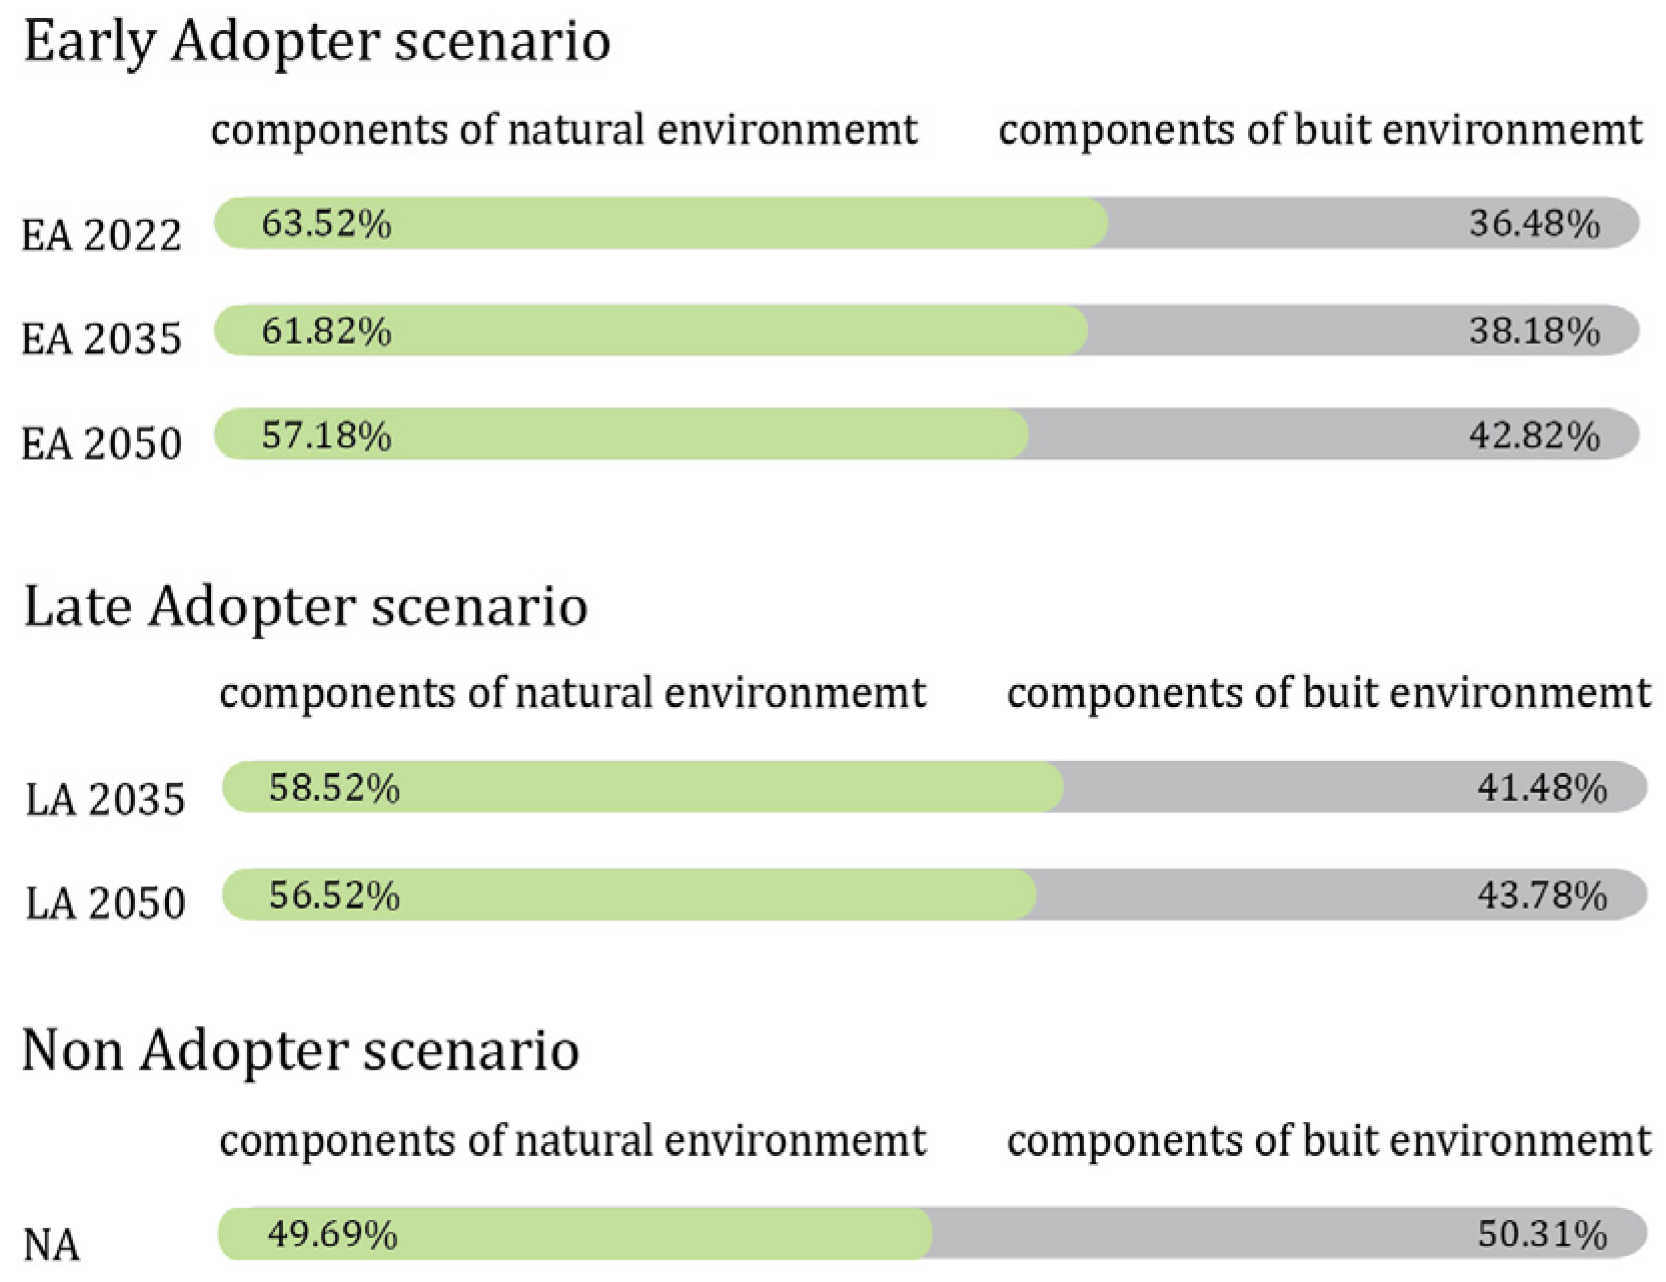
| AREA_ha | 8725.52 | 5011.06 | 8492 | 5244.93 | 7854.72 | 5882.02 | 8038.74 | 5697.8 | 7723.14 | 6013.51 | 6825.72 | 6910.51 | Multifunctionality/ Redundancy and Modularisation/Diversity |
| NP | 525 | 1634 | 616 | 1530 | 591 | 1566 | 594 | 1556 | 587 | 1573 | 486 | 1454 | |
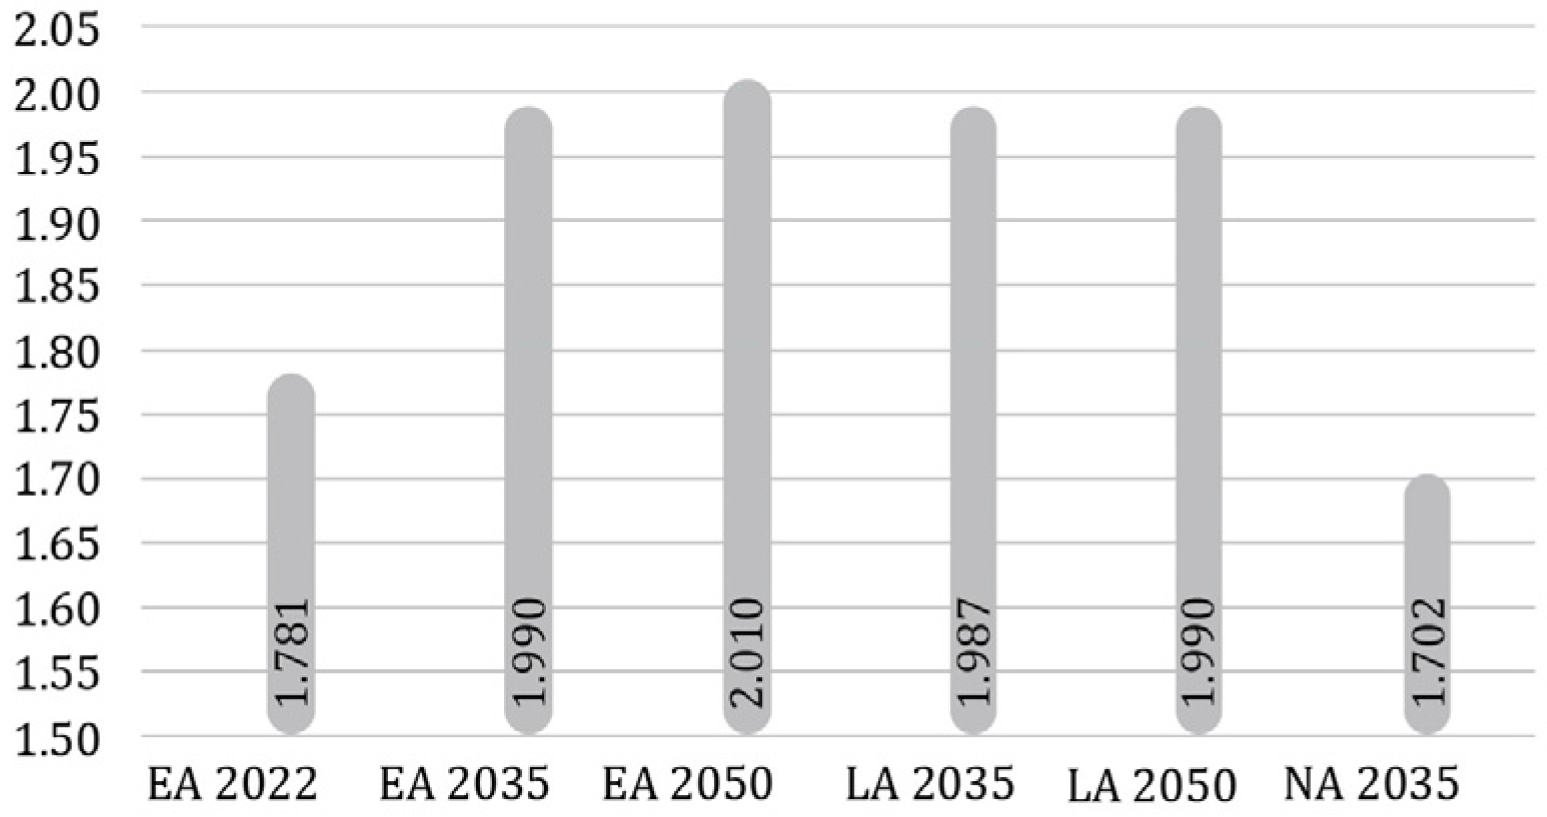
| SHDI | 1.7819 | 1.9904 | 2.0101 | 1.9873 | 1.9907 | 1.7022 | |||||||
| % porosity | 80–100% | 0–30% | 80–100% | 0–30% | 80–100% | 0–30% | 80–100% | 0–30% | 80–100% | 0–30% | 80–100% | 0–30% | Multifunctionality |
| Carbon SQ | 0.35–1.4 | 0.35–0.7 | 0.35–1.4 | 0.35–0.7 | 0.35–1.4 | 0.35–0.7 | 0.35–1.4 | 0.35–0.7 | 0.35–1.4 | 0.35–0.7 | 0.35–1.4 | 0.35–0.7 | |
| EDGE_type | 143.0930 | / | 134.5196 | / | 137.2542 | / | 129.8100 | / | 150.6164 | / | 115.5576 | / | Diversity/Multi-scale networks and connectivity |
| TE_Total edge length | 983.82 | 2530.39 | 932.49 | 2404.2 | 952.54 | 2422.09 | 909.24 | 2431.04 | 919.19 | 2231.32 | 828.45 | 2231.32 | |
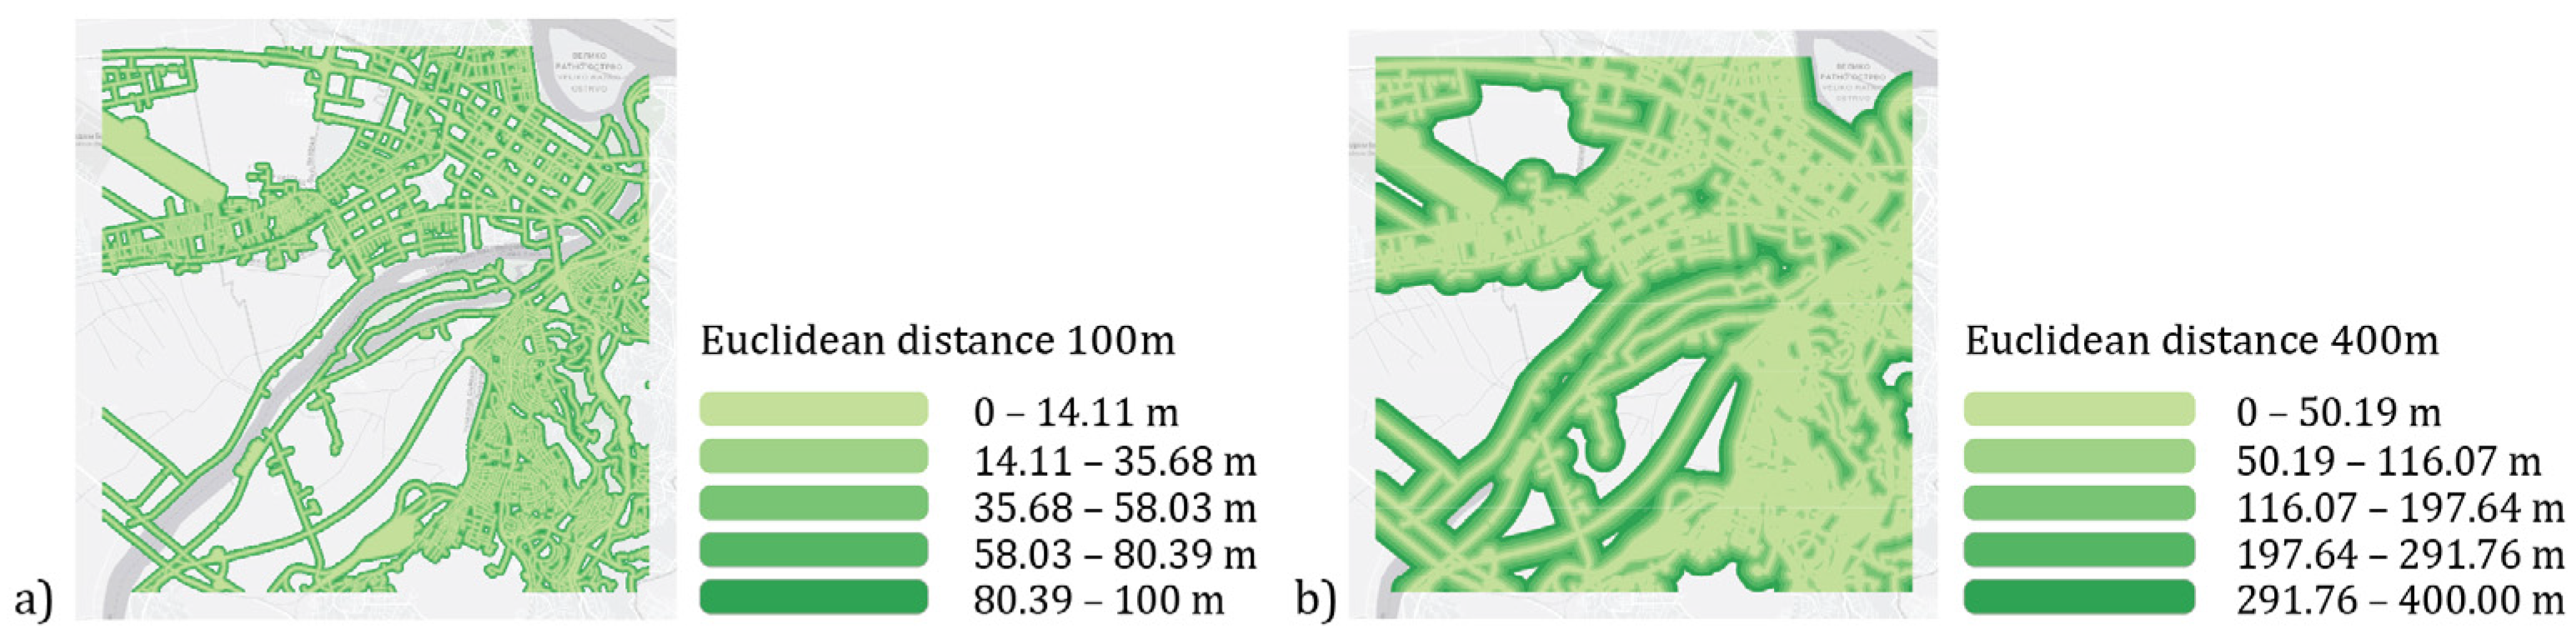
| ENN | 400–1000 m | 0–400 m | 400–1000 m | 0–400 m | 400–1000 m | 0–400 m | 400–1000 m | 0–400 m | 400–1000 m | 0–400 m | 400–1000 m | 0–400 m | Multi-scale networks and connectivity |
| Innovation system | 0 | 0 | 9 | 13 | 7 | 10 | 9 | 14 | 5 | 10 | 0 | 0 | Adaptability |
Disclaimer/Publisher’s Note: The statements, opinions and data contained in all publications are solely those of the individual author(s) and contributor(s) and not of MDPI and/or the editor(s). MDPI and/or the editor(s) disclaim responsibility for any injury to people or property resulting from any ideas, methods, instructions or products referred to in the content. |
© 2023 by the authors. Licensee MDPI, Basel, Switzerland. This article is an open access article distributed under the terms and conditions of the Creative Commons Attribution (CC BY) license (https://creativecommons.org/licenses/by/4.0/).
Share and Cite
Mitrović, S.; Vasiljević, N.; Pjanović, B.; Dabović, T. Assessing Urban Resilience with Geodesign: A Case Study of Urban Landscape Planning in Belgrade, Serbia. Land 2023, 12, 1939. https://doi.org/10.3390/land12101939
Mitrović S, Vasiljević N, Pjanović B, Dabović T. Assessing Urban Resilience with Geodesign: A Case Study of Urban Landscape Planning in Belgrade, Serbia. Land. 2023; 12(10):1939. https://doi.org/10.3390/land12101939
Chicago/Turabian StyleMitrović, Sandra, Nevena Vasiljević, Bojana Pjanović, and Tijana Dabović. 2023. "Assessing Urban Resilience with Geodesign: A Case Study of Urban Landscape Planning in Belgrade, Serbia" Land 12, no. 10: 1939. https://doi.org/10.3390/land12101939
APA StyleMitrović, S., Vasiljević, N., Pjanović, B., & Dabović, T. (2023). Assessing Urban Resilience with Geodesign: A Case Study of Urban Landscape Planning in Belgrade, Serbia. Land, 12(10), 1939. https://doi.org/10.3390/land12101939