Article

The Influence and Prediction of Built Environment on the Subjective Well-Being of the Elderly Based on Random Forest: Evidence from Guangzhou, China

1
College of Horticulture, China Agricultural University, Beijing 100193, China
2
Institute of the Building Environment & Sustainability Technology, School of Human Settlements and Civil Engineering, Xi’an Jiaotong University, Xi’an 710049, China
3
College of Forestry and Landscape Architecture, South China Agricultural University, Guangzhou 510642, China
4
Key Laboratory of Natural Resources Monitoring in Tropical and Subtropical Area of South China, Ministry of Natural Resources, Guangzhou 510642, China
*
Authors to whom correspondence should be addressed.
These authors contributed equally to this work.
Land 2023, 12(10), 1940; https://doi.org/10.3390/land12101940
Submission received: 29 September 2023 / Revised: 15 October 2023 / Accepted: 16 October 2023 / Published: 18 October 2023
(This article belongs to the Section Land Planning and Landscape Architecture)

Abstract

:
Aging and urbanization significantly impact the physical and mental well-being of the elderly population. Empirical investigations have highlighted the contribution of the built environment to promoting elderly health. However, there is a need for further exploration of the factors within the built environment that impact the subjective well-being (SWB) of the elderly. To address this, this study selected 50 communities in Guangzhou, where 1403 elderly people were surveyed. Employing the random forest, we have identified contributing factors of the built environment affecting the SWB of the elderly. Meanwhile, we used a prediction model constructed by random forest to predict the SWB level of the elderly. The results indicated that accessibility to parks (positive emotions (PA): 0.822, positive experiences (PE): 0.235), hospitals (PA: 0.680, PE: 0.546), and supermarkets (PA: 0.237, PE: 0.617) significantly contributed to PA and PE. On the other hand, factors such as population density had a significant contribution to negative emotions (NA: 0.431) and negative experiences (NE: 0.194). Based on the prediction results, the spatial distribution of SWB among the elderly can be derived. Overall, our study can provide planning and improvement strategies for built environments that promote SWB among the elderly.

1. Introduction

The global challenge of population aging affects all countries [1,2]. Based on a report by the World Health Organization, it is expected that by 2050, the global population over the age of 60 will reach 2.1 billion [3], making up nearly 22% of the total population [4]. As people age, the physical function of the elderly is gradually declining, making them more susceptible to physical and mental illnesses [5]. To be more specific, this brings great pressure to the middle-aged and elderly, so improving the health of the elderly has become one of the important social issues. Meanwhile, more and more people are moving to cities, which is a global trend. Also, a considerable proportion of the elderly now reside in urban areas, thus presenting different challenges to their physical and mental well-being [6]. Furthermore, environmental problems in high-density cities, such as traffic noise [7] and air pollution [8,9], can increase the incidence of mental illness [10]. Hence, it is really important to work on making crowded city environments better and making sure older people stay healthy as cities grow.
Bronfenbrenner [11] introduced the theory of ecology into research on society and cities to emphasize how the environment affects human health. This theory suggests that human health is influenced not only by individual characteristics (such as genetics, age, and lifestyle) but also by built environment factors such as building density, street density, and land use [12,13]. The built environment refers to the objective material environment built by humans living in cities for life and production activities [14]. For elderly people, this environment is not only their residence but also the primary setting for most of their activities [15,16,17,18]. Moreover, current research has confirmed the influence of the built environment on the health of the elderly in many ways, especially in terms of the physical environment [19,20,21]. Studies have explored various built environmental factors affecting the physical and mental health of the elderly, including the density, availability, and accessibility of activity facilities. These factors can significantly impact the social life and health of older individuals [16,18,22,23,24]. Notably, the proximity of urban roads to a community affects the community’s sense of security, thereby influencing the leisure activities and health of older persons [23]. Meanwhile, green spaces in the built environment are also a contributing factor to the health of the elderly. Green space in the living environment will affect the cognitive level of the elderly and the satisfaction of the community [25]. Additionally, the accessibility of parks can encourage older people to stay active and lead healthier lives [22,26]. Overall, the greenness of the neighborhood is conducive to the mental health of the elderly [27]. To better evaluate the impact of the built environment on the health of the elderly, Cervero and Kockelman [28] developed a three-dimensional approach, considering density, mixing degree, and design. Subsequently, Ewing and Cervero [29] introduced two more dimensions: destination accessibility and public transportation distance. This expanded their assessment into a five-dimensional framework. According to the 5D evaluation, the current study conducted more research on the effect of the urban built environment on the physical health of the elderly. Zhang et al. [30] found that the number of POIs, the distance from the park and square, and the number of parks and squares were linked to better physical health for the elderly, while the number of bus and subway stations was significantly negatively correlated with the distance from the nearest station. Yang et al. [26] also found that the density and accessibility of facilities (gyms, parks, fast-food restaurants) could stimulate physical activity in the elderly, reduce BMI, and improve physical health. Moreover, some studies have examined the effect of the built environment on such physical diseases as coronary heart disease, hypertension, diabetes, and so on [31]. Current research has focused on how the built environment affects physical health. However, with the development of high-quality cities, the enhancement of individuals’ subjective well-being has assumed a pivotal role in the contemporary governmental agenda for enhancing livelihood, and the SWB of the elderly has recently received increasing attention [32,33]. First proposed by Edward Diener in 1984, subjective well-being (SWB), as the core of a person’s experience, including the positive aspects, and the overall assessment of a person’s life [34], represents an important psychological indicator for life quality. Therefore, to improve the quality of life of the elderly and promote mental health, it is necessary to further explore the impact of the built environment on the subjective well-being of the elderly.
At present, there have been studies delving into the relationship among community cohesion and community belonging and the SWB of the elderly [35]. Some studies indicated that the perceived built environment and community consciousness could help explain how residential density affects SWB [36]. When it comes to the built environment, the mix of land use, health facilities, and leisure facilities exerted a positive impact on SWB, while the density of financial facilities seemed to have a negative influence on SWB [19]. Previous research has found that accessibility to facilities such as medical centers, banks, and parks in the neighborhood is associated with the well-being of the elderly [19,32,33]. Favorable living environments and convenient infrastructure are important for SWB [19]. Nevertheless, different studies have looked at different built environment factors and came to different conclusions. Hence, more empirical studies are still needed to supplement the built environment factors affecting the SWB of the elderly, especially the cases of the built environment in high-density cities. Moreover, current research mainly explores the impact mechanism of built environment on the SWB of the elderly, with a lack of studies employing these impact factors to predict the SWB level of urban areas and provide suggestions for urban planning.
For the purpose of addressing the existing problems, this study aimed to investigate the determinants influencing the subjective well-being (SWB) of elderly individuals within the build environment. Employing the random forest methodology, our research attempted to identify the contribution of built environment characteristics to the subjective well-being of older adults, to predict the level of subjective well-being in each neighborhood, and to better understand the spatial differences of the SWB of the urban elderly population. The results of the study can offer guidance for making changes in the physical environment to promote healthy aging in high-density cities in China, as well as improve the SWB of the elderly by delivering appropriate improvements to the built environment.

2. Materials and Methods
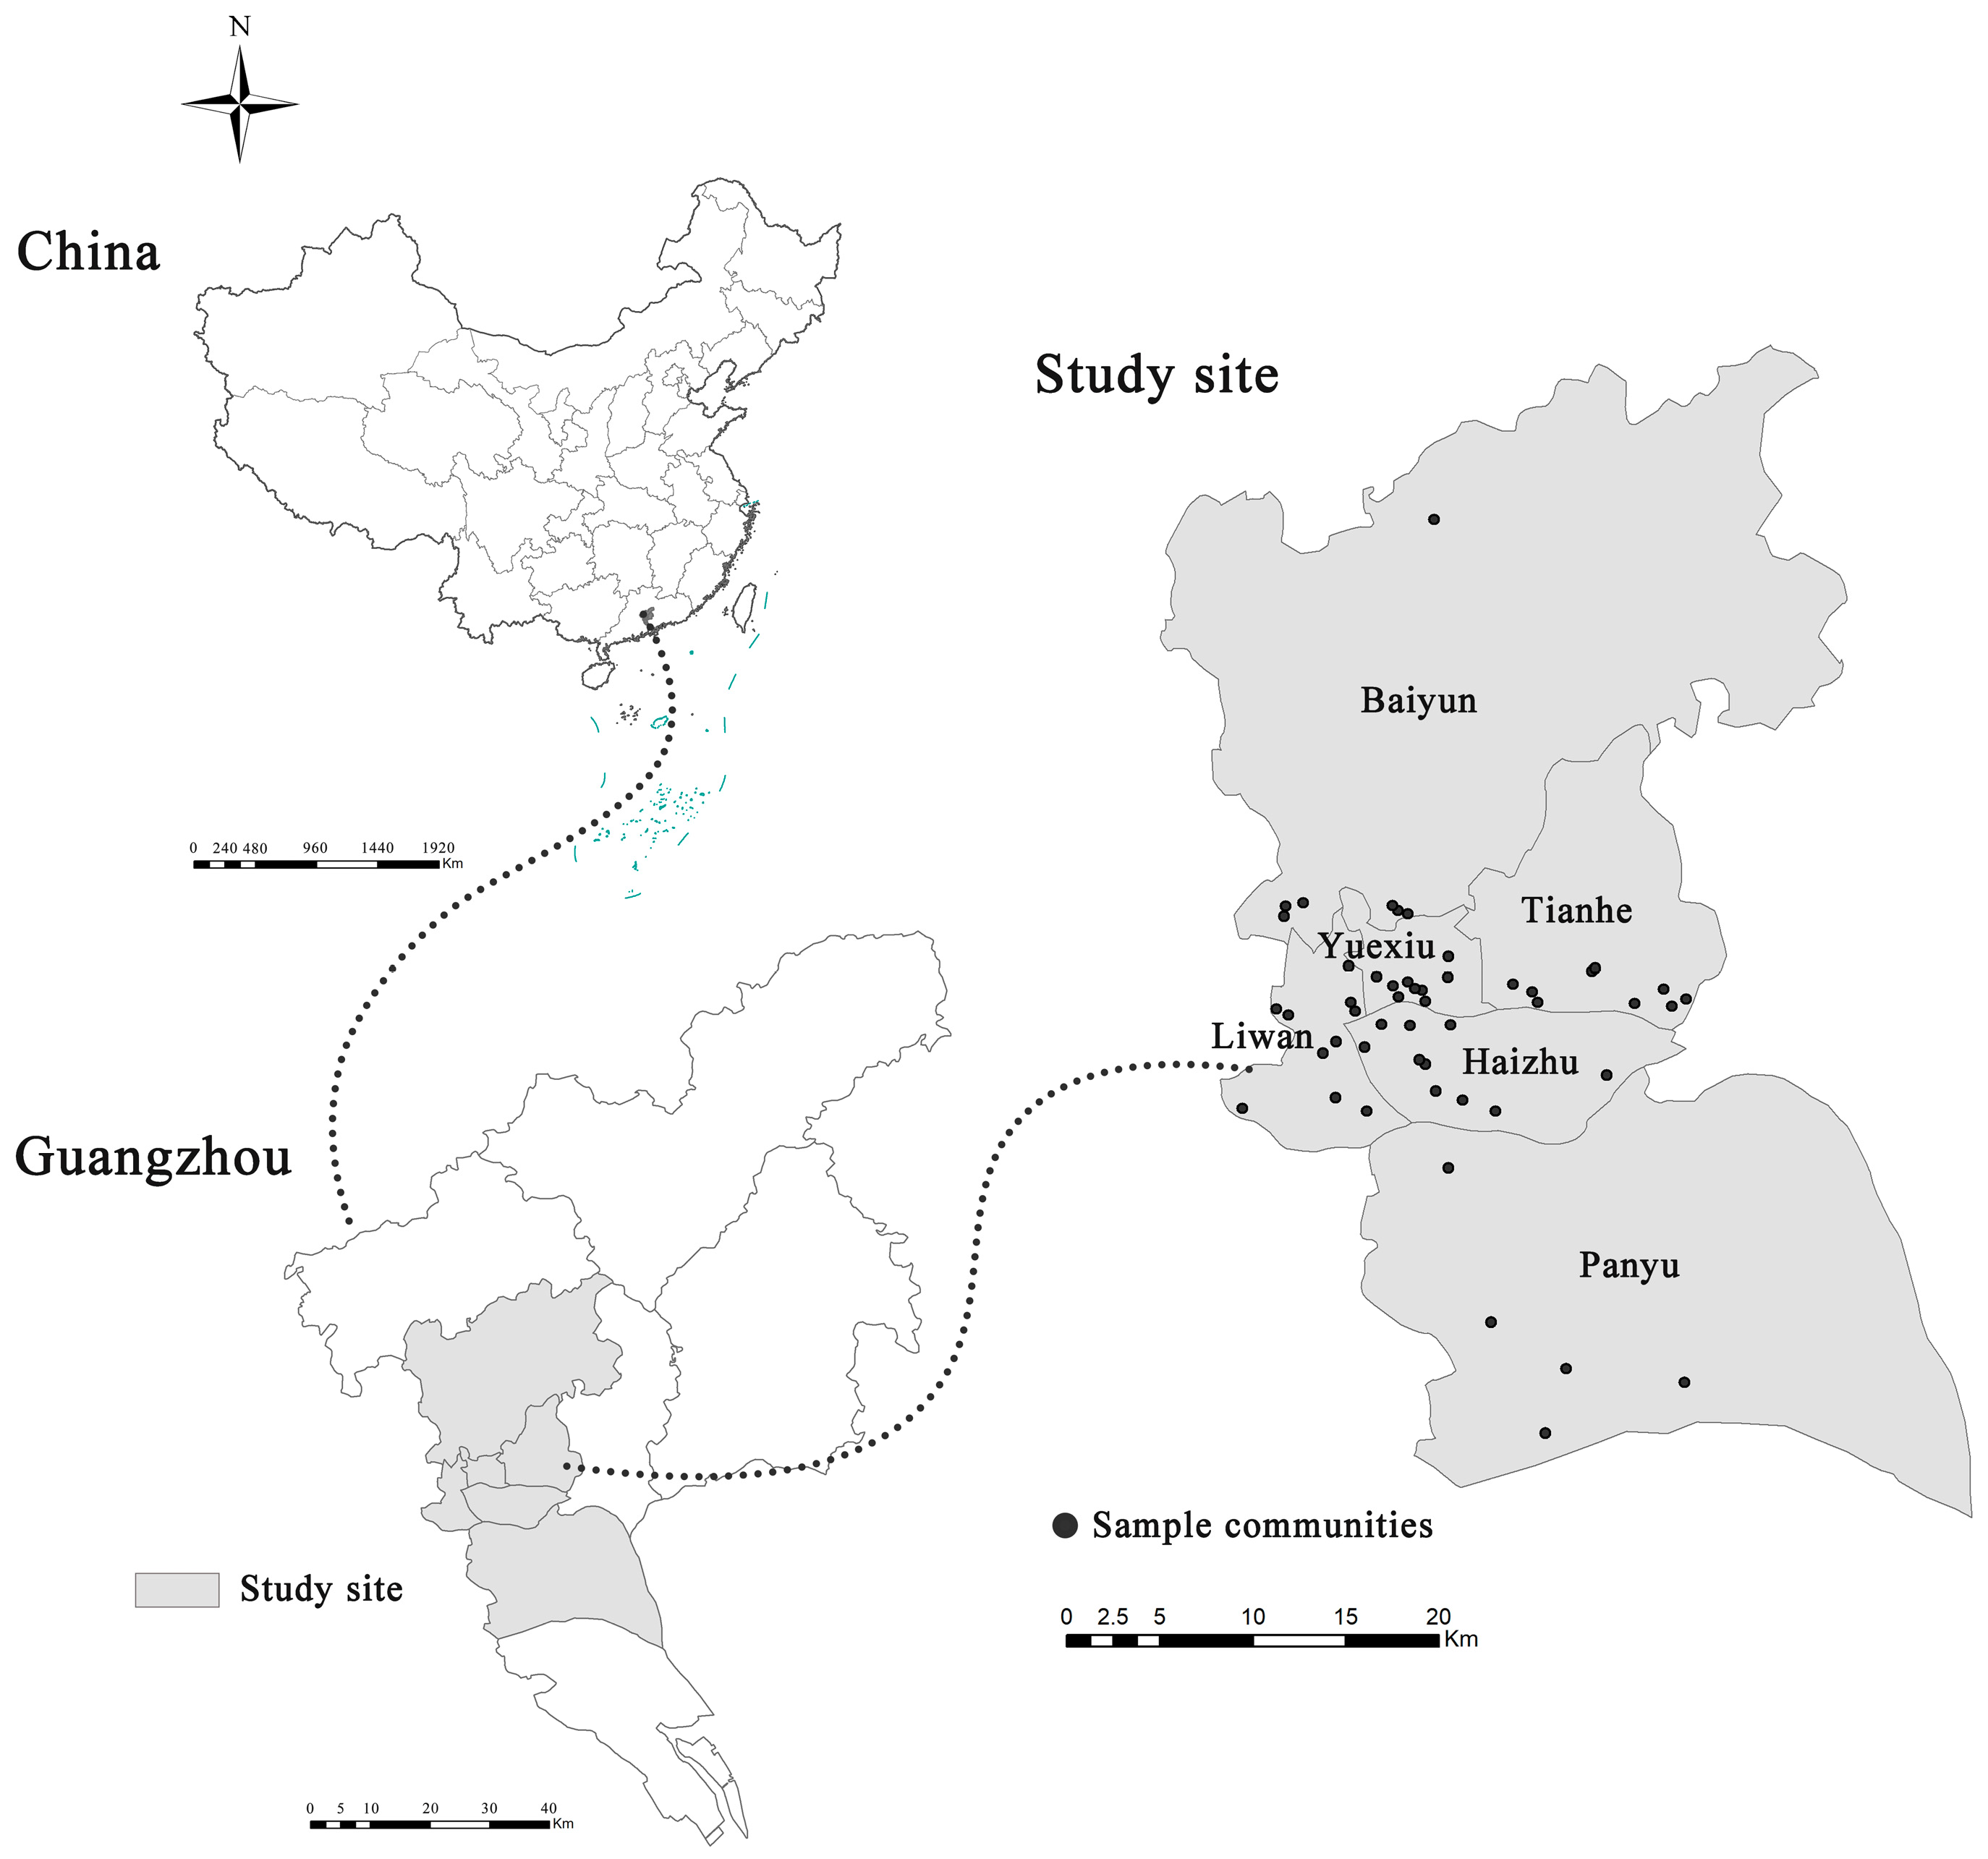
2.1. Study Site

As one of China’s megacities, Guangzhou has witnessed rapid changes in its urban spatial configuration, bringing about a transformation of its built environment [37]. Concurrently, the elderly population in Guangzhou has been increasing at a significant rate. To be specific, the proportion of the aging population in Guangzhou was projected to be 18.7% in 2022. Among this demographic, individuals aged 60 and above constituted 18.27%, while those aged 65 and above accounted for 13.01%, indicating a trend toward moderate aging. This study utilized the multi-stage stratified probability sampling technique (PPS) in proportion to the overall size and selected six inner districts of Guangzhou for the research: Yuexiu, Haizhu, Liwan, Tianhe, Baiyun, and Panyu (Figure 1).

2.2. Participants

From September to December 2022, we conducted a questionnaire survey among residents of Guangzhou aged over 60 years old who had been living in Guangzhou for more than 6 months. The participants were required to have the ability to move independently and communicate clearly. According to the proportion of the registered population of elderly people aged over 60 in each district, 50 communities were selected. In each of these communities, we collected responses from 30 elderly participants (Figure 1). Finally, 1403 valid questionnaires were collected, with a recovery rate of 93.5%. Meanwhile, we controlled for participants’ socioeconomic and demographic covariates, including age, gender, education, income, marital status, and family situation.

2.3. Measures

2.3.1. Subjective Well-Being (SWB)

Subjective well-being (SWB) was assessed using the Memorial University of Newfoundland Well-being Scale (MUNSH), a tool specifically designed for older adults. It has demonstrated high validity (Kaiser–Meyer–Olkin’s test, 0.703) and consistency (Cronbach’s alpha 0.735). The MUNSH covers four dimensions: PA (positive emotion), NA (negative emotion), PE (positive experience), and NE (negative experience). The formula for SWB is SWB = PA − NA + PE − NE. Comprising 24 items, the MUNSH is a multi-faceted assessment tool, incorporating a constant value of 24 aimed at simplifying the computational process. Scores on the MUNSH scale range from 0 to 48, with higher values indicating better subjective well-being [38]. This study analyzed SWB and its specific dimensions.

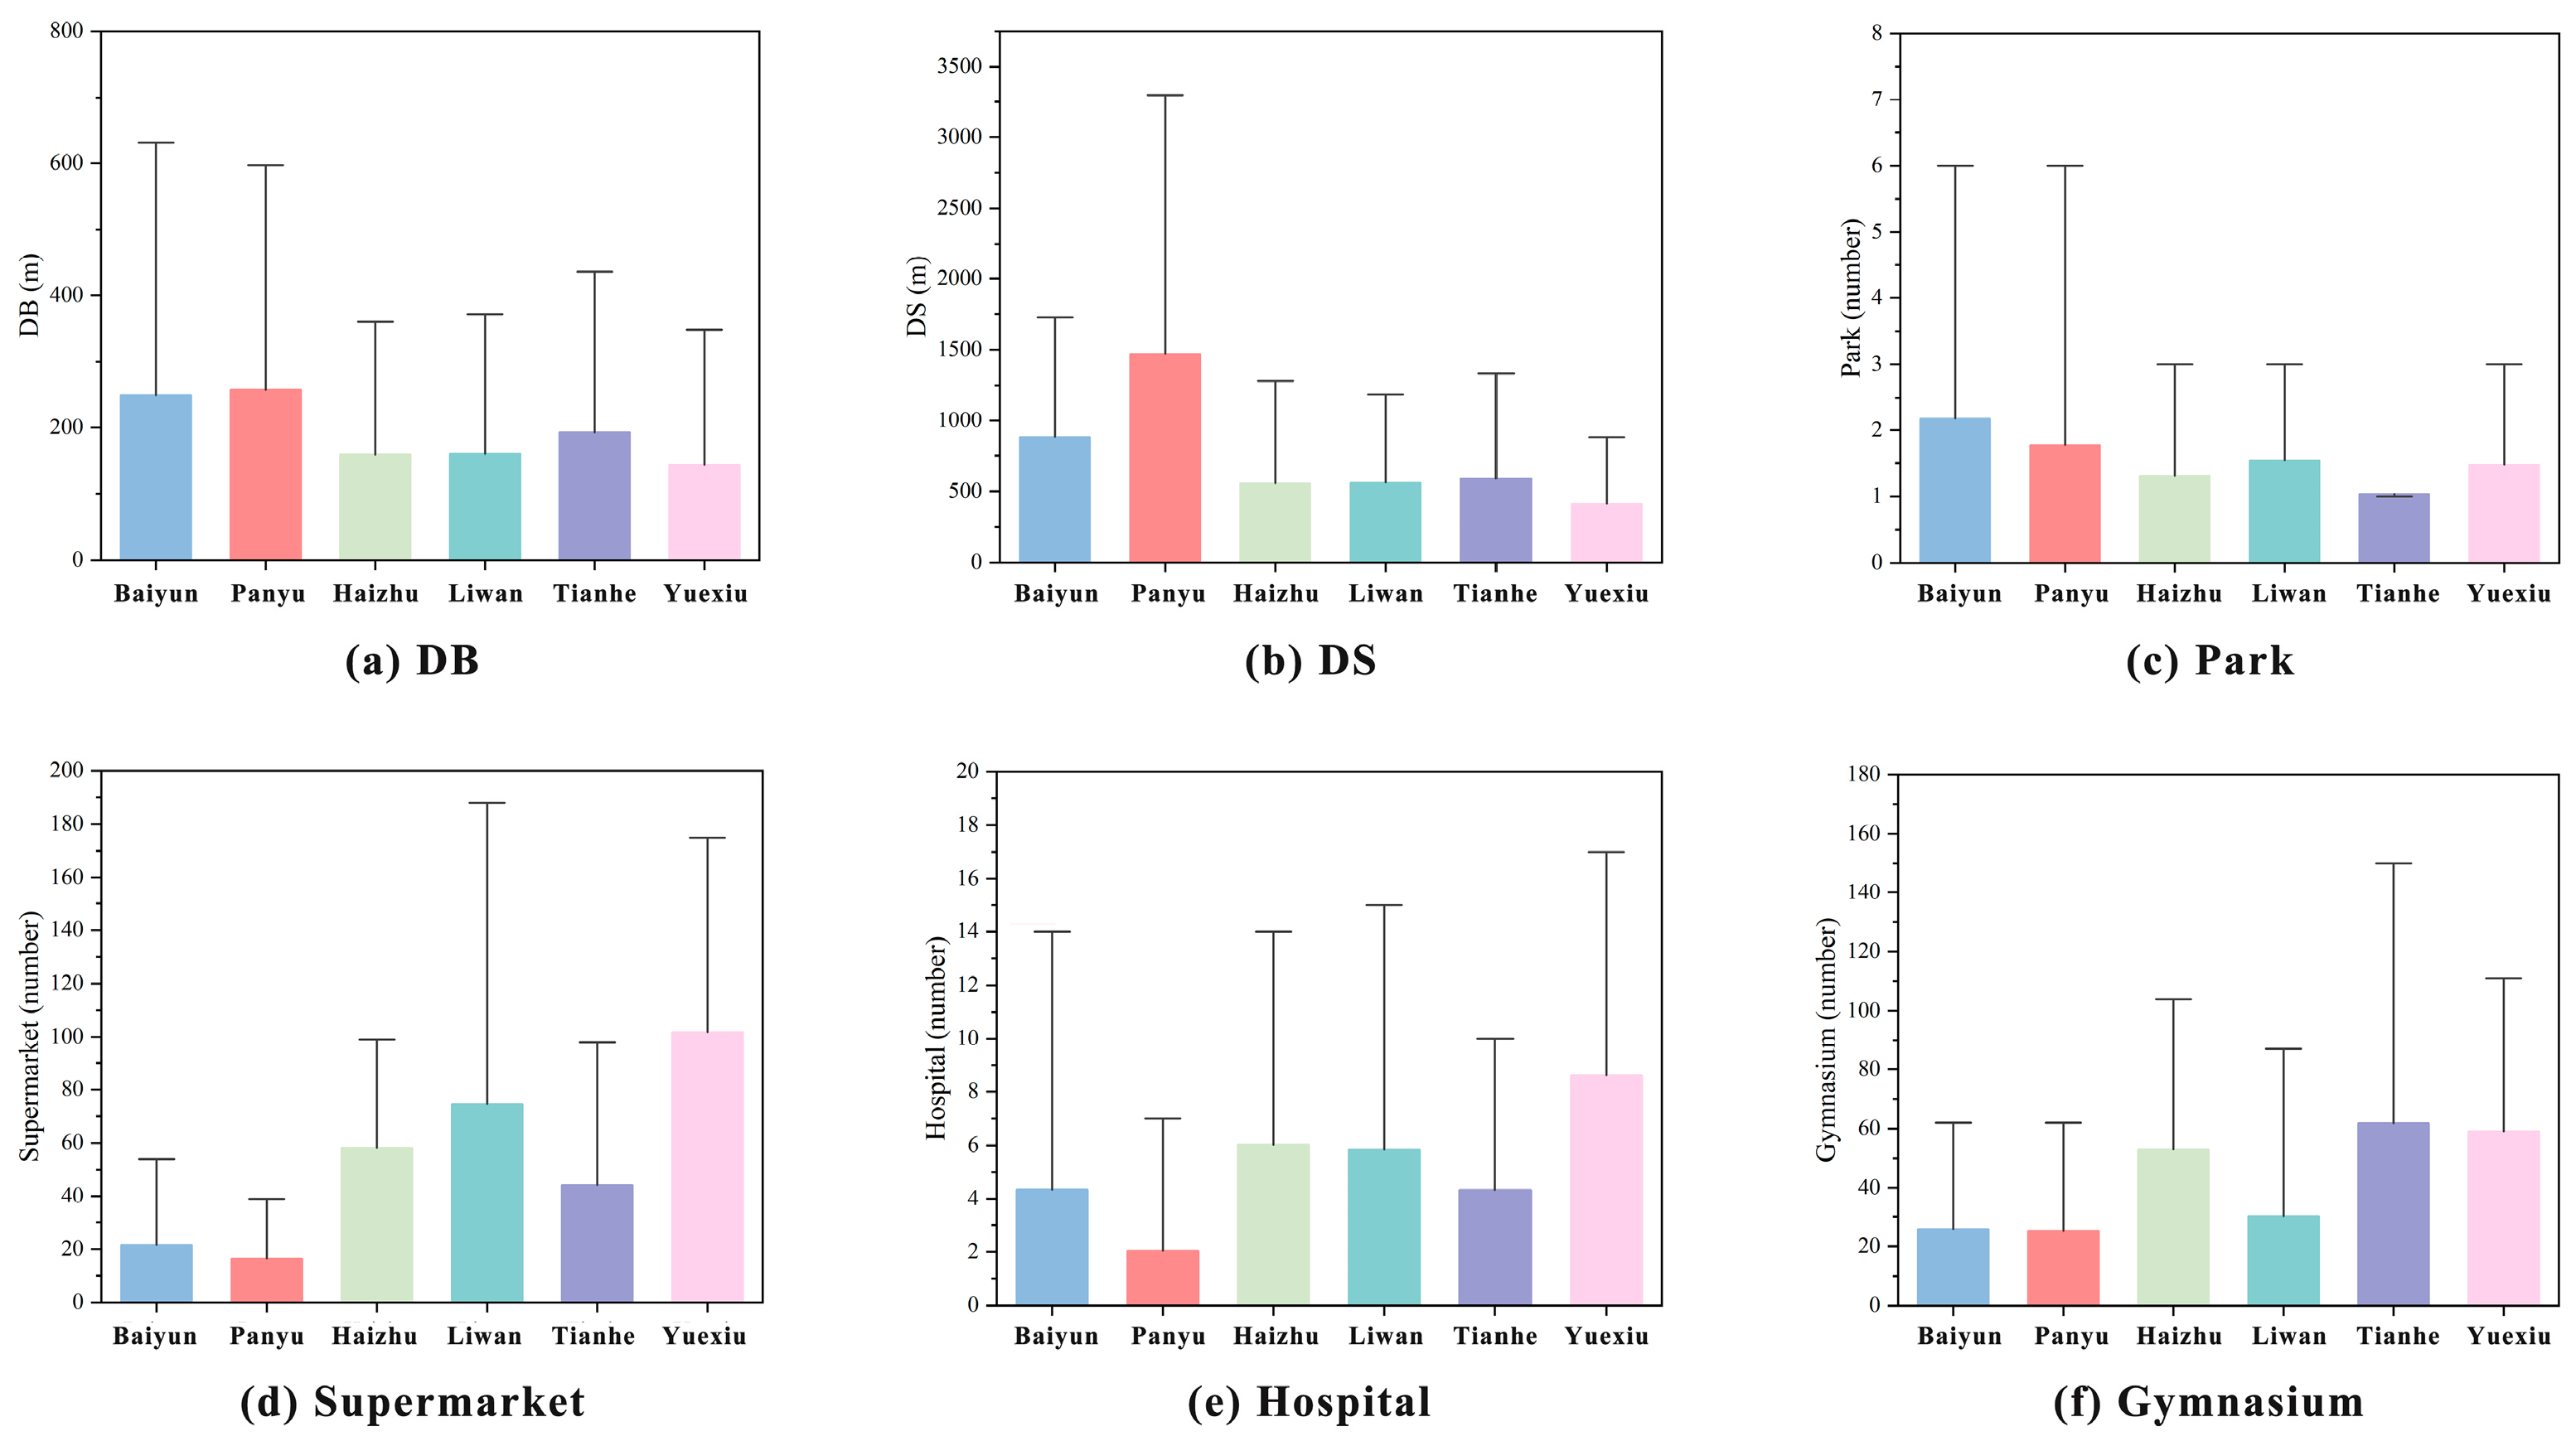
2.3.2. Built Environment Characteristics

Given that many older people spend most of their retirement time at home or in the community [39], the built environment of these communities profoundly influences the health of the elderly. This study identified variables for the characteristics of the built environment based on the 5D variables of the built environment, which included density, diversity, design, distance to transit, and destination accessibility [29]. These variables have been shown to significantly impact residents’ subjective well-being. We used a Euclidean (straight line) buffer zone of 1 km from each community location (about a 15 min walk for the elderly) as the extent of the neighborhood built environment.
  • Density: Population density (POD). Population density was calculated using the ratio of the sixth census data to the area of the region.
  • Diversity: Land use mix (LUM). The concept of information entropy was introduced to calculate the land use structure. When entropy approaches 1, it represents higher land use diversity. When the land use is as uniform as possible, the entropy is 0 [40]. The formula was as follows:
    H ( x ) = i = 1 n P i l n P i
    where H(x) is the entropy of the neighborhood x and Pi is the probability of different types of POIs in the 1 km buffer based on the participant’s community.
  • Design: street density. Street density (STD) was equal to the ratio of the total length of roads in an area to the total area.
  • Distance to transit: The distance to the nearest bus station (DB) and subway station (DS) within the 1 km buffer zone was used to represent the distance to transit.
  • Destination accessibility: This study used the number of public facilities within the 1 km buffer zone of the community to assess accessibility [26,30]. Many studies have confirmed that the public service facilities around the community are an important factor affecting the health of the elderly and are involved in their daily life [38]. These activities encompass not only aspects intrinsic to the residential life, but also those relevant to activities such as shopping, socializing, physical exercise, and medical care [41]. Aligned with the lifestyle of the elderly, this study selected supermarkets, parks, hospitals, and gymnasiums, calculating the number of these facilities within the community’s 1 km buffer zone.

2.4. Data Analysis

In this study, the built environment characteristics were first analyzed using ArcGIS 10.3. The predictive mapping of SWBs was visualized through the graphical representation in ArcGIS 10.3.
To exclude the effects of individual characteristics, stratified regression analysis was applied to test the control variables. Traditional regression models often suffer from suboptimal fit and excessive variable reductions. Therefore, in response to these problems, this study attempted to improve the accuracy of predictions and the retention of variables. To meet this end, the random forest was employed to construct a regression model linking the built environment with the subjective well-being (SWB) of the elderly population. The computational implementation of the random forest was conducted using Matlab 2021a, with rigorous iterations to fine-tune parameters for optimal performance. Following this iterative process, parameters were optimized, with the number of decision trees set at 100 and the number of leaves at 5, while other parameters were maintained at their default settings. The training model divided the data into training sets and test sets in a 4:1 ratio and figured out how important each built environment factor was using this training model. The trained model was used as a prediction model to predict the prediction data set, and the prediction map of SWB was obtained (Figure 2). In addition, IBM SPSS Statistics 27 was used for the statistical analysis of the data.

3. Results

3.1. Descriptive Statistics

The average age of the 1403 participants was 67 years (SD = 8.63). As for the gender proportion, nearly half were male (49.89%), and the remaining half were female (50.11%). In terms of education level, the majority completed secondary school (71.59%). In terms of marital status, a significant portion of participants were married (83.36%). For living arrangements, most participants lived with their families (86.11%). The average monthly income was mainly CNY 2000–4000 (70.39%).
As shown in Table 1 and Figure 3c, among the built environment characteristics, POD (Mean = 336.85, SD = 58.46) exhibited higher values in the Yuexiu, Liwan, Haizhu, and Tianhe districts. Land use structure was richer (Mean = 0.70, SD = 0.17), with higher LUM values in the Yuexiu, Liwan, Haizhu, Tianhe, and southern Panyu districts. STD (Mean = 17.34, SD = 7.20) had higher values in the Yuexiu, Liwan, and Tianhe districts (Figure 3). As presented in Figure 4, communities were closer to a bus station within the community’s 1 km buffer zone (Mean = 195.19, SD = 180.85). The Panyu and Tianhe districts had communities that were especially close to bus stations. The number of supermarkets (Mean = 54.00, SD = 43.83) and gymnasium (Mean = 41.00, SD = 27.10) were more numerous, while parks (Mean = 2.00, SD = 1.20) were the least numerous. Yuexiu District had the highest accessibility to supermarkets and hospitals. Furthermore, Tianhe District had the highest accessibility to gyms, while Baiyun District had the highest accessibility to parks (Figure 4). Participants reported a mean SWB of 22.67, (SD = 2.66); PA (Mean = 5.93, SD = 1.00) scores were lower than NA (Mean = 7.64, SD = 0.90); and PE (Mean = 8.79, SD = 2.08) scores were higher than NE (Mean = 8.40, SD = 0.76) (Table 1).

3.2. Impact of Individual Characteristic

Individual characteristics were controlled during the participant recruitment process to ensure accuracy. In order to test the effect of individual characteristics on SWB and its dimensions, hierarchical linear regression analysis was conducted. In the first level (model 1), independent variables related to individual characteristics were considered. In the second level (model 2), independent variables were introduced to the built environment characteristics’ variables. Furthermore, regression models were constructed with SWB, PA, NE, PE, and NE, respectively, while also accounting for covariates. The results showed that the models for PA, NE, PE, and SWB did not find individual characteristics that significantly affected the dependent variable; thus, the female variable was excluded due to excessive covariance. As presented in Table 2, the results indicated that only individual characteristics were in the NA and age group above 75, and the age variable positively affected NA (β = 1.475, p = 0.018 < 0.05). Drawing upon this finding, it is clear that the factor of a higher age than 75 was associated with an increase in negative emotions. However, all individual characteristics had no significant effect on SWB.

3.3. The Influence of Built Environment on the SWB

As can be seen from the modeling of the hierarchical linear regression, there were fewer built environment characteristics that significantly affect SWB. Furthermore, linear analysis caused some important variables to lose their effectiveness. To gain a better understanding of the built environment characteristics that influence SWB, this study used random forests to develop a robust regression model, which connected the built environment characteristics with SWB and its constituent sub-dimensions. As presented in Table 3, both the training sets and test sets exhibited robust fit and high accuracy, effectively discerning the significance of the built environment characteristics concerning SWB and its sub-dimensions, enabling further predictions.

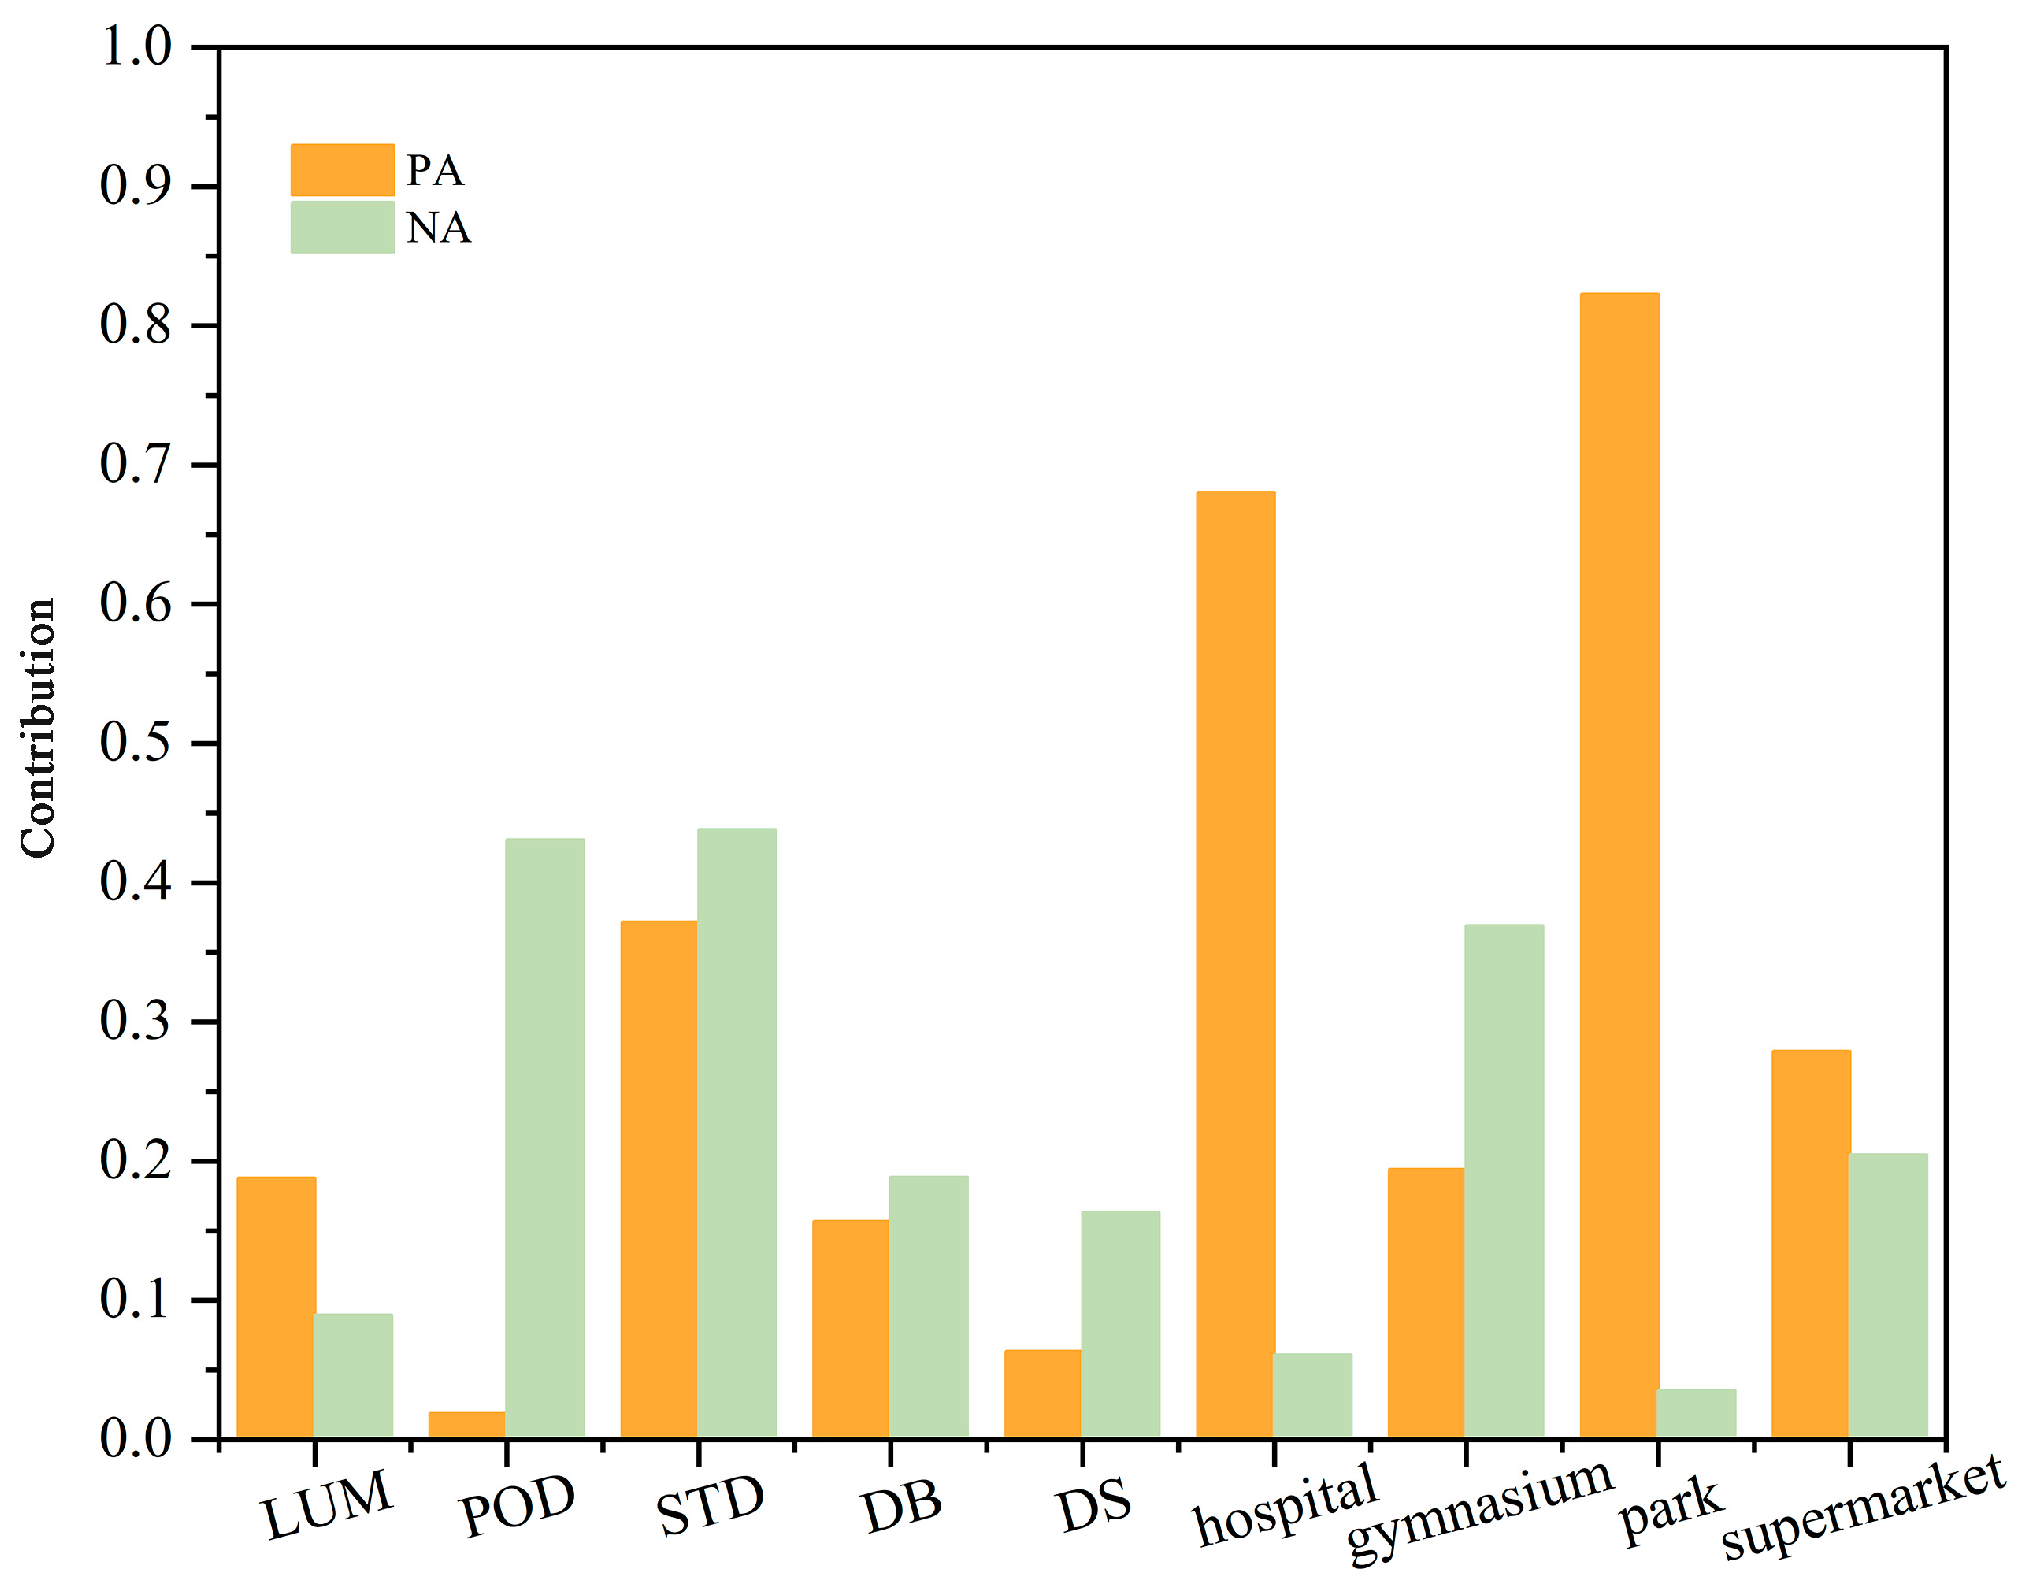
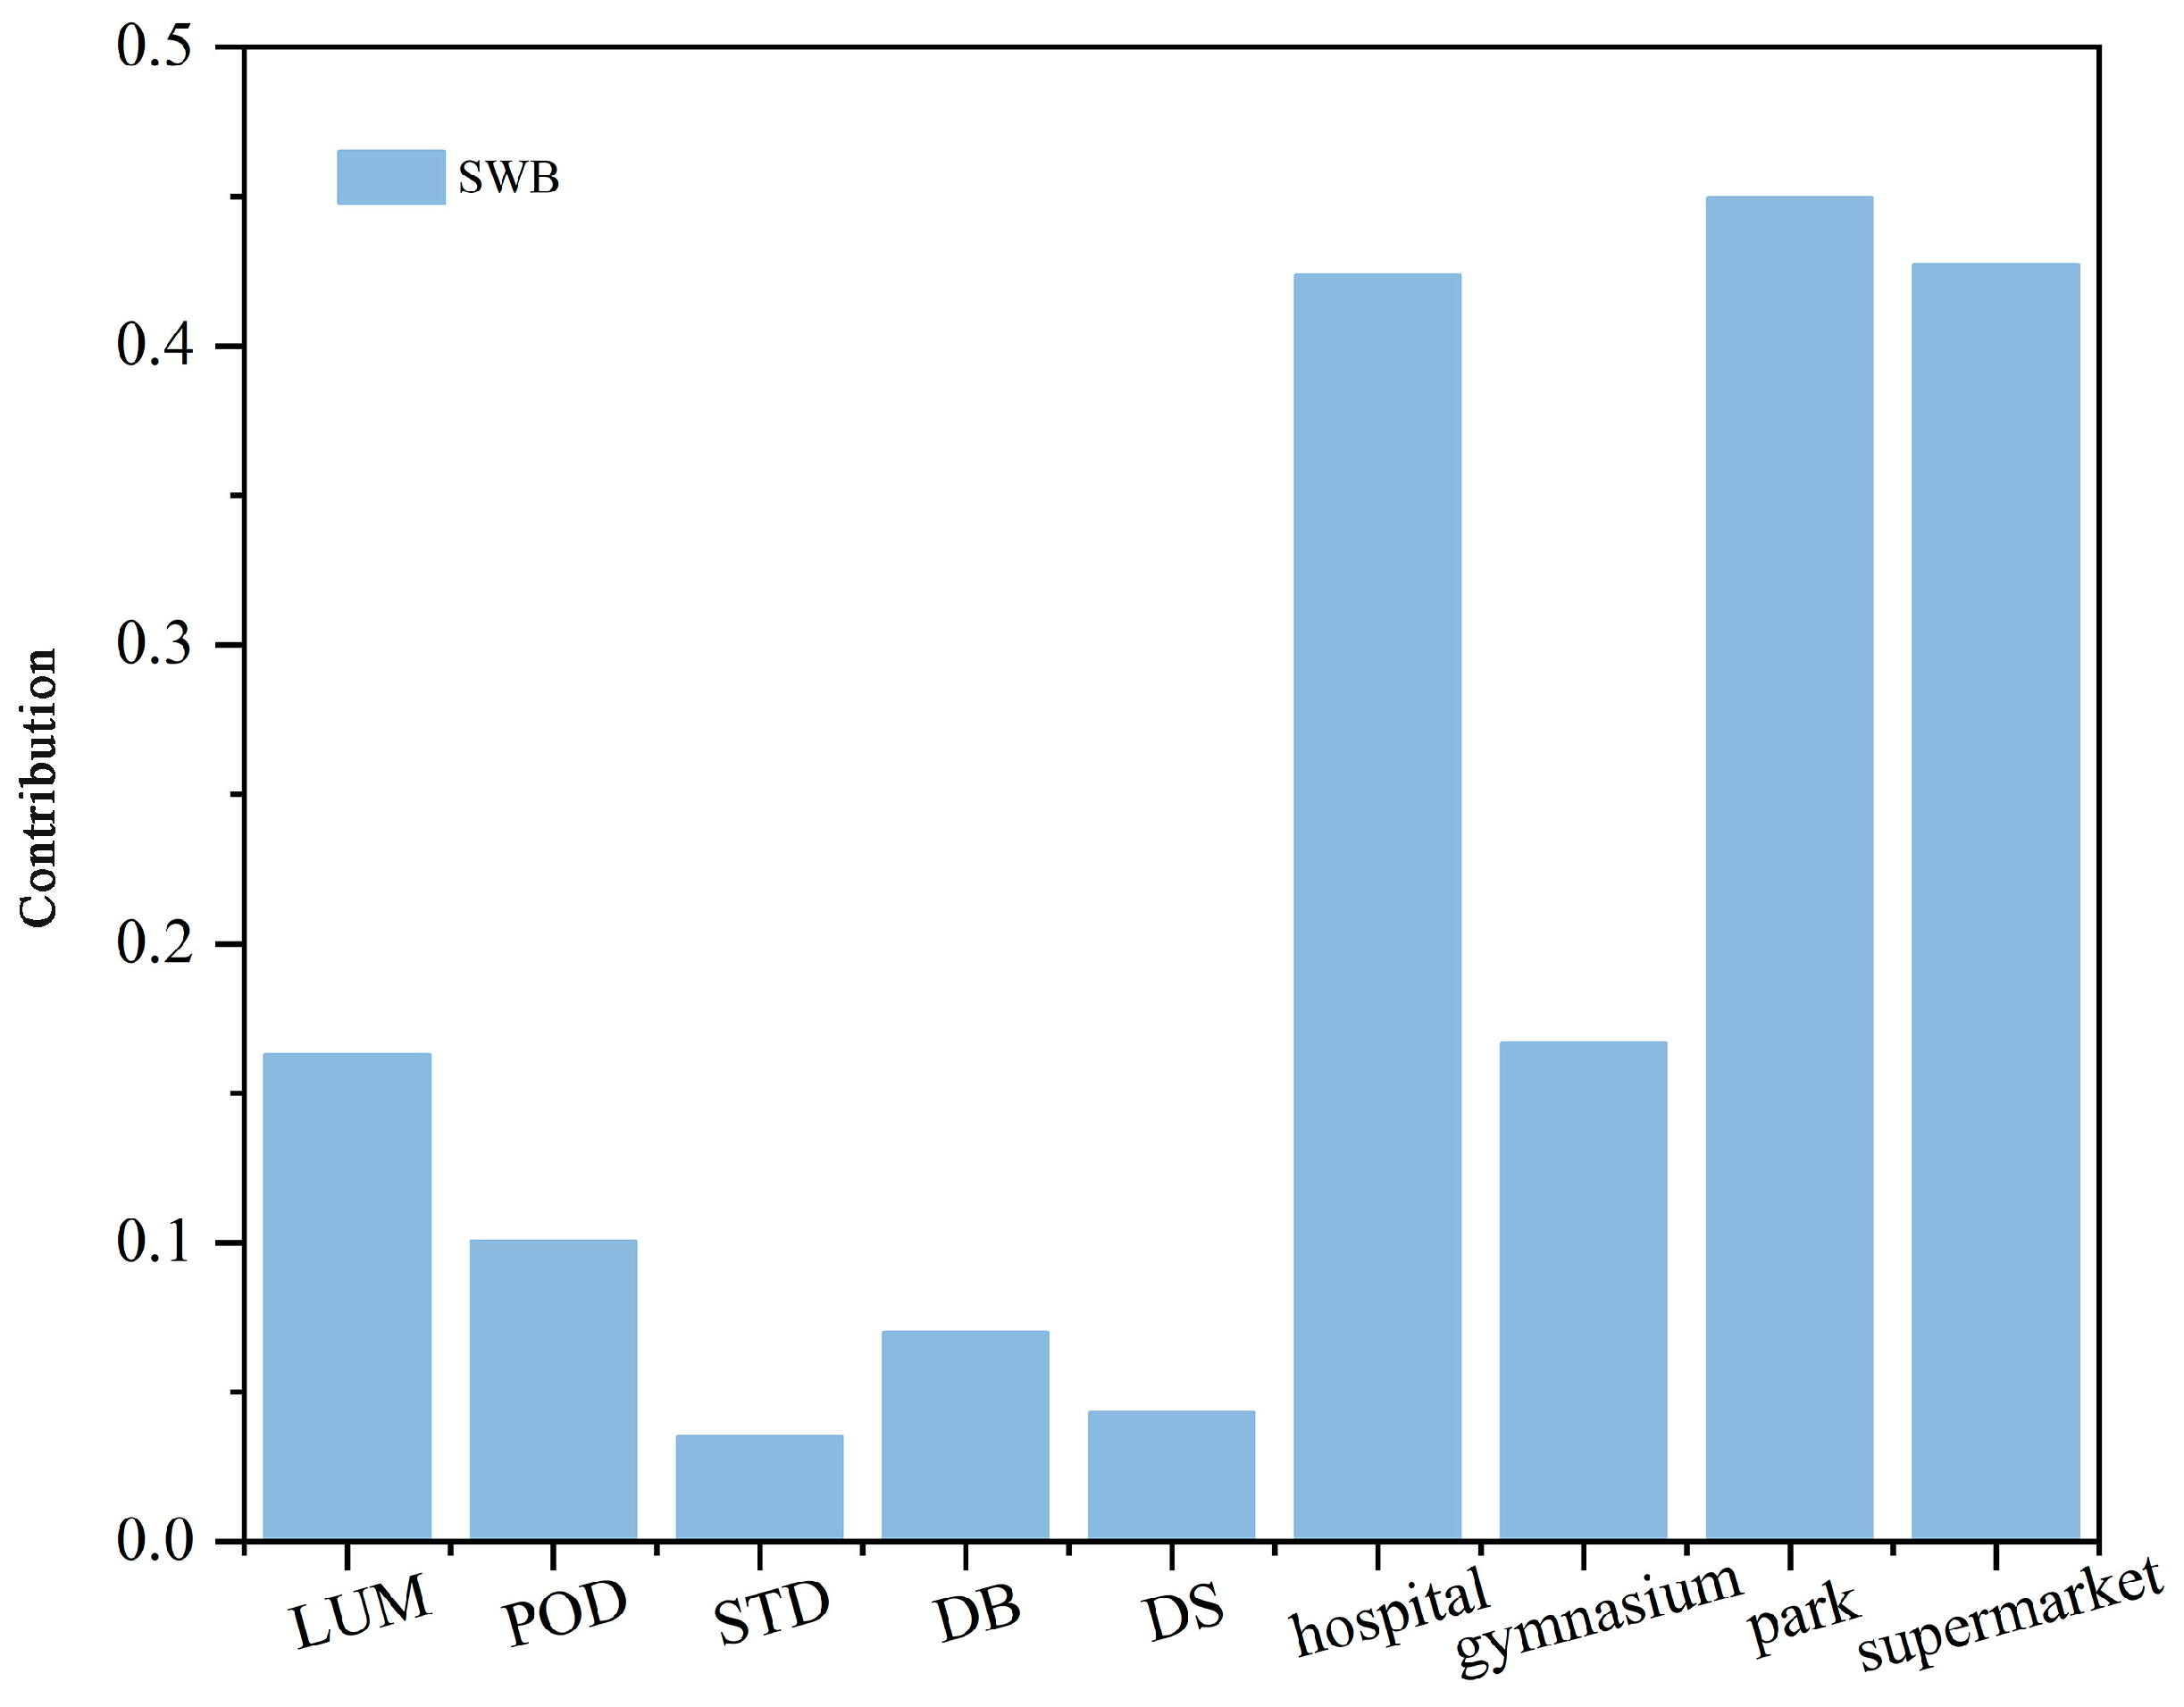
3.3.1. The Contribution of Built Environment Characteristics to SWB

As illustrated in Figure 5, when considering PA, accessibility to parks emerged as the most influential contributing factor, scoring 0.822. In addition, accessibility to hospitals (0.680) and supermarkets (0.237) displayed notable contributions to PA, while POD (0.019) and DS (0.063) were the least influential factors for PA. In terms of NA, POD (0.431), STD (0.438), and accessibility to gymnasium (0.369) were the most contributing factors to elderly NA. In contrast, LUM (0.089), and accessibility to parks (0.034) were less significant for elderly NA. These findings indicate that parks with natural landscapes and facilities that fulfill the medical and basic needs of the elderly play an important role in boosting positive emotions. Conversely, densely built-up streets and places where people gather tend to contribute to the generation of negative emotions among the elderly.
In term of PE, accessibility to supermarkets (0.617) represented the most contributing factor, followed by accessibility to hospitals (0.546) and parks (0.235). Meanwhile, STD (0.029) and LUM (0.040) had comparatively less impact (Figure 6). As shown in Figure 6, even though DS (0.546) had a significant contribution to PE, DS (0.612) contributed more to NE, followed by DB (0.278), POD (0.194), LUM (0.050), and STD (0.027), which were less important for NE. These results suggest that factors related to the daily medical, recreational, and shopping needs of the elderly significantly influence their positive experiences. Conversely, factors such as distance to transit and population density can contribute to negative experiences.
As illustrated in Figure 7, the contribution of the built environment characteristics that affect SWB were identified. The results show that accessibility to parks (0.450) emerged as the most influential factor for SWB, followed by accessibility to supermarkets (0.427) and hospitals (0.423). STD (0.0.35) and DS (0.043) were less important for SWB. In conclusion, the study’s findings suggest that facilities that fulfill the daily needs of the elderly (shopping, medical care, and recreation) are also important factors that influence their SWB.

3.3.2. Prediction of SWB Based on Built Environment Characteristics

Based on the insightful results, we refined the selection of built environment characteristics for our predictions. In the PA predictions, we excluded POD and DB due to their lower contributions. LUM and accessibility to park were excluded from the NA prediction. Moreover, STD and LUM were excluded from the PE and NE predictions. In total, there were 5396 neighborhoods in the study site. Excluding dormitories, hotels, etc., 5348 commercial buildings were selected for prediction. We predicted SWB and its sub-dimensions for these neighborhoods, bringing about prediction maps for SWB and its sub-dimensions.
As shown in Figure 8a,b, the average score for PA was highest in Tianhe District, while other areas with higher scores were concentrated in Yuexiu District, northern Haizhu District, and southern Panyu District. In contrast, the average score for PA was lowest in Panyu District. Yuexiu District had the highest average score for NA, followed by northern Haizhu District, while Tianhe District exhibited the lowest average NA score. It is noteworthy that the average NA scores of the communities in the study sites were higher than those of PA, suggesting higher levels of negative emotions among the elderly. Consequently, increased attention should be directed toward communities with higher NA scores to enhance the built environment, diminish negative emotions, and promote positive emotions among the elderly.
As shown in Figure 8c,d and outlined in Table 4, communities with higher PE scores were widely distributed in the Yuexiu, Liwan, and Haizhu districts. The communities with the highest scores were located in Yuexiu District, while Baiyun District had the lowest average PE scores. Concerning NE, the communities in Yuexiu District exhibited the highest average NE score. Liwan District and the northern part of Haizhu District also had higher mean NE scores, while the lowest average NE score was observed in Tianhe District. The findings suggest that communities in the Yuexiu, Haizhu, and Liwan districts can provide more positive experiences for elders. Also, other communities should improve the neighborhood environmental factors that affect the negative experiences of elders in their communities to enhance the positive experiences of elders.
Figure 8e showed the predicted SWB of the studied communities. The results highlighted that the communities in Tianhe District had the highest average SWB scores, while other communities with higher scores were concentrated in the Yuexiu, Haizhu, and Liwan districts. Regarding Panyu District, it had the lowest scores (Table 4). Based on the predictions, targeted efforts can be made to improve the environments of communities with low SWB scores. This approach attempted to deliver better well-being for elderly residents in these communities.

4. Discussion

4.1. The Important Characteristics of Built Environment on SWB of the Elderly

Our study identified the contribution of built environmental factors in influencing older adults’ subjective well-being. We found that accessibility to parks was conducive to promoting both positive emotions and experiences for the elderly. This observation may be attributed to the ability of such facilities to provide a natural environment, which can be a predictor of psychological well-being in an urban elderly population [19,22,42,43,44]. Previous studies have found a consistent conclusion with our findings, for they have suggested that green space in parks has an important impact on the well-being of the elderly. Also, park density had a positive impact on the subjective well-being of the elderly [36]. Furthermore, parks can provide space for social activities and, more importantly, better accessibility to parks can promote their social interaction, thus, in turn, enhancing their physical and mental health and contributing to subjective well-being [45,46].
Prior research has established the correlation between the density of medical services and the well-being of elderly individuals [19,22]. These studies have also paid attention to a link between negative emotions in the elderly and their frequency of medical appointments, which may support our conclusion [47]. Furthermore, one study has found that healthcare facilities are significantly associated with cognitive decline in the elderly [25]. However, we found that accessibility to hospitals had an important contribution to both positive emotions and experiences. This phenomenon may be attributed to the fact that healthcare facilities are beneficial for the physical well-being of older persons, thus contributing to the maintenance of their subjective well-being [19,48,49].
Our investigation suggested that accessibility to supermarkets had a significant impact on positive emotions and experiences of the elderly. Notably, the reason behind this could be that a lack of shopping services can lead to reduced social interactions among older adults and feelings of loneliness [50,51]. In addition, convenient shopping services may influence older people’s assessment of food accessibility [52], which is an important aspect of their health [53,54]. Therefore, supermarkets can come into play in the aspects of ensuring older people’s access to food, which holds the potential to promote their physical health and maintains their subjective sense of well-being.
In previous studies, sports and recreation facilities could provide the elderly with opportunities for physical activity and contribute to their physical health [26]. However, our study found that accessibility to gymnasiums had an important impact on negative emotions. Physical limitations and health conditions can significantly impact the ability of the elderly to participate fully in sports and other leisure activities [55]. When they encounter physical limitations, it can lead to frustration and depression [56], which can support our findings.
In terms of distance to transit, the study found that the distance to the subway station and the distance to the bus station mattered greatly when it came to the negative experiences of the elderly. According to a previous study, the use of public transportation was positively associated with the mental health of older adults [57], which indicated that convenient public transportation could enhance their overall experience. However, another study has found that the location near the highway has a significant negative impact on the leisure activities of the elderly [23], which may be the reason for the negative experience of the elderly related to transportation distance. In addition, poor air quality resulting from high bus station density can indeed have adverse effects on the health and overall well-being of older adults [58,59].
Our research found that population density could also influence the negative emotions and experiences of the elderly. Previous studies have found that population density negatively affects quality of life and mental health [60]. Moreover, high population density is associated with the incidence of cancer and cardiovascular disease [61], and higher population densities are associated with more active transportation and more pronounced urban stress [62]. These findings are consistent with our observations, which confirmed the influence of population density.
It is worth mentioning that streets make up more than 80% of all urban public space. While some studies have argued that high-density street networks are beneficial for improving accessibility to destinations and health resources for urban residents [63], our study found that street density could negatively affect emotions among the elderly. This may be because high street density increases the number of sidewalks and road intersections, which can significantly affect the safety of the elderly [64]. It is also found that the lack of safety could lead to negative emotions. A previous study has found that higher street network densities are beneficial in reducing the incidence of cardiovascular diseases, such as obesity, heart disease, and hypertension, among residents [65]. Higher street density increases exposure to PM2.5, which is more likely to result in respiratory disease and depression [66], and more importantly, is detrimental to the physical and mental health of older people, leading to more negative emotions.
Previous studies have identified land use mix as an important factor in the physical well-being of the elderly as land use mix may contribute to physical activity [23]. In contrast, another study has found that higher land use mix leads to less space for physical activity [26]. Nonetheless, our study found that land use mix was relatively less important for subjective well-being but showed a more prominent effect on positive emotions. Notably, the current study remains unclear about the effect of land use mix on subjective well-being, so more effects need to be explored in the future.
Overall, our study revealed that accessibility to parks had the greatest contribution to subjective well-being. Also, accessibility to hospitals and supermarkets also had an important contribution to subjective well-being. On the other hand, accessibility to gymnasiums might have a negative impact on subjective well-being as it seemed to be related to negative emotions. Factors such as distance to transit, population density, and street density were not conducive to maintaining subjective well-being among older adults due to their association with negative emotions and experiences.

4.2. Strategies for Improving SWB of the Elderly

This study predicted subjective well-being and its sub-dimensions in the communities of the study sites. The results revealed that the community in Tianhe District exhibited the highest level of subjective well-being, which could be attributed to the proper transportation accessibility. Thus, it could better promote positive emotions and experiences among older adults. Conversely, Panyu District had poor destination accessibility and long transportation distances, which led to the lowest level of subjective well-being in the community. The findings accentuate the importance of improving the subjective well-being of older adults in the Panyu and Baiyun districts in the future. In other words, improving the built environment around the neighborhoods can increase the level of subjective well-being of elderly residents.
With the prediction results, our study can provide suggestions for improving the subjective well-being of the elderly. First, it is recommended to attach greater importance to the accessibility of facilities so as to meet the needs of the elderly in their daily lives (shopping, exercise, medical care, and recreation). Second, in terms of sports facilities, the inclusiveness and age-friendliness of activity facilities should be enhanced, which is essential for encouraging physical activity among older adults. To enhance both the physical health and active lifestyles of the elderly, there is a need to optimize public transportation, improve such infrastructure as the pedestrian system, and encourage the elderly to travel on foot. In areas with dense streets, vegetation can be used to absorb pollutants and purify the air to mitigate air pollution around transportation hubs. Furthermore, safety facilities should be installed between driveways and sidewalks to improve road safety for older adults [64]. Finally, for neighborhoods with high population densities, it is essential to ensure an adequate number of facilities to avoid overcrowded and noisy areas.
Our study still has some limitations that should be considered. First, the participants were recruited without prior investigation of their health status. However, any differences in the health status of the elderly may impact the results. Therefore, future studies need to account for the health status of the participants and further investigate the mental health status of them. Second, this study did not differentiate between the household status of the elderly (local, non-local, or immigrant). Given that there has been research on the effects of the built environment on elderly immigrants [19,67,68], future studies can explore the livelihood of the elderly in more detail. Finally, this study did not differentiate between neighborhood types, which exhibited a complicated and diversified nature. Specifically, the built environment may be different across neighborhood types. Hence, further research can be conducted on how the built environment influences subjective well-being in different neighborhoods.

5. Conclusions

This study integrated geographic analysis and random forest modeling to conduct a comprehensive investigation of communities within the city of Guangzhou. By studying the characteristics of the built environment, our study identified key built environmental factors that influence the subjective well-being of the elderly. In addition, in light of these findings, we predicted the level of community subjective well-being in different districts across Guangzhou. Our study demonstrated the overall state of subjective well-being of older adults in communities within Guangzhou and identified areas that could benefit from revitalization initiatives. This enables us to come up with more targeted and effective strategies for elder-friendly communities in Guangzhou. Ultimately, these efforts will contribute to the overall well-being of the elderly population.

Author Contributions

Conceptualization, Y.Z., J.X., H.L., X.M. and C.Y.; Data curation, Y.Z. and H.L.; Formal analysis, Y.Z. and H.L.; Investigation, Y.Z. and J.X.; Methodology, Y.Z. and H.L.; Project administration, J.X. and C.Y.; Resources, Y.Z. and H.L.; Supervision, X.M. and C.Y.; Validation, J.X.; Visualization, Y.Z.; Writing—original draft, Y.Z.; Writing—review and editing, Y.Z., J.X., H.L., X.M. and C.Y. All authors have read and agreed to the published version of the manuscript.

Funding

This research was funded by “The Natural Science Foundation of Guangdong Provincial Research on community integration, mechanism and strategies of the accompanying elderly”, grant number 2023A1515012861.

Data Availability Statement

The data presented in this study are available on request from the corresponding author. The data are not publicly available due to the information concerning the participants.

Conflicts of Interest

The authors declare no conflict of interest.

References

  1. Huang, N.C.; Chu, C.; Kung, S.F.; Hu, S.C. Association of the built environments and health-related quality of life in community-dwelling older adults: A cross-sectional study. Qual. Life Res. 2019, 28, 2393–2407. [Google Scholar] [CrossRef]
  2. Zhou, Y.; Yuan, Y.; Chen, Y.; Lai, S. Association Pathways between Neighborhood Greenspaces and the Physical and Mental Health of Older Adults—A Cross-Sectional Study in Guangzhou, China. Front. Public Health 2020, 8, 551453. [Google Scholar] [CrossRef] [PubMed]
  3. World Health Organization. World Report on Ageing and Health 2015; World Health Organization: Geneva, Switzerland, 2015. [Google Scholar]
  4. World Health Organization. Social Development and Ageing: Crisis or Opportunity? World Health Organization: Geneva, Switzerland, 2000. [Google Scholar]
  5. Noreau, L.; Boschen, K. Intersection of Participation and Environmental Factors: A Complex Interactive Process. Arch. Phys. Med. Rehabil. 2010, 91, S44–S53. [Google Scholar] [CrossRef] [PubMed]
  6. Lu, J.; Zhang, N.; Wang, Y. Quality of life among different types of Chinese lonely elderly: A social isolation based analysis. Psychol. Health Med. 2022, 27, 1357–1365. [Google Scholar] [CrossRef]
  7. Guo, M.D.; Ni, M.Y.; Shyu, R.J.; Ji, J.S.; Huang, J.X. Automated simulation for household road traffic noise exposure: Application and field evaluation in a high-density city. Comput. Environ. Urban Syst. 2023, 104, 102000. [Google Scholar] [CrossRef]
  8. Yuan, C.; Ng, E.; Norford, L.K. Improving air quality in high-density cities by understanding the relationship between air pollutant dispersion and urban morphologies. Build. Environ. 2014, 71, 245–258. [Google Scholar] [CrossRef]
  9. Luo, H.; Li, Y.; Gao, X.; Meng, X.; Yang, X.; Yan, J. Carbon emission prediction model of prefecture-level administrative region: A land-use-based case study of Xi’an city, China. Appl. Energy 2023, 348, 121488. [Google Scholar] [CrossRef]
  10. Verheij, R.A.; Maas, J.; Groenewegen, P.P. Urban-rural health differences and the availability of green space. Eur. Urban Reg. Stud. 2008, 15, 307–316. [Google Scholar] [CrossRef]
  11. Bronfenbrenner, U. Toward an experimental ecology of human-development. Am. Psychol. 1977, 32, 513–531. [Google Scholar] [CrossRef]
  12. Casey, A.A.; Elliott, M.; Glanz, K.; Haire-Joshu, D.; Lovegreen, S.L.; Saelens, B.E.; Sallis, J.F.; Brownson, R.C. Impact of the food environment and physical activity environment on behaviors and weight status in rural US communities. Prev. Med. 2008, 47, 600–604. [Google Scholar] [CrossRef]
  13. Ding, D.; Sallis, J.F.; Conway, T.L.; Saelens, B.E.; Frank, L.D.; Cain, K.L.; Slymen, D.J. Interactive Effects of Built Environment and Psychosocial Attributes on Physical Activity: A Test of Ecological Models. Ann. Behav. Med. 2012, 44, 365–374. [Google Scholar] [CrossRef]
  14. Saelens, B.E.; Handy, S.L. Built environment correlates of walking: A review. Med. Sci. Sports Exerc. 2008, 40, S550–S566. [Google Scholar] [CrossRef]
  15. Lam, W.W.Y.; Loo, B.P.Y.; Mahendran, R. Neighbourhood environment and depressive symptoms among the elderly in Hong Kong and Singapore. Int. J. Health Geogr. 2020, 19, 48. [Google Scholar] [CrossRef] [PubMed]
  16. Li, J.W.; Tian, L.; Ouyang, W. Exploring the Relationship between Neighborhood-Built Environment and Elderly Health: A Research Based on Heterogeneity of Age and Gender Groups in Beijing. Front. Public Health 2022, 10, 882361. [Google Scholar] [CrossRef]
  17. Parra, D.C.; Gomez, L.F.; Sarmiento, O.L.; Buchner, D.; Brownson, R.; Schimd, T.; Gomez, V.; Lobelo, F. Perceived and objective neighborhood environment attributes and health related quality of life among the elderly in Bogota, Colombia. Soc. Sci. Med. 2010, 70, 1070–1076. [Google Scholar] [CrossRef] [PubMed]
  18. Zheng, Z.H.; Chen, H.; Yang, L. Transfer of Promotion Effects on Elderly Health with Age: From Physical Environment to Interpersonal Environment and Social Participation. Int. J. Environ. Res. Public Health 2019, 16, 2794. [Google Scholar] [CrossRef] [PubMed]
  19. Liu, Y.; Jia, L.; Xiao, J.; Chen, Q.; Gan, Q.; Huang, J.; Zhu, X.; Zhang, C.; Wan, C. The Subjective Well-Being of Elderly Migrants in Dongguan: The Role of Residential Environment. Trop. Med. Infect. Dis. 2022, 7, 199. [Google Scholar] [CrossRef] [PubMed]
  20. Cerin, E.; Lee, K.Y.; Barnett, A.; Sit, C.H.P.; Cheung, M.C.; Chan, W.M. Objectively-measured neighborhood environments and leisure-time physical activity in Chinese urban elders. Prev. Med. 2013, 56, 86–89. [Google Scholar] [CrossRef]
  21. Guo, Y.Q.; Fu, Y.Y.; Xu, Y.B. Satisfaction with neighbourhood environment moderates the associations between objective neighbourhood environment and leisure-time physical activity in older adults in Beijing, China. Health Soc. Care Community 2021, 29, 206–214. [Google Scholar] [CrossRef]
  22. Somsopon, W.; Kim, S.M.; Nitivattananon, V.; Kusakabe, K.; Nguyen, T.P.L. Issues and Needs of Elderly in Community Facilities and Services: A Case Study of Urban Housing Projects in Bangkok, Thailand. Sustainability 2022, 14, 8388. [Google Scholar] [CrossRef]
  23. Han, H.; Yang, K.; Yang, C.; Yang, G.; Xu, L. Influence and Mechanism of a Multi-Scale Built Environment on the Leisure Activities of the Elderly: Evidence from Hefei City in China. Int. J. Environ. Res. Public Health 2022, 19, 9237. [Google Scholar] [CrossRef]
  24. Dujardin, C.; Lorant, V.; Thomas, I. Self-assessed health of elderly people in Brussels: Does the built environment matter? Health Place 2014, 27, 59–67. [Google Scholar] [CrossRef]
  25. Kim, B. Individual and Perceived Community Environmental Factors Affecting Cognitive Function Decline in Korean Older Adults. J. Korean Soc. Wellness 2022, 17, 69–77. [Google Scholar] [CrossRef]
  26. Xiao, Y.; Chen, S.J.; Miao, S.Y.; Yu, Y.F. Exploring the Mediating Effect of Physical Activities on Built Environment and Obesity for Elderly People: Evidence from Shanghai, China. Front. Public Health 2022, 10, 853292. [Google Scholar] [CrossRef]
  27. Liu, Y.; Wang, R.; Grekousis, G.; Liu, Y.; Yuan, Y.; Li, Z. Neighbourhood greenness and mental wellbeing in Guangzhou, China: What are the pathways? Landsc. Urban Plan. 2019, 190, 103602. [Google Scholar] [CrossRef]
  28. Cervero, R.; Kockelman, K. Travel demand and the 3Ds: Density, diversity, and design. Transp. Res. Part D-Transp. Environ. 1997, 2, 199–219. [Google Scholar] [CrossRef]
  29. Ewing, R.; Cervero, R. Travel and the Built Environment. J. Am. Plan. Assoc. 2010, 76, 265–294. [Google Scholar] [CrossRef]
  30. Zhang, R.; Liu, S.; Li, M.; He, X.; Zhou, C. The Effect of High-Density Built Environments on Elderly Individuals’ Physical Health: A Cross-Sectional Study in Guangzhou, China. Int. J. Environ. Res. Public Health 2021, 18, 10250. [Google Scholar] [CrossRef]
  31. Creatore, M.I.; Glazier, R.H.; Moineddin, R.; Fazli, G.S.; Johns, A.; Gozdyra, P.; Matheson, F.I.; Kaufman-Shriqui, V.; Rosella, L.C.; Manuel, D.G.; et al. Association of Neighborhood Walkability with Change in Overweight, Obesity, and Diabetes. JAMA-J. Am. Med. Assoc. 2016, 315, 2211–2220. [Google Scholar] [CrossRef]
  32. Liu, Y.; Sangthong, R.; Ingviya, T.; Wan, C.J. Nothing Like Living with a Family: A Qualitative Study of Subjective Well-Being and its Determinants among Migrant and Local Elderly in Dongguan, China. Int. J. Environ. Res. Public Health 2019, 16, 4874. [Google Scholar] [CrossRef]
  33. Wang, X. Subjective well-being associated with size of social network and social support of elderly. J. Health Psychol. 2016, 21, 1037–1042. [Google Scholar] [CrossRef] [PubMed]
  34. Diener, E. Subjective well-being. Psychol. Bull. 1984, 95, 542–575. [Google Scholar] [CrossRef]
  35. Lai, S.; Zhou, Y.; Yuan, Y. Associations between Community Cohesion and Subjective Wellbeing of the Elderly in Guangzhou, China—A Cross-Sectional Study Based on the Structural Equation Model. Int. J. Environ. Res. Public Health 2021, 18, 953. [Google Scholar] [CrossRef]
  36. Guo, Y.; Liu, Y.; Lu, S.; Chan, O.F.; Chui, C.H.K.; Lum, T.Y.S. Objective and perceived built environment, sense of community, and mental wellbeing in older adults in Hong Kong: A multilevel structural equation study. Landsc. Urban Plan. 2021, 209, 104058. [Google Scholar] [CrossRef]
  37. He, X.; Yuan, X.D.; Zhang, D.H.; Zhang, R.R.; Li, M.; Zhou, C.S. Delineation of Urban Agglomeration Boundary Based on Multisource Big Data Fusion-A Case Study of Guangdong-Hong Kong-Macao Greater Bay Area (GBA). Remote Sens. 2021, 13, 1801. [Google Scholar] [CrossRef]
  38. Albert, K.; Stones, M.J. The Measurement of Happiness: Development of the Memorial University of Newfoundland Scale of Happiness (MUNSH). J. Gerontol. 1980, 35, 906–912. [Google Scholar] [CrossRef]
  39. Wu, Z.J.; Song, Y.L.; Wang, H.L.; Zhang, F.; Li, F.H.; Wang, Z.Y. Influence of the built environment of Nanjing’s Urban Community on the leisure physical activity of the elderly: An empirical study. BMC Public Health 2019, 19, 1459. [Google Scholar] [CrossRef]
  40. Brown, B.B.; Yamada, I.; Smith, K.R.; Zick, C.D.; Kowaleski-Jones, L.; Fan, J.X. Mixed land use and walkability: Variations in land use measures and relationships with BMI, overweight, and obesity. Health Place 2009, 15, 1130–1141. [Google Scholar] [CrossRef] [PubMed]
  41. Wei, Y.; Yang, D. Differential Impact of Neighborhood Destination Built Environments on Active Health of the Elderly: An Analysis Based on Facility Types and Service Radius. New Archit. 2023, 1, 118–123. [Google Scholar] [CrossRef]
  42. Aliyas, Z. Physical, mental, and physiological health benefits of green and blue outdoor spaces among elderly people. Int. J. Environ. Health Res. 2021, 31, 703–714. [Google Scholar] [CrossRef]
  43. Dzhambov, A.M.; Dimitrova, D.D. Elderly visitors of an urban park, health anxiety and individual awareness of nature experiences. Urban For. Urban Green. 2014, 13, 806–813. [Google Scholar] [CrossRef]
  44. Yu, W.Y.; Hu, H.; Sun, B.D. Elderly Suitability of Park Recreational Space Layout Based on Visual Landscape Evaluation. Sustainability 2021, 13, 6443. [Google Scholar] [CrossRef]
  45. Dong, H.W.; Qin, B. Exploring the link between neighborhood environment and mental wellbeing: A case study in Beijing, China. Landsc. Urban Plan. 2017, 164, 71–80. [Google Scholar] [CrossRef]
  46. Song, S.Q.; Yap, W.; Hou, Y.T.; Yuen, B. Neighbourhood built Environment, physical activity, and physical health among older adults in Singapore: A simultaneous equations approach. J. Transp. Health 2020, 18, 100881. [Google Scholar] [CrossRef]
  47. McKeen, N.A.; Chipperfield, J.G.; Campbell, D.W. A longitudinal analysis of discrete negative emotions and health-services use in elderly individuals. J. Aging Health 2004, 16, 204–227. [Google Scholar] [CrossRef]
  48. Biswas, R.K.; Kabir, E. Influence of distance between residence and health facilities on non-communicable diseases: An assessment over hypertension and diabetes in Bangladesh. PLoS ONE 2017, 12, e0177027. [Google Scholar] [CrossRef]
  49. Zulian, G.; Donisi, V.; Secco, G.; Pertile, R.; Tansella, M.; Amaddeo, F. How are caseload and service utilisation of psychiatric services influenced by distance? A geographical approach to the study of community-based mental health services. Soc. Psychiatry Psychiatr. Epidemiol. 2011, 46, 881–891. [Google Scholar] [CrossRef]
  50. Altinay, L.; Song, H.Y.; Madanoglu, M.; Wang, X.L. The influence of customer-to-customer interactions on elderly consumers’ satisfaction and social well-being. Int. J. Hosp. Manag. 2019, 78, 223–233. [Google Scholar] [CrossRef]
  51. Toepoel, V. Ageing, Leisure, and Social Connectedness: How could Leisure Help Reduce Social Isolation of Older People? Soc. Indic. Res. 2013, 113, 355–372. [Google Scholar] [CrossRef]
  52. Ishikawa, M.; Yokoyama, T.; Nakaya, T.; Fukuda, Y.; Takemi, Y.; Kusama, K.; Yoshiike, N.; Nozue, M.; Yoshiba, K.; Murayama, N. Food accessibility and perceptions of shopping difficulty among elderly people living alone in Japan. J. Nutr. Health Aging 2016, 20, 904–911. [Google Scholar] [CrossRef]
  53. Gomi, T.; Kitayuguchi, J.; Okuyama, K.; Kamada, M.; Inoue, S.; Kamioka, H.; Mutoh, Y. Relationship between Neighborhood Food Environment and Diet Variety in Japanese Rural Community-dwelling Elderly: A Cross-sectional Study. J. Epidemiol. 2022, 32, 290–297. [Google Scholar] [CrossRef] [PubMed]
  54. Thompson, J.L.; Bentley, G.; Davis, M.; Coulson, J.; Stathi, A.; Fox, K.R. Food shopping habits, physical activity and health-related indicators among adults aged >= 70 years. Public Health Nutr. 2011, 14, 1640–1649. [Google Scholar] [CrossRef]
  55. Kubinska, Z.; Panczuk, A. Physical activity of the elderly: Limitations and knowledge about the dangers of hypokinesia. Health Probl. Civiliz. 2021, 15, 115–121. [Google Scholar] [CrossRef]
  56. Hossain, B.; Yadav, P.K.; Nagargoje, V.P.; Joseph, K.J.V. Association between physical limitations and depressive symptoms among Indian elderly: Marital status as a moderator. BMC Psychiatry 2021, 21, 573. [Google Scholar] [CrossRef] [PubMed]
  57. Tang, S.S.; Lee, H.F.; Feng, J.X. Social capital, built environment and mental health: A comparison between the local elderly people and the ’laopiao’ in urban China. Ageing Soc. 2022, 42, 179–203. [Google Scholar] [CrossRef]
  58. Bikis, A.; Pandey, D. Air Quality at Public Transportation Stations/Stops: Contribution of Light Rail Transit to Reduce Air Pollution. Aerosol Sci. Eng. 2022, 6, 1–16. [Google Scholar] [CrossRef]
  59. Lee, G.; Hwang, K.; Park, S.; Lee, D.; Kim, K.; Song, M.Y.; Choi, W.; Heo, J.; Park, D.; Lee, G.; et al. Measurement of Internal and External Air Pollutants of Enclosed Bus Station. J. Korean Soc. Atmos. Environ. 2023, 39, 128–143. [Google Scholar] [CrossRef]
  60. Fassio, O.; Rollero, C.; De Piccoli, N. Health, Quality of Life and Population Density: A Preliminary Study on “Contextualized” Quality of Life. Soc. Indic. Res. 2013, 110, 479–488. [Google Scholar] [CrossRef]
  61. Carnegie, E.R.; Inglis, G.; Taylor, A.; Bak-Klimek, A.; Okoye, O. Is Population Density Associated with Non-Communicable Disease in Western Developed Countries? A Systematic Review. Int. J. Environ. Res. Public Health 2022, 19, 2638. [Google Scholar] [CrossRef]
  62. Beenackers, M.A.; Groeniger, J.O.; Kamphuis, C.B.M.; Van Lenthe, F.J. Urban population density and mortality in a compact Dutch city: 23-year follow-up of the Dutch GLOBE study. Health Place 2018, 53, 79–85. [Google Scholar] [CrossRef]
  63. Yu, W.H.; Ai, T.H.; Li, J.Z.; Yang, M.; Shuai, Y. Potential Changed of Spatial Accessibility to Health Services with the Opening of Private Streets in Shenzhen, China. IEEE Access 2018, 6, 72824–72835. [Google Scholar] [CrossRef]
  64. Lv, M.H.; Wang, N.C.; Yao, S.J.; Wu, J.P.; Fang, L. Towards Healthy Aging: Influence of the Built Environment on Elderly Pedestrian Safety at the Micro-Level. Int. J. Environ. Res. Public Health 2021, 18, 9534. [Google Scholar] [CrossRef] [PubMed]
  65. Marshall, W.E.; Piatkowski, D.P.; Garrick, N.W. Community design, street networks, and public health. J. Transp. Health 2014, 1, 326–340. [Google Scholar] [CrossRef]
  66. Cui, X.F.; Wen, J.; Yang, H.R.; Helbich, M.; Dijst, M.; Roberts, H.; Tian, S.L. Pathways from street network design to symptoms of depression among emerging adults in China. Travel Behav. Soc. 2023, 33, 100644. [Google Scholar] [CrossRef]
  67. Lai, D.W.L. Depression among elderly Chinese-Canadian immigrants from Mainland China. Chin. Med. J. 2004, 117, 677–683. [Google Scholar] [PubMed]
  68. Lee, S.M.; Edmonston, B. Residential Independence of Elderly Immigrants in Canada. Can. J. Aging-Rev. Can. Vieil. 2014, 33, 359–377. [Google Scholar] [CrossRef]
Figure 1. Study site.
Land 12 01940 g001
Figure 2. Research technology route.
Land 12 01940 g002
Figure 3. LUM, STD, and POD of the study site. (a) LUM level of the study site; (b) STD level of the study site; (c) POD level of the study site.
Land 12 01940 g003
Figure 4. Distance to transit and destination accessibility in the study site. (a) DB of the study site; (b) DS of the study site; (c) Park accessibility of the study site. (d) Supermarket accessibility of the study site; (e) Hospital accessibility of the study site; (f) Gymnasium accessibility of the study site.
Land 12 01940 g004
Figure 5. The contribution of built environment characteristics to positive and negative emotions.
Land 12 01940 g005
Figure 6. The contribution of built environment characteristics to positive and negative experience.
Land 12 01940 g006
Figure 7. The contribution of built environment characteristics to SWB.
Land 12 01940 g007
Figure 8. SWB prediction map. (a) PA prediction of the study site; (b) NA prediction of the study site; (c) PE prediction of the study site; (d) NE prediction of the study site; (e) SWB prediction of the study site.
Land 12 01940 g008
Table 1. Descriptive statistics of variables.
VariablesMean/Proportion (SD) VariablesMean/Proportion (SD)
Control variablesAge67.73 (8.63)Dependent variablesCNY 4000 or above2.76%
60–6555.90%SWB22.67 (2.66)
65–7039.85%PA5.93 (1.00)
70–753.72%NA7.64 (0.90)
Above 750.53%PE8.79 (2.08)
GenderNE8.40 (0.76)
Male49.89%Independent variablesDensity (the number of individuals per hectares)
Female50.11%POD336.85 (58.46)
Educational AttainmentDiversity (within 1 km dwelling buffer)
Primary school or below25.38%LUM0.65 (0.17)
Middle school71.59%Design (within 1 km dwelling buffer, km/km2)
College or above3.09%STD17.12 (7.37)
Marital statusDistance to transit (nearest distance in meters to residence)
Single, divorced, or widowed16.60%DB193.56 (142.09)
Married83.36%DS746.50 (741.25)
LifestyleDestination accessibility (facility number within 1 km buffer)
Live alone13.81%Park2.00 (1.34)
Live with family86.11%Hospital5.00 (3.75)
Average monthly incomeSupermarket53.00 (41.11)
CNY 1000 or below3.22%Gymnasium43.00 (28.47)
CNY 1000–200023.55%
CNY 2000–400070.39%
Table 2. The impact of individual characteristics on NA.
VariablesModel 1Model 2
Unstandardized CoefficientStandardized CoefficientUnstandardized CoefficientStandardized Coefficient
BSEBetaBSEBeta
Demographic variables(Constant)178.99189.627-47.97281.445-
Male0.0480.1390.0620.0140.1180.018
60–650.0670.0740.1960.1140.0710.333
70–750.0940.1510.1330.130.1270.184
Over 751.457 *0.7180.3671.475 *0.5800.371
Primary school or below−0.0590.341−0.1180.0110.2990.022
Middle school−0.130.323−0.303−0.1160.281−0.27
College or above0.0000.3400.0000.0120.2980.018
Single, divorced or widowed−0.2270.333−0.5060.2140.2900.476
Married−0.080.344−0.1760.2820.2990.62
Live with family−0.4470.375−1.125−0.2810.319−0.708
Live alone−0.5970.383−1.462−0.3670.332−0.899
CNY 1000 or below−1.050.714−2.107−0.5270.614−1.059
CNY 1000–2000−1.0970.82−2.331−0.2950.722−0.626
CNY 2000–4000−1.1040.777−3.243−0.4260.677−1.252
CNY 1000 or below−1.3240.829−2.407−0.4560.726−0.829
Built environment characteristicsLUM 0.4490.9360.084
POD 0.0010.0000.34
STD 0.0180.0290.143
DS 0.0000.000−0.156
DB 0.0000.0010.086
Hospital −0.1010.057−0.401
Gymnasium 0.0110.0060.341
Park 0.180.1210.241
Supermarket 0.0050.0050.22
R20.3210.698
R20.3210.377
* p < 0.05.
Table 3. Training set and test set results of random forest.
DimensionsData SetMAEMBERMSER2
PATraining set0.3490.0140.4670.783
Test set0.3960.0350.5150.680
NATraining set0.3180.00060.4350.763
Test set0.3450.0060.4430.733
PETraining set0.6900.0130.8910.802
Test set1.1790.0821.4260.600
NETraining set0.331−0.0100.4770.618
Test set0.339−0.0200.4160.581
SWBTraining set0.8310.0641.0100.783
Test set0.6550.1590.8570.683
Table 4. SWB prediction scores in the study site.
Study SitenPA
(Mean (SD))
NA
(Mean (SD))
PE
(Mean (SD))
NE
(Mean (SD))
SWB
(Mean (SD))
Panyu District8965.73 (0.53)7.15 (0.45)7.47 (0.88)8.07 (0.24)21.80 (1.05)
Tianhe District8896.66 (0.45)7.20 (0.54)8.70 (0.59)7.97 (1.09)24.05 (1.36)
Haizhu District8905.90 (0.45)7.88 (0.45)9.49 (0.76)8.43 (0.21)23.08 (0.57)
Liwan District8785.97 (0.58)7.55 (0.53)9.10 (0.82)8.52 (1.98)22.88 (0.91)
Yuexiu District9036.18 (0.48)8.05 (0.35)9.60 (0.58)8.57 (0.25)23.24 (0.46)
Baiyun District8925.87 (0.56)7.26 (0.40)8.15 (0.91)8.33 (0.29)22.16 (0.94)
53485.92 (0.53)7.61 (0.55)8.40 (0.96)8.43 (1.31)22.68 (0.97)
Disclaimer/Publisher’s Note: The statements, opinions and data contained in all publications are solely those of the individual author(s) and contributor(s) and not of MDPI and/or the editor(s). MDPI and/or the editor(s) disclaim responsibility for any injury to people or property resulting from any ideas, methods, instructions or products referred to in the content.

