Article

Plant Conservation in the Midst of Energy Transition: Can Regional Governments Rise to the Challenge?

by
Estrella Alfaro-Saiz
1,2,*,
Ana Belén Fernández-Salegui
1 and
Carmen Acedo
1
1
Research Team Taxonomy and Biodiversity Conservation TaCoBi, Department of Biodiversity and Environmental Management, University of León, 24071 León, Spain
2
Herbarium LEB Jaime Andrés Rodríguez, Vicerrectorado de Investigación, University of León, 24071 León, Spain
*
Author to whom correspondence should be addressed.
Land 2023, 12(11), 2003; https://doi.org/10.3390/land12112003
Submission received: 15 October 2023 / Revised: 29 October 2023 / Accepted: 30 October 2023 / Published: 1 November 2023
(This article belongs to the Section Land, Biodiversity, and Human Wellbeing)

Abstract

:
Within the expanding wind energy projects context, this study explores the intricate relationship between biodiversity conservation and wind power development in the Cantabrian Mountains. By analyzing data from 1107 UTM grids measuring 10 × 10 km, we have identified 378 endangered vascular plant taxa and 36 bryophytes, including 135 that are regional endemics. Wind power complexes pose a significant risk of irreversible impacts on plant conservation zones and their integrity if proper management informed by the best available scientific knowledge is not implemented. This study introduces the concept of very important plant areas (VIPAs) as a crucial tool for identifying priority conservation areas. A total of 60% of the UTM grids were classified in the “high conservation value” category. Among the endangered species within the region, only 11% are afforded protection at the European level and 17% at the national level, leaving a key role for regional governments with heterogeneous lists. Our findings highlight the urgent need for legislation that accommodates updates to protected species lists, ensuring the inclusion of high-risk taxa and legally binding mechanisms at various administrative tiers. The proposed method relies on quantifiable and repeatable criteria, making it adaptable for application in other territories and for broader land use planning purposes.

1. Introduction

The ongoing biodiversity crisis is a pressing challenge that affects human health, security, well-being, and development, as our survival depends on ecological systems and the resources they provide [1]. Unfortunately, the loss of biodiversity is happening locally, regionally, and globally, with significant implications for our future [2]. To address this crisis, government decision makers must prioritize the collection and generation of scientific knowledge, ensuring that scientific research and evidence inform policy development and the planning and management of biodiversity [3].
Protected areas have become one of the most important tools for safeguarding biodiversity, as they have been proven to reduce the rate of biodiversity loss [4,5,6,7]. However, it is crucial to ensure that the criteria used for their delimitation is easily and consistently applied across all biogeographic regions and taxonomic groups. This requires an iterative bottom-up process at the national or regional level that involves local stakeholders to maximize the usefulness and implementation prospects of resulting site priorities [8]. Unfortunately, protected areas are often not delimited using all the optimum conservation criteria, and their management can be compromised by insufficient economic resources and government support [1,9]. These deficiencies undermine their conservation objectives, leading to the term “paper parks” being used to describe them [10].
To prevent protected areas from only existing on paper, improving the quality of data on biodiversity, developing shared assessments of conservation planning among neighboring areas, removing borders, building human capacity, and increasing financial resources are needed [10]. Additionally, adequate connectivity systems and networks of areas that allow for species-targeted conservation approaches are required to avoid the protection bias of non-charismatic, cryptic, or non-showy species that may be overlooked but are often more susceptible to extinction [11].
Land use change and direct exploitation are the primary drivers of global biodiversity loss, causing destruction and fragmentation that leads to extinction at a small scale and affecting various conservation parameters [12,13]. New needs, such as those linked to energy production and the extractive activities related to them, further compromise biodiversity, emphasizing the need for action.
To address this challenge, 188 parties committed to establishing “comprehensive, effectively managed, and ecologically representative national and regional systems of protected areas” at the Convention on Biological Diversity in the Programme of Work on Protected Areas. To achieve this, guidelines such as the identification and gap analyses of key biodiversity areas (KBAs) [14] can be used to determine where the highest priorities are to expand, reinforce, and connect existing protected areas. KBAs are globally significant sites for biodiversity conservation, identified using standard criteria and thresholds based on the occurrence of species requiring safeguards at the site scale [15]. Therefore, focusing on the most effective form of conservation action at the site scale is crucial.
Initiatives to identify important areas for biodiversity, like the important bird and biodiversity areas (IBAs) [16] developed by BirdLife International, are widely established worldwide. While the IBA network is a valuable conservation tool for particular taxonomic groups, such as birds and other vertebrates, these networks alone are insufficient to identify all important areas for all groups, especially when some groups like fungi, bryophytes, algae, or lichens are less studied, especially with regard to conservation research [17], and are not systematically included in biodiversity inventory studies [18,19,20]. To protect and manage important specific sites for wild plant and fungal diversity, it is necessary to identify important plant areas (IPAs). IPAs are useful tools for environmental and social impact assessments in major development projects, providing clear evidence of a site’s biodiversity value [18]. IPAs are identified based on three consistent criteria: (A) the presence of populations of threatened species, (B) exceptionally rich flora in a European context in relation to its biogeographic zone, and (C) an outstanding example of a habitat type of plant conservation and botanical importance [21].
However, proposed valuations for IPAs have been influenced by diverse criteria, resulting in different scoring systems used to identify them [18,22,23,24,25]. Taking Spain as an example, none of the proposals for the country include other important groups of organisms, such as fungi, lichens, mosses, liverworts, and hornworts [18,19]. Despite Spain’s high biodiversity of non-vascular plants and the significant improvement in knowledge of bryoflora in recent decades, as well as the red lists [26,27,28,29], few of these species are currently protected, indicating a lack of the necessary knowledge for conservation and management decisions. Lichens have also not been taken into account in the red lists in Spain, except in some communities where preliminary lists exist [30,31], nor have they been included in the Global Strategy for Conservation of the Convention on Biological Diversity, unlike in countries such as Poland, Estonia, and Italy [32,33,34,35]. In Italy, research has shown that more than a quarter of epiphytic lichens are threatened, requiring further research and efforts to include these organisms in national conservation plans. While the European Council for the Conservation of Fungi (ECCF) has conducted studies and developed a European red list of fungi for various European countries, it is worth noting that Spain has not yet engaged in this initiative [36,37]. However, there are approximate red lists for some territories, such as Sierra Nevada and Castilla y León [38,39], and further research is necessary in high-diversity territories, like the Cantabrian Mountains, to identify its extinction risks and generate knowledge about these organisms.
In this context, it is essential to underscore that legally protected species hold a special status, subject to measures aimed at safeguarding their habitats, regulating harvests, and restricting trade. Conversely, other species facing imminent risk of extinction due to various factors, including habitat degradation, overexploitation, or climate change, do not always enjoy legal protection. To clarify, protected species are often considered threatened and are typically safeguarded through their inclusion in red lists or by the deliberation of expert committees. However, not all threatened species benefit from legal protection, and specific conservation measures are not always implemented uniformly. Part of the challenge arises from the relatively static nature of legislation, which does not evolve as swiftly as required. Additionally, emerging threats are tied to shifts in economic and social paradigms, such as changes in energy production related to the current energy crisis.
In the pursuit of climate neutrality by 2050, Europe faces the challenge of transitioning to a decarbonized energy system and promoting natural carbon sinks, all while safeguarding biodiversity. However, a poorly coordinated and haphazard transition, combined with the large-scale deployment of renewable energy facilities in unsuitable locations, risks causing significant biodiversity loss, as many studies have shown [40,41,42,43]. Moreover, the impact of renewable energy on biodiversity can vary depending on the technology, location, and affected species, and can result from land occupation and infrastructure installation. The most globally unique areas for biodiversity may face threats from the development of renewable energy sources in the near future [44,45]. The primary impact of wind energy is currently affecting wildlife [46], while solar energy leads to a drastic transformation in ecosystems and biodiversity through habitat loss [47,48]. The presence of poles and wires introduces linear anthropogenic structures that alter the visual quality of the landscape and create division lines. Biodiversity and its conservation are intricately linked to habitat preservation. The establishment and operation of vegetation production and transportation facilities often necessitate habitat removal. Moreover, these impacts are not confined to specific phases but manifest throughout the project’s execution. Certain habitats, like rocky or summits ecosystems, are exceptionally sensitive and the impacts on them are irreversible [49].
Even protected areas may not provide enough protection as the pace of land-use change accelerates [40,50]. Therefore, it is crucial to identify priority sites for conservation and adopt land-use systems that balance renewable energy expansion with biodiversity conservation. However, these instruments, by themselves, do not seem to be sufficient either [50]. One of the tools that has been designed in this sense is environmental zoning. The environmental zoning proposed by the Spanish Ministry for the Ecological Transition and the Demographic Challenge (MITERD, by its acronym in Spanish) [51] exhibits significant information gaps and deficiencies, hindering its ability to fulfill the objective of ensuring that projects are sited away from sensitive conservation areas. While initially presented as a purely advisory tool for businesses, this zoning gains binding status as per Real Decreto Ley 6/2022 [52], which mandates streamlining procedures for renewable energy projects. One of the most crucial criteria for ensuring that this zoning aligns with conservation principles is, for example, the presence of “Species Conservation or Recovery Plans”. However, only 14% of threatened taxa in Spain had conservation plans [53] at the time the zoning process was initiated. Additionally, the recently approved Spanish conservation strategies for protected plants for rocky environments [54], high summits [55], and aquatic habitats [56] have not been considered and consequently, taxa protected at the national level and impacted by energy production projects and associated installations are not included in the environmental zoning. An example of the limitations in the environmental zoning is evident in the fact that none of the zoning plans published to date [51,57] exclude the distribution range of one of the priority species for the conservation of Iberian flora, Gyrocaryum oppositifolium Valdés [40]. This species is protected in Castilla y León, designated with the highest level of protection [58], with no established recovery plan in place. Such examples underscore the necessity for zoning founded upon the most robust and comprehensive scientific data.
Official documents and the associated tools appear to underestimate the potential impact on threatened or protected flora species and habitats. This underestimation arises from several factors, including the limited availability of recovery plans, and the low priority attributed to often-neglected organisms. Herein, we used the northwest quadrant of Spain as a case study to assess whether governmental decisions align with the preservation of biodiversity, a crucial foundation for energy transition plans. The northwest of Spain is renowned for its exceptional biodiversity, while the ramifications of the energy transition entails substantial land use alterations in less human-impacted areas, as evidenced in the analysis of wind farm projects [59] and anthropization levels [60]. The insights gained from this pilot project can subsequently inform decision making across diverse geographical scales and scenarios, including zoning practices and encompassing various taxonomic groups of species.
Our work encompasses several objectives. Firstly, we aim to evaluate the degree of overlap among the European, national, and regional catalogs of protected flora and lists of threatened flora and assess the effectiveness of legal protection measures concerning biodiversity conservation. Secondly, we seek to identify priority areas designated as very important plant areas (VIPAs) for the conservation of endangered species, including some of the more unknown groups, mosses, hornworts, and liverworts, but of which at least we have a preliminary list to work with. Thirdly, we encourage the adjustment of the level of protection for the most vulnerable species and their inclusion within environmental zoning regulations. Lastly, we assess the potential convergence or conflicts between key plant conservation areas and the wind projects implementation.

2. Materials and Methods
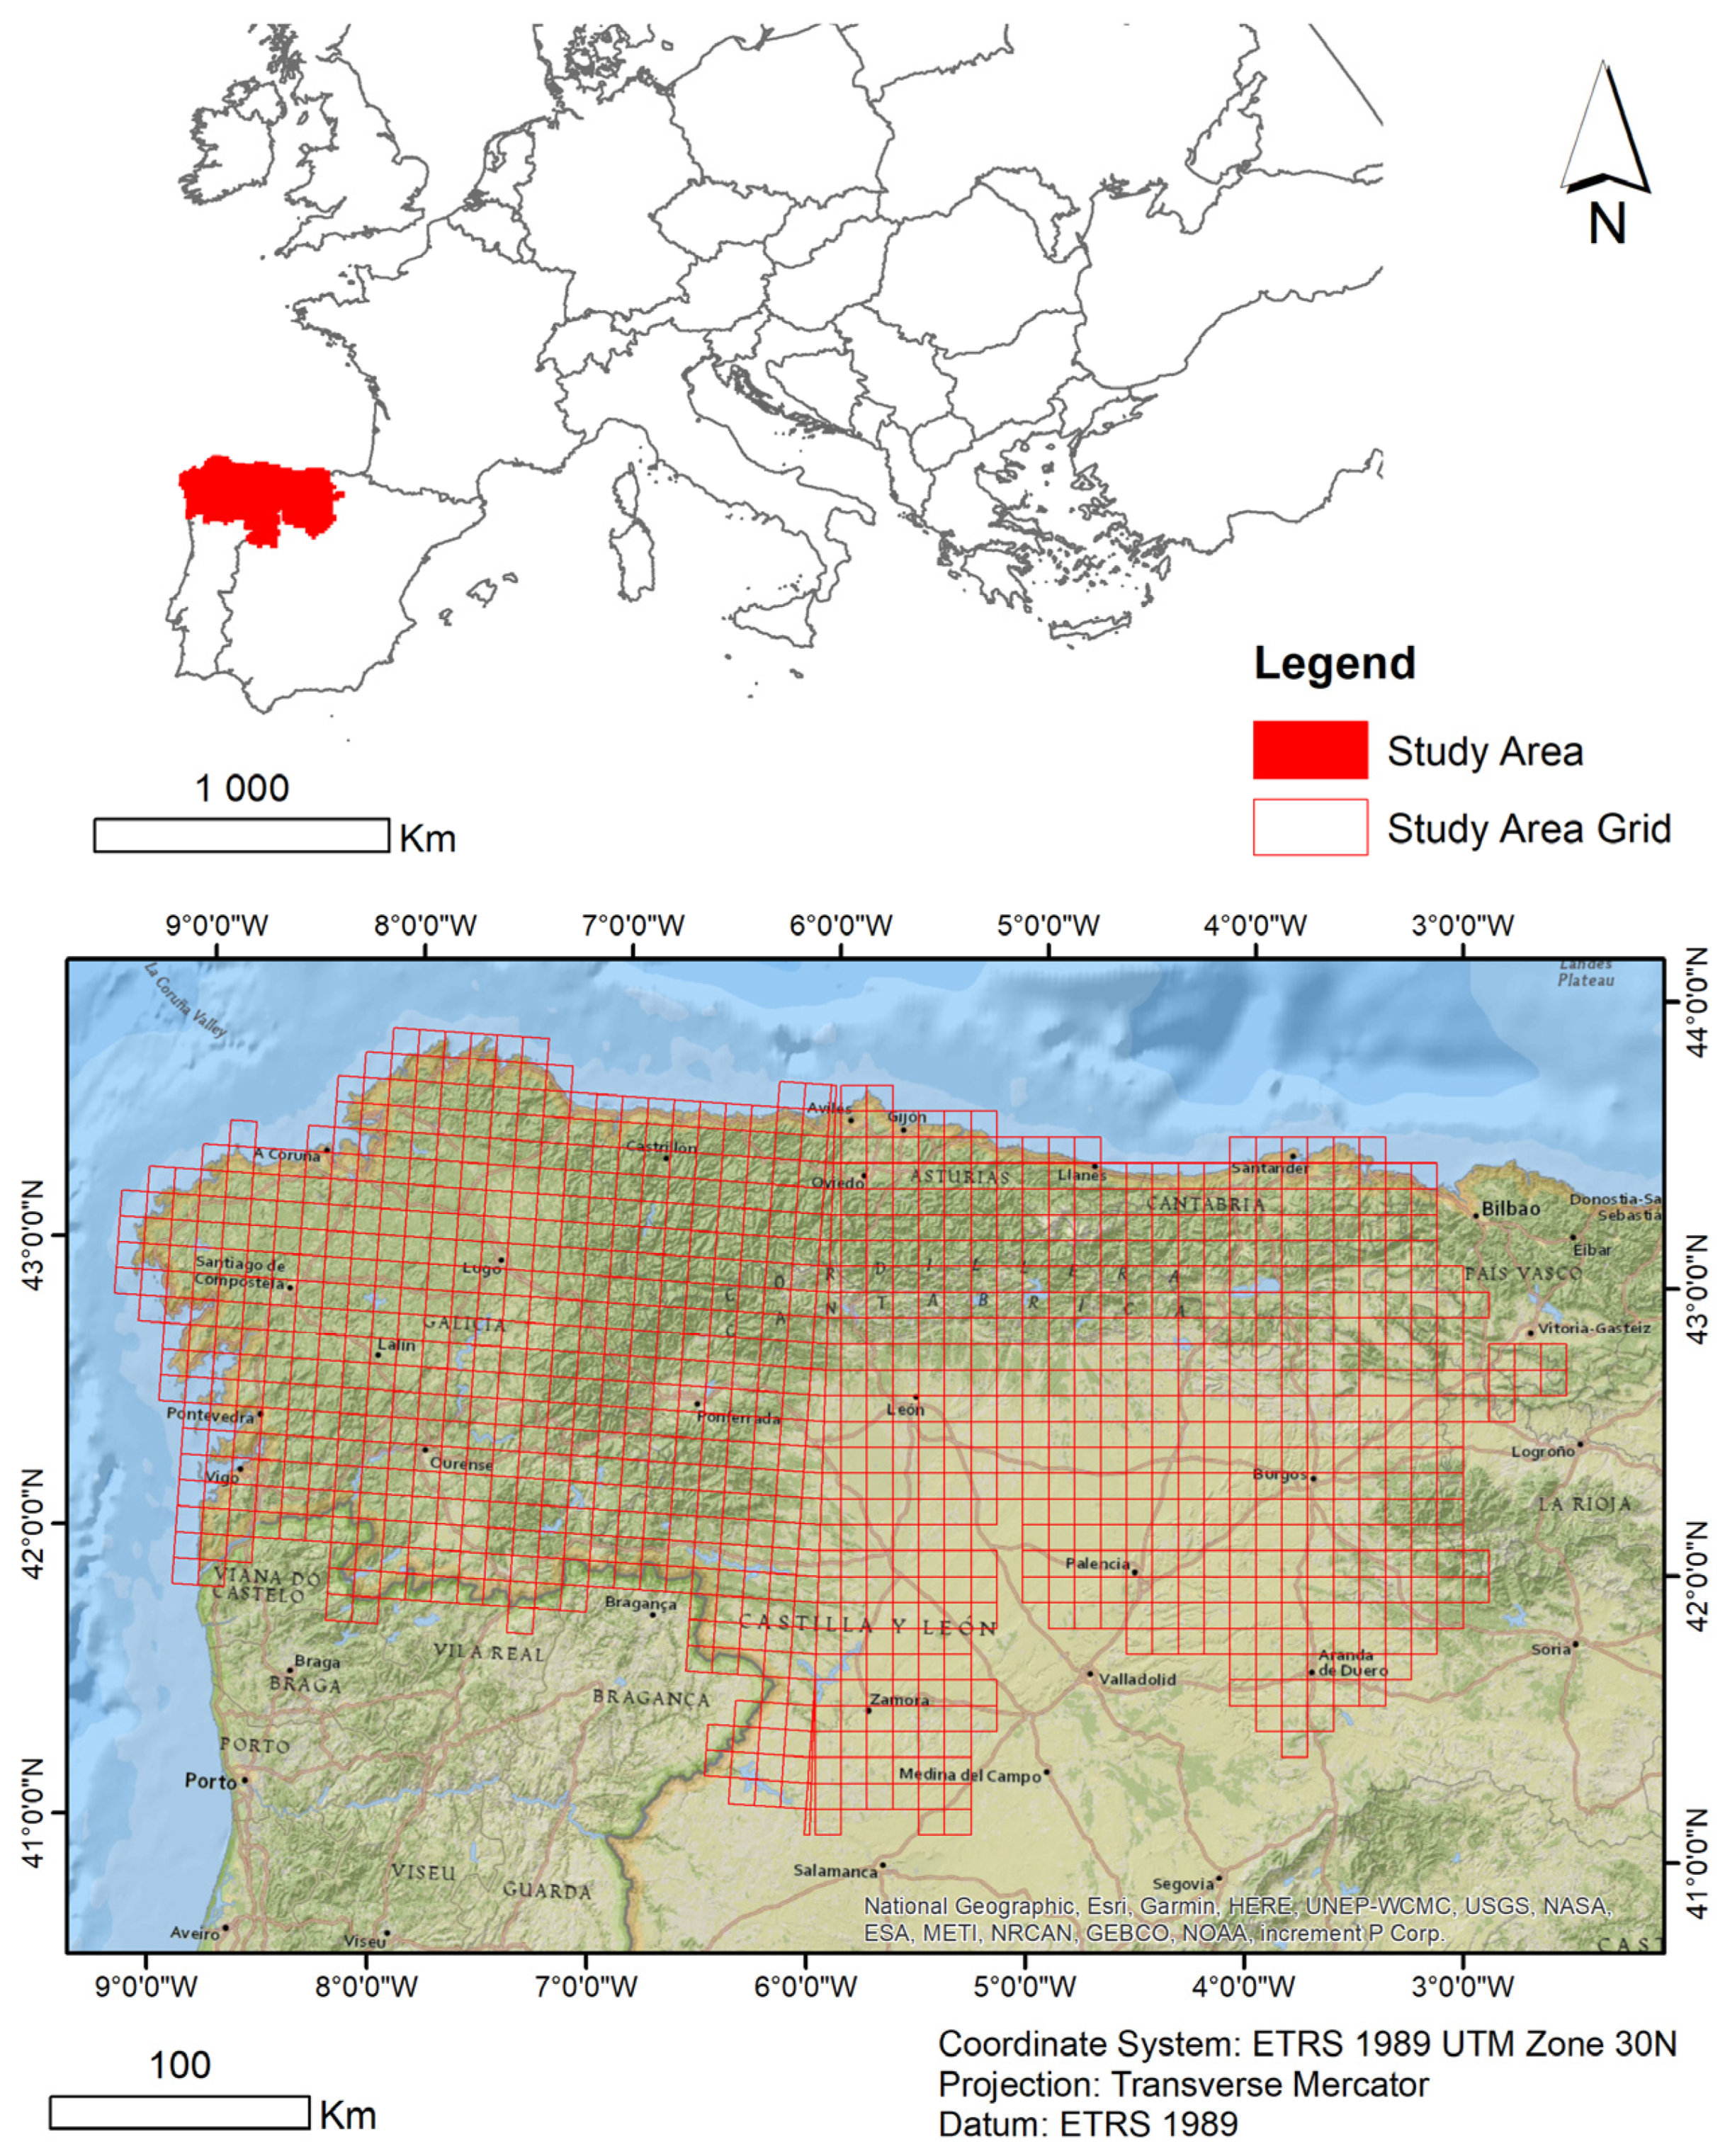
2.1. Study Area

The study area of this work encompasses the surrounding administrative divisions of the Cantabrian mountain range, namely: the autonomous community of Galicia, the principalities of Asturias and Cantabria, and the provinces of León, Palencia, Burgos, and Zamora in the Castilla y León community. The study included a total of 1107 UTM grids of 10 × 10 km (Figure 1). The Cantabrian Mountains and its surroundings are in a transitional zone between the Mediterranean and temperate climates and are essential for conserving plant diversity on the Iberian Peninsula [25]. They are one of the three mountain regions with the highest plant richness in the Iberian Peninsula [61]. Its floristic diversity has a high degree of endemicity [62] and approximately 10% of this is considered taxa of special interest by its endemicity and singularity, with more than 300 taxa in this situation [63]. Specifically, in the regions of Galicia, Asturias, and Cantabria live 2391 [64], 2163 [65], and 2631 [66] taxa. Although there is no published catalog for the community of Castilla y León, there are estimated to be more than 3000 taxa collected in different databases [67]. These numbers illustrate the richness of the flora in these communities. Regarding protection, the Galician species list encompasses 77 vascular plants, including fern taxa, 26 bryophytes, 5 algae, and 4 lichens. Notably, this is the only catalog encompassing non-vascular plants among other taxonomic groups [68]. The protection lists of different regions vary in their inclusion of vascular plants. Asturias includes 65 taxa [69], Cantabria has 27 [70], and Castilla y León lists 314 [58,71], each with distinct categories.
To undertake this study, we initially chose species from a compiled list comprising both endangered and legally protected vascular plants, mosses, and liverworts. This comprehensive list incorporated data from various available sources within the study area. One of the significant challenges we faced while assembling this list was the harmonization of distinct synonyms employed in each of the source documents, as there existed a notable divergence in nomenclature among them. To address this issue, in addition to the scientific documents and databases for the elaboration of the lists themselves, we consulted online databases, specifically the Catalogue of Life [72] and Plants of the World Online (POWO) [73], to obtain common taxonomic names. Subsequently, after compiling the list, we computed various assessable parameters, including threat level, legal protection status, rarity, and endemicity. We situated each species geographically within a 10 × 10 km grid. The following subsection section headings provides a detailed elucidation of this procedure.

2.2. Methods

2.2.1. Species

Legal Protection Category

We developed the protection lists based on Directive 92/43/CEE [74], commonly known as the Habitat Directive, which aims to conserve natural habitats and the wild fauna and flora across Europe. Protection lists include the List of Wildlife Species under Special Protection Regime (LERSPE) and the Spanish Catalogue of Threatened Wildlife Species (CEEA) [75], and the regional catalogs from the autonomous communities of Galicia [68], Asturias [69], Cantabria [70], and Castilla y León [58,71].

Threat Category

We gathered the data on threatened vascular plants species were gathered from the Atlas and Red Book of the Threatened Vascular Flora of Spain [76] and its subsequent addends [77,78,79,80], and the data on threatened mosses and liverworts were gathered from the Red List of Threatened Bryophytes in Spain [81].

Vascular Flora Location

We determined the geographic distribution of the studied taxa by filtering and reviewing data from the “Atlas of the Flora Iberica Database” (AFLIBER) [67] alongside our own dataset.

Bryophytes Location

We generated the location of the different species from data from the Atlas of Threatened Bryophytes of Spain [82] and citations of collected specimens from the mapping of bryophytes of the Iberian Peninsula and Balearic Islands cited in the Global Biodiversity Information Facility (GBIF) [83,84]. The data underwent a rigorous filtering process, with an emphasis on selecting only those data points supported by citations referencing specimens archived within a scientific collection. Additionally, we gave preference to data associated with organisms or authors recognized for their high reliability, either due to their participation in scientific projects or their specialized expertise within the field of bryophytes.

Rarity

This criterion is measured as the relative number of UTM grid cells in which a single species is present. The rarity criterion is indirectly considered in Anderson’s criterion A(iv), although it only applies to threatened flora.
-
Vascular plants (Three categories based on the calculation of quartiles):
  • Rare: 0.94018–0.97572
  • Very rare: 0.97572–0.98952
  • Extremely rare: 0.98952–0.99984
-
Bryophytes (Three categories based on grid numbers due to the low number of grids occupied by all species, mostly smaller than 10):
  • Rare: >20 UTMs 10 × 10 km
  • Very rare: >10 to <20 UTMs 10 × 10 km
  • Extremely rare: <10 UTMs 10 × 10 km

Endemicity

The endemicity criterion is intrinsically linked to the concept of responsibility [85,86,87,88]; that is, if a species is confined to a specific geographic territory, it is the obligation of the respective governing authorities within that territory to establish a protection regime, as they are responsible for its monitoring and conservation. The smaller the territory, the higher the level of government responsibility for its protection, particularly when all the taxa are threatened and/or protected, as is the case in this study. This study does not intend to delineate areas primarily due to their status as centers of endemism, because it is important to clarify that the presence of an endemic species does not automatically entail its protection or conservation. Instead, it aims to apply a correction factor to the grids containing protected or threatened species, particularly those that are also endemic. The purpose of this correction factor is to emphasize the significance of the territories where these species live. Therefore, we assigned to this criterion the same importance as to other assessment factors.

Ranking Assignment

The criteria allowing an assessment of the VIPAs must be numerical, so that this process is objective, repeatable and comparable. The assessment must allow the correct identification of territories that host fragile environments or species. We adopted status weights from a geometric progression following the proposal of Sánchez de Dios et al. [25]. Table 1 shows the rankings for each of the evaluated items.
Species characterized by significant phylogenetic distinctiveness, such as endangered living fossils (ELFs), or those belonging to monotypic genera [89], had their assigned values tripled as a corrective factor.

2.2.2. Habitats

For the compilation of the list of protected habitats, we used the cartography of habitats of community interest produced by the Spanish government (i.e., scale of 1:50,000), and cartographic data of the distribution of habitats of community interest from Art. 17 (2013–2018) for the Peninsula and Balearic Islands. Both sets of cartographic data were accessed through the website of the Ministerio para la Transición Ecológica y el Reto Demográfico [90,91].
Although the Spanish Catalogue of Threatened Habitats has not yet been developed, it has a precedent in the European Red List of Habitats [92] and the assessments developed by the European Environment Agency [93]. Hence, we used this source to determine the conservation status of habitats, complemented by additional reference documents that facilitated the accurate alignment of EUNIS codes and the red list with the habitat codes specified in the directive [94,95].
We systematically compared these cartographic sources to construct a comprehensive inventory of habitats of community interest. This process also involved determining their presence within 10 × 10 km UTM grids and assigning a score to each grid based on the number and category of habitats present.
For each habitat identified in the Habitats Directive that is found within the grid, we assigned 1 point, and 2 points if it is a priority habitat. Likewise, for each habitat on the red list within the grid, we assigned 1 point for the “vulnerable” category and 2 points for the “endangered” category.

2.2.3. Wind Projects Database

The data concerning wind projects, wind turbines, and their processing status were acquired from the website of the Fund for the Legal Defense of the Cantabrian Mountains (FJDCC) [96]. The dataset used in this work dates from October 2023.

2.2.4. Data Analysis

Data analysis was carried out using R software 4.3.0 [97] and R Commander [98]. In addition, in order to make the graphs interactive, we made them available in the Flourish tool (https://app.flourish.studio, accessed on 12 September 2020). We produced the maps with ArcGIS Desktop 10.8.1.
First, we calculated all variables (threat, protection, rarity, and endemicity) individually for each species. We used Kendall’s correlation coefficient (tau) to calculate the correlation between the variables protection and threat for each species.
Subsequently, we determined the value of each grid was determined as the sum of the individual values contributed by each species.
The computation of the final very important plant areas (VIPAs) was calculated for each UTM grid by applying the following formula to the weighted values of each of the variables:
i = 1 n ( m a x ( P r o t e c t i o n   V a l u e i   o r   T h r e a t   V a l u e i ) + m a x ( P r o t e c t i o n   H I C s   V a l u e i   o r   T h r e a t   H I C s V a l u e i ) + E n d e m i c i t y   V a l u e + R a r i t y   V a l u e )
where:
-
Total Value is the total sum that includes the maximum protection or threat value for plants and Habitats, rarity value, and endemicity value across all UTM grid cells.
-
n is the total number of UTM grid cells.
-
Protection Valuei is the protection value in grid cell i.
-
Threat Valuei is the threat value in grid cell i.
-
Protection HICs Valuei is the habitats of community interest protection value in grid cell i.
-
Threat HICs Valuei is the habitats of community interest threat value in grid cell i.
-
Threat Valuei is the threat value in grid cell i.
-
Endemicity Valuei is the threat value in grid cell i.
-
Rarity Valuei is the threat value in grid cell i.
Furthermore, we computed VIPAs using only threat values for vascular plants, bryophytes, and habitats, in combination with rarity and endemicity parameters.
Additionally, we established VIPAs exclusively utilizing the protection values of vascular plants, bryophytes, and habitats, enabling a meaningful comparison. This was achieved using the following formula:
i = 1 n m a x ( P r o t e c t i o n   V a l u e i ) + P r o t e c t i o n   H I C s   V a l u e i
where:
-
Protection Valuei is the protection value in grid cell i.
-
Protection HICs Valuei is the habitats of community interest protection value in grid cell i.
The various calculations enable us to discern the disparities that arises when employing solely threat values, which lack legal validity, vs. protection values, which carry legal validity but lack uniform criteria across different administrative bodies.
To create the final maps, we categorized the grid results into five classes based on their conservation value, determined by quartile calculations. These classes include: moderate conservation value, significant conservation value, high conservation value, very high conservation value, and extremely high conservation value.

3. Results

Within the 1107 UTM grids analyzed in this study, we found 378 species of endangered and/or protected vascular plants, along with 36 bryophytes, which were recorded a total of 12,085 and 203 times, respectively. Notably, we identified 135 taxa as peninsular endemics, originating from the Cantabrian or Cantabrian–Pyrenean cordillera.

3.1. Wind Projects vs. Space Networks

In the Cantabrian Mountains and its surrounding areas there are currently 405 operative wind power facilities, encompassing a total of 8152 wind turbines. Additionally, there are 70 authorized facilities and another 380 at the planning stages, which would incorporate 645 and 3273 turbines, respectively. It is worth noting that these forthcoming projects are poised to exert a more pronounced impact on both biodiversity and landscapes compared to their already operational counterparts, due to their larger scale and the necessity for significant accompanying infrastructural developments, including power lines and access routes. A total of 20% of active, approved, or planned wind power facilities affect the Biosphere Reserve Network and 12% affect Natura 2000 Network Areas, implying a total of 3587 active wind turbines within ongoing projects, affecting a total of 32 natural areas and/or reserves, both in the Natura 2000 Network and the Biosphere Reserve Network. Additionally, there are 692 wind turbines currently in the planning stages, anticipated to impact a total of 20 sites. Up to this point, 12 wind farms have received official authorization, encompassing a collective total of 66 wind turbines (Figure 2a).
Within a one-kilometer radius of the Natura 2000 Network Areas, the count of planned wind turbines is multiplied by a factor of seven, while those already authorized are increased by a factor of twenty (Figure 2b).

3.2. Protection vs. Threatened
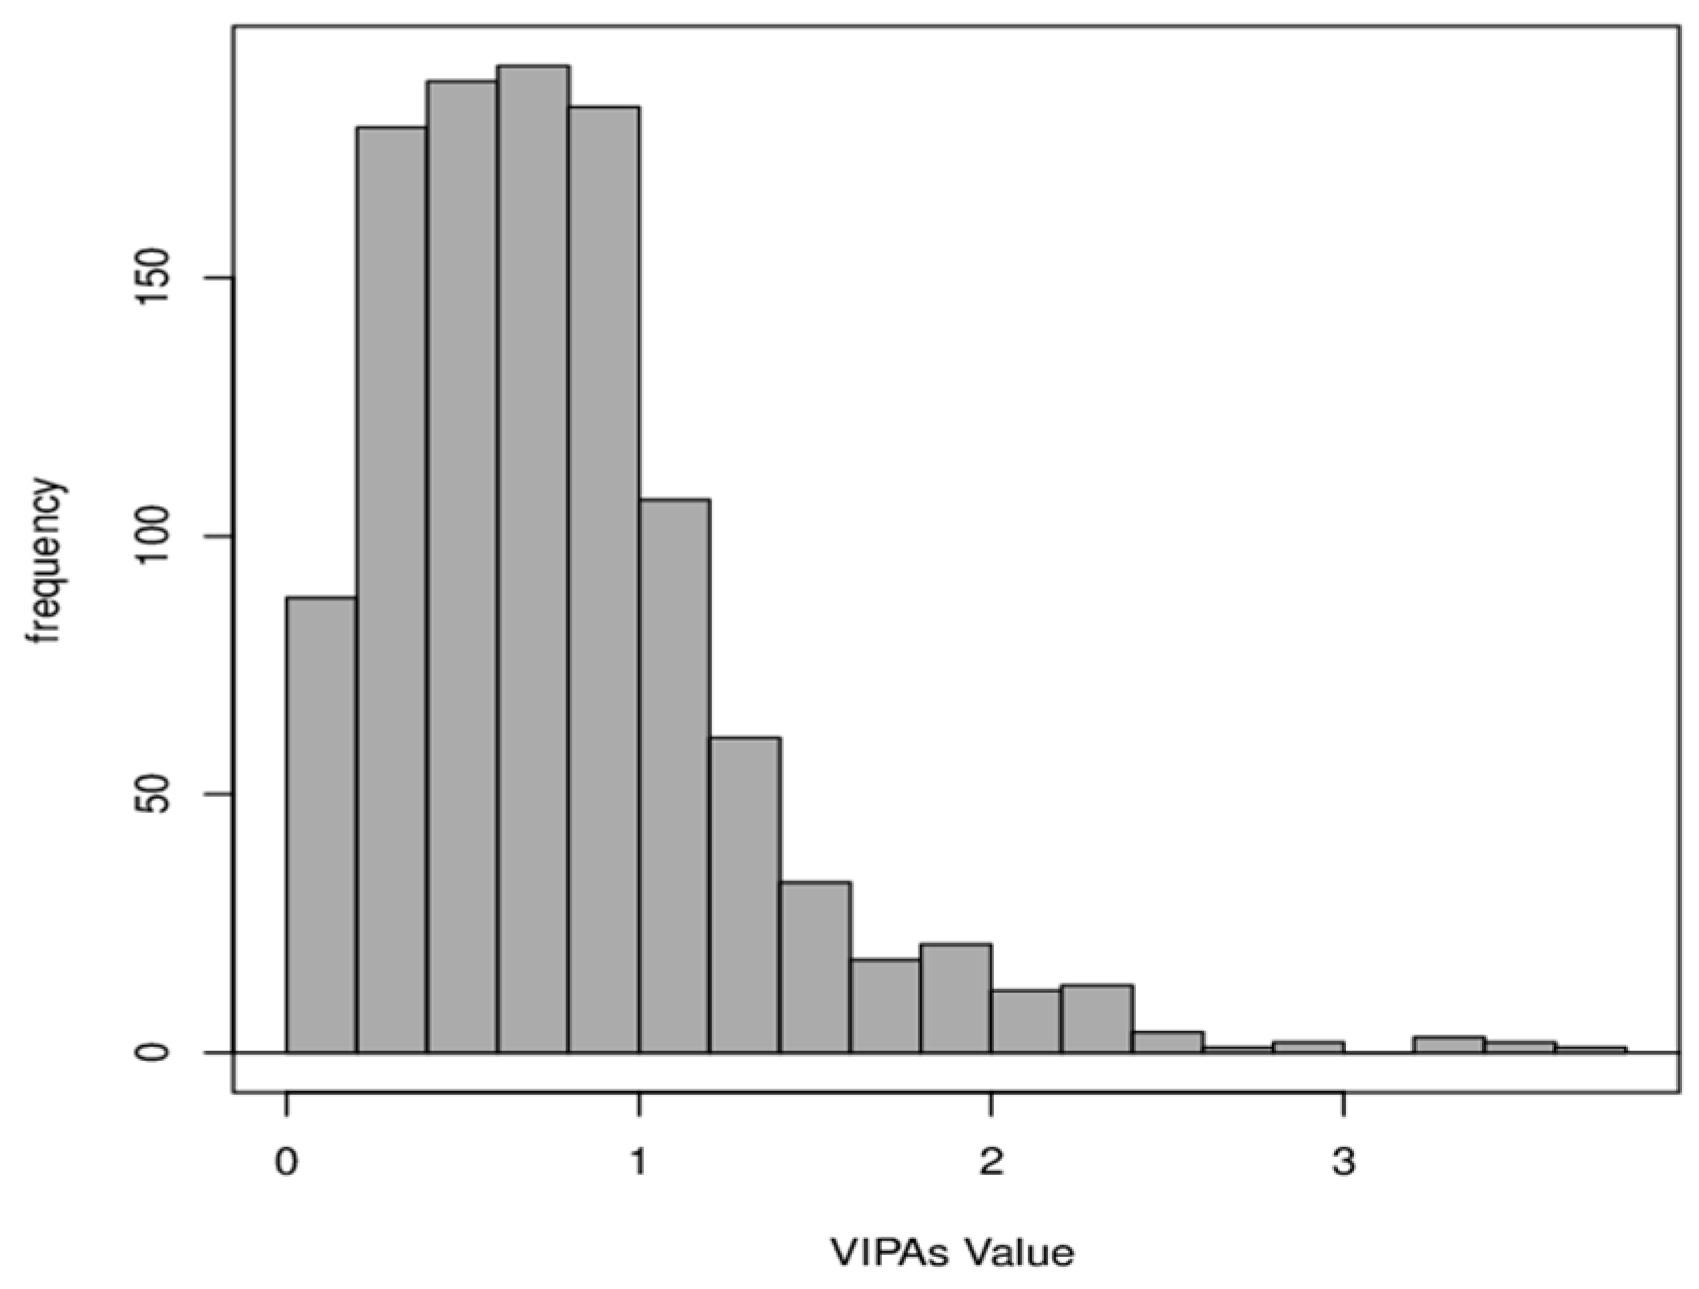
Among the endangered species within the region, only 11% receive protection at the European level, and 17% receive it at the national level. The rest of the protected species are subject to the authority of regional governments, each maintaining distinct lists and categories, resulting in significant variations.
The list of species cataloged under the highest IUCN threat category, critically endangered (CR), have 20 species; 12 species of vascular flora and 7 of bryophytic flora (Table 2). Only 6 species have the highest category of protection and most of the species are protected at the regional level. Of them, 3 species of vascular plants and 4 species of bryophytes do not have any type of protection. In other words, more than a third of the species with the highest degree of threat do not have any European, national, or regional protection.
The tau value indicates the strength and direction of the correlation between the ordinal variables. In this case, the tau value is positive, indicating that there is a tendency of positive association between the variables. However, since the tau value is close to zero (0.1280161), the correlation is relatively weak. When the level of European, national, and regional protection is examined, a major correlation is observed between endangered species and regional protection, with the highest correlation (moderate) found in the autonomous community of Castilla y León. The p-value indicates that there is sufficient statistical evidence to reject the null hypothesis that the tau value is equal to zero, i.e., the observed correlation is not due to chance, but is statistically significant, except in the data obtained for Cantabria and Galicia.
In the context of bryophytic flora, the correlation between the protection and threat variables consistently demonstrated a very weak and statistically non-significant association.
Table 3 below shows the results obtained from the correlation between the variables protection and threat for each of the vascular flora species, both jointly and disaggregated for each of the different levels of protection.

3.3. VIPAs

The territory in general has very high values for the conservation of flora and habitats. Figure 3 shows a histogram of the VIPAs values obtained. A total of 60% of the 1107 UTM grids were classified in the “high conservation value” category. Below are some of the basic descriptive statistical parameters:
Minimum: 0; maximum: 3.663529; mean: 0.77718; median: 0.722949; standard deviation: 0.525381
Figure 4 represents the VIPAs maps, calculated using maximum threat and protection values for vascular plants, bryophytes, and habitats, along with rarity and endemicity parameters and threat values for vascular plants, bryophytes, and habitats, along with rarity and endemicity parameters, and finally, exclusively based on the protection values of vascular plants, bryophytes, and habitats.

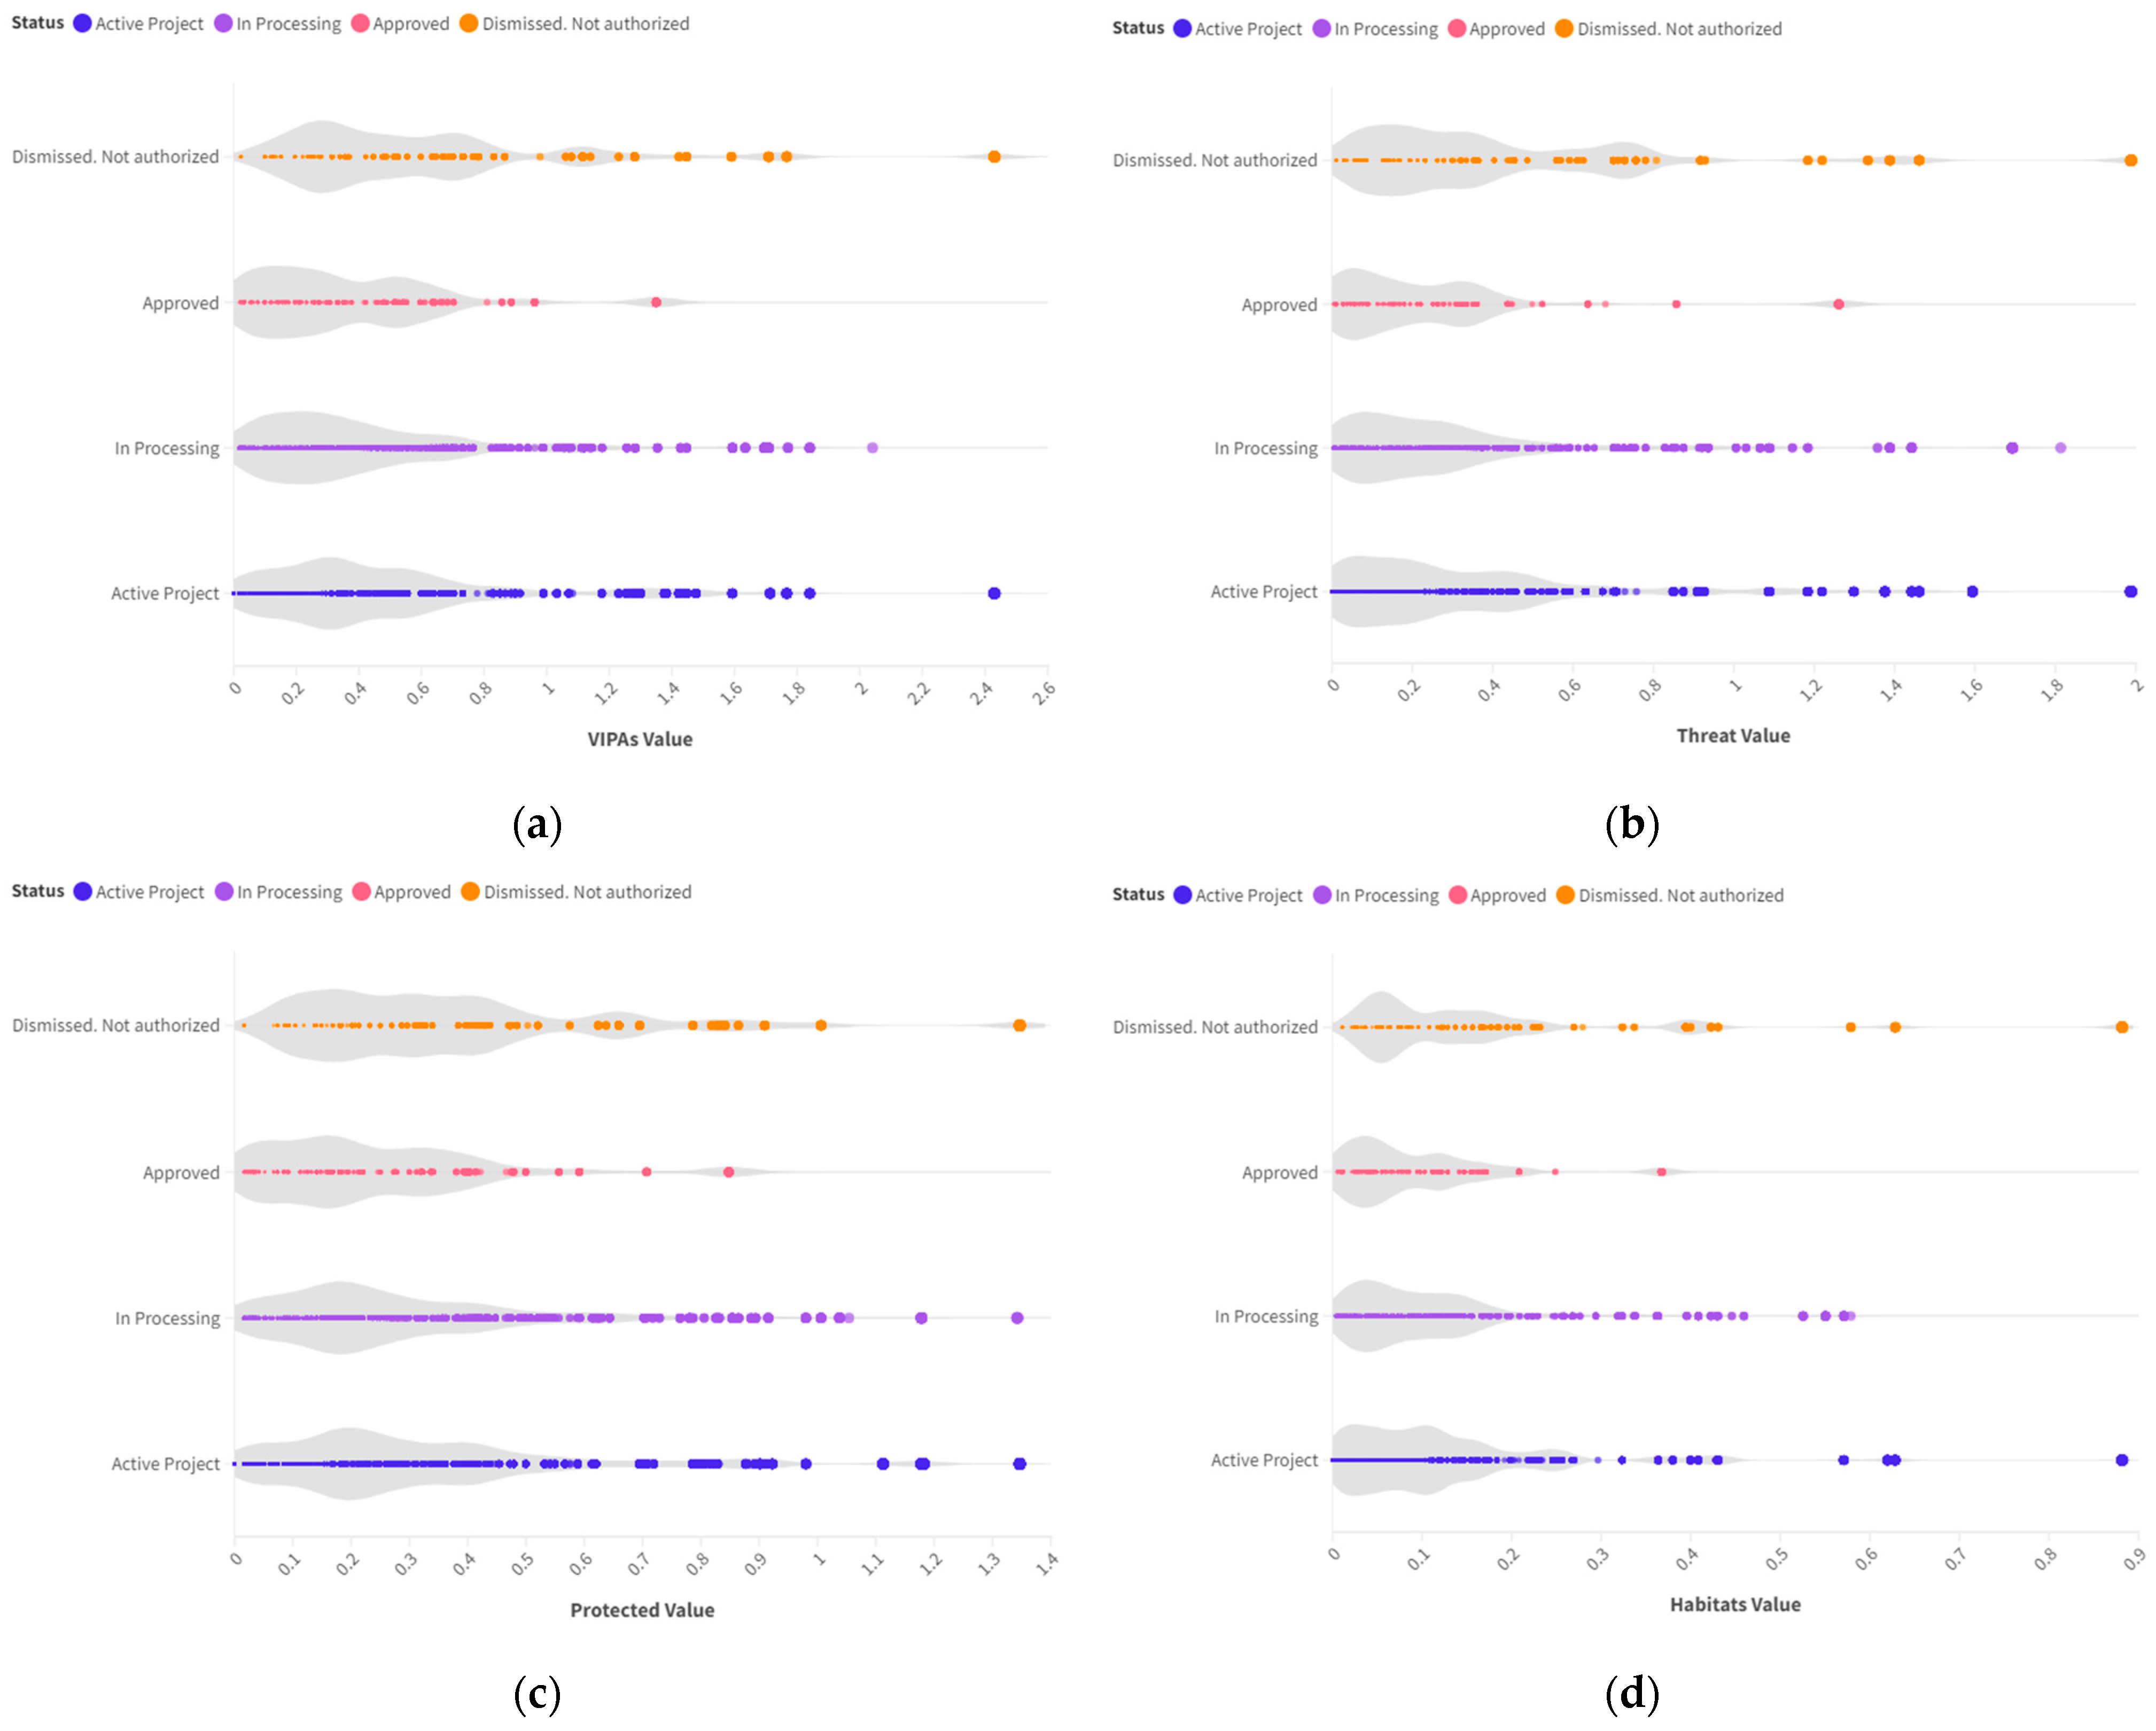
3.4. VIPAs vs. Wind Projects

Figure 5 represents the results of spatially matching wind turbines with the information from the UTM grids. For each wind turbine, we obtained the values of VIPAs, threats, and protection, along with the maximum values for the habitats of community interest.
As shown in Figure 5a, a trend towards higher values is evident in wind farms that have received a negative environmental impact declaration. However, in all stages of processing, there are wind farms located in areas with a high conservation value, including some that are already authorized or already built. All variables have been transformed into a weighted scale ranging from 0 to 1 to facilitate their joint interpretation. It is important to recall that the VIPAs were derived from the cumulative weighted values of the component variables.
A closer examination of the data reveals that Virtus 2 in Burgos, Castilla y León, stands out as the wind farm with the highest VIPAs value, signifying the most significant impact on local flora and habitats, despite its negative environmental impact statement. It is followed closely by Lardeiras in Ourense, Galicia, and Virtus 1, located near Virtus 2. In cases where there is a positive environmental impact statement, El Escudo in Cantabria is the wind farm with the potential for the most substantial impact, although it remains unbuilt primarily due to strong public opposition. This wind farm is situated on the edge of the site of community importance (SCI), Sierra de El Escudo (ES1300016), which is less than 10 km away from Virtus 2 in an area that shares similar natural values, such as peat bogs.

4. Discussion

The Cantabrian Mountains play a highly significant role in biodiversity conservation, aligning with European biodiversity plans and programs. Hosting over half of Spain’s habitats of community interest, they rank among the three regions with the highest plant diversity on the Iberian Peninsula [61]. Moreover, they serve as a critical region for the implementation of mandatory recovery plans for endangered species, acting as a distribution limit for some of these and a fundamental ecological corridor connecting conservation areas and priority habitats.
This work proposes the delimitation of important plant areas (IPAs) [21] and their hierarchical classification as very important plant areas (VIPAs). The primary objective of this endeavor is to identify specific conservation sites and mitigate the impacts resulting from activities involving rapid and significant changes in land use. This is exemplified through the installation of energy production infrastructure, which is closely linked to the ongoing and rapid energy transition. Essential principles in this context include the need to preserve and prevent harm to populations before restoration, and the promotion of precautionary measures prior to implementing compensatory actions [40]. During the development of this study, we assumed that species or habitats identified as priorities for protection (protected by law) are as important as species or habitats assessed as threatened, according to IUCN criteria. VIPAs were subsequently derived by considering both the protection and threat criteria. While there is a correlation between the values associated with protection and threat, the cartographic representations resulting from the application of either criterion diverge. To address this discrepancy, we constructed a composite map that amalgamates the maximum values derived from both criteria. This could help establish a weighting of the values designated at both global and regional scales [99] and solve some problems related to the failure to periodically update the lists of protected and/or threatened taxa. Furthermore, it should be noted that protection values are the exclusive legally binding parameters for species and habitat protection.
Furthermore, our understanding of the impact of wind farms and associated infrastructures may be underestimated [100]. This underestimation is not solely due to an incomplete evaluation of these infrastructures and their associated accumulation and transport networks but also to the cumulative and synergistic effects that can result from their large-scale implementation. According to the FJDCC [96], the current data would require at least 5713 km of high-voltage lines and at least 21,253 high-voltage towers, which means at least 11,400 ha occupied by the easement strip of these high-voltage lines. Addressing these complexities presents inherent challenges that may not be effectively managed at the regional level.
As evident from the findings of the study, a significant multitude of energy production projects are concentrated within very rich regions in botanical values and natural habitats at all stages of project development, encompassing those which have received authorization, those that have been denied, those currently in operation, and those yet to reach a resolution.
Although impacts on flora and habitats may often go unnoticed, they are significant due to their scale. Land occupation by infrastructure leads to habitat destruction and fragmentation [42], the first and most important causes of biodiversity loss at present (more than 30% of extinctions are due to these two reasons) [101]. Habitat loss leads to the direct loss of all habitat-dependent species, which is the most important reason for population extinctions, especially at small scales [13]. Habitat fragmentation creates barriers to the dispersal of individuals, resulting in small and isolated populations, reduced gene flow, increased risk of inbreeding and genetic drift, and increased risk of extinction [102].
To secure the well-being of mountain species and their habitats, it is imperative to consider not only the plants residing at the summits but also the surrounding ecosystems and adjacent communities. These areas play a pivotal role in facilitating genetic material exchange, rendering them invaluable as a source of propagules and a resource for pollinators. Additionally, their protective and buffering characteristics further emphasize their importance. Conservation initiatives aimed at preserving the flora and habitats within mountain environments must unequivocally encompass the entire zone of influence. This approach requires a comprehensive perspective to guarantee uninterrupted connectivity, as substantial changes in permeability, distance, and connection strength have been observed following the construction of specific energy production projects [103]. The same principle can be applied to Natura 2000 Network areas or regions rich in biodiversity, such as the World Network of Biosphere Reserves, as the natural values for which they were designated are similar and interconnected. Many of these issues, along with numerous others associated with the installation of renewable energy production infrastructure within the biosphere reserve network in Spain, have been extensively addressed in a detailed report that includes a historical analysis revealing the damages that occurred in these territories [104].
Specific habitats have a dual significance; they not only contribute to biodiversity conservation but also play a pivotal role in climate regulation. Take peatlands, for example. The issue is not solely the direct loss of the area they occupy. Wind energy projects situated in or near these unique and delicate habitats, like wetlands, blanket bogs, or raised peat bogs, may result in their loss or deterioration, causing damage to their structural integrity and ecological functioning during both project construction and operation [49].
While peatlands in Spain are relatively scarce and smaller compared to those in other European countries, they remain highly significant [105]. They have the potential to store carbon effectively and play a vital role in the global ecosystem [106]. Monitoring this flow is now more crucial than ever in the calculation of the carbon balance and neutrality of wind farm projects. The fact that peatlands can now be included in the National Inventories of Annex I (industrialized) countries is a significant contribution to their compliance with the Kyoto Protocol. It is important to avoid building wind farms on non-degraded peatlands as their construction doesn’t guarantee future carbon reduction [107].
The impact of wind farms on regions containing blanket peatlands, for instance, has been consistently demonstrated, with the study area being one of the most affected in terms of the number of turbines and vehicular tracks [108]. Specifically, evidence of damage has been observed in the Zalama peatlands and the Samo Mountains [105,109], close to the El Escudo and the Virtus 1 and 2 projects. These regions share considerable ecological value, marked by numerous similarities. However, the declarations, whether positive or negative, can vary among these, due to differences in processing. Robust environmental impact studies are essential for a comprehensive assessment, and it is equally crucial to have clear inventories interpreting the habitats directive. Nevertheless, each autonomous community manages its own inventories, which affects the interpretations of the Habitats Directive. Furthermore, as shown above, species protection catalogs also differ between communities. However, plants recognize no political boundaries, and some are confined to specific geographic regions within different countries, making conservation management necessitate a comprehensive strategy [88].
It is clear that autonomous communities play a pivotal role in biodiversity protection, as they possess the broadest scope for action in safeguarding species, the highest adaptability to legislative changes, the strongest potential for fostering communication with the scientific community, and the responsibility for land management within territorial planning. Nonetheless, the Spanish and European administrations must assertively translate plans and programs into practical actions, moving beyond mere documentation. It is necessary to address the discrepancies in the criteria employed by different administrative bodies in the formulation of zoning plans and the implementation of a standardized methodology for the evaluation of environmental impact studies [110]. In this context, as noted by Durá-Alemañ [111], ensuring that the energy transition does not adversely impact biodiversity will necessitate urgent regulations to uphold the principle of non-regression in environmental legislation. According to these authors, the revisions to the legislation create a gateway to an excessive degradation of species and ecosystems, constituting an instance of unwarranted regression. It is worth remembering that currently, the precautionary principle is incorporated in Law 7/2021, of May 20, on climate change and energy transition [112].
Producing high-quality geographic information is fundamental for effective region and species management. This, in turn, enhances our ability to refine zoning and identify priority conservation areas. However, it is worth noting that while priority areas are an essential support tool, they may not be wholly comprehensive [50], especially when less recognized taxonomic groups are disregarded. In addition, to arrive at effective solutions, it may be necessary to adopt interdisciplinary approaches and apply the precautionary principle consistently throughout every stage of the energy transition process.
The absence of data in an accessible and cohesive format leads to a misrepresentation of conservation priorities and in legislative frameworks at various levels (Europe, Spain, and the autonomous communities, as the current study), as highlighted by Darbyshire et al. [18]. Access to information related to energy transition infrastructures should be freely available, at least for researchers, to facilitate the development of new models addressing current issues, such as calculating cumulative or synergistic effects.
In any case, up to this point, there has been limited efficiency in computing sensitive areas or generating quality data without legal validity. Therefore, the focus here is on calculating VIPAs using protection values, the only legally binding parameters.
Some basic considerations derived from the development of this study are the following:
-
The interaction between scientists and managers needs enhancement [110,113], enabling the application of current knowledge in practical territorial management rather than staying confined to theoretical documents. Generating data for species like certain bryophytes, which are already in decline or vanishing, while simultaneously permitting severe impacts on their populations, serves little purpose.
-
There is a need for more streamlined legislation capable of updating lists of protected species in accordance with scientific knowledge. It should be noted that, according to the results obtained, more than one-third of the most endangered species do not have European, national, or regional protection. Time and resources are required to improve and update information on the distribution and status of threatened species [110].
-
Management and conservation plans should be developed for species lacking them. In the absence of such plans, efforts should be made to find solutions for environmental zoning that address the current shortcomings, which result in the exclusion of some taxa at high risk of extinction.
-
The principle of precaution requires a non-intervention of the vulnerable spaces, even less so when all the possibilities of implementation of production of energy have not been exhausted, complying with the basic requirements of the land use planning of maximum suitability, minimum impact.
-
The identification of priority areas in multiple taxonomic groups would help guide decisions and the expansion of protected areas [99]. It is imperative to ensure “minimal overlap” between renewable energy projects and critical biodiversity conservation zones [45,50]. Failure to achieve this could result in substantial, possibly irreversible risks due to an imbalanced information base.
-
It is very important that such management is addressed by all administrative levels working together and not that the private energy-developer companies are the ones who select the locations, without speeding up or relaxing the processes related to the environmental impact study or the process of submission to public information.
-
Environmental impact studies should be based in a strong fieldwork and capable of adhering to quality criteria [110]. Administrative experts must be proficient in the disciplines they assess, or they should rely on a group of expert scientists advisors. This would prevent, in many cases, the burden of omissions in environmental impact studies from falling on citizens’ objections.
In the future, the VIPAs concept could be enhanced to encompass a broader array of taxonomic groups, including fungi or lichens. In addition, other groups can join in the search for important areas for biodiversity and various animal categories, such as birds, mammals, or insects. Additionally, the framework of important areas for conservation could benefit from the development of specialized indicators aimed at safeguarding values like AOO (area of occupancy) and EOO (extent of occurrence). These parameters are crucial for assessing threat levels and ensuring the maintenance of populations and habitats at a favorable conservation status, ultimately reducing the potential exacerbation of impacts resulting from human activities. These indicators would help rectify grid values for populations located at the extremities of their distribution, isolated groups, or habitats that cannot be feasibly restored, among other factors.
Therefore, VIPAs can be employed not just for evaluating the consequences of the energy transition but also for any human activity that leads to abrupt and invasive alterations in land use. Moreover, this concept could serve as a foundation for conservation efforts, including safeguarding the integrity and expansion of the Natura 2000 Network.

5. Conclusions

The study comprised an analysis of 1107 UTM grids measuring 10 × 10 km within the Cantabrian range revealing the existence of grids with substantial value for a diverse range of endangered or protected plant species, the very important plant areas (VIPAs). The concept of VIPAs serves as a valuable tool for identifying critical areas for plant conservation. This approach, which has the potential for expansion to include additional taxonomic groups, aids in the demarcation of priority conservation areas. The results described herein can function as an instrument for sustainable spatial planning, landscape management, and the future implementation of integrated and focused conservation initiatives.
Wind energy development in the Cantabrian Mountains presents a significant threat to the region’s diverse biodiversity, including endangered vascular plant species and bryophytes. Although the impacts on flora and habitats may often escape notice, their scale is substantial, necessitating the advocacy of robust protection policies that encompass them. Inconsistencies in species and habitat protection stemming from variations in protection catalogs and interpretations between autonomous communities underscore the need for more consistent binding legislation. Ongoing and planned wind energy projects are affecting important conservation areas, such as the World Network of Biosphere Reserves and Natura 2000 Network Areas.
The results unveiled a notable deficiency in protection levels, particularly at the European, national, or regional levels, for many species classified as critically endangered (CR). Importantly, a more robust positive correlation between endangered species and regional protection was evident in the Castilla y León autonomous community, compared to the rest of the autonomous communities. Nevertheless, these relationship must be improved, since it is not a good result.
While regional governments play a crucial role, they should not be the final line of defense against biodiversity loss. European and national governments must engage in robust planning grounded in the best scientific knowledge and legally binding principles. However, the tools developed thus far are inadequate and exhibit notable shortcomings that could result in severe and irreversible impacts. The current investigation highlights the urgent need for legislation that accommodates updates to protected species lists, ensuring the inclusion of high-risk taxa. We advocate the consistent application of the precautionary principle in energy transition processes. It is imperative that we find a balance between addressing the energy crisis and preserving biodiversity.

Author Contributions

Conceptualization, E.A.-S. and C.A.; methodology, E.A.-S., A.B.F.-S. and C.A.; formal analysis, E.A.-S., A.B.F.-S. and C.A.; investigation, E.A.-S., A.B.F.-S. and C.A.; resources, E.A.-S., A.B.F.-S. and C.A.; data curation, E.A.-S., A.B.F.-S. and C.A.; writing—original draft preparation, E.A.-S.; writing—review and editing, E.A.-S., A.B.F.-S. and C.A. All authors have read and agreed to the published version of the manuscript.

Funding

This research received no external funding.

Data Availability Statement

The datasets produced and/or analyzed in this study are not currently available to the public. However, they can be obtained from the corresponding author upon reasonable request.

Acknowledgments

Our most sincere gratitude goes to the dedicated professionals at PDCC and FDJCC for their constant and altruistic work, ensuring the proper execution of our endeavors. A special mention is due to Mario Quevedo and Miguel de Gabriel for their invaluable assistance, which has been pivotal to the progress of this project. We also extend our heartfelt thanks to Emilio de La Calzada, Fran de La Calzada, Bárbara Reguera, Ernesto Díaz, Elena Puente, Esperanza Fernández, Javier Naves, Marta Álvarez, Enrique Francés, José María César Fernández, Marta Infante, Patxi Heras, and the countless anonymous individuals who steadfastly support the preservation of their territories, the protection of biodiversity, and the stewardship of their mountains. To those who remain resolute in their commitment to wildlife conservation, we sincerely thank you. In a unique corner, we extend our gratitude to Eilidh High for her skill in weaving the threads of English.

Conflicts of Interest

The authors declare no conflict of interest.

References

  1. Dasgupta, S.P. The Economics of Biodiversity: The Dasgupta Review Full Report. Environ. Econ. 2021, 1–610. [Google Scholar]
  2. Díaz, S.; Settele, J.; Brondízio, E.S.; Ngo, H.T.; Agard, J.; Arneth, A.; Balvanera, P.; Brauman, K.A.; Butchart, S.H.M.; Chan, K.M.A.; et al. Pervasive Human-Driven Decline of Life on Earth Points to the Need for Transformative Change. Science 2019, 366, eaax3100. [Google Scholar] [CrossRef] [PubMed]
  3. Brockett, C.; Woolaston, K.; Deane, F.; Humphries, F.; Kumar, E.; Kennedy, A.; Bell-James, J. Best Practice Mechanisms for Biodiversity Conservation Law and Policy. Camb. Prism. Extinction 2023, 1, e16. [Google Scholar] [CrossRef]
  4. Bruner, A.G.; Gullison, R.E.; Rice, R.E.; da Fonseca, G.A.B. Effectiveness of Parks in Protecting Tropical Biodiversity. Science 2001, 291, 125–128. [Google Scholar] [CrossRef]
  5. Geldmann, J.; Barnes, M.; Coad, L.; Craigie, I.D.; Hockings, M.; Burgess, N.D. Effectiveness of Terrestrial Protected Areas in Reducing Habitat Loss and Population Declines. Biol. Conserv. 2013, 161, 230–238. [Google Scholar] [CrossRef]
  6. Geldmann, J.; Coad, L.; Barnes, M.D.; Craigie, I.D.; Woodley, S.; Balmford, A.; Brooks, T.M.; Hockings, M.; Knights, K.; Mascia, M.B.; et al. A Global Analysis of Management Capacity and Ecological Outcomes in Terrestrial Protected Areas. Conserv. Lett. 2018, 11, e12434. [Google Scholar] [CrossRef]
  7. Gray, C.L.; Hill, S.L.L.; Newbold, T.; Hudson, L.N.; Börger, L.; Contu, S.; Hoskins, A.J.; Ferrier, S.; Purvis, A.; Scharlemann, J.P.W. Local Biodiversity Is Higher inside than Outside Terrestrial Protected Areas Worldwide. Nat. Commun. 2016, 7, 12306. [Google Scholar] [CrossRef]
  8. Younge, A.; Fowkes, S. The Cape Action Plan for the Environment: Overview of an Ecoregional Planning Process. Biol. Conserv. 2003, 112, 15–28. [Google Scholar] [CrossRef]
  9. Coad, L.; Watson, J.E.; Geldmann, J.; Burgess, N.D.; Leverington, F.; Hockings, M.; Knights, K.; Di Marco, M. Widespread Shortfalls in Protected Area Resourcing Undermine Efforts to Conserve Biodiversity. Front. Ecol. Environ. 2019, 17, 259–264. [Google Scholar] [CrossRef]
  10. Di Minin, E.; Toivonen, T. Global Protected Area Expansion: Creating More than Paper Parks. BioScience 2015, 65, 637–638. [Google Scholar] [CrossRef]
  11. Jaureguiberry, P.; Titeux, N.; Wiemers, M.; Bowler, D.E.; Coscieme, L.; Golden, A.S.; Guerra, C.A.; Jacob, U.; Takahashi, Y.; Settele, J.; et al. The Direct Drivers of Recent Global Anthropogenic Biodiversity Loss. Sci. Adv. 2022, 8, eabm9982. [Google Scholar] [CrossRef] [PubMed]
  12. Fahrig, L. Effects of Habitat Fragmentation on Biodiversity. Annu. Rev. Ecol. Evol. Syst. 2003, 34, 487–515. [Google Scholar] [CrossRef]
  13. Heywood, V.H. Global Biodiversity Assessment; Cambridge University Press: Cambridge, UK, 1995; Volume 1140. [Google Scholar]
  14. Langhammer, P.F. Identification and Gap Analysis of Key Biodiversity Areas: Targets for Comprehensive Protected Area Systems; IUCN: Gland, Switzerland, 2007; ISBN 978-2-8317-0992-5. [Google Scholar]
  15. Eken, G.; Bennun, L.; Brooks, T.M.; Darwall, W.; Fishpool, L.D.C.; Foster, M.; Knox, D.; Langhammer, P.; Matiku, P.; Radford, E.; et al. Key Biodiversity Areas as Site Conservation Targets. BioScience 2004, 54, 1110–1118. [Google Scholar] [CrossRef]
  16. Donald, P.F.; Fishpool, L.D.C.; Ajagbe, A.; Bennun, L.A.; Bunting, G.; Burfield, I.J.; Butchart, S.H.M.; Capellan, S.; Crosby, M.J.; Dias, M.P.; et al. Important Bird and Biodiversity Areas (IBAs): The Development and Characteristics of a Global Inventory of Key Sites for Biodiversity. Bird Conserv. Int. 2019, 29, 177–198. [Google Scholar] [CrossRef]
  17. Cuena-Lombraña, A.; Fois, M.; Cogoni, A.; Bacchetta, G. Where We Come from and Where to Go: Six Decades of Botanical Studies in the Mediterranean Wetlands, with Sardinia (Italy) as a Case Study. Wetlands 2021, 41, 69. [Google Scholar] [CrossRef]
  18. Darbyshire, I.; Anderson, S.; Asatryan, A.; Byfield, A.; Cheek, M.; Clubbe, C.; Ghrabi, Z.; Harris, T.; Heatubun, C.D.; Kalema, J.; et al. Important Plant Areas: Revised Selection Criteria for a Global Approach to Plant Conservation. Biodivers. Conserv. 2017, 26, 1767–1800. [Google Scholar] [CrossRef]
  19. Di Marco, M.; Brooks, T.; Cuttelod, A.; Fishpool, L.D.C.; Rondinini, C.; Smith, R.J.; Bennun, L.; Butchart, S.H.M.; Ferrier, S.; Foppen, R.P.B.; et al. Quantifying the relative irreplaceability of important bird and biodiversity areas. Conserv. Biol. 2016, 30, 392–402. [Google Scholar] [CrossRef]
  20. Donald, P.F.; Buchanan, G.M.; Balmford, A.; Bingham, H.; Couturier, A.R.; de la Rosa, G.E., Jr.; Gacheru, P.; Herzog, S.K.; Jathar, G.; Kingston, N.; et al. The Prevalence, Characteristics and Effectiveness of Aichi Target 11′s “Other Effective Area-Based Conservation Measures” (OECMs) in Key Biodiversity Areas. Conserv. Lett. 2019, 12, e12659. [Google Scholar] [CrossRef]
  21. Anderson, S. Identifying Important Plant Areas; Plantlife International: Salisbury, UK, 2002. [Google Scholar]
  22. Alcaraz, F.; Barreno, E.; Blanca, G.; Blanco, E.; Bolós, O.; Cabezudo, B.; Camarasa, J.M.; Castroviejo, S.; Currás, R.; Fernández Prieto, J.A.; et al. Criterios Para Definir Las Áreas Importantes Para La Flora y La Vegetación. Ecología 1989, 3, 3–5. [Google Scholar]
  23. Del Valle, E.; Maldonado, F.J.; Sainz, H.; Sánchez de Dios, R. Áreas importantes para la flora amenazada Española. In Atlas y Libro Rojo de la Flora Vascular Amenazada de España; Bañares, A., Blanca, G., Güemes, J., Ortiz, J.C.M.Y.S., Eds.; Dirección General de Conservación de la Naturaleza: Madrid, Spain, 2004; pp. 979–1007. [Google Scholar]
  24. Muñoz-Rodríguez, P.; Draper Munt, D.; Moreno Saiz, J.C. Global Strategy for Plant Conservation: Inadequate In Situ Conservation of Threatened Flora in Spain. Isr. J. Plant Sci. 2016, 63, 297–308. [Google Scholar] [CrossRef]
  25. Sánchez de Dios, R.; Cabal Ruano, C.; Domínguez Lozano, F.; Sainz Ollero, H.; Moreno Saiz, J.C. The Role of Criteria in Selecting Important Areas for Conservation in Biodiversity-Rich Territories. Divers. Distrib. 2017, 23, 368–380. [Google Scholar] [CrossRef]
  26. Infante, M.; Heras, P. Red preliminar de áreas importantes para los briófitos (IBrA). In Atlas y Libro Rojo de Los Briófitos Amenazados de España; Garilleti, R., Albertos, B., Eds.; Organismo Autònomo de Parques Nacionales: Madrid, Spain, 2012. [Google Scholar]
  27. Infante, M.; Heras, P. Bryophytes in the Spanish Law. Bol. Soc. Esp. Briol. 2005, 5–16. [Google Scholar]
  28. González-Mancebo, J.M.; Dirkse, G.M.; Patiño, J.; Romaguera, F.; Werner, O.; Ros, R.M.; Martín, J.L. Applying the IUCN Red List Criteria to Small-Sized Plants on Oceanic Islands: Conservation Implications for Threatened Bryophytes in the Canary Islands. Biodivers. Conserv. 2012, 21, 3613–3636. [Google Scholar] [CrossRef]
  29. Sérgio, C.; Brugués, M.; Cros, R.M.; Casas, C.; Garcia, C. The 2006 Red List and an Updated Checklist of Bryophytes of the Iberian Peninsula (Portugal, Spain and Andorra). Lindbergia 2007, 31, 109–125. [Google Scholar]
  30. Atienza, V.; Segarra-Moragues, J. Preliminary Red List of the Lichens of the Valencia Community (Eastern Spain). For. Snow Landsc. Res. 2000, 75, 391–400. [Google Scholar]
  31. Martinez, I.; Aragón, G.; Sarrión, F.J.; Escudero, A.; Burgaz, A.R.; Coppins, B.J. Threatened Lichens in Central Spain (Saxicolous Species Excluded). Cryptogam. Mycol. 2003, 24, 73–97. [Google Scholar]
  32. Nascimbene, J.; Nimis, P.; Ravera, S. Evaluating the Conservation Status of Epiphytic Lichens of Italy: A Red List. Plant Biosyst. 2013, 147, 898–904. [Google Scholar] [CrossRef]
  33. Czyżewska, K.; Cieśliński, S. Czerwona Lista Porostów Zagrożonych w Puszczy Białowieskiej [Red List of Threatened Lichens in the Białowieża Old-Growth Forest]. Monogr. Bot. 2014, 91, 107–119. [Google Scholar] [CrossRef]
  34. Randlane, T.; Jüriado, I.; Suija, A.; Lõhmus, P.; Leppik, E. Lichens in the New Red List of Estonia. Folia Cryptogam. Est. 2008, 44, 113–120. [Google Scholar]
  35. Lõhmus, P.; Marmor, L.; Jüriado, I.; Suija, A.; Oja, E.; Degtjarenko, P.; Randlane, T. Red List of Estonian Lichens: Revision in 2019. Folia Cryptogam. Est. 2019, 56, 63–76. [Google Scholar] [CrossRef]
  36. Dahlberg, A.; Mueller, G.M. Applying IUCN Red-Listing Criteria for Assessing and Reporting on the Conservation Status of Fungal Species. Fungal Ecol. 2011, 4, 147–162. [Google Scholar] [CrossRef]
  37. European Council for the Conservation of Fungi. Available online: http://www.eccf.eu/ (accessed on 6 January 2023).
  38. Gómez-Bolea, A.; Burgaz, A.; Atienza, V.; Dumitru, O.C.; Chesa, M.; Chiva, S.; Force, L.; Muriel, S.; Prieto, M.; Rico, V.; et al. Checklist of the Lichens and Lichenicolous Fungi of Sierra Nevada (Spain). Bot. Complut. 2021, 45, e74427. [Google Scholar] [CrossRef]
  39. Marcos Laso, B.; Velasco Santos, J.M.; García Blanco, A.; García Vicente, A.; Fernández Toirán, M.; Ágreda Cabo, T.; Martínez Peña, F.; Hergueta Perlado, A. Boletín Micológico de FAMCAL; Junta de Castilla y León: León, Spain, 2006; pp. 83–94. [Google Scholar]
  40. Alfaro-Saiz, E.; Alonso Villadangos, Y.; Acedo, C. El futuro es hoy: El reto de una transición energética compatible con la conservación vegetal. Conserv. Veg. 2022, 26, 17–21. [Google Scholar]
  41. Chico, G.; Clutterbuck, B.; Clough, J.; Lindsay, R.; Midgley, N.G.; Labadz, J.C. Geo-Hydromorphological Assessment of Europe’s Southernmost Blanket Bogs. Earth Surf. Process. Landf. 2020, 45, 2747–2760. [Google Scholar] [CrossRef]
  42. Kuvlesky, W.P.; Brennan, L.A.; Morrison, M.L.; Boydston, K.K.; Ballard, B.M.; Bryant, F.C. Wind Energy Development and Wildlife Conservation: Challenges and Opportunities. J. Wildl. Manag. 2007, 71, 2487–2498. [Google Scholar] [CrossRef]
  43. Serrano, D.; Margalida, A.; Pérez-García, J.M.; Juste, J.; Traba, J.; Valera, F.; Carrete, M.; Aihartza, J.; Real, J.; Mañosa, S.; et al. Renewables in Spain Threaten Biodiversity. Science 2020, 370, 1282–1283. [Google Scholar] [CrossRef]
  44. Santangeli, A.; Toivonen, T.; Pouzols, F.M.; Pogson, M.; Hastings, A.; Smith, P.; Moilanen, A. Global Change Synergies and Trade-Offs between Renewable Energy and Biodiversity. GCB Bioenergy 2016, 8, 941–951. [Google Scholar] [CrossRef]
  45. Rehbein, J.A.; Watson, J.E.M.; Lane, J.L.; Sonter, L.J.; Venter, O.; Atkinson, S.C.; Allan, J.R. Renewable Energy Development Threatens Many Globally Important Biodiversity Areas. Glob. Change Biol. 2020, 26, 3040–3051. [Google Scholar] [CrossRef]
  46. Northrup, J.M.; Wittemyer, G. Characterising the Impacts of Emerging Energy Development on Wildlife, with an Eye towards Mitigation. Ecol. Lett. 2013, 16, 112–125. [Google Scholar] [CrossRef]
  47. Gasparatos, A.; Doll, C.N.H.; Esteban, M.; Ahmed, A.; Olang, T.A. Renewable Energy and Biodiversity: Implications for Transitioning to a Green Economy. Renew. Sustain. Energy Rev. 2017, 70, 161–184. [Google Scholar] [CrossRef]
  48. Sánchez-Zapata, J.A.; Clavero, M.; Carrete, M.; DeVault, T.L.; Hermoso, V.; Losada, M.A.; Polo, M.J.; Sánchez-Navarro, S.; Pérez-García, J.M.; Botella, F.; et al. Effects of renewable energy production and infrastructure on wildlife. In Current Trends in Wildlife Research; Mateo, R., Arroyo, B., Garcia, J.T., Eds.; Wildlife Research Monographs; Springer International Publishing: Cham, Switzerland, 2016; pp. 97–123. ISBN 978-3-319-27912-1. [Google Scholar]
  49. European Commission. Guidance Document on Wind Energy Developments and EU Nature Legislation; Directorate-General for Environment (European Commission): Brussels, Belgium; Publications Office of the European Union: Luxembourg, 2020; ISBN 978-92-76-27290-8. [Google Scholar]
  50. Pérez-García, J.M.; Morant, J.; Arrondo, E.; Sebastián-González, E.; Lambertucci, S.A.; Santangeli, A.; Margalida, A.; Sánchez-Zapata, J.A.; Blanco, G.; Donázar, J.A.; et al. Priority Areas for Conservation Alone Are Not a Good Proxy for Predicting the Impact of Renewable Energy Expansion. Proc. Natl. Acad. Sci. USA 2022, 119, e2204505119. [Google Scholar] [CrossRef] [PubMed]
  51. Ministerio para la Transición Ecológica y el Reto Demográfico. Zonificación Ambiental para Energías Renovables: Eólica y Fotovoltaica. Available online: https://www.miteco.gob.es/es/calidad-y-evaluacion-ambiental/temas/evaluacion-ambiental/zonificacion_ambiental_energias_renovables.aspx (accessed on 5 July 2022).
  52. Del Olmo, A. Real Decreto Ley 6/2022, de 29 de Marzo, Por El Que Se Adoptan Medidas Urgentes En El Marco Del Plan Nacional de Respuesta a Las Consecuencias Económicas y Sociales de La Guerra En Ucrania; Fundación Dialnet: Logroño, Spain, 2022. [Google Scholar]
  53. De la Calzada, J. Análisis de la Legislación Relativa a Los Planes de Gestión de Taxones Amenazados en España. Master’s Thesis, Universidad de Huelva, Huelva, Spain, 2019. [Google Scholar]
  54. Ministerio para la Transición Ecológica y el Reto Demográfico. Estrategia de Conservación y de Lucha Contra las Amenazas de Plantas Protegidas en Ambientes Rupículas; Ministerio para la Transición Ecológica y el Reto Demográfico: Madrid, Spain, 2018. [Google Scholar]
  55. Ministerio para la Transición Ecológica y el Reto Demográfico. Estrategia de Conservación y de Lucha Contra Amenazas de Plantas Protegidas de Altas Cumbres; Ministerio para la Transición Ecológica y el Reto Demográfico: Madrid, Spain, 2019. [Google Scholar]
  56. Ministerio para la Transición Ecológica y el Reto Demográfico. Estrategia de Conservación y de Lucha Contra Amenazas de Plantas Protegidas Ligadas al Agua; Ministerio para la Transición Ecológica y el Reto Demográfico: Madrid, Spain, 2019. [Google Scholar]
  57. Junta de Castilla y León Criterios para la Implantación de Renovables. Available online: https://energia.jcyl.es/web/es/energias-renovables-ordenacion-energetica/documentos-definitivos.html (accessed on 25 January 2022).
  58. Consejería de Sostenibilidad. Decreto 63/2007, de 14 de Junio, Por El Que Se Crean El Catálogo de Flora Protegida de Castilla y León y La Figura de Protección Denominada Microrreserva de Flora; Consejería de Sostenibilidad: Madrid, Spain, 2007. [Google Scholar]
  59. Quevedo, M. Algunos impactos sobre fauna cantábrica. In I Jornadas de Medio Natural y Transición Energética; Universidad de León: León, Spain, 2022. [Google Scholar]
  60. Venter, O.; Sanderson, E.W.; Magrach, A.; Allan, J.R.; Beher, J.; Jones, K.R.; Levy, M.A.; Watson, J.E. Last of the Wild Project, Version 3 (LWP-3): 2009 Human Footprint; NASA: Washington, DC, USA, 2018.
  61. Jiménez-Alfaro, B.; Carlón, L.; Fernández-Pascual, E.; Acedo, C.; Alfaro-Saiz, E.; Alonso Redondo, R.; Cires, E.; Del Egido Mazuelas, F.; Del Río, S.; Díaz Gonz’alez, T.E.; et al. Checklist of the Vascular Plants of the Cantabrian Mountains. Mediterr. Bot. 2021, 42, 1–59. [Google Scholar] [CrossRef]
  62. Aedo, C.; Buira, A.; Medina, L.; Fernández-Albert, M. The Iberian vascular flora: Richness, endemicity and distribution patterns. In The Vegetation of the Iberian Peninsula; Loidi, J., Ed.; Plant and Vegetation; Springer International Publishing: Cham, Switzerland, 2017; Volume 1, pp. 101–130. ISBN 978-3-319-54784-8. [Google Scholar]
  63. Llamas, F.; Acedo, C.; Lence, C.; Redondo, R.; Molina, A.; Castro, V. Flora Cantábrica de Interés En Castilla y León. Nat. Cantab. 2007, 3, 57–78. [Google Scholar]
  64. Romero Buján, M.I. Catálogo Da Flora de Galicia; Alonso, J.L.B., Ed.; Jolube Consultor Botánico y Editor: Jaca, Spain, 2008; Volume 1. [Google Scholar]
  65. Fernández Prieto, J.A.; Cires, E.; Bueno, A.; Vazquez, V.M.; Nava, H. Catálogo de Las Plantas Vasculares Del Principado de Asturias. Doc. Jardín Bot. Atlántico Gijón 2014, 11, 7–267. [Google Scholar]
  66. Durán Gómez, J.A. Catálogo de la Flora Vascular de Cantabria; Alonso, J.L.B., Ed.; Jolube Consultor Botánico y Editor: Jaca, Spain, 2014; Volume 13, ISBN 978-84-941996-2-2. [Google Scholar]
  67. Ramos-Gutiérrez, I.; Lima, H.; Pajarón, S.; Romero-Zarco, C.; Sáez, L.; Pataro, L.; Molina-Venegas, R.; Rodriguez, M.; Moreno Saiz, J. Atlas of the Vascular Flora of the Iberian Peninsula Biodiversity Hotspot (AFLIBER). Glob. Ecol. Biogeogr. 2021, 30, 1951–1957. [Google Scholar] [CrossRef]
  68. Xunta de Galicia. Decreto 88/2007 de 19 de Abril, Por El Que Se Regula El Catálogo Gallego de Especies Amenazadas; Xunta de Galicia: Coruña, Spain, 2007.
  69. Ministerio de Transición Ecológica. Decreto 65/1995, de 27 de Abril Por El Que Se Crea El Catálogo Regional de Especies Amenazadas de La Flora Del Principado de Asturias y Se Dictan Normas Para Su Protección; Ministerio de Transición Ecológica: Madrid, Spain, 1995. [Google Scholar]
  70. Ministerio de Transición Ecológica. Decreto 120/2008, de 4 de Diciembre Por El Que Se Regula El Catálogo Regional de Especies Amenazadas de Cantabria; Ministerio de Transición Ecológica: Madrid, Spain, 2008. [Google Scholar]
  71. Ministerio de Transición Ecológica. Ley 4/2015, de 24 de Marzo, Del Patrimonio Natural de Castilla y León; Ministerio de Transición Ecológica: Madrid, Spain, 2015. [Google Scholar]
  72. Catalogue of Life COL Checklist, 2023-09-14. Available online: https://www.catalogueoflife.org/ (accessed on 6 September 2023).
  73. Plants of the World Online: POWO. Facilitated by the Royal Botanic Gardens, Kew. Available online: https://powo.science.kew.org/ (accessed on 6 May 2022).
  74. European Parliament. Directive 92/43/CEE of the Council of 21 May 1992 on the Conservation of Natural Habitats and of Wild Fauna and Flora (Habitat Directive); European Parliament: Strasbourg, France, 1992. [Google Scholar]
  75. European Parliament. Real Decreto 139/2011, de 4 de Febrero, Para el Desarrollo del Listado de Especies Silvestres En Régimen de Protección Especial y Del Catálogo Español de Especies Amenazadas; European Parliament: Strasbourg, France, 2011. [Google Scholar]
  76. Bañares, A.; Blanca, G.; Güemes, J.; Moreno, J.C.; Ortiz, S. Atlas y Libro Rojo de La Flora Vascular Amenazada de España; Dirección General de Conservación de la Naturaleza: Madrid, Spain, 2004; ISBN 84-8014-521-8. [Google Scholar]
  77. Bañares, A.; Blanca, G.; Güemes, J.; Moreno, J.C.; Ortiz, S. Atlas y Libro Rojo de La Flora Vascular Amenazada de España: Adenda 2006; Dirección General para la Biodiversidad-Sociedad Española de Biología de la Conservación de Plantas: Madrid, Spain, 2006; ISBN 978-84-8014-706-4. [Google Scholar]
  78. Bañares, A.; Blanca, G.; Güemes, J.; Moreno, J.C.; Ortiz, S. Atlas y Libro Rojo de La Flora Vascular Amenazada de España: Adenda 2008; Dirección General de Medio Natural y Política Forestal (Ministerio de Medio Ambiente, y Medio Rural y Marino)—Sociedad Española de Biología de la Conservación de Plantas: Madrid, Spain, 2008; ISBN 978-84-8014-741-5. [Google Scholar]
  79. Bañares, A.; Blanca, G.; Güemes, J.; Moreno, J.C.; Ortiz, S. Atlas y Libro Rojo de La Flora Vascular Amenazada de España: Adenda 2010; Dirección General de Medio Natural y Política Forestal (Ministerio de Medio Ambiente, y Medio Rural y Marino)—Sociedad Española de Biología de la Conservación de Plantas: Madrid, Spain, 2010. [Google Scholar]
  80. Moreno Saiz, J.C.; Iriondo Alegría, G.; Martínez García, F.; Martínez Rodríguez, J.; Salazar Mendías, C. Atlas y Libro Rojo de La Flora Vascular Amenazada de España. Adenda 2017; Ministerio para la Transición Ecológica-Sociedad Española de Biología de la Conservación de Plantas: Madrid, Spain, 2019. [Google Scholar]
  81. Brugués, M.; González, M. Lista Roja de Los Briófitos Amenazados de España; Garilleti, R., Albertos, B., Eds.; Atlas de Los Briófitos Amenazados de España; Publicado En Línea El 04/07/2014; Universitat de València: València, Spain, 2014. [Google Scholar]
  82. Garilleti, R.; Albertos, B. ABrA Atlas de Los Briófitos Amenazados de España; Universitat de València: València, Spain, 2017. [Google Scholar]
  83. GBIF. The Global Biodiversity Information Facility. Available online: www.gbif.org (accessed on 14 October 2023).
  84. GBIF.org. (6 October 2023) GBIF Occurrence; GBIF: Copenhagen, Denmark, 2023; Available online: https://www.gbif.org/occurrence/download/0004644-231002084531237 (accessed on 14 October 2023).
  85. Llamas García, F.; Acedo, C.; Lence Paz, C.; Molina González, A.M. Prioridades de conservación de flora cantábrica de interés en Castilla y León. In Botánica Pirenaico-Cantábrica en el Siglo XXI; Universidad de León: León, Spain, 2009; pp. 191–218. ISBN 978-84-9773-471-4. [Google Scholar]
  86. Jiménez-Alfaro, B.; Bueno Sánchez, Á.; Fernández-Prieto, J.A. Valoración de plantas de interés para la conservación en Asturias a través de un Índice de Responsabilidad. Nat. Cantab. 2007, 3, 25–36. [Google Scholar]
  87. Schatz, B.; Gauthier, P.; Debussche, M.; Thompson, J.D. A Decision Tool for Listing Species for Protection on Different Geographic Scales and Administrative Levels. J. Nat. Conserv. 2014, 22, 75–83. [Google Scholar] [CrossRef]
  88. Krigas, N.; Karapatzak, E.; Panagiotidou, M.; Sarropoulou, V.; Samartza, I.; Karydas, A.; Damianidis, C.K.; Najdovski, B.; Teofilovski, A.; Mandzukovski, D.; et al. Prioritizing Plants around the Cross-Border Area of Greece and the Republic of North Macedonia: Integrated Conservation Actions and Sustainable Exploitation Potential. Diversity 2022, 14, 570. [Google Scholar] [CrossRef]
  89. Vargas, P. Exploring ‘Endangered Living Fossils’ (ELFs) among Monotypic Genera of Plants and Animals of the World. Front. Ecol. Evol. 2023, 11, 570. [Google Scholar] [CrossRef]
  90. Ministerio para la Transición Ecológica y el Reto Demográfico. Informe Sobre La Aplicación de La Directiva Hábitats En España 2013–2018. Available online: https://www.miteco.gob.es/es/biodiversidad/temas/espacios-protegidos/red-natura-2000/rn_cons_seguimiento_art17_inf_2013_2018.html (accessed on 1 February 2023).
  91. Ministerio para la Transición Ecológica y el Reto Demográfico. Hábitats de Interés Comunitario Del Anexo I de La Directiva 92/43/CEE. Available online: https://www.miteco.gob.es/es/biodiversidad/servicios/banco-datos-naturaleza/informacion-disponible/habitat.html (accessed on 1 February 2023).
  92. Tsiripidis, I.; Piernik, A.; Janssen, J.A.M.; Tahvanainen, T.; Molina, J.A.; Giusso del Galdo, G.; Gardfjell, H.; Dimopoulos, P.; Šumberová, K.; Acosta, A.; et al. European Red List of Habitats. Part 2, Terrestrial and Freshwater Habitats; European Commission, Environment General Direction, Publications Office: Luxembourg, 2016; ISBN 978-92-79-61588-7. [Google Scholar]
  93. EUNIS. Database. European Nature Information System; European Environment Agency: Copenhagen, Denmark, 2019; Available online: https://eunis.eea.europa.eu/index.jsp (accessed on 6 October 2023).
  94. Ramírez Rodríguez, R.; Bañuelos Martínez, M.J.; Cires Rodríguez, E.; Álvarez Arbesú, R.L.; Valderrábano Luque, J.; García Manteca, P.; González Rodríguez, G.; Marquínez García, J.L.; Fernández Prieto, J.A. Hábitats EUNIS Terrestres y Litorales del Principado de Asturias. Nat. Cantab. 2021, 76, 1–138. [Google Scholar]
  95. Ramírez Rodríguez, R.; Bañuelos Martínez, M.J.; Cires Rodríguez, E.; Álvarez Arbesú, R.L.; Valderrábano Luque, J.; García Manteca, P.; González Rodríguez, G.; Marquínez García, J.L.; Fernández Prieto, J.A. Hábitats terrestres de interés comunitario y prioritarios presentes en el Principado de Asturias. Nat. Cantab. 2021, 9, 139–219. [Google Scholar]
  96. FJDCC. Fondo para la Defensa Jurídica de la Cordillera Cantábrica. Available online: https://fdjcc.org/ (accessed on 4 July 2023).
  97. R Software A Language and Environment for Statistical Computing. R Foundation for Statistical Computing. Available online: https://www.r-project.org/ (accessed on 14 October 2023).
  98. Fox, J.; Bouchet-Valat, M.; Andronic, L.; Ash, M.; Boye, T.; Calza, S.; Chang, A.; Grosjean, P.; Heiberger, R.; Pour, K.K.; et al. Package “Rcmdr”; R Project: Vienna, Austria, 2020. [Google Scholar]
  99. Lim, D.Y.H.; Starnes, T.; Plumptre, A.J. Global Priorities for Biodiversity Conservation in the United Kingdom. Biol. Conserv. 2023, 277, 109798. [Google Scholar] [CrossRef]
  100. Gibson, L.; Wilman, E.N.; Laurance, W.F. How Green Is ‘Green’ Energy? Trends Ecol. Evol. 2017, 32, 922–935. [Google Scholar] [CrossRef] [PubMed]
  101. Swift, T.L.; Hannon, S.J. Critical Thresholds Associated with Habitat Loss: A Review of the Concepts, Evidence, and Applications. Biol. Rev. 2010, 85, 35–53. [Google Scholar] [CrossRef] [PubMed]
  102. Templeton, A.R.; Shaw, K.; Routman, E.; Davis, S.K. The Genetic Consequences of Habitat Fragmentation. Ann. Mo. Bot. Gard. 1990, 77, 13–27. [Google Scholar] [CrossRef]
  103. Yang, Y.; Wang, Z.; Li, B.; Guan, J. The Impact of Photovoltaic Projects on Ecological Corridors through the Least-Cost Path Model. Glob. Ecol. Conserv. 2023, 42, e02381. [Google Scholar] [CrossRef]
  104. Ramil Rego, P.; Santamarina, J.; Muñoz Benito, L.; San Martín Segura, D.; Rodriguez Guitián, M.A.; Ferreiro da Costa, J.; Gómez Orellana, L.; López Castro, H.; Oreiro Rey, C. Informe Sobre La Viabilidad de Las Instalaciones Eólicas, Fotovoltaicas y Termo Solares, Incluida La Repotenciación e Infraestructuras Asociadas En Los Territorios Declarados Reservas de Biosfera En España; Concejo Científico Del Comité Español de Programa M & B: Madrid, Spain, 2022. [Google Scholar]
  105. Chico, G.; Clutterbuck, B.; Lindsay, R.; Midgley, N.; Labadz, J. Identification and Classification of Unmapped Blanket Bogs in the Cordillera Cantábrica, Northern Spain. Mires Peat 2019, 24, 1–12. [Google Scholar] [CrossRef]
  106. Parish, F.; Sirin, A.A.; Charman, D.; Joosten, H.; Minaeva, T.Y.; Silvius, M. Assessment on Peatlands, Biodiversity and Climate Change; Wetlands International: Ede, The Netherlands, 2008. [Google Scholar]
  107. Smith, J.; Nayak, D.R.; Smith, P. Wind Farms on Undegraded Peatlands Are Unlikely to Reduce Future Carbon Emissions. Energy Policy 2014, 66, 585–591. [Google Scholar] [CrossRef]
  108. Chico, G.; Clewer, T.; Midgley, N.G.; Gallego-Anex, P.; Ramil-Rego, P.; Ferreiro, J.; Whayman, E.; Goeckeritz, S.; Stanton, T. The Extent of Windfarm Infrastructures on Recognised European Blanket Bogs. Sci. Rep. 2023, 13, 3919. [Google Scholar] [CrossRef]
  109. Heras, P.; Infante, M. La Turbera Cobertor Del Zalama (Burgos—Vizcaya): Un Enclave Único En Riesgo de Desaparición. Estud. Mus. Cienc. Nat. Alava 2004, 18–19, 49–57. [Google Scholar]
  110. Valera, F.; Bolonio, L.; Calle, A.L.; Moreno, E. Deployment of Solar Energy at the Expense of Conservation Sensitive Areas Precludes Its Classification as an Environmentally Sustainable Activity. Estud. Mus. Cienc. Nat. Álava 2022, 18, 2330. [Google Scholar] [CrossRef]
  111. Durá-Alemañ, C.J.; Moleón, M.; Pérez-García, J.M.; Serrano, D.; Sánchez-Zapata, J.A. Climate Change and Energy Crisis Drive an Unprecedented EU Environmental Law Regression. Conserv. Lett. 2023, 16, e12958. [Google Scholar] [CrossRef]
  112. Jefatura del Estado. Ley 7/2021, de 20 de Mayo, de Cambio Climático y Transición Energética; Jefatura del Estado: Madrid, Spain, 2021. [Google Scholar]
  113. Jager, H.I.; Efroymson, R.A.; McManamay, R.A. Renewable Energy and Biological Conservation in a Changing World. Biol. Conserv. 2021, 263, 109354. [Google Scholar] [CrossRef]
Figure 1. Study area in Europe and in the Iberian Peninsula (a total of 1107 UTM grids of 10 × 10 km were studied).
Land 12 02003 g001
Figure 2. (a) Number of wind turbines active, approved and in processing within the Natura 2000 network. Interactive graphic available at the following link: https://public.flourish.studio/visualisation/15268736/ (accessed on 12 September 2020) (b) Number of wind turbines approved and in processing in the Natura 2000 network (NN) and in a buffer of 1 km. Interactive graphic available at the following link: https://public.flourish.studio/visualisation/15268670/ (accessed on 12 September 2020).
Land 12 02003 g002
Figure 3. Histogram of the VIPAs values obtained. VIPAs: Very important plant areas.
Land 12 02003 g003
Figure 4. (a) Very important plant areas (VIPAs) calculated using maximum threat and protection values for vascular plants, bryophytes, and habitats, along with rarity and endemicity parameters. (b) VIPAs calculated using threat values for vascular plants, bryophytes, and habitats, along with rarity and endemicity parameters. (c) VIPAs determined exclusively based on the protection values of vascular plants, bryophytes, and habitats.
Land 12 02003 g004
Figure 5. (a) Violin diagram representing the spatial association between wind turbines in different legal processing statuses (dismissed, not authorized; approved; in processing or active) and very important plant areas (VIPAs). Interactive graphic available at the following link: https://public.flourish.studio/visualisation/15539056/ (accessed on 29 October 2023). (b) Violin diagram representing the spatial association between wind turbines in different processing statuses and threat values of the studied grids. Interactive graphic available at the following link: https://public.flourish.studio/visualisation/15539005/ (accessed on 29 October 2023). (c) Violin diagram representing the spatial association between wind turbines in different processing statuses and protected values of the studied grids. Interactive graphic available at the following link: https://public.flourish.studio/visualisation/15538914/ (accessed on 29 October 2023). (d) Violin diagram representing the spatial association between wind turbines in different processing statuses and maximum habitat values of the studied grids. Interactive graphic available at the following link: https://public.flourish.studio/visualisation/15539027/ (accessed on 29 October 2023).
Land 12 02003 g005
Table 1. Categorization assignment for each level based on protection or threat lists, rarity, and endemicity criteria. C.D.: council directive. R.D.: Real Decreto. CEEA: Spanish Catalogue of Protected Species; LESRPE: list of wild species under special protection regime. Priority species are marked with *.
9 (Very High)6 (High)1 (Medium High)
Legal Protection CategoryEurope
(C.D. 92/43/CEE)
Annex II *Annex IIAnnex V
Annex IV
Spain
(R.D. 139/2011)
Endangered (CEEA)Vulnerable (CEEA)LERSPE
Asturias
(Decreto 65/1995)
EndangeredSensitive to Habitat Alteration and VulnerableSpecial Interest
Cantabria
(Decreto 120/2008)
EndangeredVulnerable-
Galicia
(Decreto 88/2007)
EndangeredVulnerable-
Castilla y León
(Ley 4/2015)
Endangered VulnerablePriority attention and Regulated use
Threat CategoryIUCNCritically EndangeredEndangered Vulnerable
RarityExtremely rareVery rareRare
EndemicityCantabrian MountainsCantabrian Mountains + PyreneesIberian Peninsula
Table 2. List of species listed under the critically endangered (CR) IUCN threat category, their protection categories, and their area of endemicity. VP: Vascular plants, Bryo: Bryophytic flora. Protection categories: EN: Endangered, VU: Vulnerable, PAt: Preferential attention. CEEA: Spanish Catalogue of Protected Species; LESRPE: List of wild species under special protection regime. CYL: Castilla y León.
Taxon NameEndemicityEuropean
Directive 92/43/CEE
Spanish
Royal Decree 139/2011
Regional
Protection
Taxonomic Group
Geranium dolomiticum Rothm.Iberian Peninsula EN (CyL)VP
Gyrocaryum oppositifolium ValdésIberian Peninsula EN (CyL)VP
Hibiscus palustris L. EN (Cantabria)VP
Hydrocharis morsus-ranae L. CEEA-ENEN (Galicia)VP
Eleocharis mamillata subsp. austriaca (Hayek) Strandh. VP
Quercus pauciradiata Penas et al.Cantabrian range PAt (CyL)VP
Ranunculus montserratii GrauCantabrian range PAt (CyL)VP
Santolina melidensis (Rodr.Oubiña and S.Ortiz) Rodr.Oubiña & S.OrtizIberian Peninsula EN (Galicia)VP
Silene marizii Samp.Iberian Peninsula VU (Galicia)VP
Iris boissieri Henriq.Iberian PeninsulaAnexo IVLESRPEEN (CyL)VP
Orchis spitzelii Saut. ex W.D.J.Koch VP
Tragopogon pseudocastellanus Blanca and C.Díaz VP
Breutelia chrysocoma Lindberg Bryo
Gymnomitrion crenulatum Gottsche ex Carrington Bryo
Jungermannia handelii (Schiffner) Amak. LESRPE Bryo
Neoorthocaulis binsteadii (Kaal.) L. Söderstr., De Roo and Hedd. VU (Galicia)Bryo
Orthotrichum patens Bruch and Bridel Bryo
Polytrichastrum longisetum G.L.Smith Bryo
Radula holtii Spruce VU (Galicia)Bryo
Zygodon stirtonii Schimp. Bryo
Table 3. Correlation coefficient (tau), z-value, and p-value obtained as the outcomes of the correlation analysis between the protection and threat values of vascular flora species at each level of protection. ** Significance level of p < 0.01. * Significance level of p < 0.05.
VariableCorrelation Coefficient (tau)z-Valuep-Value
Maximum protection0.12801614.0740.00005405 **
European protection−0.06356556−1.8930.05839 *
Spanish protection0.06953872.0370.04167 **
Regional protection0.18888425.9073.485 × 10−9 **
Asturias protection0.20754772.7880.005311 **
Cantabria protection0.15879651.3010.1932
CyL protection0.529993212.840<2.2 × 10⁻¹⁶ **
Galicia protection0.074412190.9740.3302
Disclaimer/Publisher’s Note: The statements, opinions and data contained in all publications are solely those of the individual author(s) and contributor(s) and not of MDPI and/or the editor(s). MDPI and/or the editor(s) disclaim responsibility for any injury to people or property resulting from any ideas, methods, instructions or products referred to in the content.

