Abstract
Understanding soil organic carbon (SOC) at the aggregate level is crucial for soil health in secondary-salinized greenhouse development. Nevertheless, the specific patterns and contributions of ion content and microbial communities on SOC density fractions at the aggregate level remain unclear in secondary-salinized soil. We investigated variations in salts [electrical conductivity (EC) and ions] and microbial communities across various aggregate classes in both a 16-year-use greenhouse and open-field soils. We also examined SOC density fractions, including the light fraction (LF), the heavy fraction of particulate organic matter (POM), and mineral-associated organic matter (MOM) across different aggregates. The findings revealed that a lower Ca2+/K+ along with elevated EC levels (average 2.49 mS cm−1) reduced the macroaggregate percentage in greenhouse compared to open-field conditions, with a lower EC of 0.58 mS cm−1. Bacterial diversity and community composition exhibited no variation across different aggregate sizes at both sites. Conversely, fungal diversity and relative abundance (primarily dominated by Ascomycota of 78.50%) substantially increased in microaggregates (<0.25 mm) compared to macroaggregates (>0.25 mm). Macroaggregates exhibited a higher proportion of LF and MOM (3.3–18.2%, 24.9–34.5%, and 2.9–4.0% for LF, MOM, and POM, respectively) than microaggregates. Correlation and redundancy analyses revealed that fungal diversity, particularly the relative abundance of Ascomycota in aggregates < 0.25 mm, significantly and positively influenced (p < 0.05) the proportion of MOM carbon in terms of the overall SOC (J-type). This study provides valuable insights into the distribution patterns of SOC within the secondary salt-affected soils.
1. Introduction
The total greenhouse cultivation area expanded to 3.86 million ha in China in 2014, representing approximately 85% of the global production area [1,2]. Secondary salinization is a common issue associated with intensive greenhouse management [3]. This salinization adversely affects soil quality, increases greenhouse gas emissions (CO2, N2O), and depletes existing carbon reservoirs [4,5,6]. Therefore, understanding the mechanisms of SOC sequestration is important for effective management of degraded saline soil ecosystems.
Soil aggregate stability plays a crucial role in soil organic carbon (SOC) cycling [7]. The breakdown of these aggregates results in SOC release due to diminished physical protection in arable land [8]. The depletion of SOC stocks is predominantly attributed to reduced water-stable aggregate stability and its capability to safeguard SOC associated with aggregates [9]. In laboratory-incubated saline soils, SOC exhibits a notable sensitivity to varying salinity levels, with CO2 emissions peaking when EC is below 0.86 dS m−1 [10]. Although the effects of aggregation on SOC storage have been extensively studied in agricultural soils [8,11], research on SOC density fractions within aggregates of varying sizes in salt-affected greenhouse soils remains limited.
Salt contents and ion types regulate soil aggregate stability, thereby influencing the preservation of aggregate-associated SOC. Increased salt content has been observed to deteriorate aggregate structures in diverse salt-affected regions worldwide, including the Songnen Plain meadows and sorghum fields in Northeast China [12], the Prairie Great Plains in central and western Canada, and the northern United States [13], approximately 30% of the Australia’s land area [14], and in long-term greenhouse cultivation [3]. Divalent cations (Ca2+) contribute to binding clay-humic complexes during microaggregate formation [15]. Conversely, high concentrations of monovalent cations (Na+ and K+) led to a 73% reduction in macroaggregates when compared to low salt content control soil [16]. The dominant ions in greenhouse soils differ from those in agricultural field soils. Further research is necessary to understand how the distribution of soil salts within aggregates of various sizes influences SOC preservation in the greenhouse.
Soil salts within aggregates influence soil microbial communities, subsequently leading to changes in the protection of aggregate-associated SOC. Soil salinity directly affects the composition of microbial communities and plays a key role in the carbon biogeochemical cycle [17]. In arable soils, spatial heterogeneity in microbial diversity occurs across different aggregate sizes due to the influence of salt concentration on microbial growth rate and tolerance [17,18,19]. Consequently, the spatial heterogeneity of microbial communities in aggregates may also influence SOC density fractions, including free particulate organic matter (free POM), POM occluded in aggregates (occluded POM), and heavy mineral-associated soil organic matter (MOM) [8]. To date, the impact of microbes on SOC content or density fractions in various aggregate sizes has been extensively explored in different land use soils [20,21]. However, the specific pattern of microbial distribution and their influence on SOC density fractions in salt-affected greenhouses remains an unexplored topic at the soil aggregate scale.
In greenhouses, intensive agricultural practices, such as frequent tillage and the extensive application of fertilizers, accelerate salt accumulation and increase the macroaggregate turnover rate [22]. However, the specific patterns and relative contributions of ion content and microbial communities on SOC density fractions at the aggregate level remain poorly understood in greenhouse environment. We hypothesize that elevated salt levels and reduced microbial community diversity within larger aggregates lead to a decrease in the proportion of SOC density fractions within the corresponding aggregate size. Therefore, the objectives of this study were to (1) investigate the properties of soil ions and microbial communities in various aggregate sizes in greenhouse and open-field soils, and (2) evaluate the effect of ions and microbial communities in distinct aggregate sizes on SOC density fractions in their respective aggregates. The findings will offer insights into the distribution patterns of SOC density fractions across aggregate levels and enhance understanding of how salt and microbial activities regulate the SOC pool in secondary-salinized soils.
2. Materials and Methods
2.1. The Study Site
Soil samples were collected from an experimental station in Putuan County, E’zhou City, Hubei Province, China (30°24′12″ N, 114°45′3″ E). The local climate in this area is characterized by a subtropical monsoon climate, with an annual mean temperature of ~17 °C and annual mean precipitation of 1315 mm. In this study, we selected a vegetable greenhouse that has been continuously in use for 16 years and an open field. The plastic cover of the greenhouse is removed every four years in summer to allow the soil salts to be leached periodically by rainfall. The alluvial soil at the study site is developed from alluvial parent material, and the basic soil properties are listed in Table 1.

Table 1.
The basic physical and chemical properties of soil.
Crop rotations of pepper (Capsicum frutescens L.), tomato (Solanum lycopersicum L.), and purple caitai (Brassica campestris L.) are practiced in the field. The rotation alternates between pepper and tomato every four years, with tomato planting in September and harvesting in February of the following year. Subsequently, peppers are cultivated from February to June, while the greenhouse field remains fallow during July and August. In terms of fertilization, chicken manure (N-P2O5-K2O 1.63-1.54-0.85, 15 t ha−1) and rapeseed cake, a byproduct of oil extraction (N-P2O5-K2O: 3.14-1.63-0.97, 3.75 t ha−1), are applied annually in September. Additionally, compound fertilizers [(N-P2O5-K2O 15-15-15, 0.75 t ha−1) and Ca(H2PO4)2·2H2O (0.75 t ha−1)] are applied twice a year as basal fertilizers before vegetable planting in the greenhouse and open field. The total annual input of N:P:K from all fertilizer sources is about 475 kg:177 kg:229 kg. Drip irrigation is applied in the greenhouse, featuring two rows of pipelines in each bed (1 m × 7 m), whereas no irrigation is applied in the open field, relying solely on natural rainfall.
2.2. Soil Collection and Water-Stable Aggregate Determination
Soil samples were collected from three random points at depths of 0–15 and 15–30 cm, and subsequently divided into two parts. The first part of the freshly obtained soil subsample was promptly separated into aggregates of >2, 2–0.25, and <0.25 mm without adding water, and then stored at −80 °C for bacterial and fungal community analysis. A detailed procedure is shown in below Section 2.5. The second part of the subsample was air-dried, gently broken along the natural cracks, and finally passed through a 8 mm mesh sieve for further analysis of the water-stable aggregates, SOC density fractions, and salt contents in each water-stable aggregate size.
Water-stable aggregate stability was determined via the wet-sieving method in order to obtain water-stable aggregate size distribution and aggregate mean weight diameter (MWD). Briefly, 100 g of air-dried soil (<8 mm) was submerged in deionized water for 10 min, and the aggregates were separated through a series of sieves by moving the sieves up and down by 4 cm for 10 min. After wet-sieving, different aggregate sizes of >2, 2–0.25, 0.25–0.053, and <0.053 mm were obtained and oven-dried at 45 °C for 24 h, weighed, and stored. The sand content (>0.053 mm) within each aggregate size (>2 mm, 2–0.25 mm, and 0.25–0.053 mm) was determined using an aggregate subsample dispersed with sodium hexametaphosphate (5 g L−1) [11]. Finally, the mass of each aggregate size was corrected by subtracting the corresponding sand content, and MWD was calculated following Equation (1).
where r is the diameter of the ith mesh (mm), r0 = r1, rn = rn+1; mi is the mass of the aggregates remaining on the ith sieve, and n represents the number of sieves.
2.3. SOC Density Fractions in Different Water-Stable Aggregate Sizes
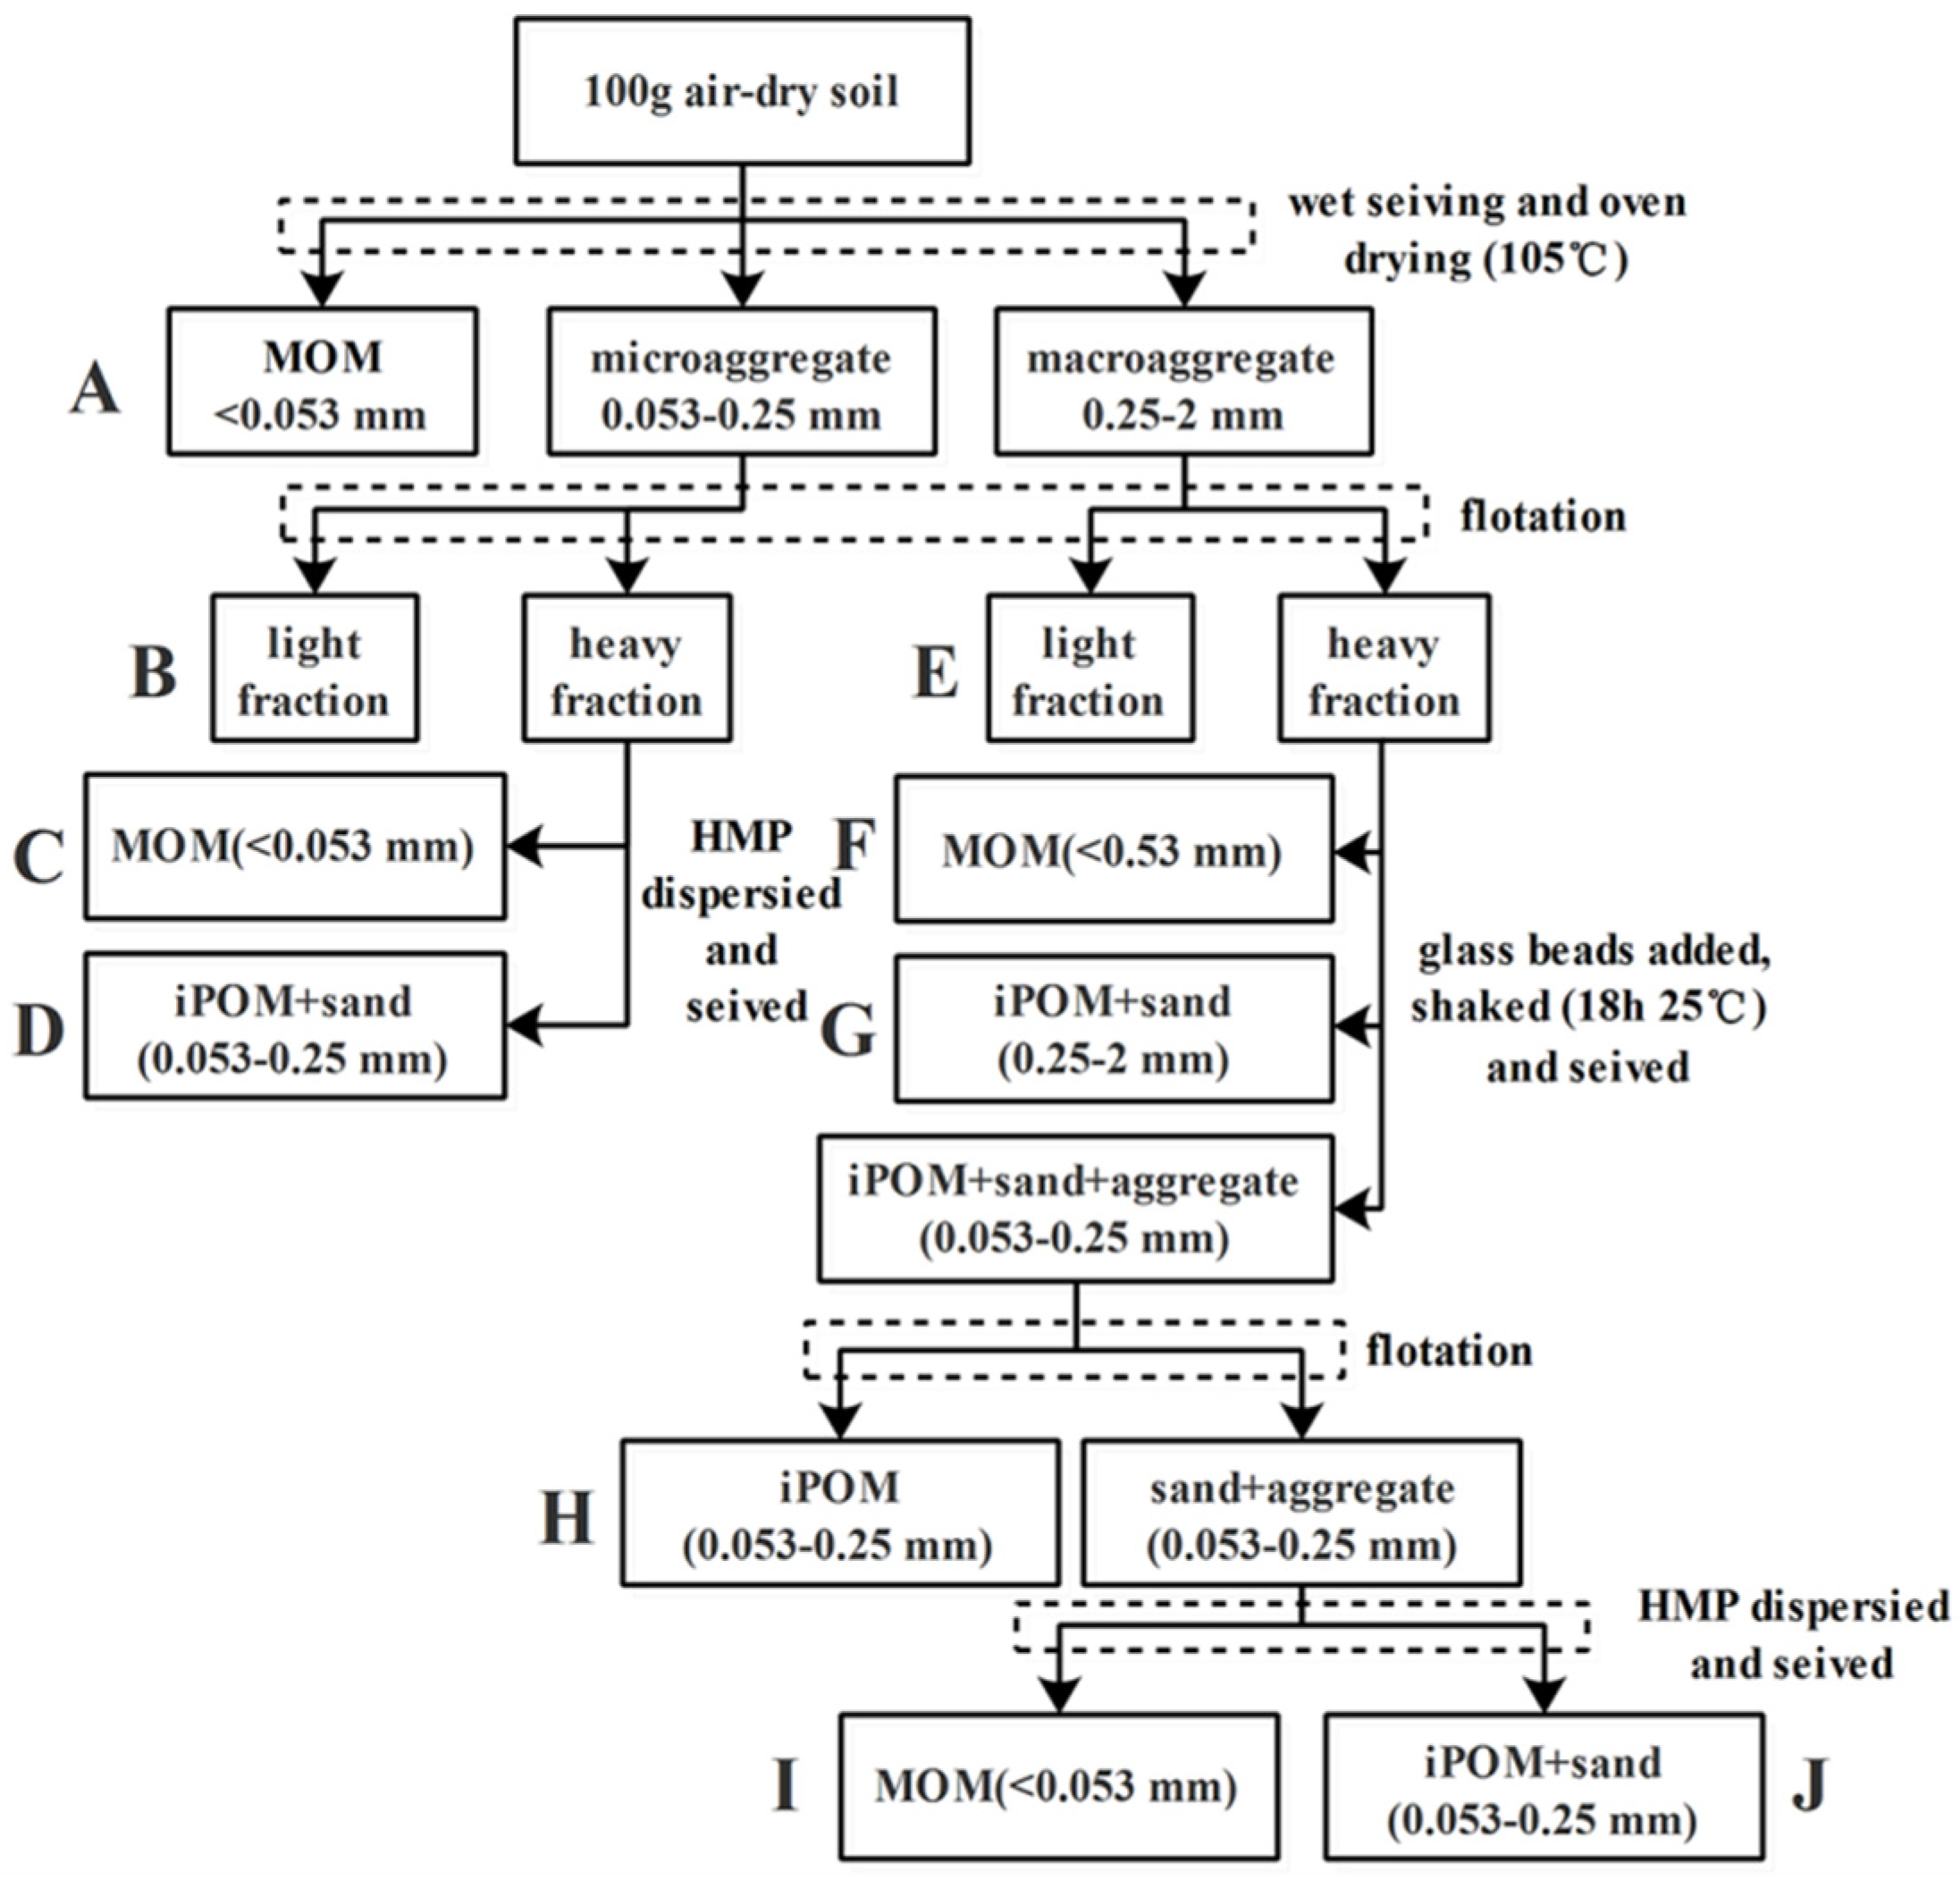
Various sizes of aggregate samples, obtained via the wet-sieving method, were used to determine SOC density fractions. The modified procedure to isolate the free light fraction (LF) and heavy fraction (HF) of soil organic matter within water-stable aggregates of different sizes is shown in Figure 1 [8]. Briefly, a 5 g aggregate subsample (2–0.25 mm and 0.25–0.053 mm) obtained through the aforementioned wet-sieving method was suspended in 25 mL of a premixed solution (1.85 g cm3 of ZnBr2 and ethanol) in 50 mL centrifuge tubes. After a 20 min equilibration period, the samples were centrifuged (2800 rpm) at 20 °C for 60 min. After centrifugation, the free LF (denoted as B and E) was separated by filtering through a 0.015 mm filter, washed with deionized water, oven-dried at 45 °C for 24 h, and weighed. HF was rinsed two rounds with 40 mL of deionized water to remove excess ZnBr2 and was then dispersed in a 0.5% hexametaphosphate solution. The dispersed HF was passed through 0.25 and 0.053 mm sieves, depending on the size of the original aggregate sample (Figure 1). After completion of separation of macroaggregates, fractions A from <0.053 mm aggregates, B, C, and D from 0.25 to 0.053 mm aggregates, and E–J from 2 to 0.25 mm aggregates were obtained, oven-dried at 45 °C, and weighed. The density fractions of all SOC were quantified using a total organic carbon analyzer (Vario TOC, Elementar, Frankfurt, Germany). It is worth noting that no aggregates >2 mm were present after water sieving; hence, the carbon content of this fraction was not determined.
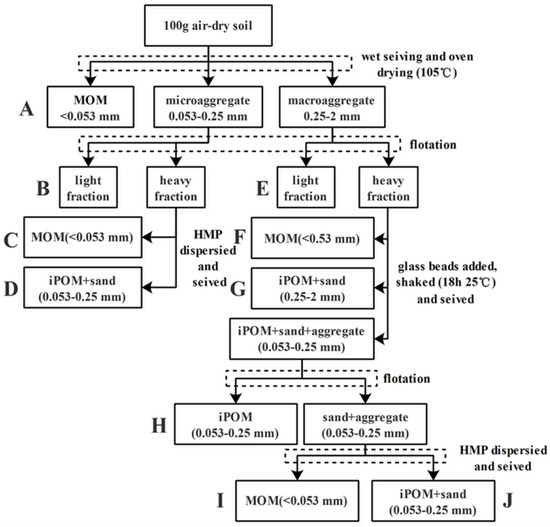
Figure 1.
Fractionation sequence of soil organic carbon modified from reference [8]. B and E represent the light fraction (LF); D, G, H, and J are particulate organic matter (POM), where D, H, and J represent 0.25–0.053 mm iPOM (occurring within aggregates) and G represents 0.25–0.053 mm iPOM; C, F, and I represent mineral-associated organic matter (MOM) in aggregates < 0.053 mm.
2.4. Soil Salt and Ion Measurements in Different Water-Stable Aggregate Sizes
The EC and ion content were determined for each water-stable aggregate size separated via the procedure mentioned in Section 2.2 above. The EC was determined in a 1:5 (w/w soil/water) suspension using a conductivity meter (Leici DDSJ-316, Shanghai, China). The cations Ca2+, Mg2+, Na+, and K+ were extracted with 1 mol L−1 ammonium acetate and analyzed using atomic absorption spectrometry (AA800, Perkin Elmer Co., Waltham, MA, USA). The NO3− from each aggregate size was extracted with 1 mol·L−1 KCl and then determined using an ultraviolet spectrophotometer at a 210 nm wavelength (A380, Aoe Instruments Co., Shanghai, China).
2.5. DNA Extraction and Sequencing for Different Soil Aggregate Sizes
Microbial DNA extraction was carried out from different sizes of soil aggregates (>2, 2–0.25, and <0.25 mm) that were separated from fresh soil in triplicates, using an OMEGA Soil DNA Kit (M5635-02) (Omega Bio-Tek, Norcross, GA, USA). We utilized fresh soils rather than air-dried ones for microbial analysis to ensure a more accurate representation of microbial activity under field soil conditions. Briefly, fresh soil subsamples were collected with field soil water content of 0.48 cm3 cm−3 at 0–15 cm and 0.40 cm3 cm−3 at 15–30 cm. These fresh subsamples were passed through sieves with mesh sizes of 2 and 0.25 mm without adding water, resulting in aggregate samples of >2, 2–0.25, and <0.25 mm. It is noteworthy that <0.053 mm aggregates were omitted due to the challenges of obtaining such small-sized soils in high soil water content. Notably, the size of the aggregate samples used for microbial analysis (>2, 2–0.25, and <0.25 mm) differed slightly from the aggregate samples designated for SOC isolation (2–0.25, 0.25–0.053, and <0.053 mm). Despite this disparity in aggregate size, the microbial property within these aggregates (>2, 2–0.25, and <0.25 mm) can provide valuable insights into explaining the distribution of SOC in density fractions within aggregate sizes as shown in Section 2.2 and Section 2.3.
The quantity and quality of DNA extracted from the samples were measured using a NanoDrop NC2000 spectrophotometer (Thermo Fisher Scientific, Waltham, MA, USA) and agarose gel electrophoresis, respectively. PCR amplification of the bacterial 16S rRNA gene V3–V4 region and the fungal internal transcribed spacer (ITS) region was performed using the 338F/806R and ITS5/ITS2 primer pairs, respectively. Bacteria and fungi raw data were analyzed using QIIME2. DADA2 was then used to filter, denoise, merge, and remove chimeric sequences. Taxonomic assignments were made for bacterial 16S rRNA and fungal ITS using amplicon sequence variants (ASVs) and referenced databases, SILV A and UNITE, respectively. Finally, all bacterial and fungal sequence data were input into the NCBI Sequence Read Archive database under the accession numbers PRJNA817055 and PRJNA818728, respectively.
2.6. Statistical Analysis
One-way ANOVA was used to assess the difference in soil salt, soil aggregate size percentage, and SOC percentage between the greenhouse and open field. Indices of α-diversity (Shannon) were calculated using the amplicon sequence variants table in QIIME2. The structural variation in the bacterial and fungal communities was evaluated using Bray–Curtis metrics and visualized using non-metric multidimensional scaling (NMDS). Redundancy analysis (RDA) was applied to determine the effects of soil properties (salts, aggregates, and microbes) on the density fraction of the carbon proportion using the CANOCO 5 software (Microcomputer Power, Inc., Ithaca, NY, USA). The significance level for all tests was set at p < 0.05.
3. Results
3.1. Soil Ions Distribution with Aggregates
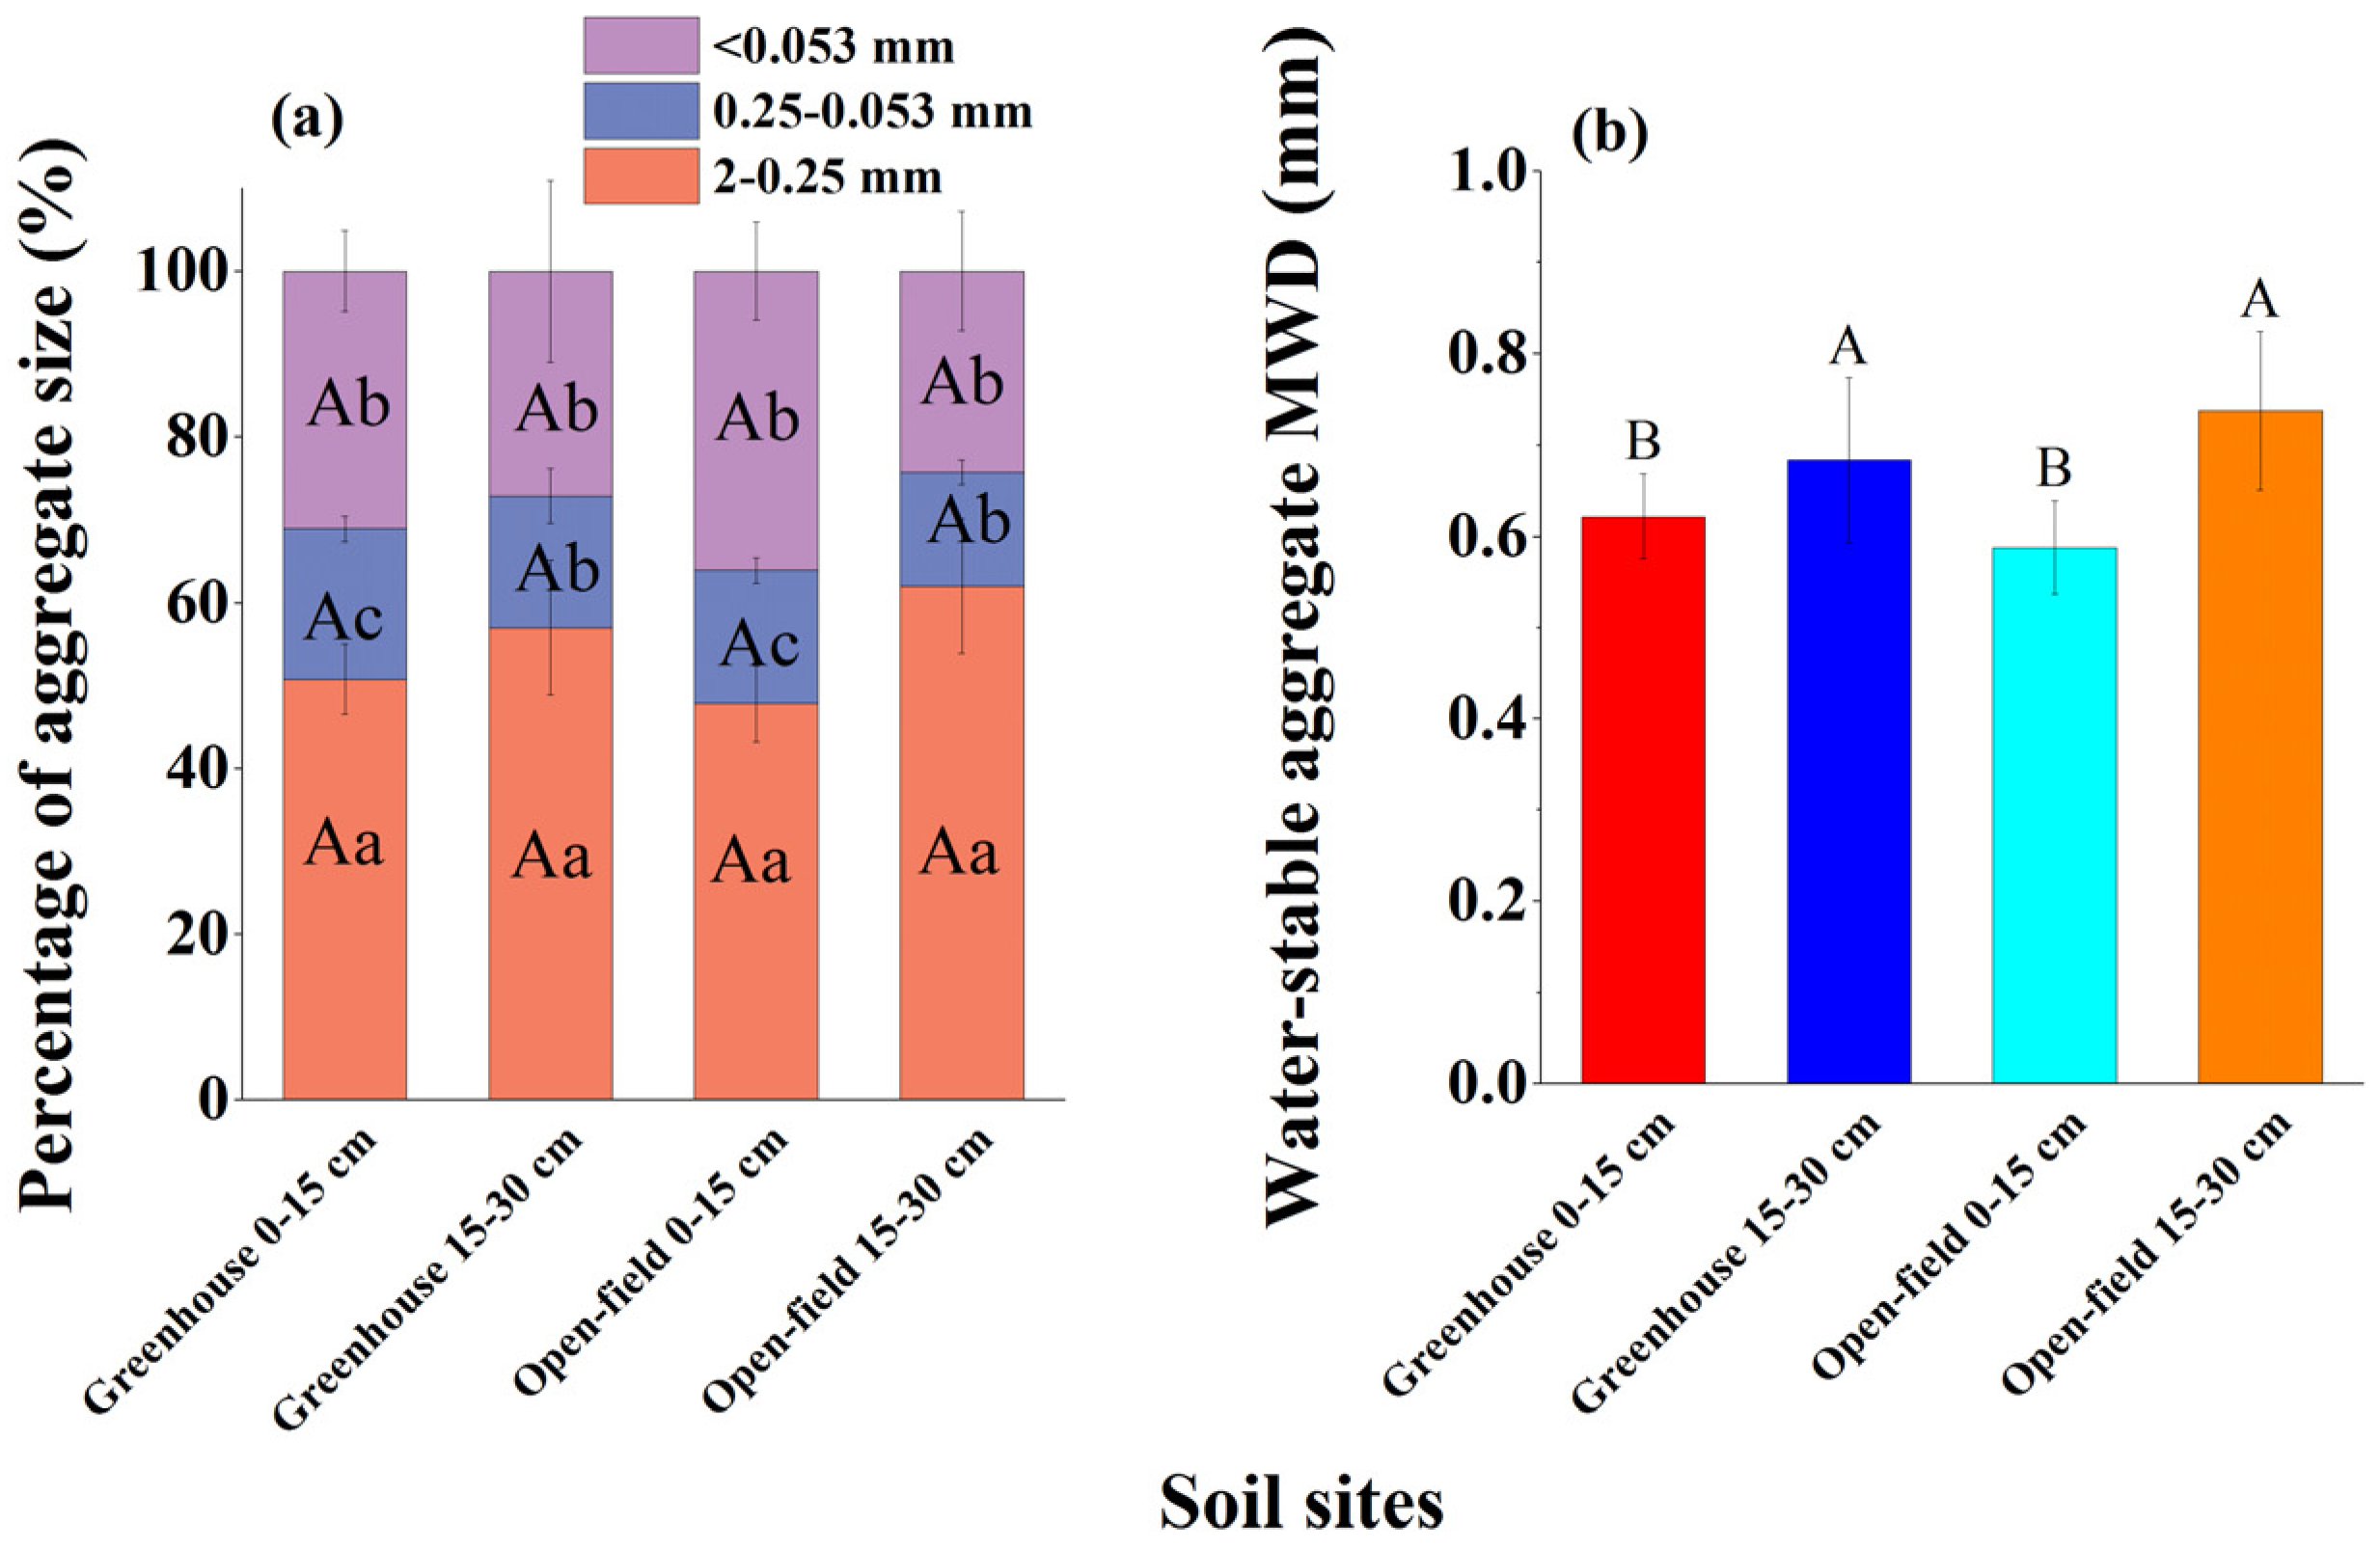
The 2–0.25 mm and 0.25–0.053 mm water-stable aggregates were slightly lower in the greenhouse than in the open-field soils, but the difference was not statistically significantly (Figure 2a). In contrast, the <0.053 mm aggregate was significantly higher in the greenhouse (average 31.5%) than in the open-field soil (average 36.6%). The >2 mm aggregates dissipated and reached zero after the wet sieving procedure was finished. Generally, this aggregate size distribution resulted in a slightly lower water-stable aggregate MWD in the greenhouse than in the open-field soil (Figure 2b).
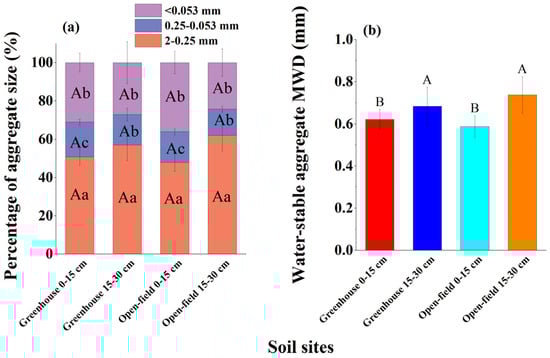
Figure 2.
Soil aggregates in greenhouse and open-field soils. (a) Percentage of aggregate size distribution; (b) aggregate MWD properties. Different capital letters indicate significant differences in aggregate percentage or MWD between study sites under the same aggregate size. Different lowercase letters indicate significant differences in aggregate size percentage at the same depth within the same site.
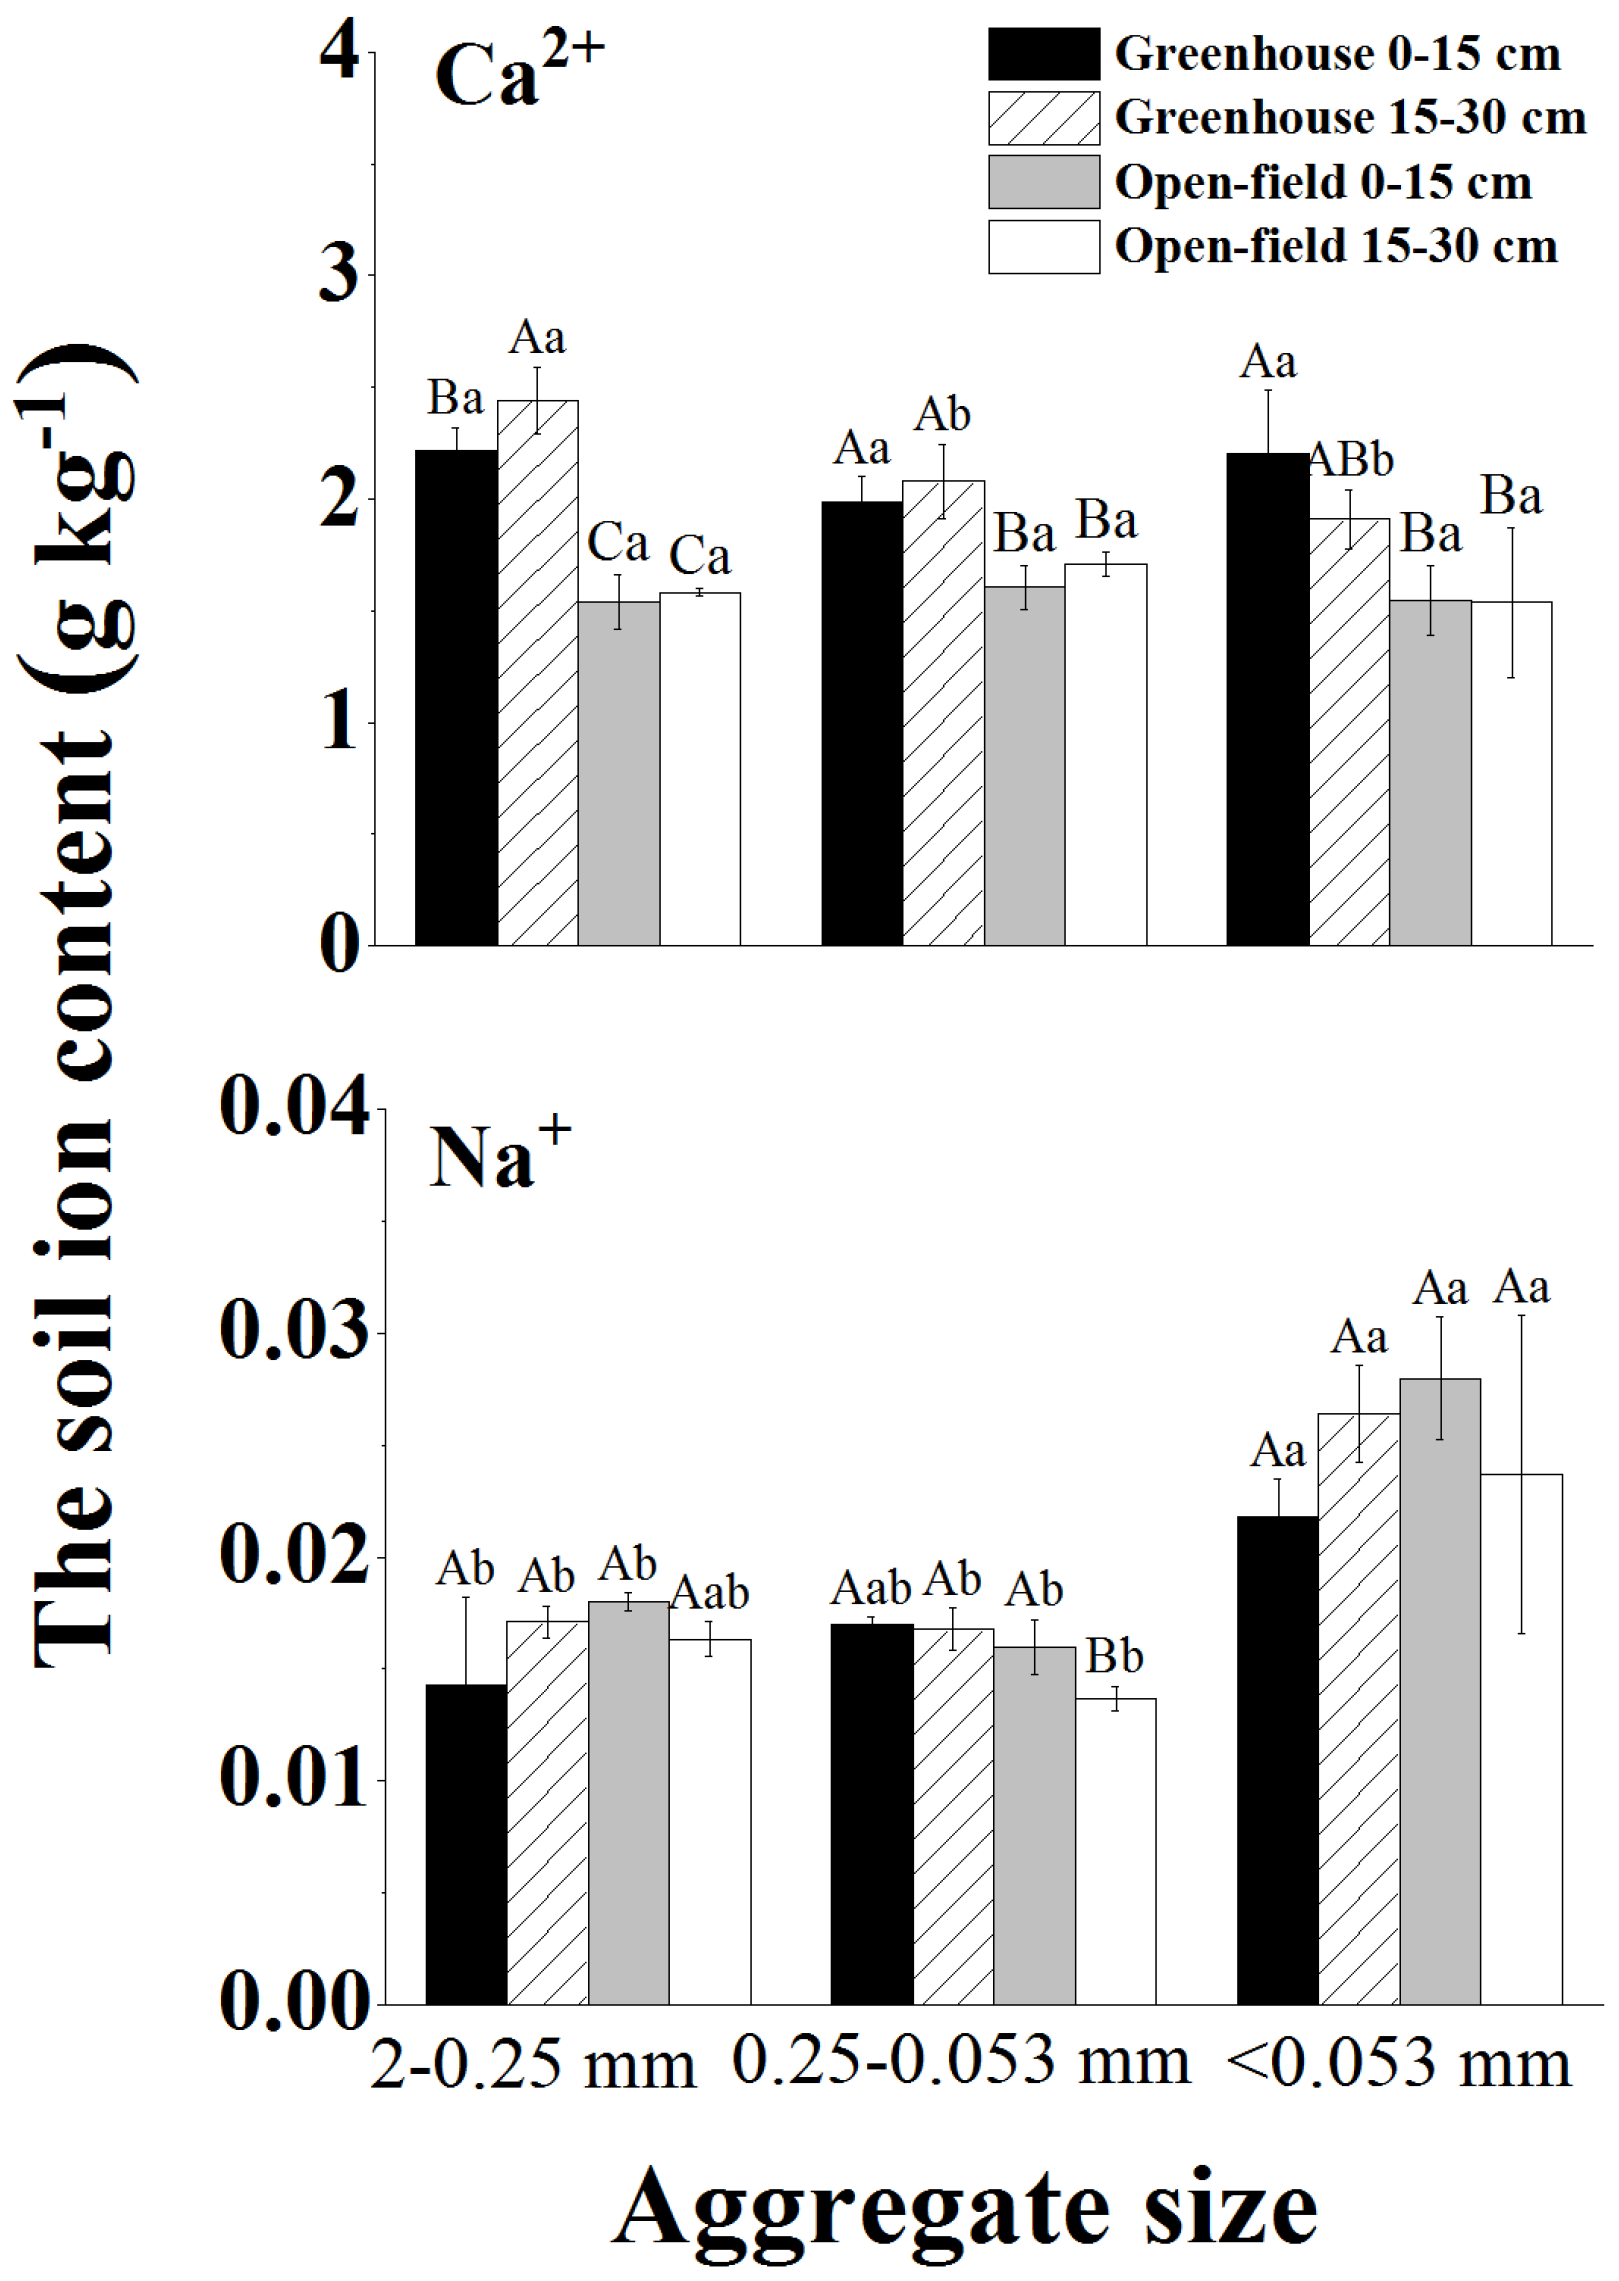
Soil EC and ion content varied between aggregate sizes. The surface average soil EC of 2.49 mS cm−1 was significantly higher in the greenhouse than that in the open field (average 0.58 mS cm−1) (Table 1). The predominant Ca2+ ions increased with decreasing aggregate size, whereas Na+ showed no significant differences in the aggregates of various sizes (Figure 3).
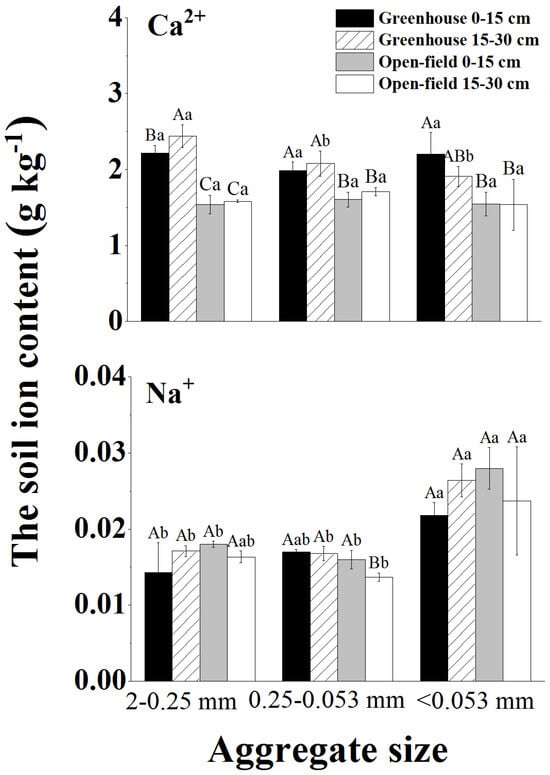
Figure 3.
Ion distribution properties (i.e., Ca2+ and Na+) in various sizes of aggregates. Different lowercase letters indicate significant differences in ion content within the same site and soil depth for different aggregate sizes, while different capital letters indicate significant differences in ion content between greenhouse and field across all soil depths for the same aggregate size.
3.2. Microbial Communities in Different Soil Aggregate Sizes
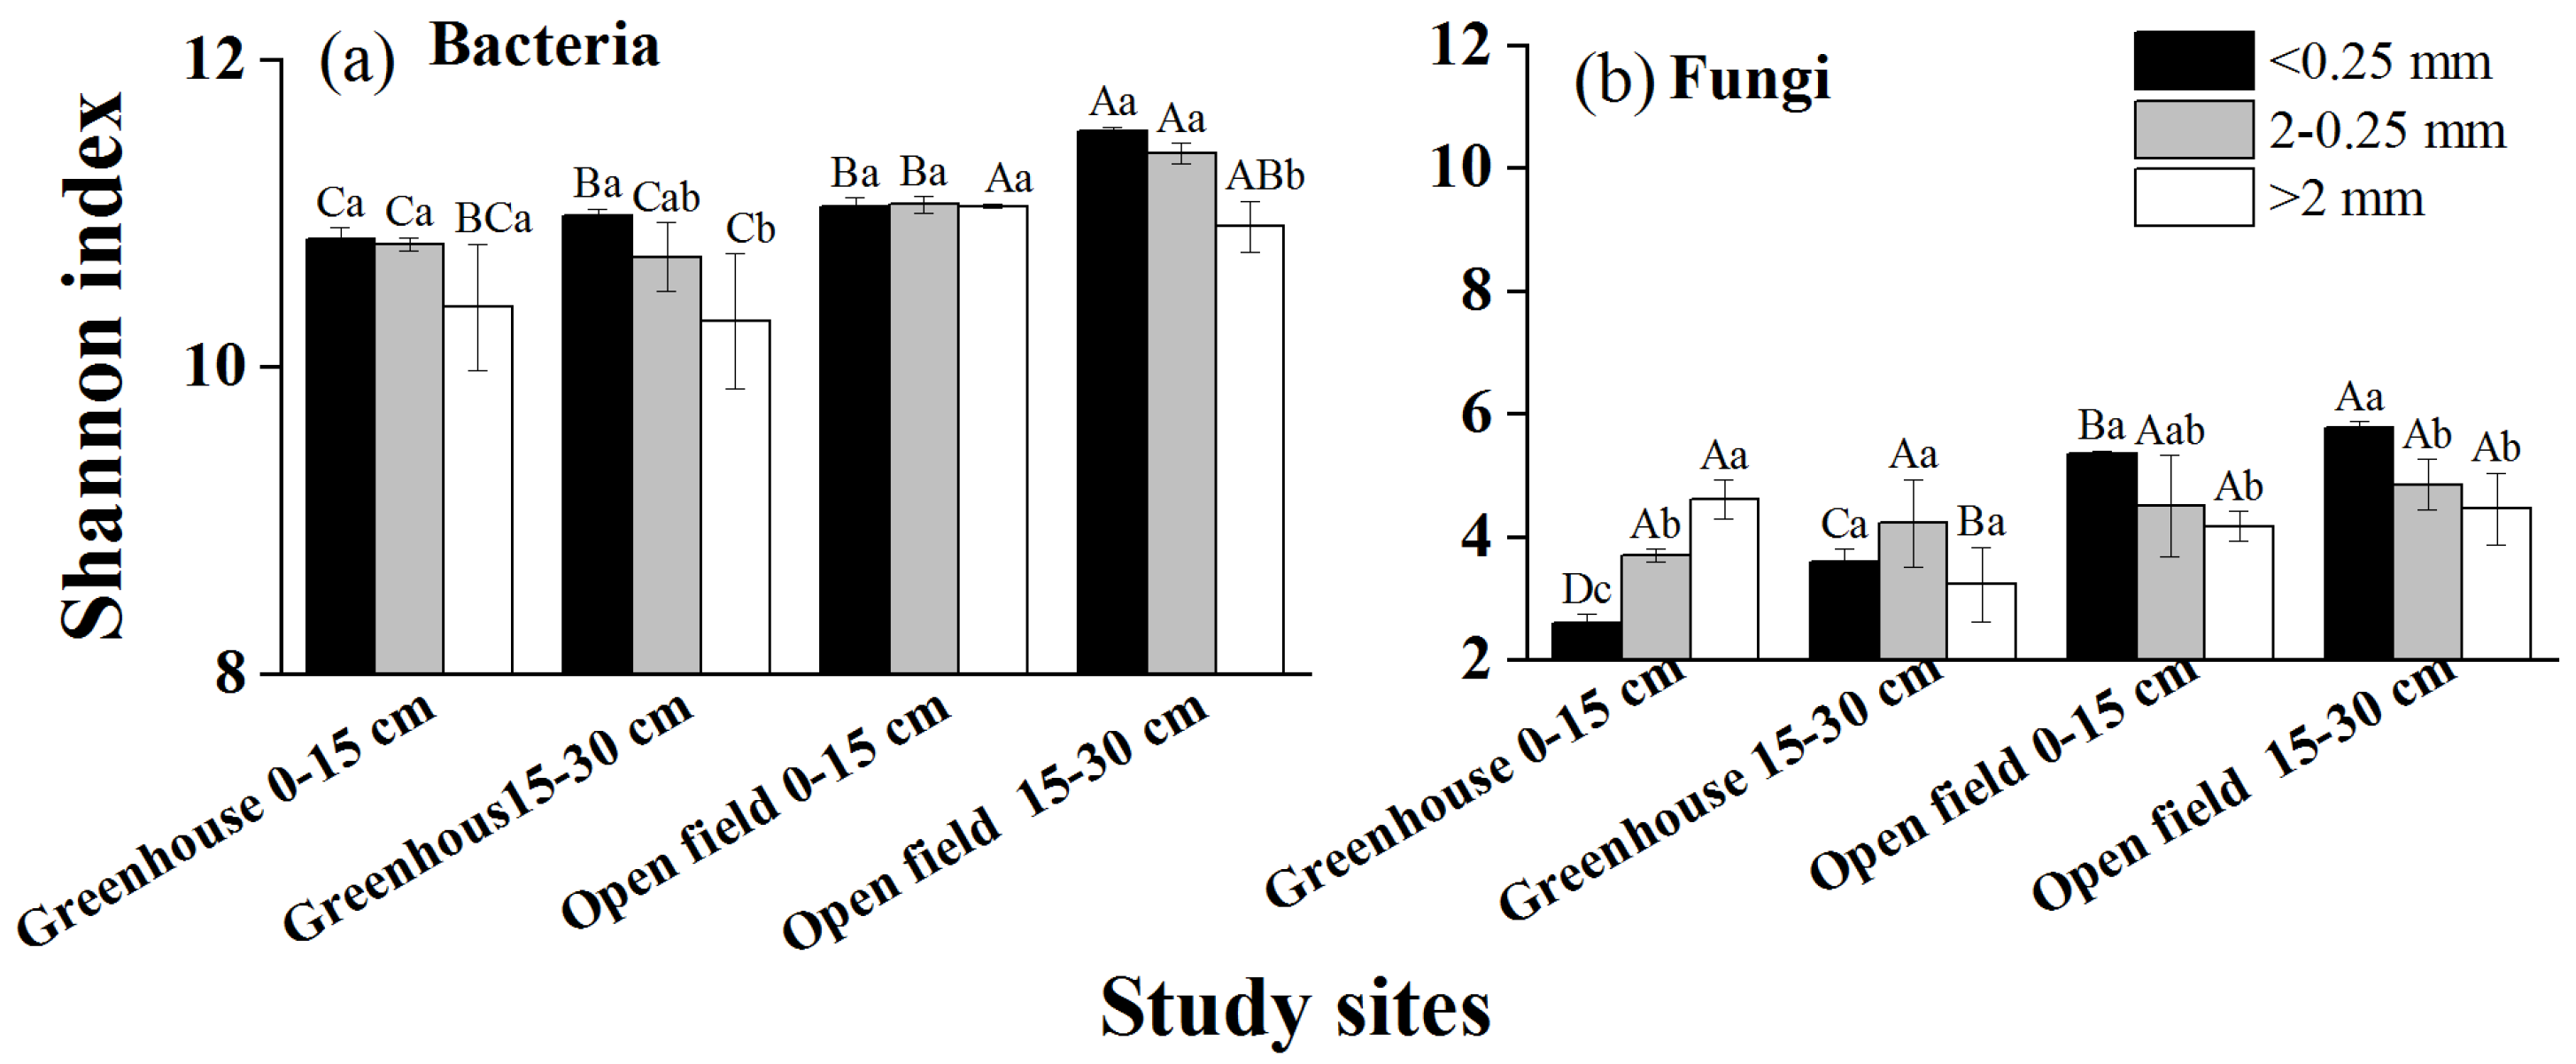
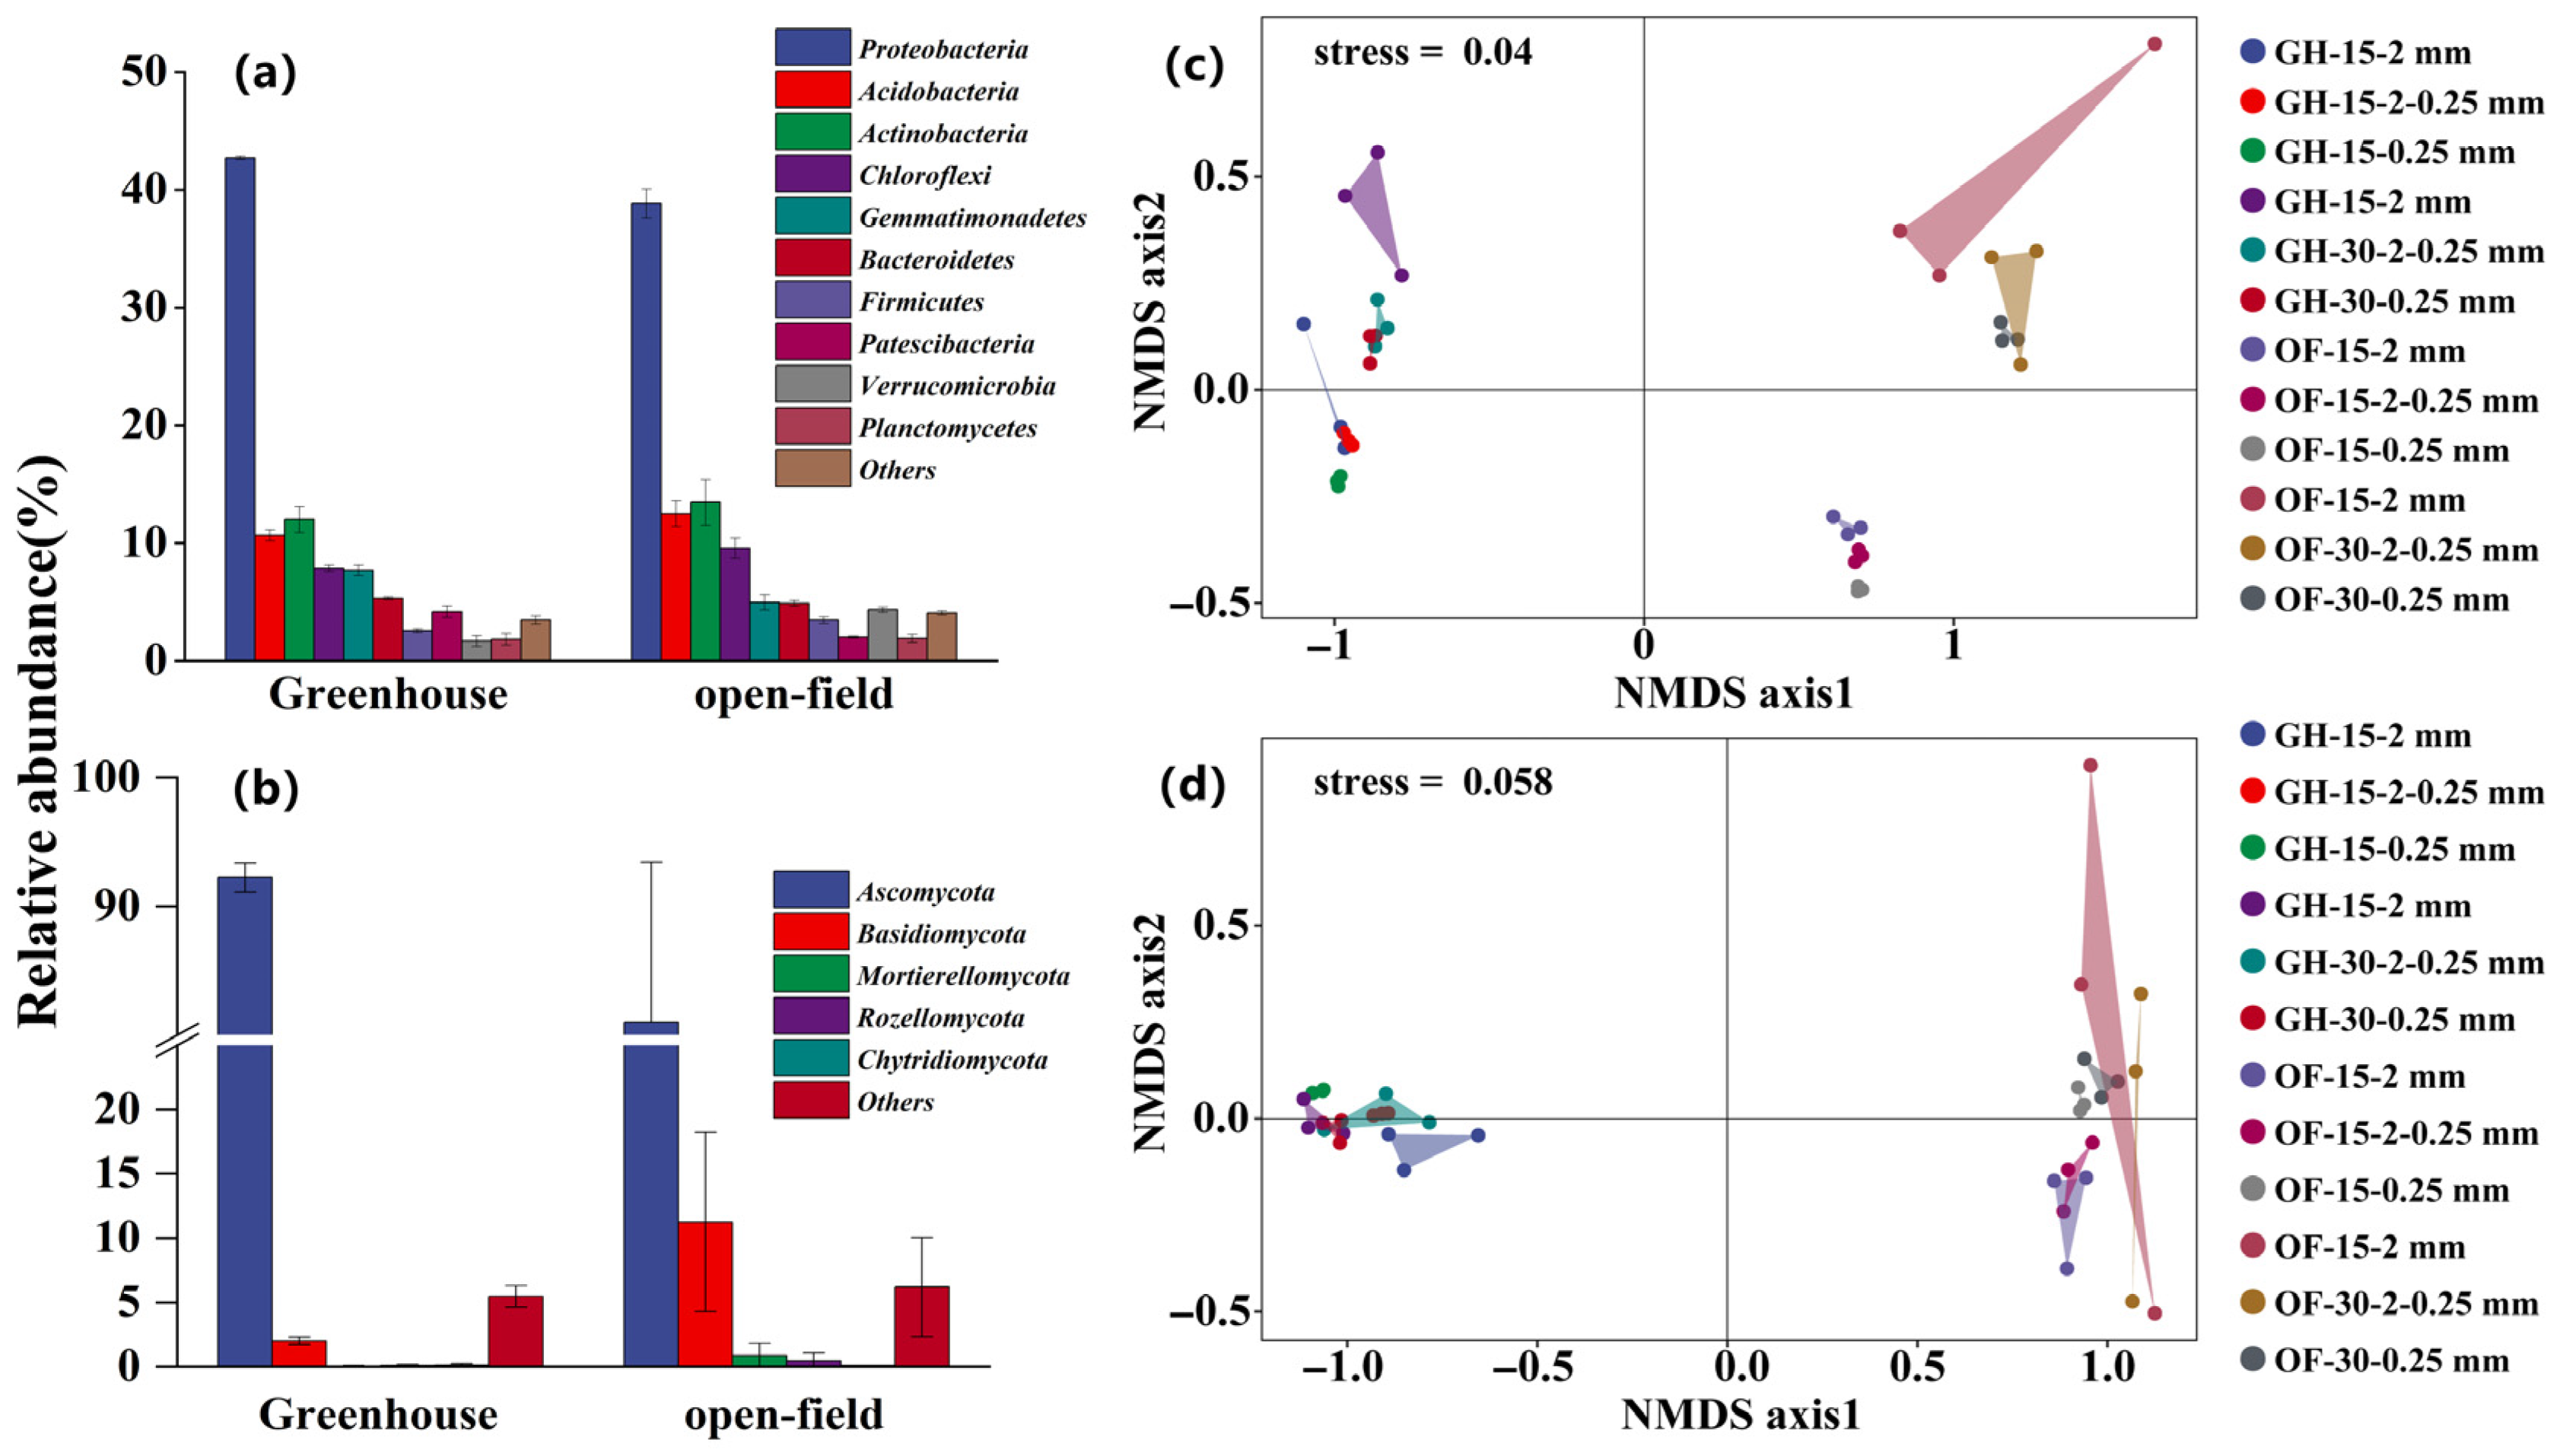
The Shannon results indicated differences in bacteria or fungi diversity between different aggregate sizes (Figure 4). Bacterial diversity and community composition exhibited no variation across different aggregate sizes at both sites (Figure 4a). Conversely, fungal diversity exhibited a substantial increase in microaggregates (<0.25 mm) compared to macroaggregates (>0.25 mm) (Figure 4b). Furthermore, the fungal community composition, primarily dominated by Ascomycota (78.50% of the total sequences), exhibited a notable difference in microaggregates (<0.25 mm) compared to macroaggregates (>0.25 mm), except for the 0–15 cm open-field soil. The NMDS results further validated the heterogeneity in fungal community composition among aggregates of different sizes (Figure 5).
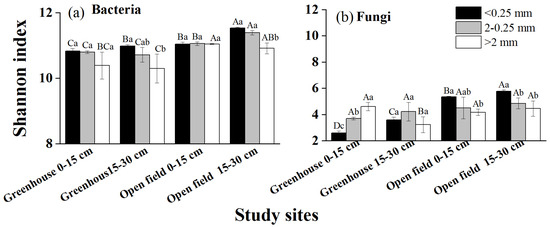
Figure 4.
Bacterial and fungal diversity across various size of aggregate in the greenhouse and open field. (a,b) The Shannon index of bacteria and fungi, respectively. Different lowercase letters indicate significant differences of the Shannon index between aggregate sizes at the same study site. Different capital letters indicate significant differences of the Shannon index between study sites at the same aggregate size.

Figure 5.
Relative soil microbe abundances and non-metric multidimensional scaling (NMDS). (a,b) Dominant bacterial and fungal taxonomic composition in 2-0.25 mm aggregate sizes in 0-15 cm soil depth; (c,d) NMDS of bacteria and fungi, respectively. Note: GH-15-2 mm: greenhouse 0–15 cm >2 mm aggregate; GH-15-2-0.25 mm: greenhouse 0–15 cm 2–0.25 mm aggregate; GH-15-0.25 mm: greenhouse 0–15 cm <0.25 mm aggregate; GH-30-2 mm: greenhouse 15–30 cm >2 mm aggregate; GH-30-2-0.25 mm: greenhouse 15–30 cm 2–0.25 mm aggregate; GH-30-0.25 mm: greenhouse 15–30 cm <0.25 mm aggregate. OF: open field.
3.3. Soil Aggregate-Associated SOC Density Fraction Distribution
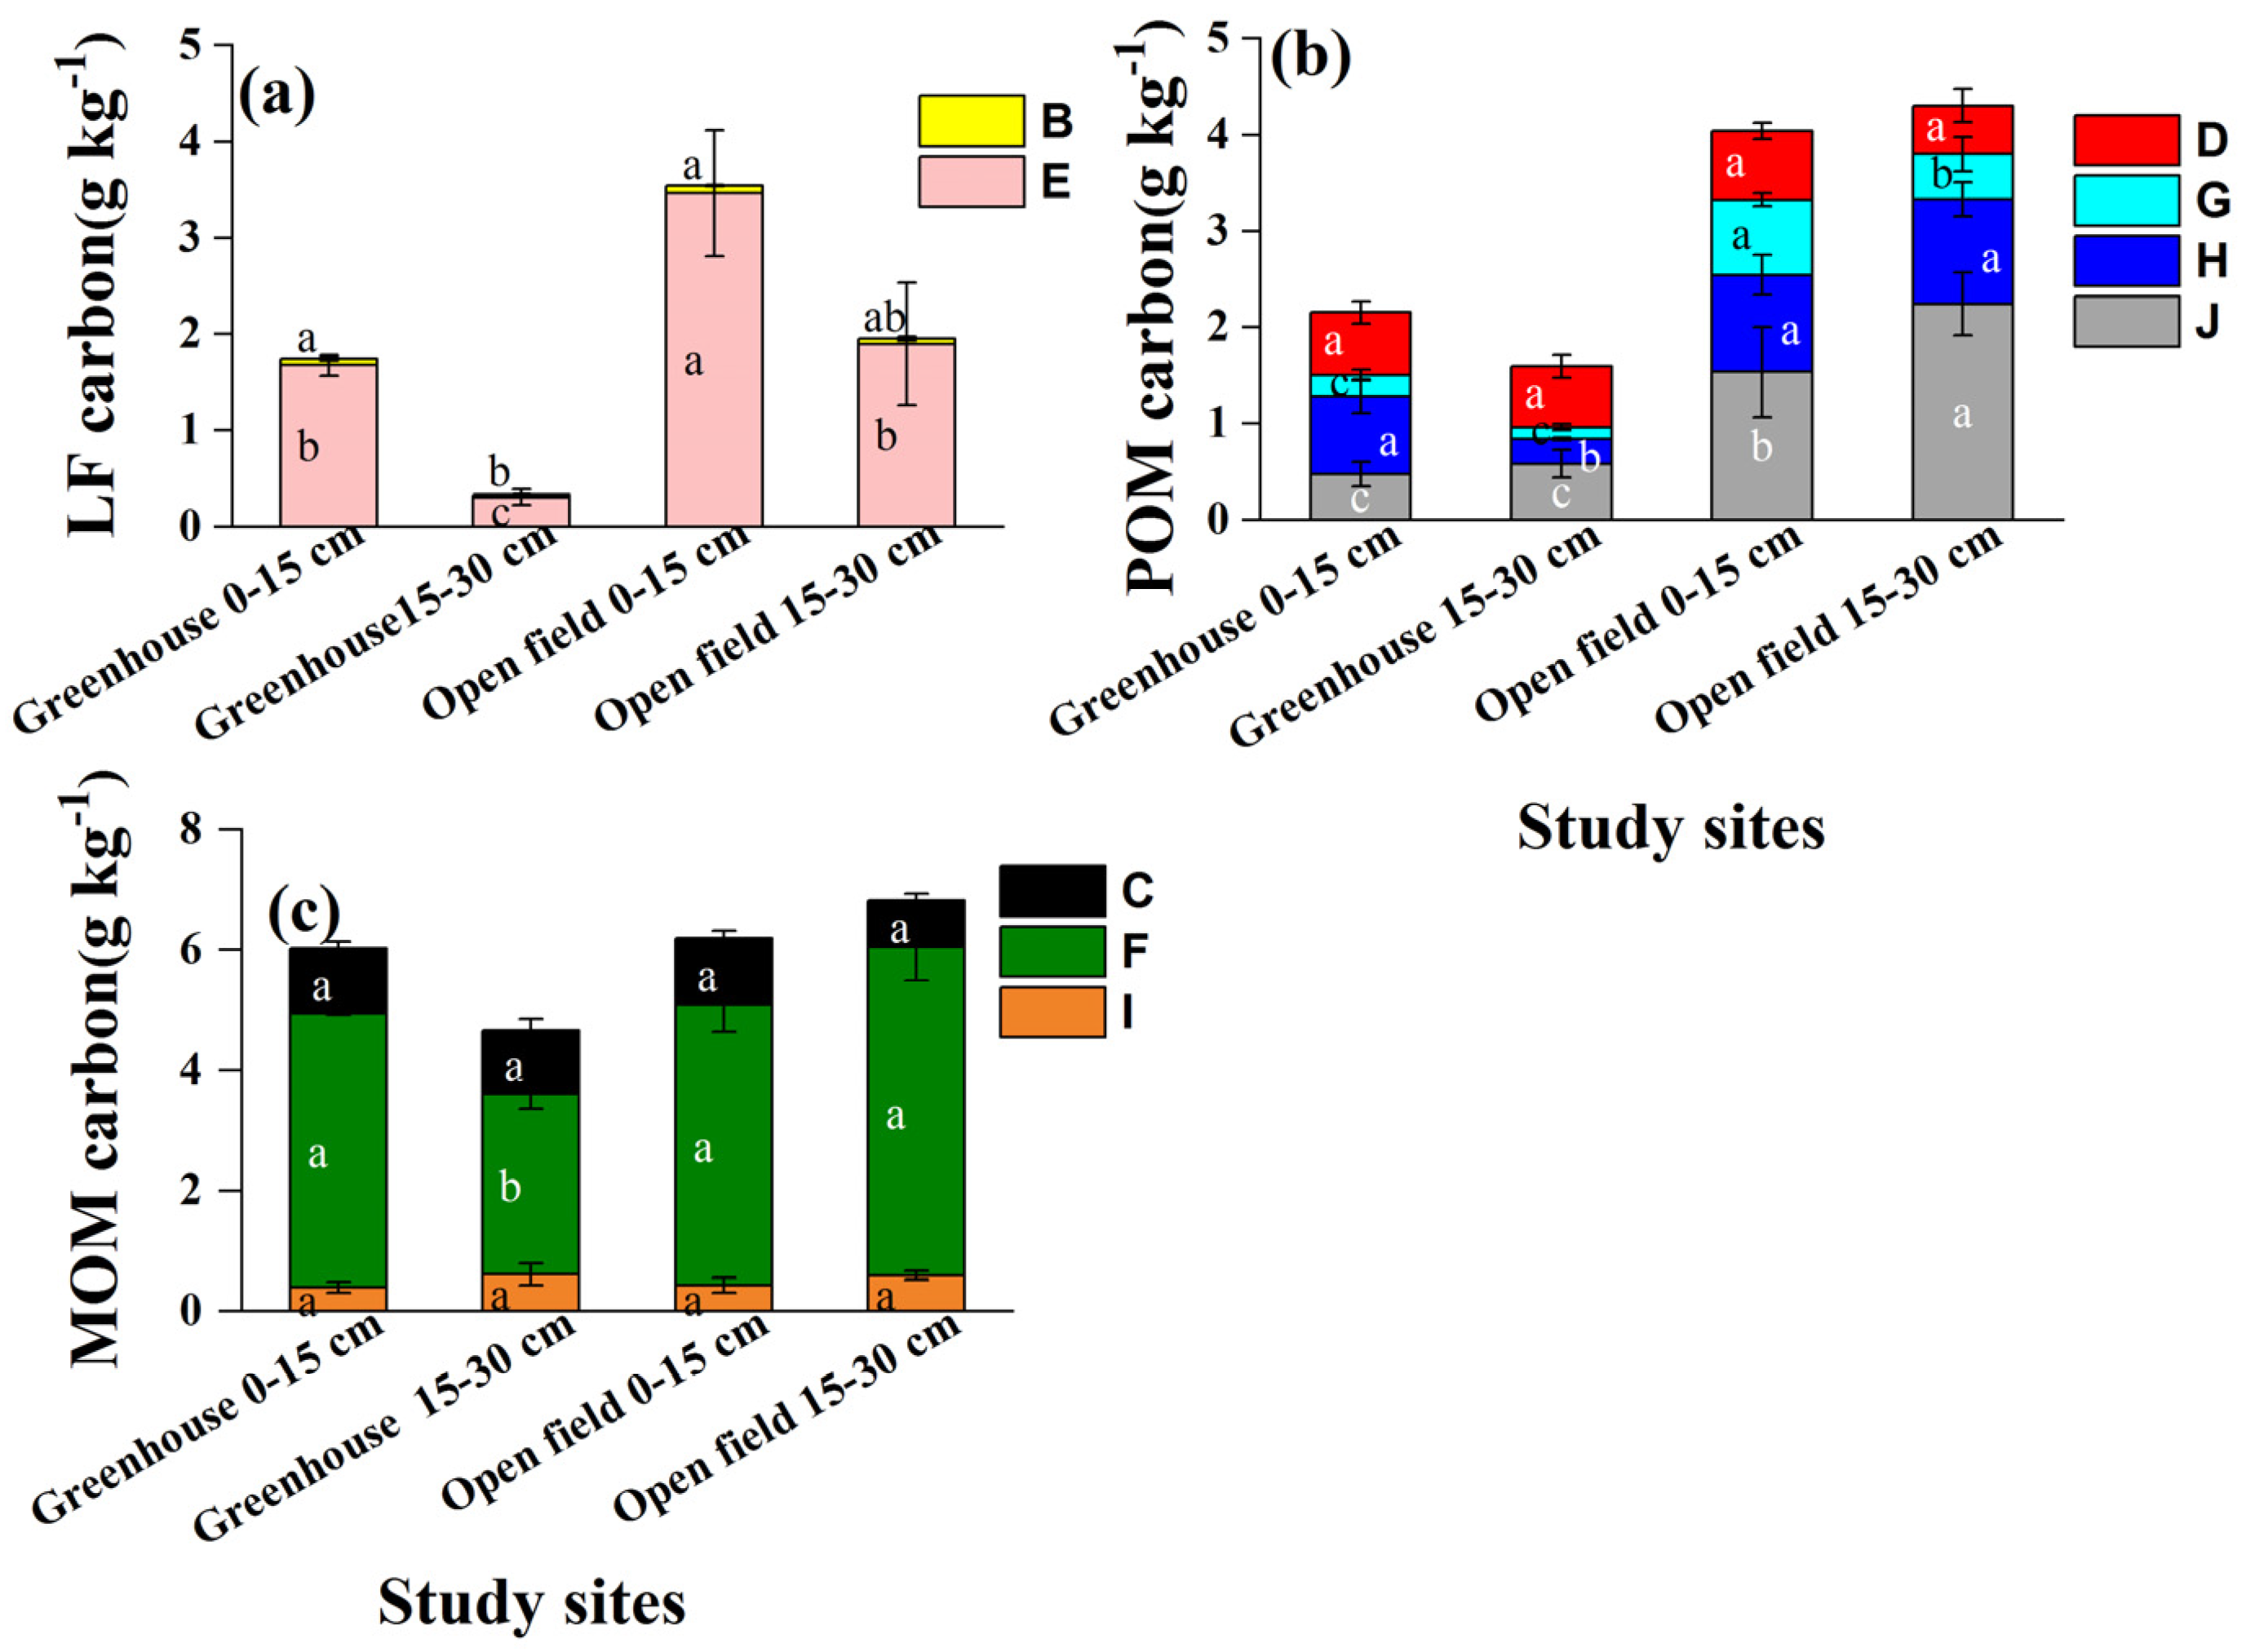
The absolute concentrations of LF, POM, and MOM carbon varied among the study sites (Figure 6). Each type of LF, POM and MOM carbon was significantly lower in greenhouse than open-field soils. For example, the LF type-E was 1.67 and 3.46 g kg−1 in greenhouse and open field soils, respectively. The POM carbon (type-J) in the 2–0.25 mm aggregate was 0.53 g kg−1 (greenhouse) and 1.89 g kg−1 (open-field) (Figure 6b).

Figure 6.
Carbon concentrations in density and size fractions separated from different aggregate sizes. (a) LF carbon properties, (b) POM carbon properties, and (c) MOM carbon properties. Different lowercase letters indicate significant differences in the same type of soil organic carbon in depths and sites. B and E represent the light fraction (LF); D, G, H, and J are particulate organic matter (POM), where D, H, and J represent 0.25–0.053 mm iPOM (occurring within aggregates) and G represents 0.25–0.053 mm iPOM; C, F, and I represent mineral-associated organic matter (MOM) in aggregates < 0.053 mm.
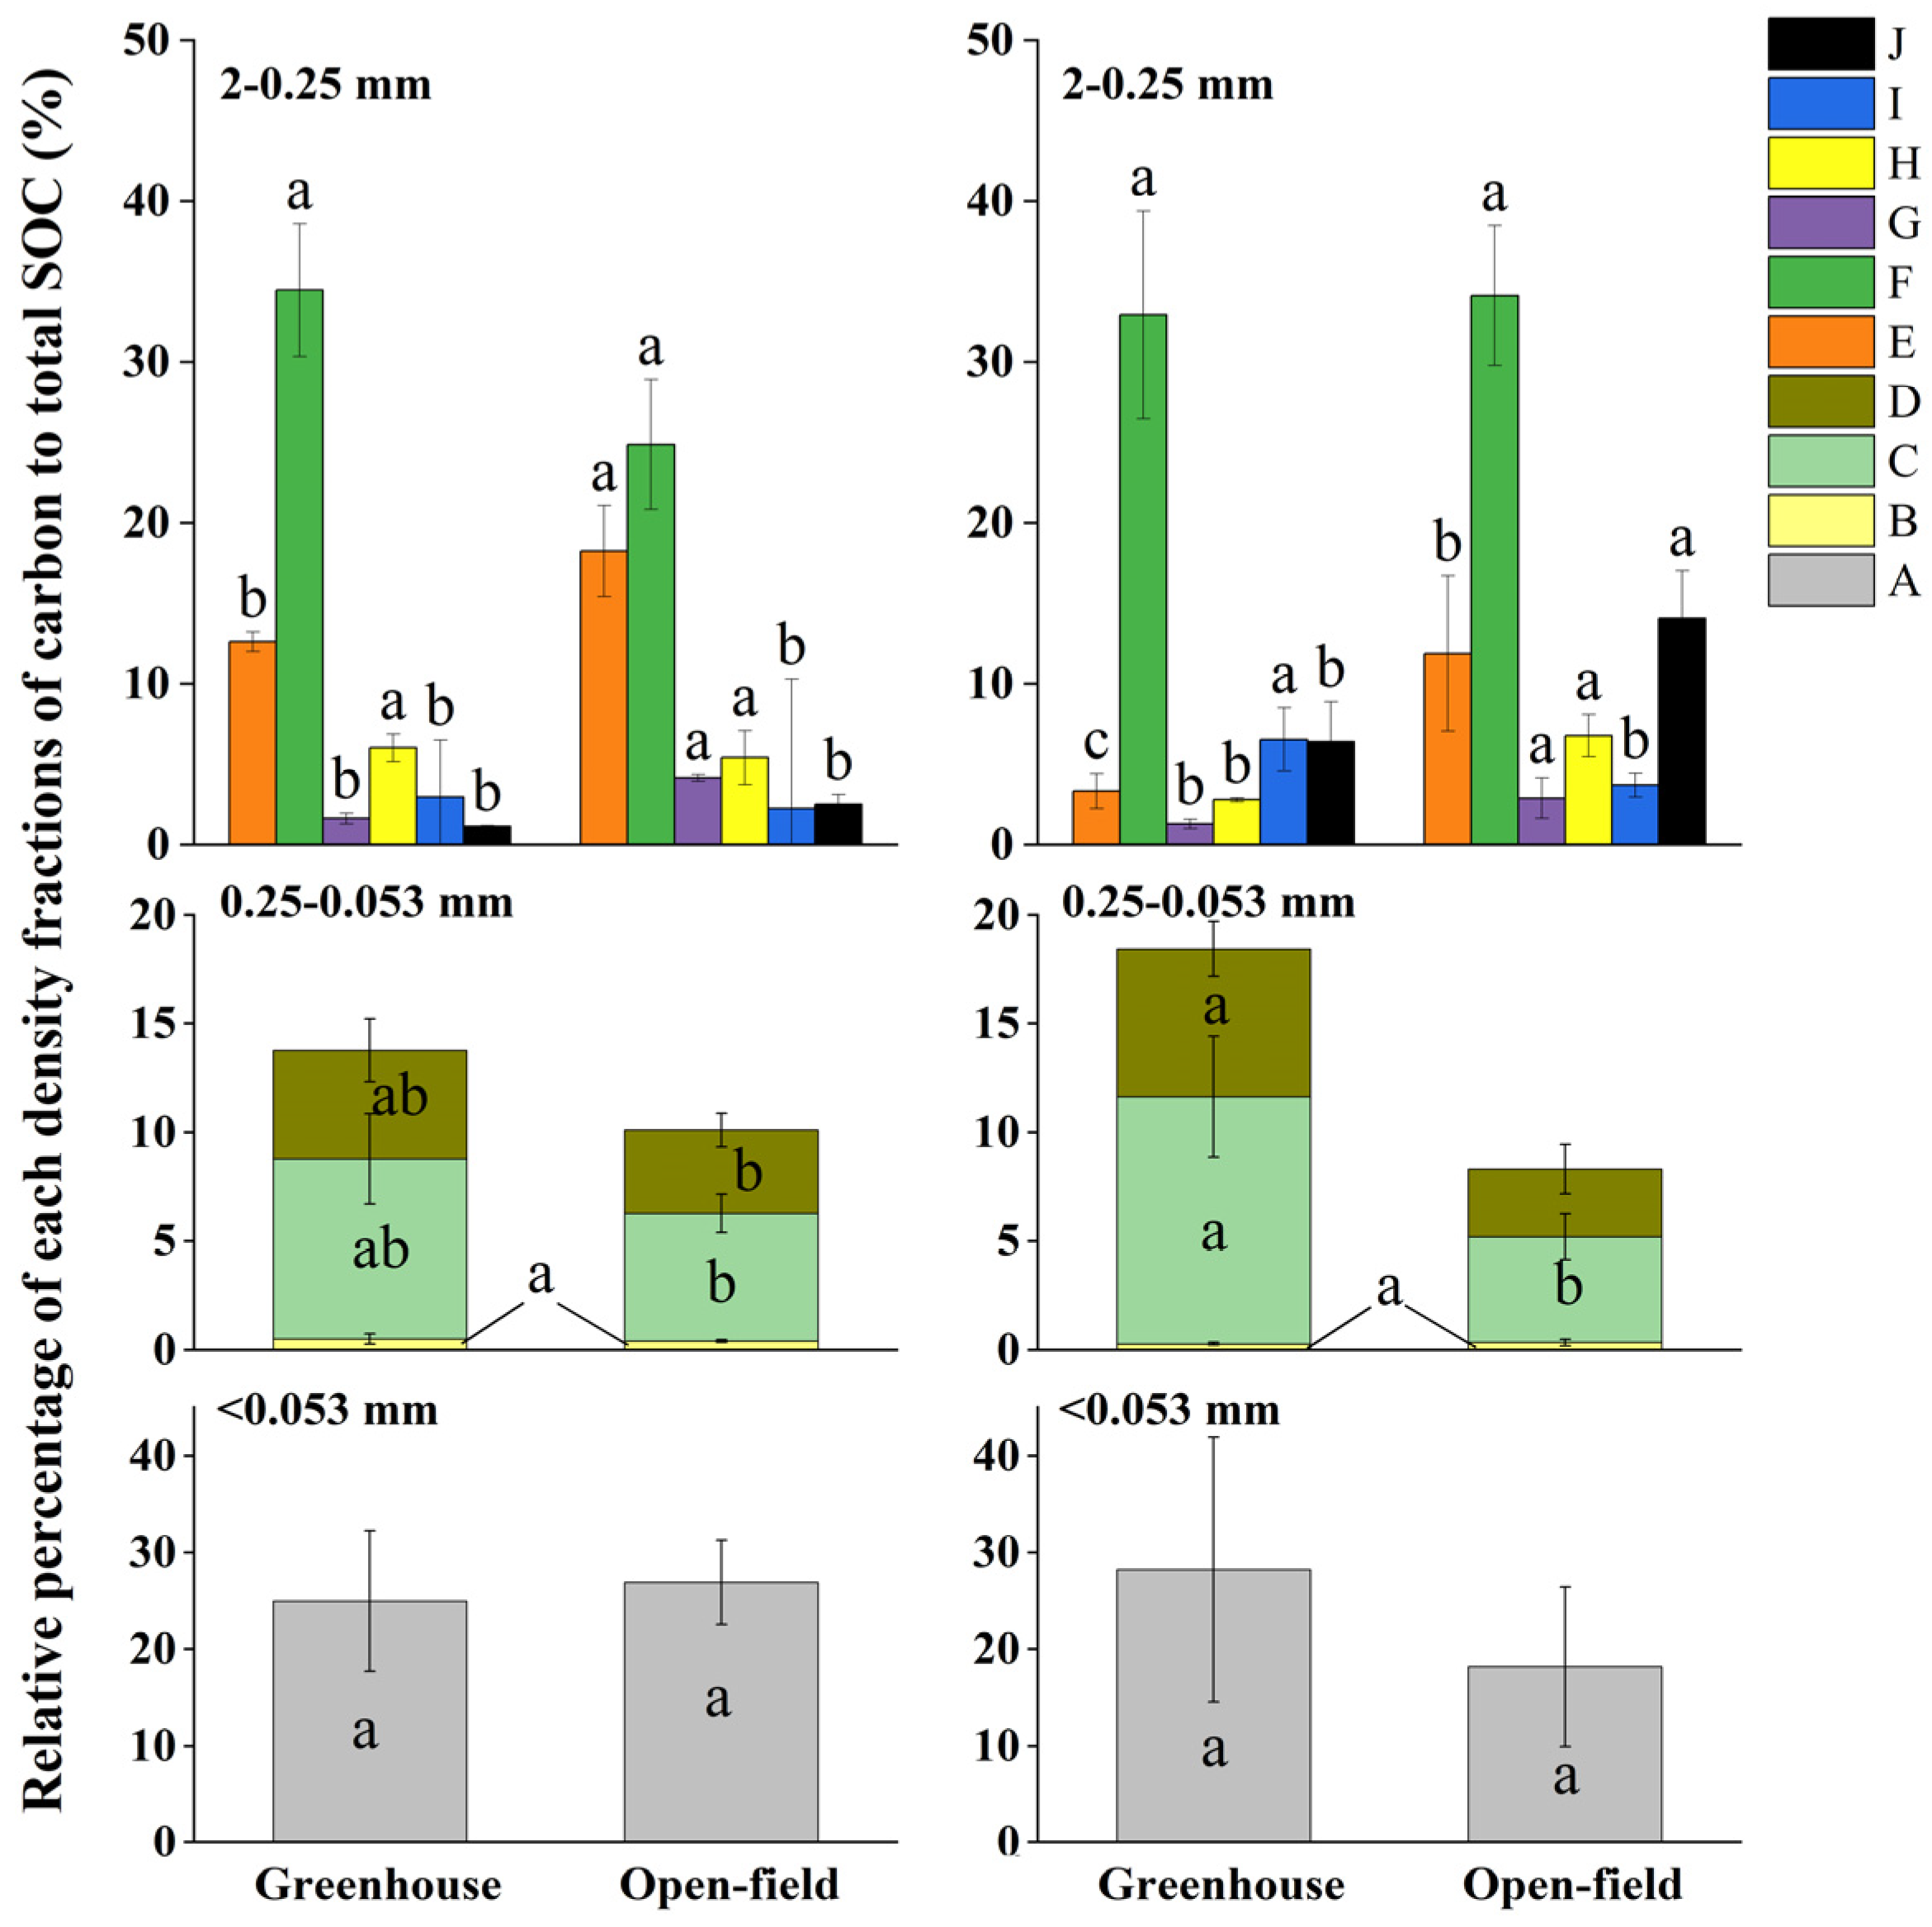
The relative percentage of MOM and POM to the total SOC content also differed in soil aggregate hierarchies (Figure 7). Within the 2–0.25 mm aggregates, a MOM type-F carbon showed the highest values, with values of 34.46% (0–15 cm soil) and 32.93% (15–30 cm) in greenhouse, as well as 24.88% (0–15 cm) and 34.14% (15–30 cm) in open-field soils (Figure 7). In contrast, within the 0.25–0.053 mm aggregates, the MOM (type-C carbon) constituted the highest proportion, followed by fractions of D and B. Within <0.053 mm aggregates, MOM type-A carbon ranged between 18.20% and 18.24%. Generally, the proportion of MOM and LF was higher in 2–0.25 mm aggregates than in 0.25–0.053 mm aggregates, whereas POM carbon (types-D, G, H, and J) exhibited an inverse relationship with aggregate size in both site soils (Figure 7).

Figure 7.
Relative proportions of SOC in density fractions that are separated from different aggregates sizes to total SOC. Different lowercase letters indicate significant differences of the same type of carbon between the greenhouse and open field in the same soil depth. A is MOM carbon; B and E represent the light fraction (LF); D, G, H, and J are particulate organic matter (POM), where D, H, and J represent 0.25–0.053 mm iPOM (occurring within aggregates) and G represents 0.25–0.053 mm iPOM; C, F, and I represent mineral-associated organic matter (MOM) in aggregates < 0.053 mm.
3.4. Relationships between Soil Salt, Microbes within Aggregates, and Carbon Content
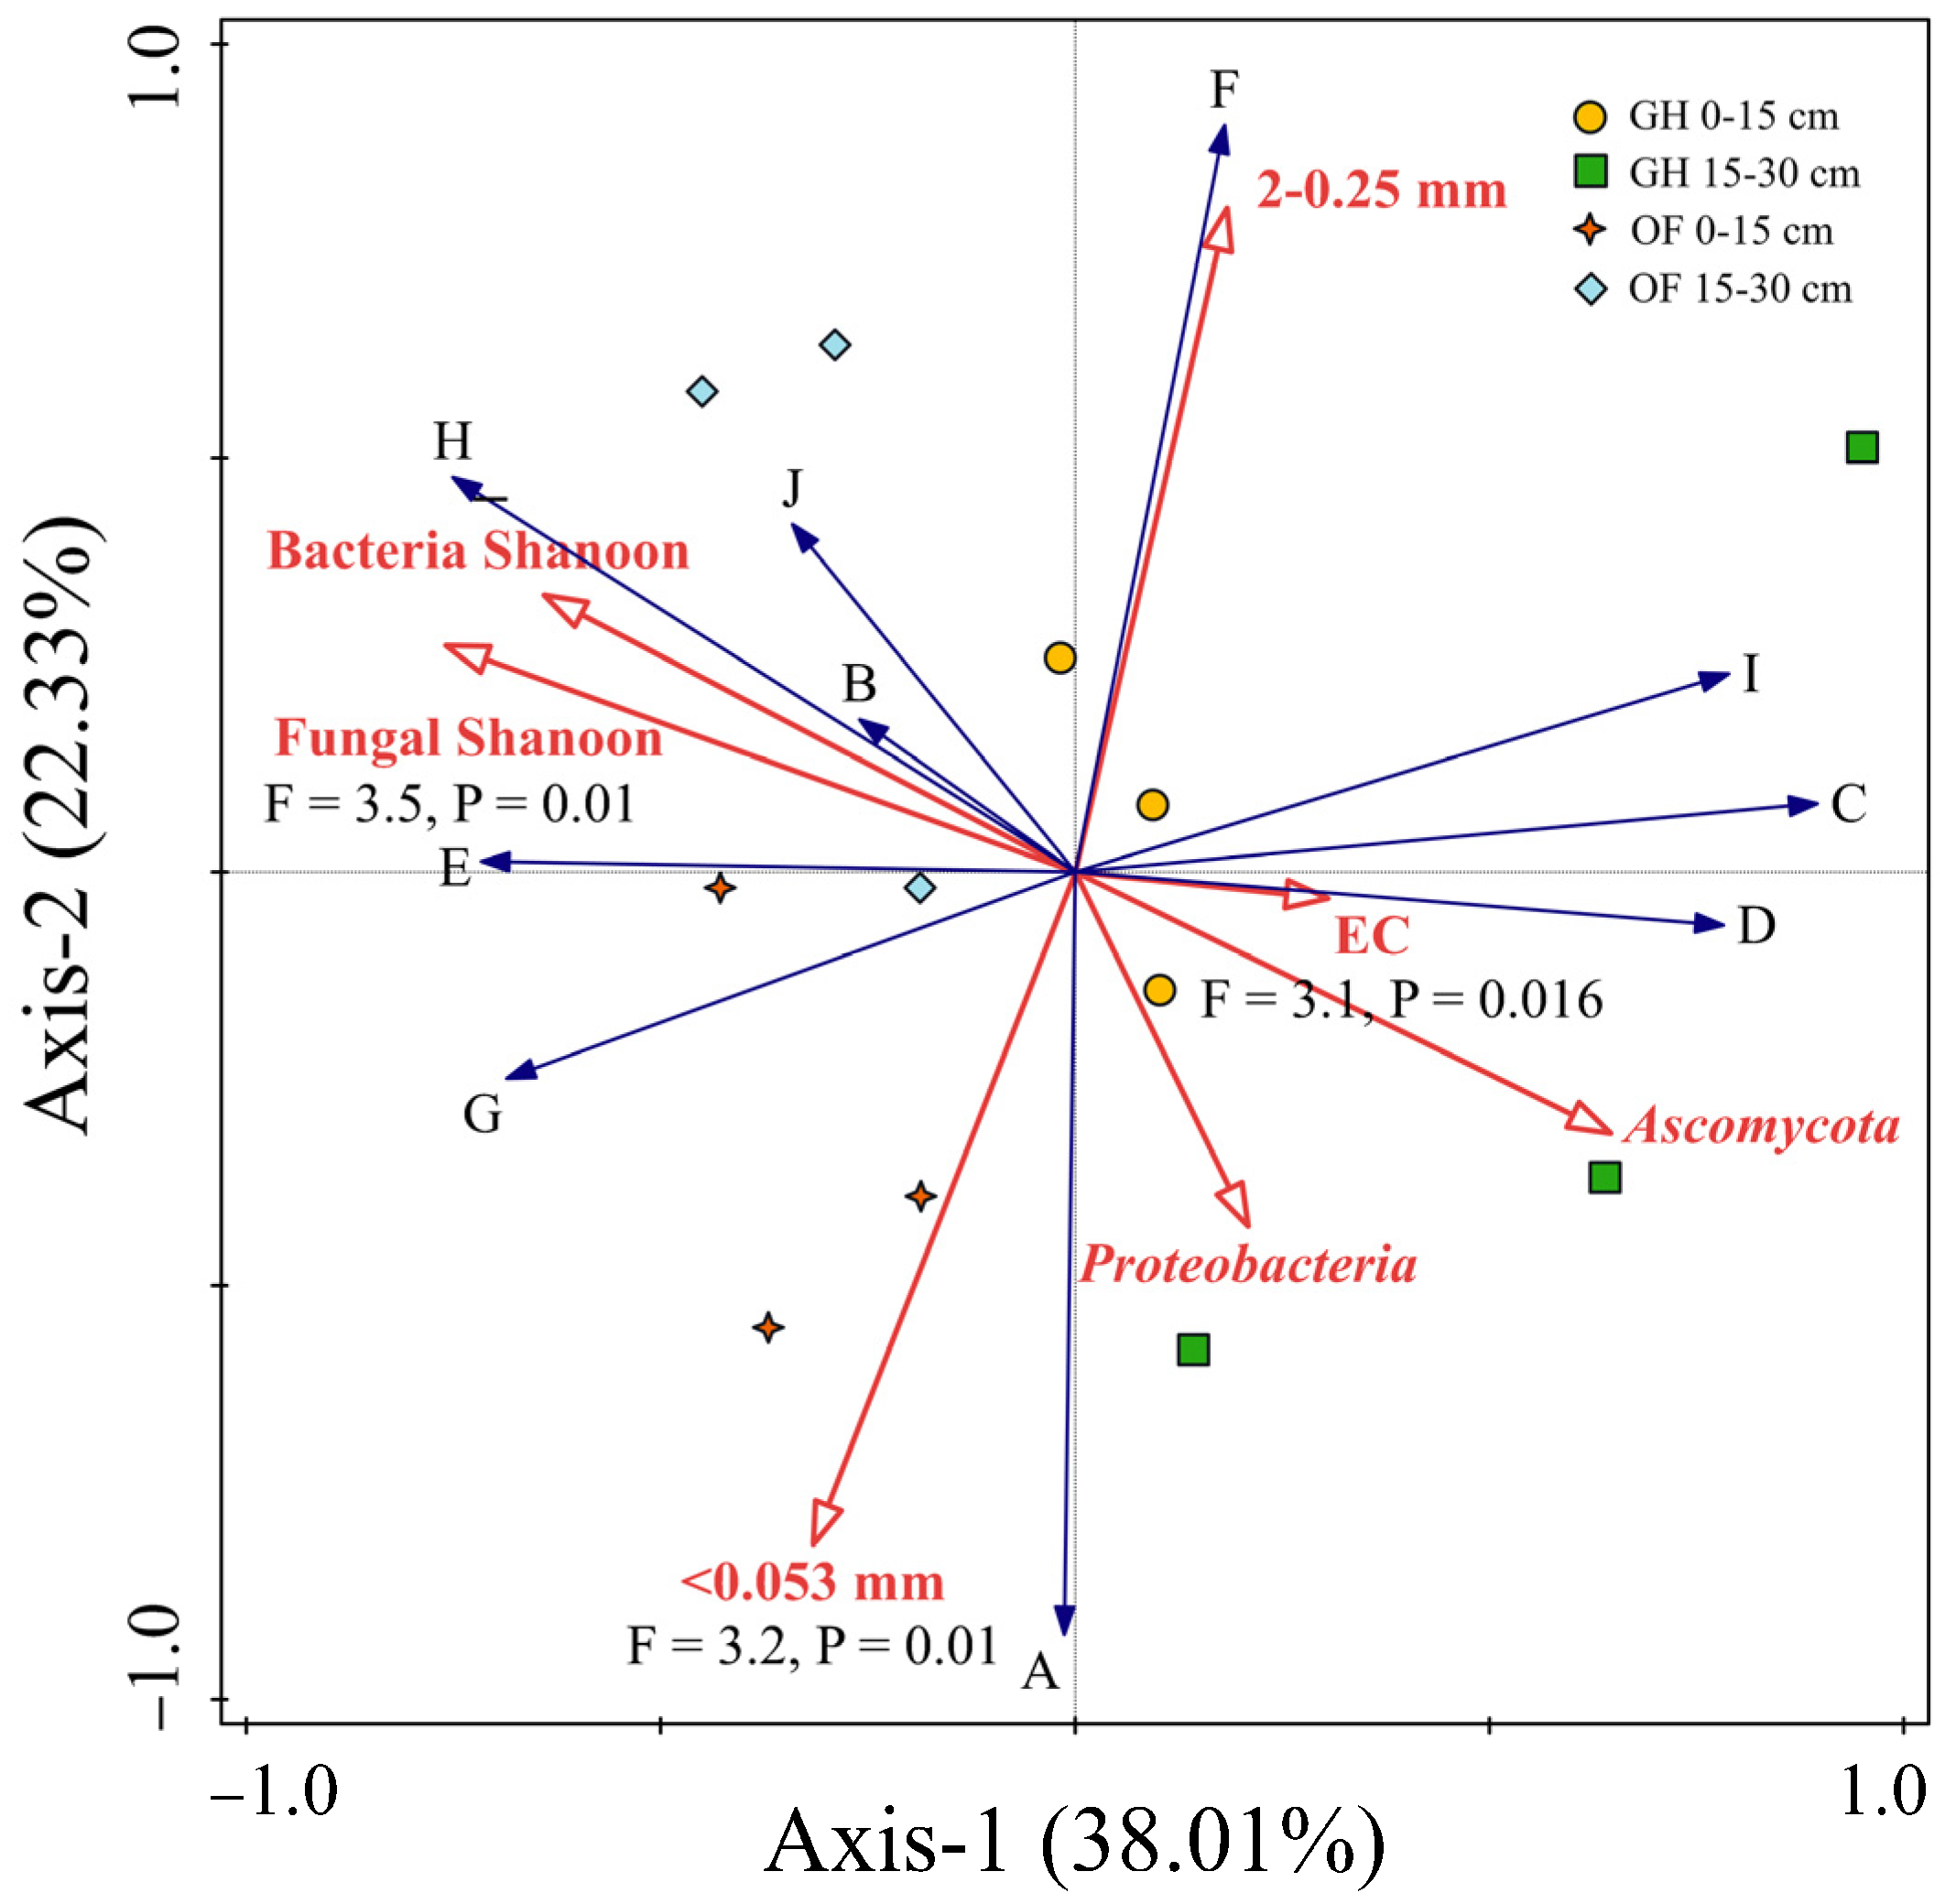
Correlation analysis showed that the salt had no significant influence SOC density fractions, except for 0.25–0.053 mm iPOM (G-type carbon) and 0.25–0.053 mm iPOM occurring within aggregates (J-type carbon) (Table 2). The fungal Shannon diversity exhibited positive effects on all carbon types, with significant effects observed for J-type SOC. Among fungi diversity, the relative abundance of the dominant Basidiomycota community within the 2–0.25 mm aggregate also had a positive effect on all carbon types, particularly G-type SOC (Table 2). Furthermore, RDA analysis indicated that EC displayed a weaker correlation with SOC density fraction percentage compared to microbial properties (Figure 8). The fungal Shannon diversity and Ascomycota had the strongest positive correlation with SOC density fraction percentage when compared to other influential factors, such as soil EC and aggregate percentage (Figure 8). Generally, the fungal diversity, particularly the abundance of Ascomycota, played a significant role in determining 0.25–0.053 mm iPOM (G-type carbon) and MOM in aggregates <0.053 mm (C, I, and F-type carbon) (Table 2 and Figure 8).
Table 2.
Correlation analysis showing the influence of soil properties [soil ions, microbial diversity, and relative abundance of predominant fungal phyla] on the proportion of the density fraction of SOC to total SOC.
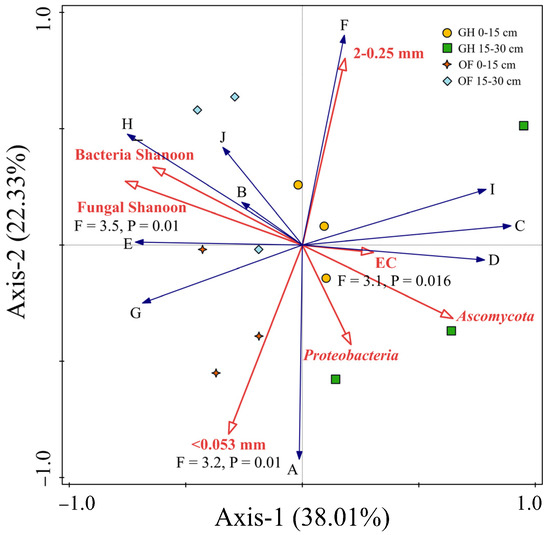
Figure 8.
Redundancy analysis (RDA) plots showing the influence of soil properties on the proportion of the density fraction of SOC to total SOC. The longer the arrow, the greater the correlation between an environment factor (soil EC, microbial property, and aggregate percentage) and the SOC types (A–J).
4. Discussion
4.1. Salt Ion Distribution in Aggregate and Their Effect on Microbial Distribution
Soil levels and types of salts varied across different aggregate sizes. Elevated salt levels within microaggregates were associated with their adverse effect on macroaggregate stability. Interestingly, the detrimental effects of salts on macroaggregates were less pronounced in this study compared to previous studies [23,24]. This difference is likely due to regular summer rainfall leaching, which reduces soil salt content and mitigates their damage to soil macroaggregates when the greenhouse plastic cover has been regularly removed. Notably, the average EC of 2.49 dS m−1 in the greenhouse soil was slightly greater than the critical threshold EC for clay dispersion, likely resulting in a limited dispersion effect on macroaggregates. Soil clay particles tend to disperse when soil EC exceeded a threshold value of 2 dS m−1 [25,26].
The salt distribution within soil aggregates significantly affects carbon-regulating soil microbes. A recent review highlighted that salinity has the most pronounced impact on the global microbial composition of saline soils among extreme chemical factors [22]. Firstly, elevated salt levels can induce osmotic stress, limit the growth and activity of soil microbes with lower salt tolerance, and subsequently influence their capacity to adjust carbon cycling [3]. Secondly, the spatial distribution of salt within aggregates creates microsites with distinct chemical conditions, affecting microbial activity and carbon mineralization rates. Therefore, salt within aggregates can influence microbial habitat availability and carbon accessibility [27].
Although relatively high salt levels existed in small aggregates (0.25–0.053 mm + <0.053 mm), fungi (Ascomycota and Basidiomycota) demonstrated a remarkable tolerance to these high salt levels. Likewise, another fungal species (Moterella) exhibited high resistance to a coastal saline soil salinity [28]. However, bacterial phyla were not sensitive to salts (Figure 5), which differs from findings in other studies [29]. Review studies have concluded that the soil microbiota play key roles in degraded land restoration (i.e., saline soil restoration) because they are essential for decomposing soil organic matter and stabilizing macroaggregates [30]. Consequently, it is crucial to understand how salt distribution within soil aggregates regulates carbon-controlling soil microbes in ecosystems.
4.2. Carbon Density Fraction Distribution in Aggregates in Response to Microbes
Soil aggregate location determines the SOC abundance through biological processes [7,21]. A substantial difference in the distribution of LF carbon (type-E) (1.08%–18.2%) was observed across various aggregate sizes. For example, type E carbon was 22–44 times more abundant in macroaggregates (2–0.25 mm) than in microaggregates at both sites. These findings were consistent with previous research [31,32], which also showed greater LF carbon abundance in macroaggregates than in microaggregates. Nevertheless, the LF distribution with aggregates hierarchy in this study differs from the results reported by [33]. They argued that lower LF content was in macroaggregates because a greater abundance of bacterial species (Pedobacter) increased the mineralization rate of LF carbon [33]. In this study, relatively low salt levels than the threshold EC of 2 dS m−1, were likely insufficient to inhibit the decomposition of labile organic matter by microbes [4,18].
Soil aggregates also exert a profound influence on regulating POM dynamics by influencing microbial activity [9]. A higher proportion of POM (type-D) was found in intra-microaggregates (0.25–0.053 mm) than in that separated from the intra-microaggregates within macroaggregates (2–0.25 mm) (types G, H, J) through below approaches. Firstly, microaggregates has smaller pore sizes and more constrained physicochemical conditions, which limit microbial access to POM and result in accumulation of POM. Microaggregates enhanced Ascomycota fungal species that excrete insoluble glycoproteins (e.g., glomalin) to stabilize and increase POM carbon (type-D) [34]. Thus, the residence time of POM within intra-microaggregates increased due to the physical protection and reduced microbial decomposition of SOC [35]. Similarly, Xu et al. [20] proposed that the higher Actinobacteria in microaggregates contributed less to the total mineralization amount due to their lower quantity proportion in microaggregates compared to macroaggregates. In contrast, macroaggregates can provide a favorable environment for microbial colonization, resulting in a higher turnover rate and reduced the POM content. Secondly, macroaggregates provided a major habitat for fauna, accelerating POM decomposition rates due to their activity [7]. This makes occluded POM carbon (types-G, H, J) within macroaggregates more susceptible to microbial consumption compared to free POM carbon (type-D). Thirdly, the C/N ratio of POM was lower in greenhouse soil (9.2–11.5) compared to that in open-field soil (10.5–25) (Supplementary Table S1), and this lower ratio accelerated POM loss in greenhouse soil [36].
The proportion of MOM carbon (types C, F, and I) exceeded that of POM and LF. Limited aeration within microaggregates inhibited microbial activity and was responsible for the high values of MOM carbon proportion [37,38]. An increase in salt levels with cultivation years of greenhouse enhanced organo–mineral associations within microaggregates [9,39,40]. Additionally, the high silt content in this soil contributed to some of its richness in MOM.
5. Conclusions
This study investigated the regulatory role of salt and microbial activity on SOC density fractions within different aggregate sizes. Elevated salt and diminished fungal diversity existed in microaggregates than in macroaggregates in the greenhouse. Such a salt and fungi pattern with aggregates contributed to the low proportion of LF carbon (type-B), the high proportion of POM carbon (type-D, rather than types-G, H, and J), and the high proportion of MOM carbon relative to total SOC within the intra-microaggregates (0.25–0.053 mm). Our findings confirmed the critical role of fungal diversity, especially the abundance of Ascomycota and Basidiomycota, in shaping the diverse distributions of the SOC density fractions within aggregate sizes. These results contribute to a better understanding of SOC distribution in secondary salt-affected soils for future management. However, further research is needed to investigate the change in SOC density fractions in the context of inter-aggregate turnover dynamics influenced by salt and microbial activity.
Supplementary Materials
The following supporting information can be downloaded at: https://www.mdpi.com/article/10.3390/land12112024/s1, Table S1: The C/N ratios of soil density fractions separated from aggregates of different size.
Author Contributions
W.Y. wrote the first draft. X.S. plotted figures. Y.H. designed the research experiment. B.C. and Y.Z. performed the laboratory analysis. J.C. gave comments on the manuscript. All authors have read and agreed to the published version of the manuscript.
Funding
Financial support was provided by the Research on Carbon Reduction and Carbon Sequestration Measures in Hubei Province’s Water Resources Sector.
Data Availability Statement
Data would be available from the corresponding author on request.
Acknowledgments
We thank the Research on Carbon Reduction and Carbon Sequestration Measures in Hubei Province’s Water Resources Sector for the financial support.
Conflicts of Interest
The authors declare no conflict of interest.
References
- Wu, R.; Sun, H.; Xue, J.; Yan, D.; Liu, Y.; Gui, D.; Wang, X.; Yang, J. Acceleration of soil salinity accumulation and soil degradation due to greenhouse cultivation: A survey of farmers’ practices in China. Environ. Monit. Assess. 2020, 192, 399. [Google Scholar] [CrossRef] [PubMed]
- Zhang, F.; Li, S.; Xiao, D.; Zhao, J.; Wang, R.; Guo, X.; Wang, S. Progress in Pest Management by Natural Enemies in Greenhouse Vegetables in China. Sci. Agric. Sin. 2015, 48, 3463–3476. [Google Scholar]
- Bonachela, S.; Dolores Fernandez, M.; Javier Cabrera, F.; Rosa Granados, M. Soil spatio-temporal distribution of water, salts and nutrients in greenhouse, drip-irrigated tomato crops using lysimetry and dielectric methods. Agric. Water Manag. 2018, 203, 151–161. [Google Scholar] [CrossRef]
- Zhang, L.; Song, L.; Wang, B.; Shao, H.; Zhang, L.; Qin, X. Co-effects of salinity and moisture on CO2 and N2O emissions of laboratory-incubated salt-affected soils from different vegetation types. Geoderma 2018, 332, 109–120. [Google Scholar] [CrossRef]
- Reddy, N.; Crohn, D.M. Quantifying the effects of active and cured greenwaste and dairy manure application and temperature on carbon dioxide, nitrous oxide, and dinitrogen emissions from an extreme saline-sodic soil. Catena 2019, 173, 83–92. [Google Scholar] [CrossRef]
- Wong, V.N.L.; Greene, R.S.B.; Dalal, R.C.; Murphy, B.W. Soil carbon dynamics in saline and sodic soils: A review. Soil Use Manag. 2010, 26, 2–11. [Google Scholar] [CrossRef]
- Yudina, A.; Kuzyakov, Y. Dual nature of soil structure: The unity of aggregates and pores. Geoderma 2023, 434, 116478. [Google Scholar] [CrossRef]
- Six, J.; Elliott, E.T.; Paustian, K.; Doran, J.W. Aggregation and soil organic matter accumulation in cultivated and native grassland soils. Soil Sci. Soc. Am. J. 1998, 62, 1367–1377. [Google Scholar] [CrossRef]
- Yin, Y.; Liang, C.-H.; Pei, Z.-J. Effect of greenhouse soil management on soil aggregation and organic matter in northeast China. Catena 2015, 133, 412–419. [Google Scholar] [CrossRef]
- Thapa, R.; Chatterjee, A.; Wick, A.; Butcher, K. Carbon Dioxide and Nitrous Oxide Emissions from Naturally Occurring Sulfate-Based Saline Soils at Different Moisture Contents. Pedosphere 2017, 27, 868–876. [Google Scholar] [CrossRef]
- Six, J.; Elliott, E.T.; Paustian, K. Soil macroaggregate turnover and microaggregate formation: A mechanism for C sequestration under no-tillage agriculture. Soil Biol. Biochem. 2000, 32, 2099–2103. [Google Scholar] [CrossRef]
- Feng, H.; Wang, S.; Gao, Z.; Pan, H.; Zhuge, Y.; Ren, X.; Hu, S.; Li, C. Aggregate stability and organic carbon stock under different land uses integrally regulated by binding agents and chemical properties in saline-sodic soils. Land Degrad. Dev. 2021, 32, 4151–4161. [Google Scholar] [CrossRef]
- FAO. World Soil Resources: An Explanatory Note on the FAO World Soil Resources Map at 1:25,000,000 Scale; World Soil Resources Report 66; Food Agricultural Organization: Rome, Italy, 1991. [Google Scholar]
- Rengasamy, P. World salinization with emphasis on Australia. J. Exp. Bot. 2006, 57, 1017–1023. [Google Scholar] [CrossRef] [PubMed]
- Kloster, N.; Avena, M. Interaction of humic acids with soil minerals: Adsorption and surface aggregation induced by Ca2+. Environ. Chem. 2015, 12, 731–738. [Google Scholar] [CrossRef]
- Cao, Q.; Wei, X.; Wu, C.; Sun, W.; Tang, Y.; Gu, X. Simulation Study on Effects of Salt Accumulation on Electrochemical Properties and Water-stable Aggregates in Greenhouse Soil. Bull. Soil Water Conserv. 2016, 36, 164–168. [Google Scholar]
- Rath, K.M.; Rousk, J. Salt effects on the soil microbial decomposer community and their role in organic carbon cycling: A review. Soil Biol. Biochem. 2015, 81, 108–123. [Google Scholar] [CrossRef]
- Gupta, V.V.S.R.; Germida, J.J. Soil aggregation: Influence on microbial biomass and implications for biological processes. Soil Biol. Biochem. 2015, 80, A3–A9. [Google Scholar] [CrossRef]
- Rousk, J.; Baath, E.; Brookes, P.C.; Lauber, C.L.; Lozupone, C.; Caporaso, J.G.; Knight, R.; Fierer, N. Soil bacterial and fungal communities across a pH gradient in an arable soil. ISME J. 2010, 4, 1340–1351. [Google Scholar] [CrossRef]
- Xu, P.; Zhu, J.; Wang, H.; Shi, L.; Zhuang, Y.; Fu, Q.; Chen, J.; Hu, H.; Huang, Q. Regulation of soil aggregate size under different fertilizations on dissolved organic matter, cellobiose hydrolyzing microbial community and their roles in organic matter mineralization. Sci. Total Environ. 2021, 755, 142595. [Google Scholar] [CrossRef]
- Trivedi, P.; Delgado-Baquerizo, M.; Jeffries, T.C.; Trivedi, C.; Anderson, I.C.; Lai, K.; McNee, M.; Flower, K.; Singh, B.P.; Minkey, D.; et al. Soil aggregation and associated microbial communities modify the impact of agricultural management on carbon content. Environ. Microbiol. 2017, 19, 3070–3086. [Google Scholar] [CrossRef]
- Haj-Amor, Z.; Araya, T.; Kim, D.-G.; Bouri, S.; Lee, J.; Ghilou, W.; Yang, Y.; Kang, H.; Jhariya, M.K.; Banerjee, A.; et al. Soil salinity and its associated effects on soil microorganisms, greenhouse gas emissions, crop yield, biodiversity and desertification: A review. Sci. Total Environ. 2022, 843, 156946. [Google Scholar] [CrossRef]
- Ju, Z.; Du, Z.; Guo, K.; Liu, X. Irrigation with freezing saline water for 6years alters salt ion distribution within soil aggregates. J. Soils Sediments 2019, 19, 97–105. [Google Scholar] [CrossRef]
- Yu, H.; Li, T.; Zhou, J. Salt accumulation, translocation and ion composition in greenhouse soil profiles. Plant Nutr. Fertil. Sci. 2007, 13, 642–650. [Google Scholar]
- He, Y.; DeSutter, T.M.; Clay, D.E. Dispersion of Pure Clay Minerals as Influenced by Calcium/Magnesium Ratios, Sodium Adsorption Ratio, and Electrical Conductivity. Soil Sci. Soc. Am. J. 2013, 77, 2014–2019. [Google Scholar] [CrossRef]
- Marchuk, S.; Marchuk, A. Effect of applied potassium concentration on clay dispersion, hydraulic conductivity, pore structure and mineralogy of two contrasting Australian soils. Soil Tillage Res. 2018, 182, 35–44. [Google Scholar] [CrossRef]
- Yang, H.; Chen, S.; Feng, Z.; Deng, Z.; Li, Z.; Wang, S. Combined effects of soil microbes and organic matter on aggregate formation in saline-alkali soil. J. Agro-Environ. Sci. 2017, 36, 2080–2085. [Google Scholar]
- Li, Y.; Shen, C.; Wang, Y.; Xu, L.; Zhao, Y.; Yi, S.; Zuo, W.; Yao, R.; Zhang, X.; Gu, C.; et al. Alleviated environmental constraints and restructured fungal microbiome facilitate aggregate formation and stabilization in coastal mudflat saline soil amended by sewage sludge. Land Degrad. Dev. 2023, 34, 3064–3075. [Google Scholar] [CrossRef]
- Liu, M.; Wang, C.; Wang, F.; Xie, Y. Vermicompost and humic fertilizer improve coastal saline soil by regulating soil aggregates and the bacterial community. Arch. Agron. Soil Sci. 2019, 65, 281–293. [Google Scholar] [CrossRef]
- Coban, O.; De Deyn, G.B.; van der Ploeg, M. Soil microbiota as game-changers in restoration of degraded lands. Science 2022, 375, 990. [Google Scholar] [CrossRef]
- Puget, P.; Chenu, C.; Balesdent, J. Dynamics of soil organic matter associated with particle-size fractions of water-stable aggregates. Eur. J. Soil Sci. 2000, 51, 595–605. [Google Scholar] [CrossRef]
- Yamashita, T.; Flessa, H.; John, B.; Helfrich, M.; Ludwig, B. Organic matter in density fractions of water-stable aggregates in silty soils: Effect of land use. Soil Biol. Biochem. 2006, 38, 3222–3234. [Google Scholar] [CrossRef]
- Bill, M.; Chidamba, L.; Gokul, J.K.; Labuschagne, N.; Korsten, L. Bacterial community dynamics and functional profiling of soils from conventional and organic cropping systems. Appl. Soil Ecol. 2021, 157, 103734. [Google Scholar] [CrossRef]
- Lu, X.; Lu, X.; Liao, Y. Effect of Tillage Treatment on the Diversity of Soil Arbuscular Mycorrhizal Fungal and Soil Aggregate-Associated Carbon Content. Front. Microbiol. 2018, 9, 2986. [Google Scholar] [CrossRef] [PubMed]
- Cao, H.; Xie, J.; Hong, J. Variation characteristics of organic carbon fractions within macroaggregates under long-term different fertilization regimes in the reclaimed soil. J. China Coal Soc. 2021, 46, 1046–1055. [Google Scholar]
- Dorodnikov, M.; Kuzyakov, Y.; Fangmeier, A.; Wiesenberg, G.L.B. C and N in soil organic matter density fractions under elevated atmospheric CO2: Turnover vs. stabilization. Soil Biol. Biochem. 2011, 43, 579–589. [Google Scholar] [CrossRef]
- Wang, G.; Jia, H.; Zhuang, J.; Glatzel, S.; Bennett, J.M.; Zhu, Y. Growing-season soil microbial respiration response to long-term no tillage and spring ridge tillage. Int. J. Agric. Biol. Eng. 2020, 13, 143–150. [Google Scholar] [CrossRef]
- Zhang, J.; Wang, P.; Tian, H.; Xiao, Q.; Jiang, H. Pyrosequencing-based assessment of soil microbial community structure and analysis of soil properties with vegetable planted at different years under greenhouse conditions. Soil Tillage Res. 2019, 187, 1–10. [Google Scholar] [CrossRef]
- Yin, Y.; Liang, C.H.; Xi, F.M.; Du, L.Y.; Li, J.Y.; Liu, L. Micro-Aggregate Stability in Greenhouse Management System in Northeast China. Eurasian Soil Sci. 2021, 54, 1350–1358. [Google Scholar] [CrossRef]
- Rowley, M.C.; Grand, S.; Verrecchia, E.P. Calcium-mediated stabilisation of soil organic carbon. Biogeochemistry 2018, 137, 27–49. [Google Scholar] [CrossRef]
Disclaimer/Publisher’s Note: The statements, opinions and data contained in all publications are solely those of the individual author(s) and contributor(s) and not of MDPI and/or the editor(s). MDPI and/or the editor(s) disclaim responsibility for any injury to people or property resulting from any ideas, methods, instructions or products referred to in the content. |
© 2023 by the authors. Licensee MDPI, Basel, Switzerland. This article is an open access article distributed under the terms and conditions of the Creative Commons Attribution (CC BY) license (https://creativecommons.org/licenses/by/4.0/).