
Spatial–Temporal Evolution and Driving Factors of Coupling Coordination between High-Quality Urban Development and Carbon Emissions Intensity in Guangdong Province

Abstract
:1. Introduction
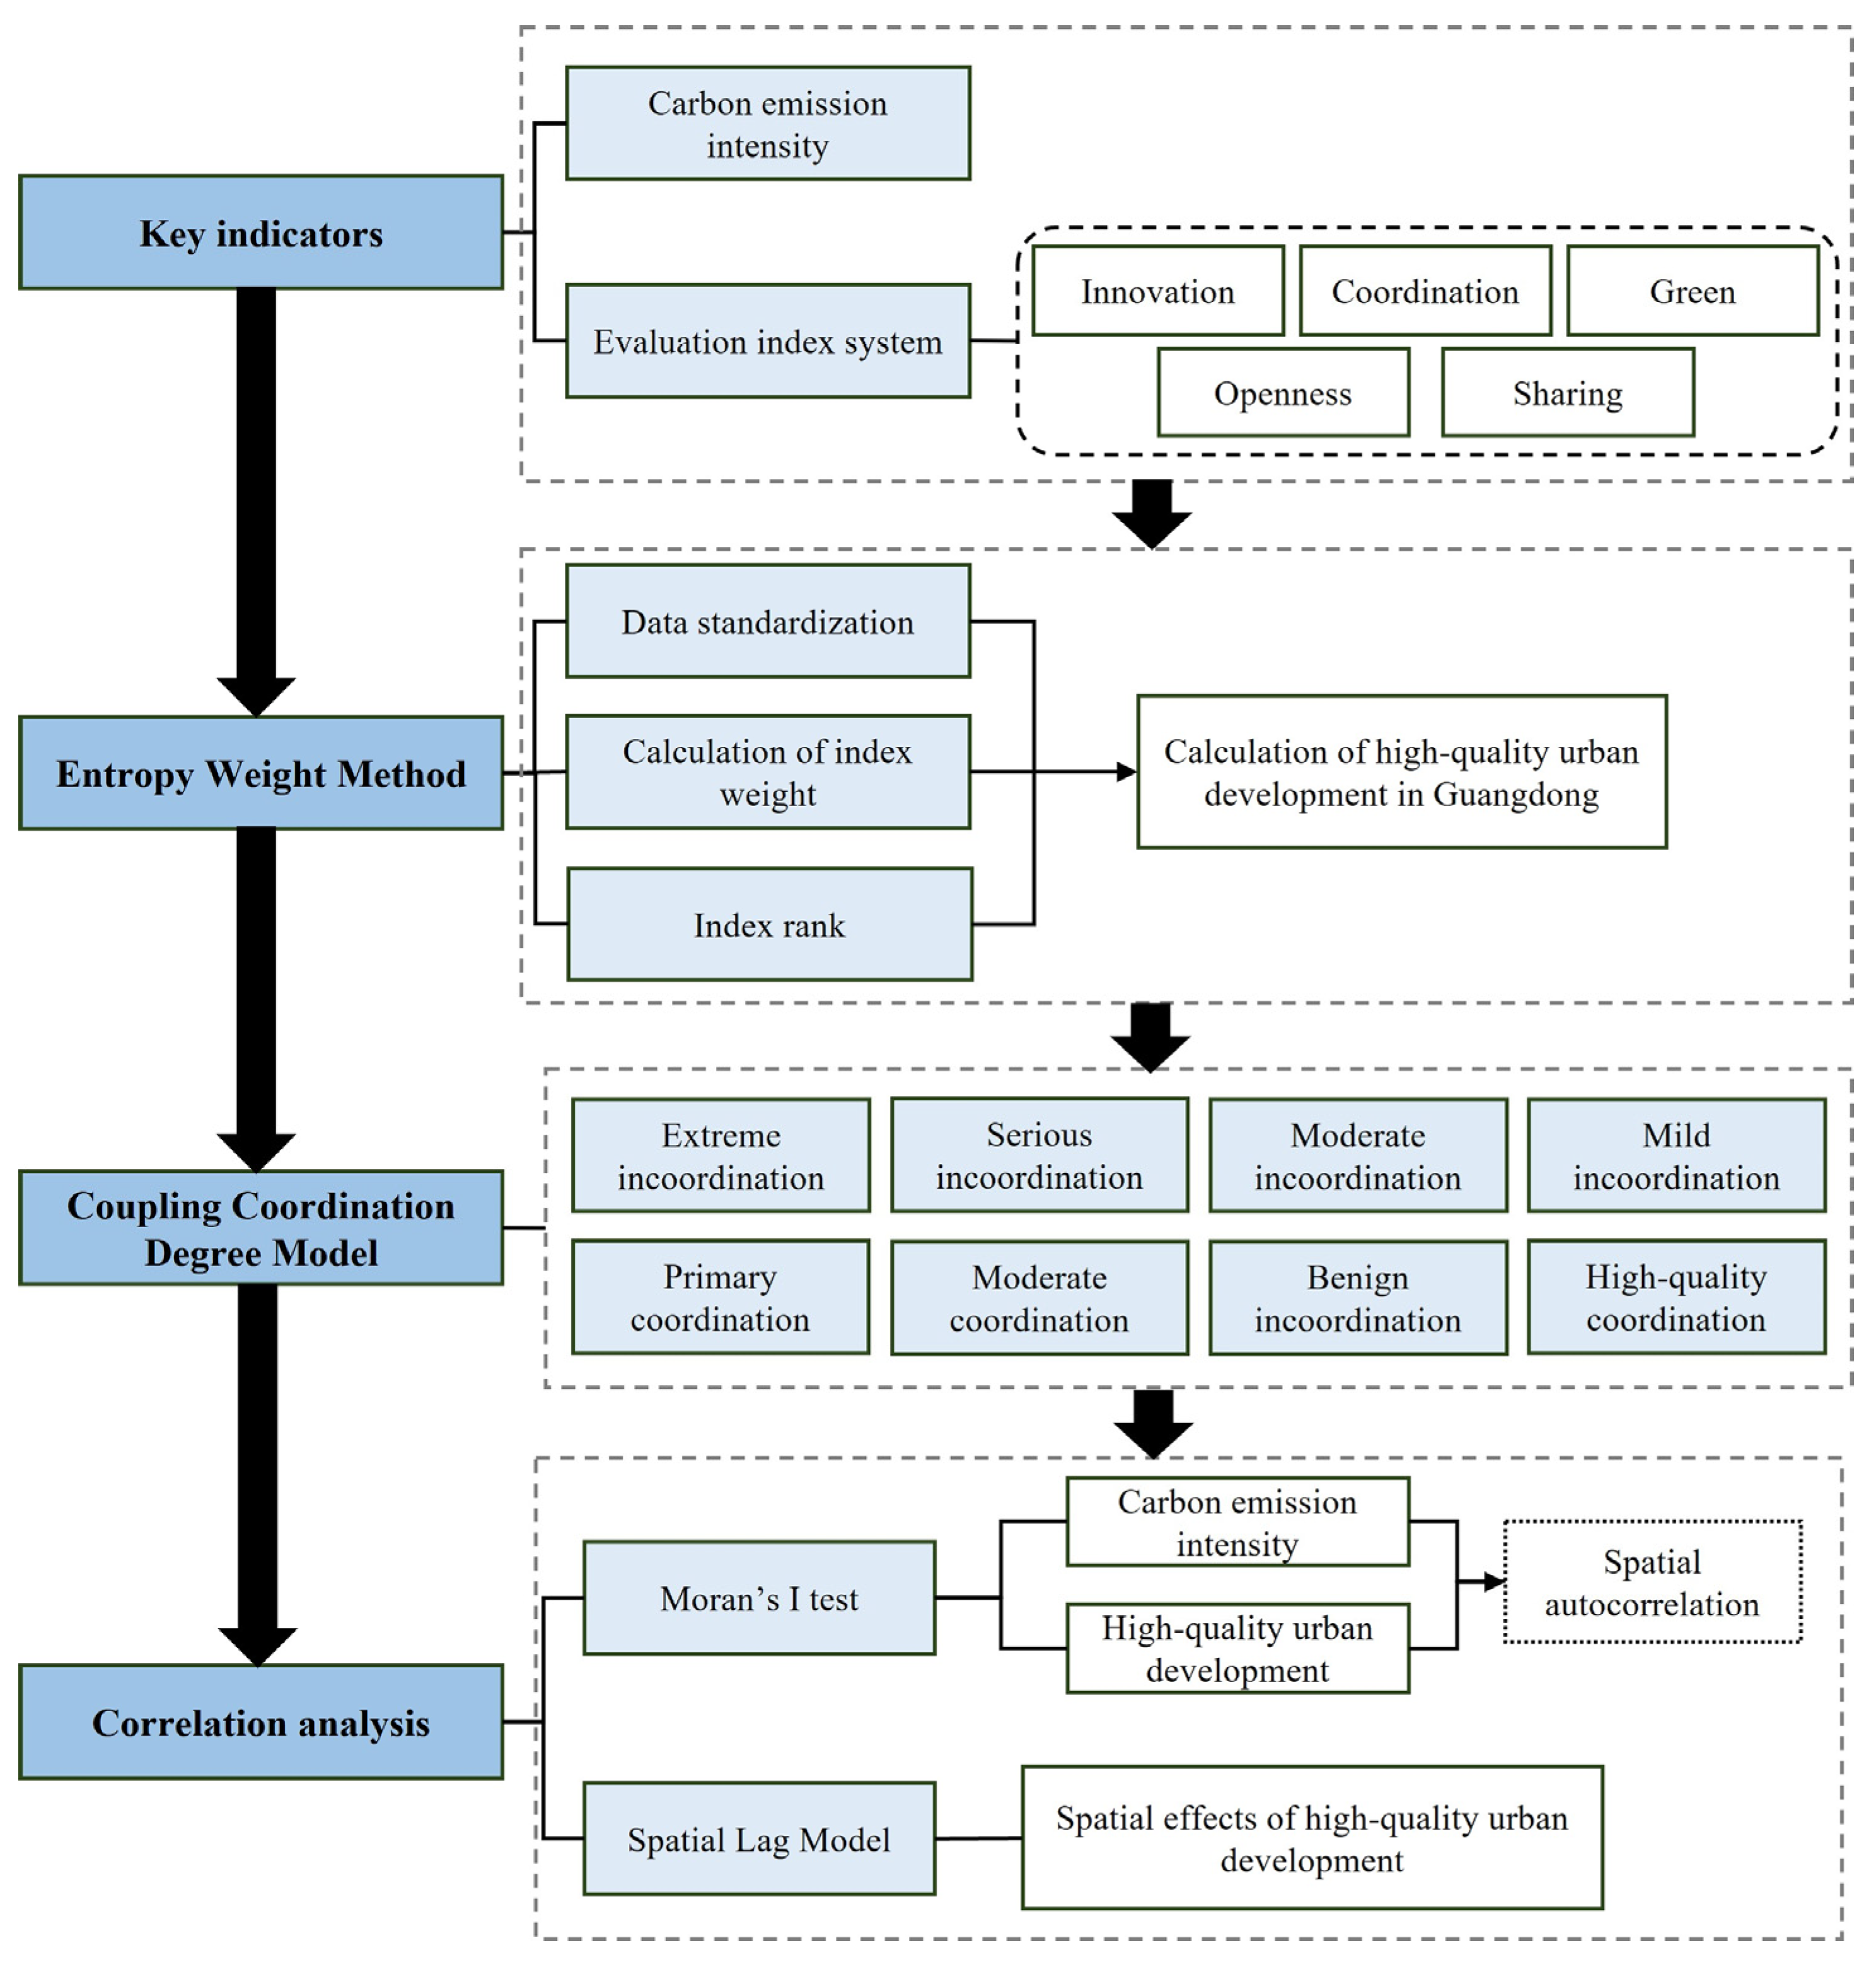
2. Methods and Data
2.1. Data Sources and Processing
2.1.1. Accounting of Carbon Emission Intensity
2.1.2. Evaluation Index of High-Quality Urban Development Level
2.1.3. Hausman Test
2.2. Methods
2.2.1. Entropy Weight Method
2.2.2. Coupling Coordination Degree Model
2.2.3. Moran’s I Test
2.2.4. Spatial Lag Model
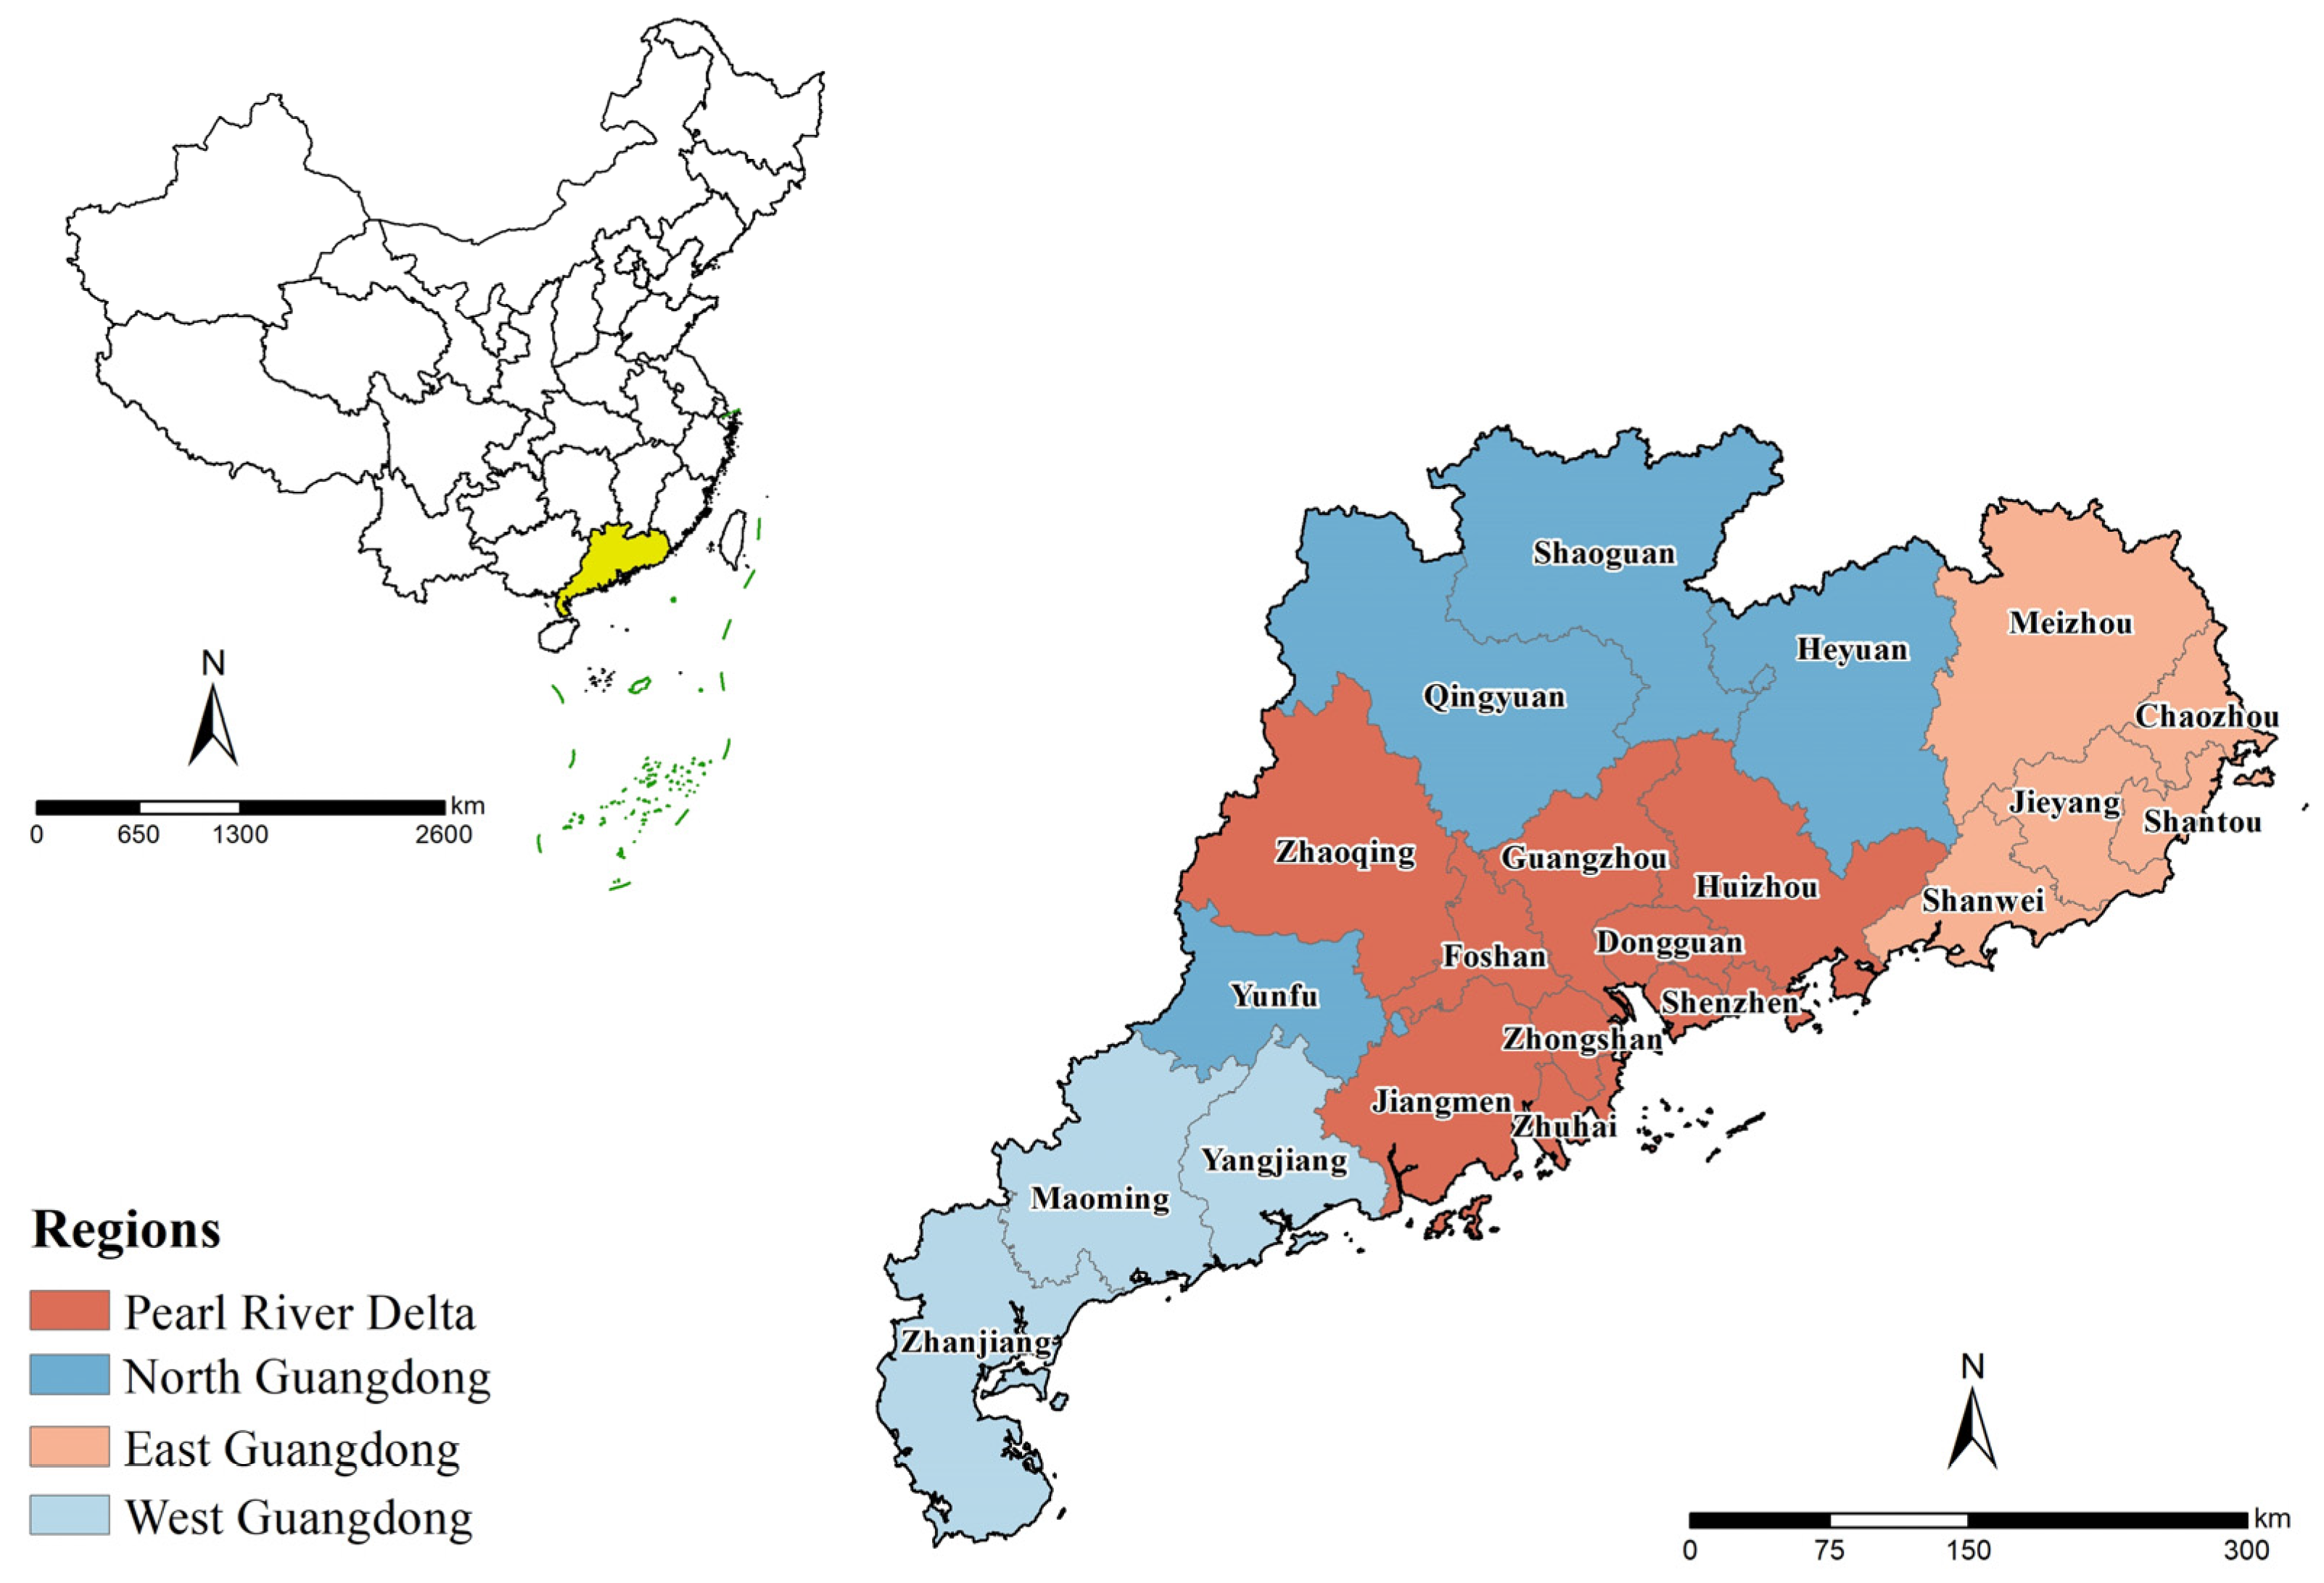
2.3. Study Area
3. Results
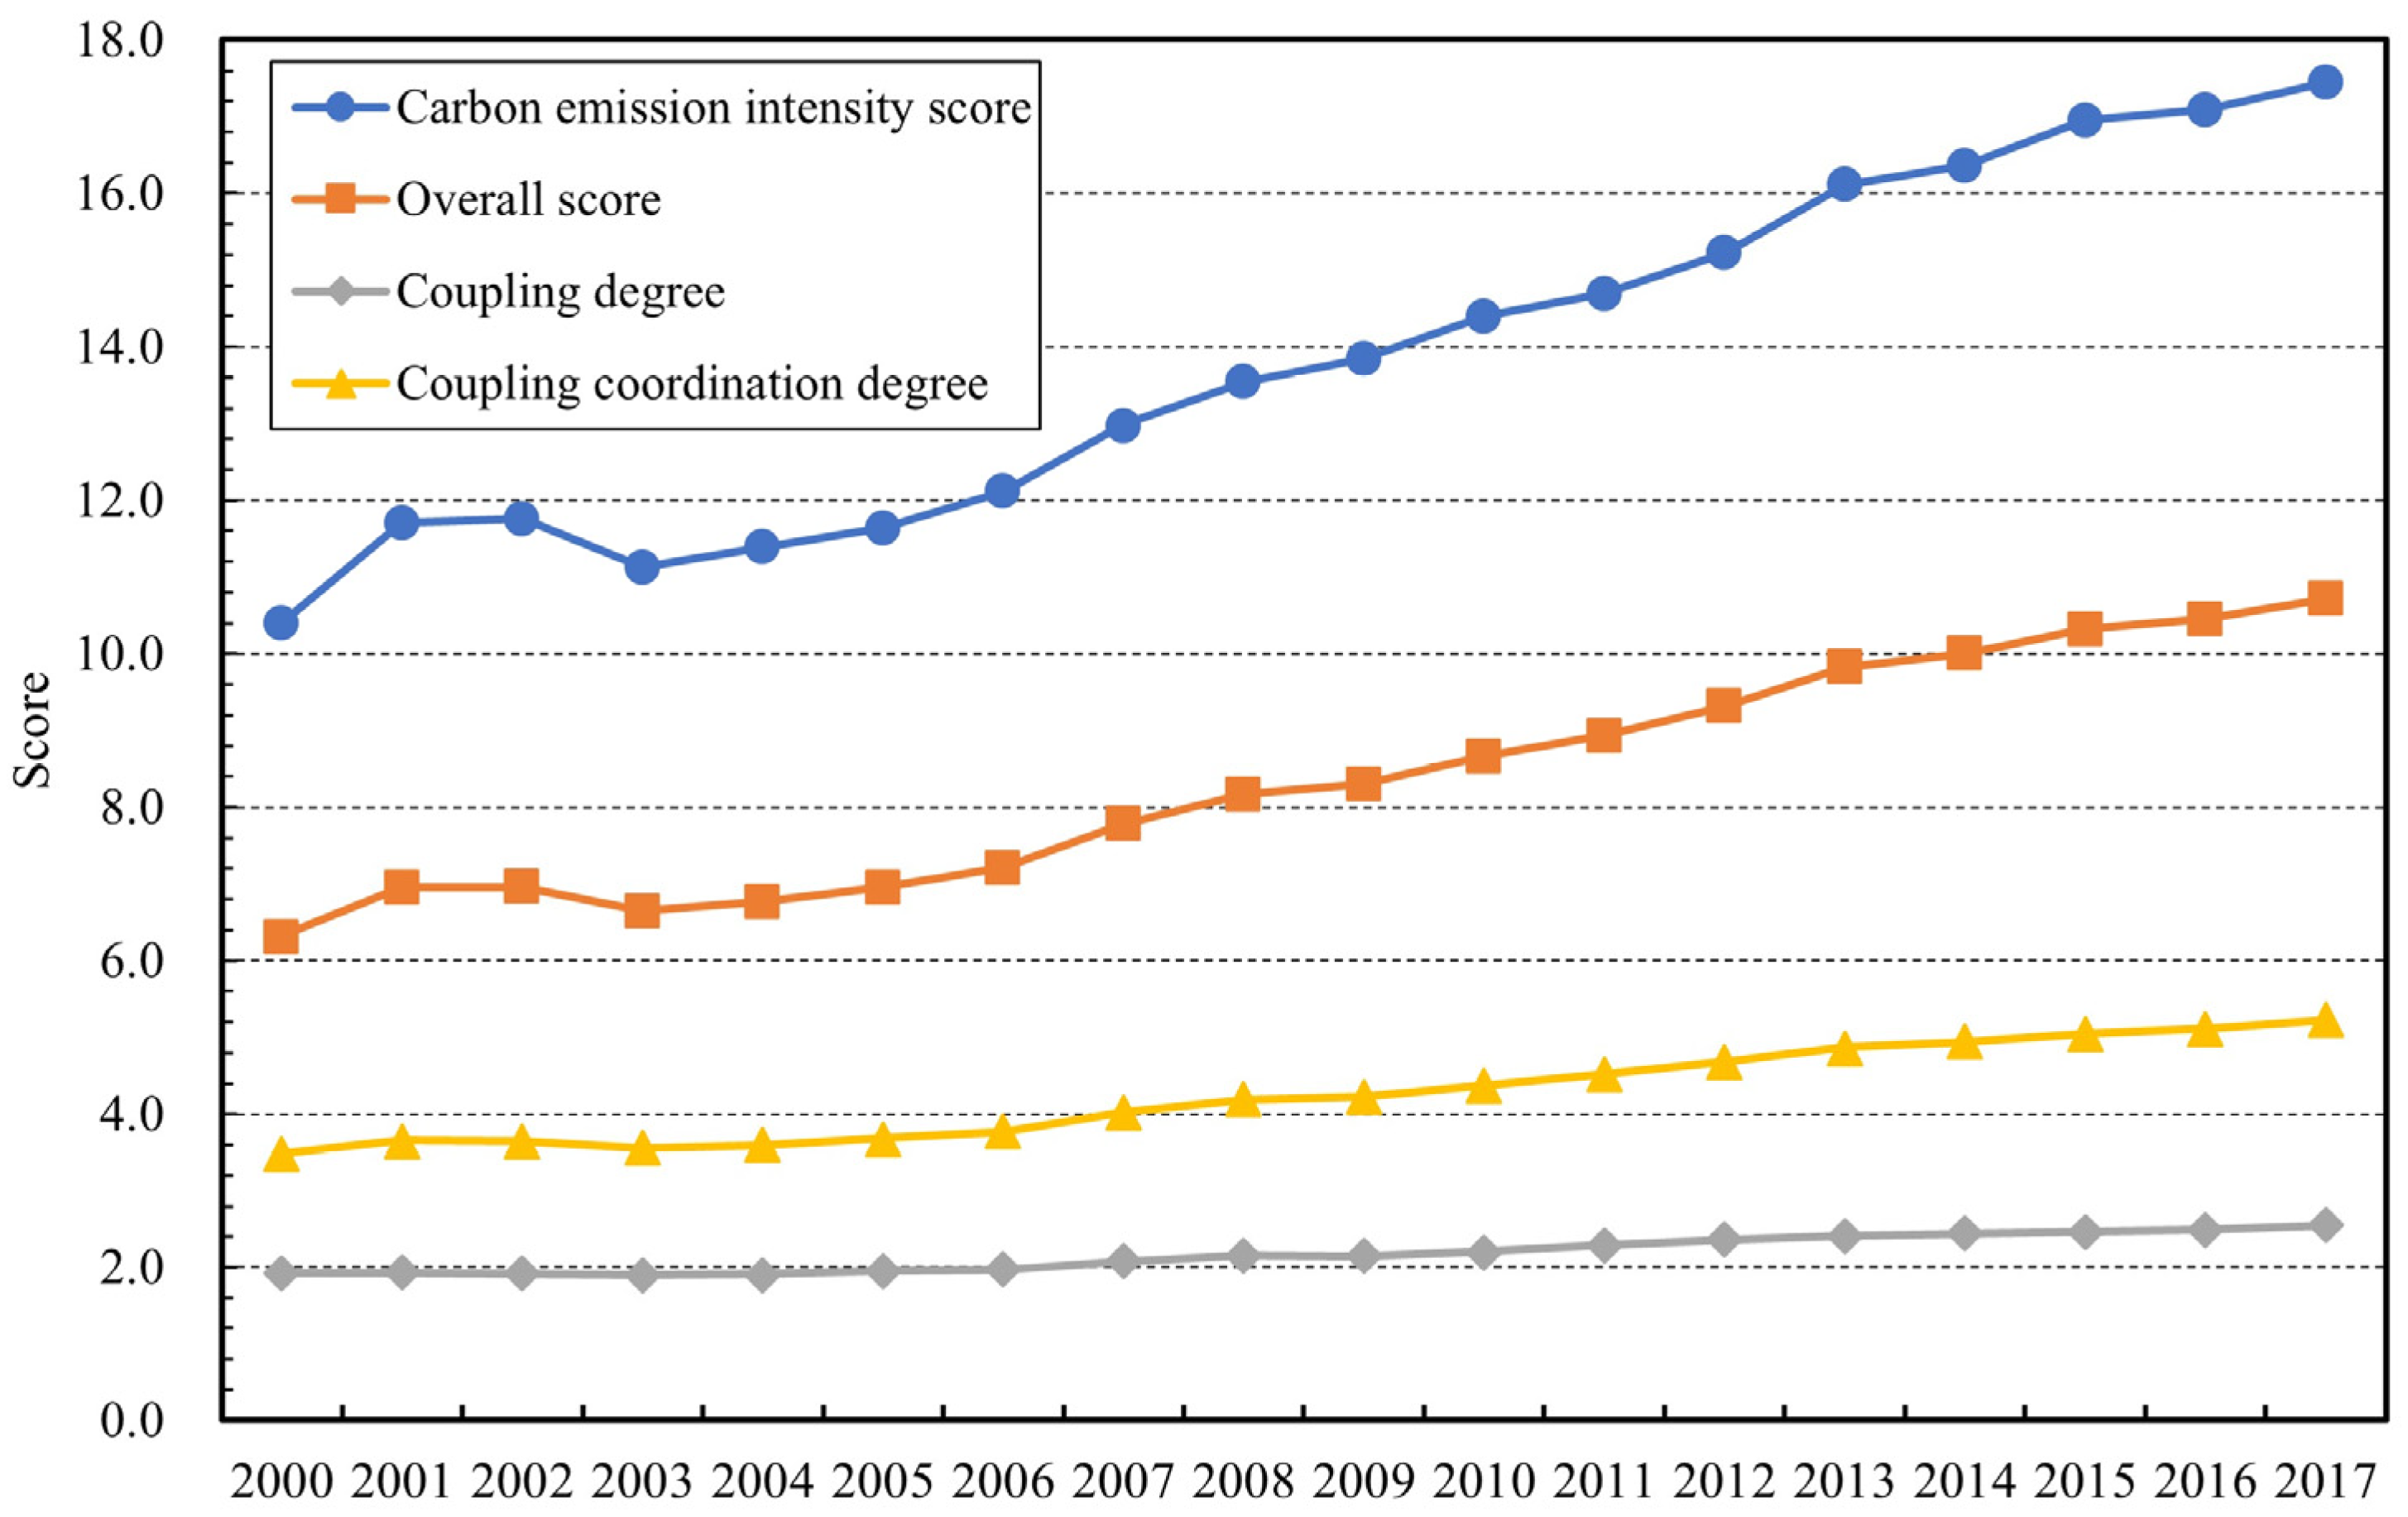
3.1. Trends in Land Urbanization
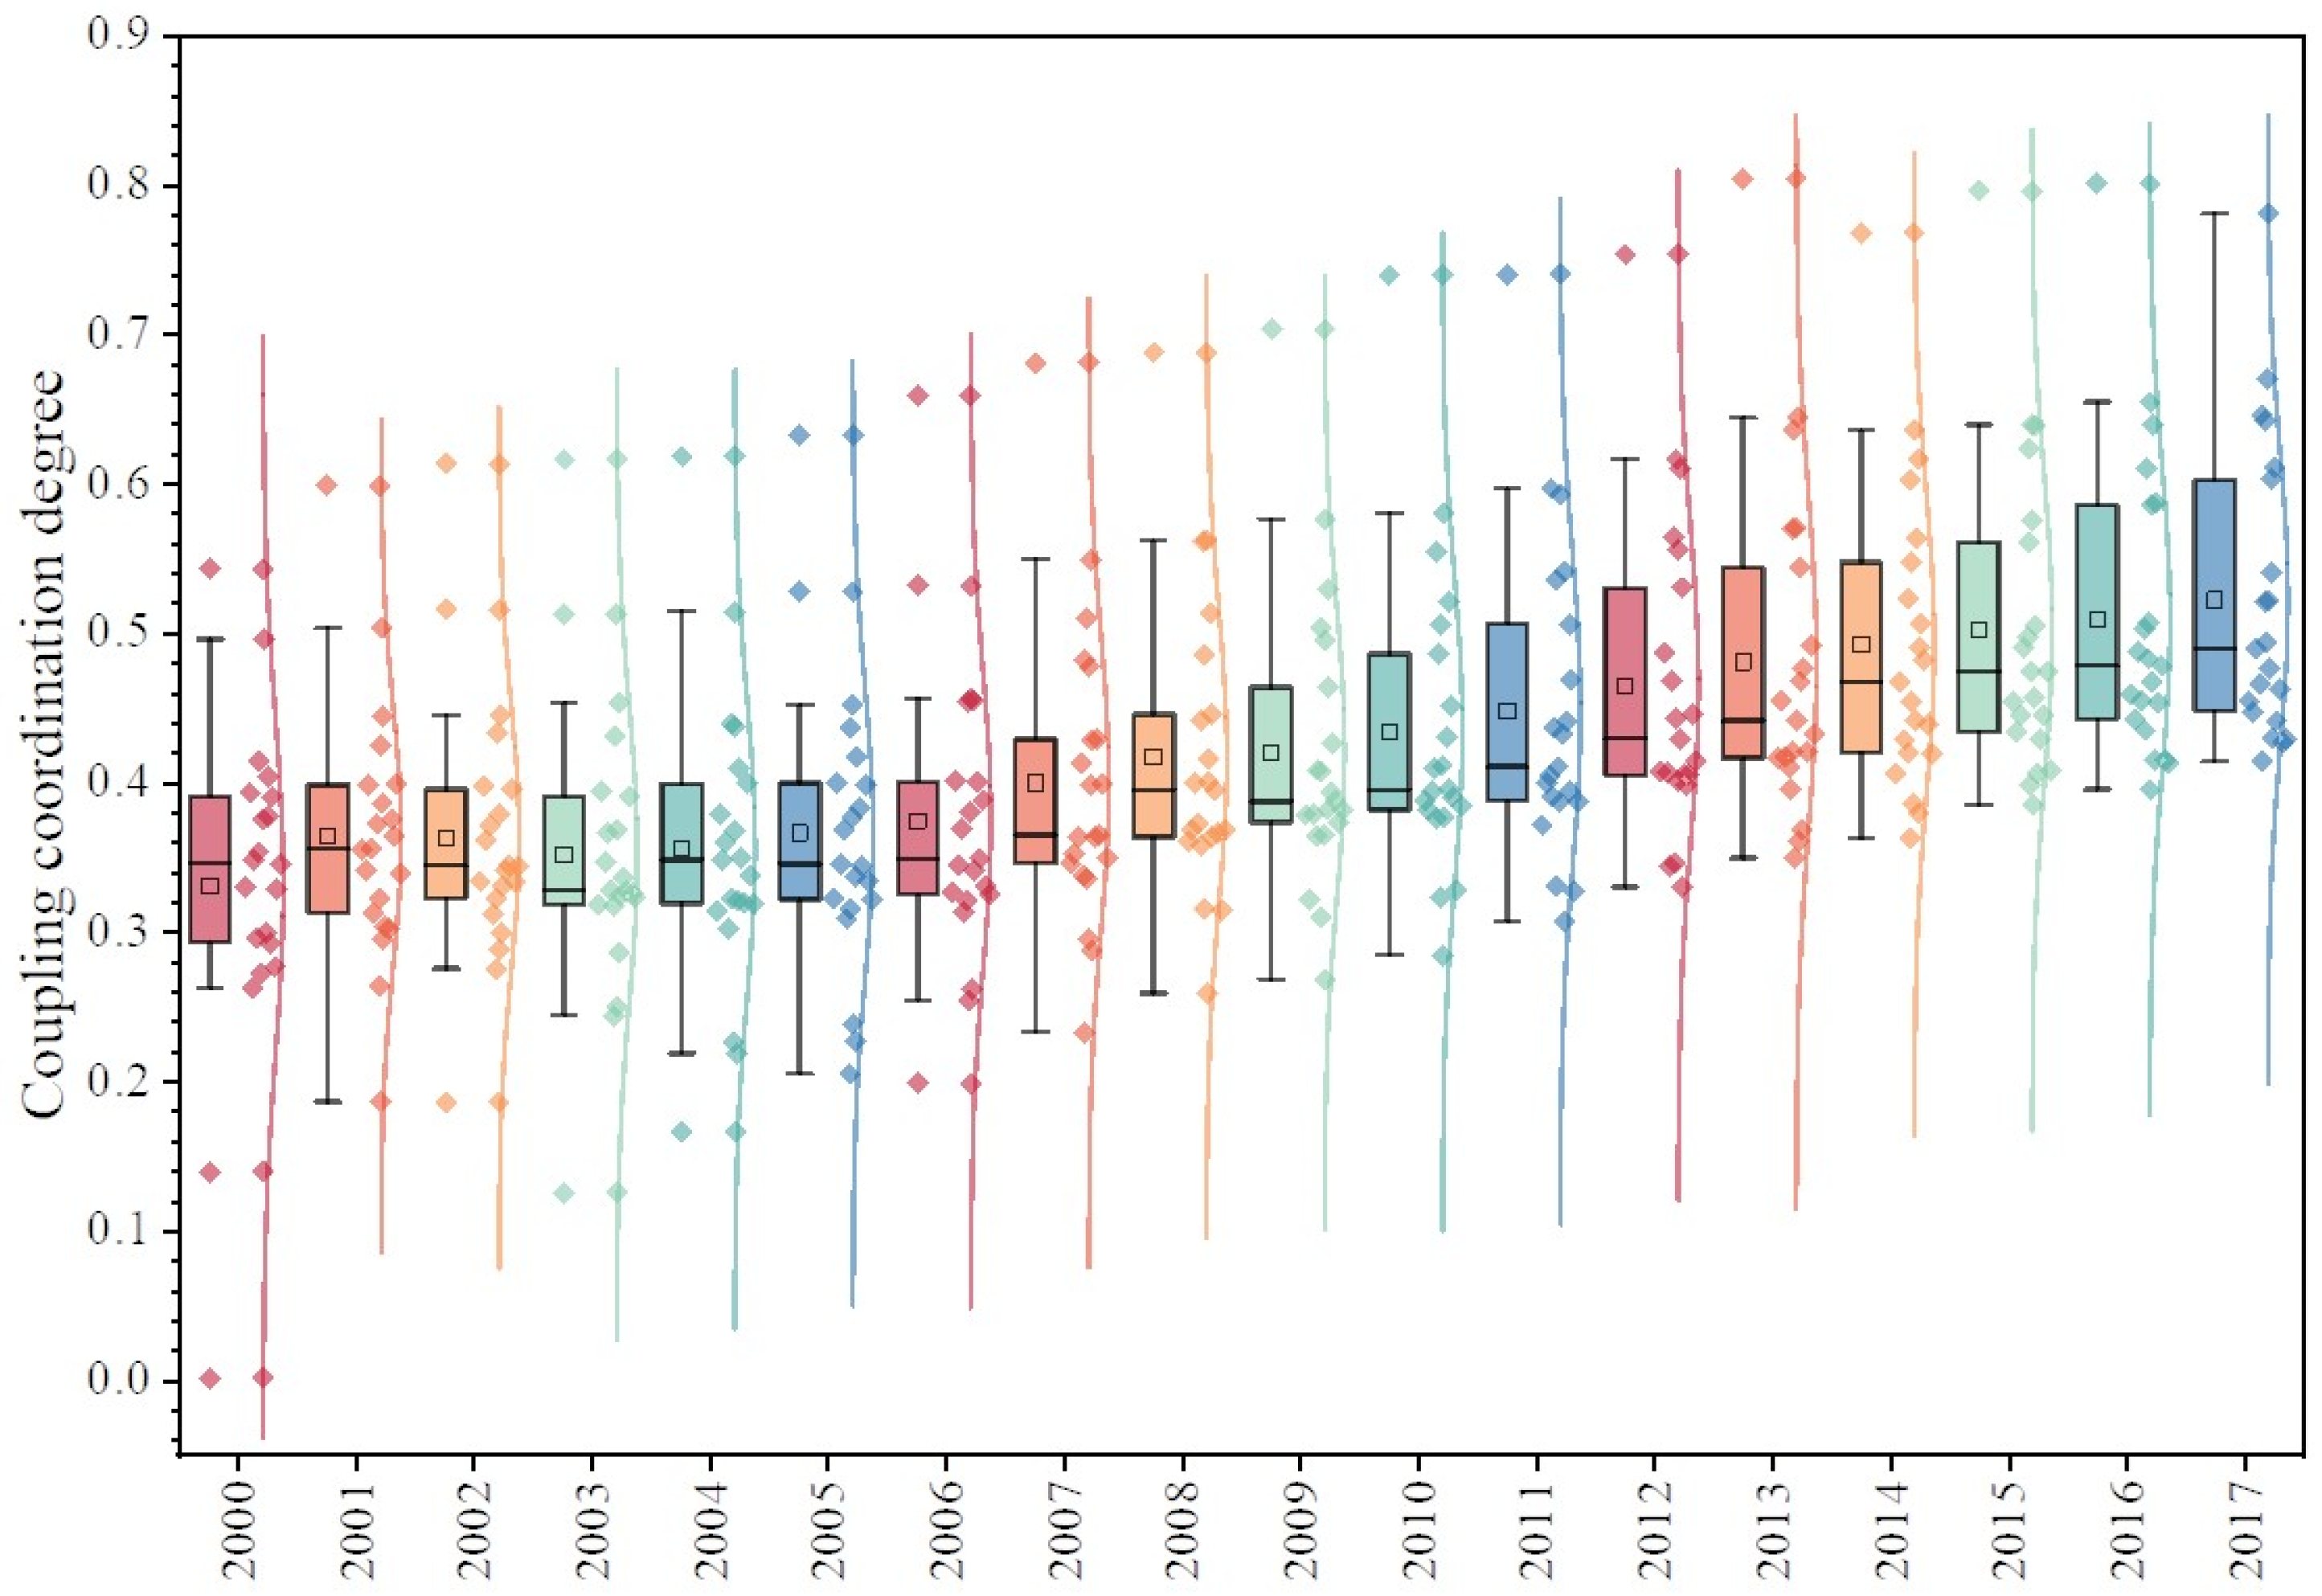
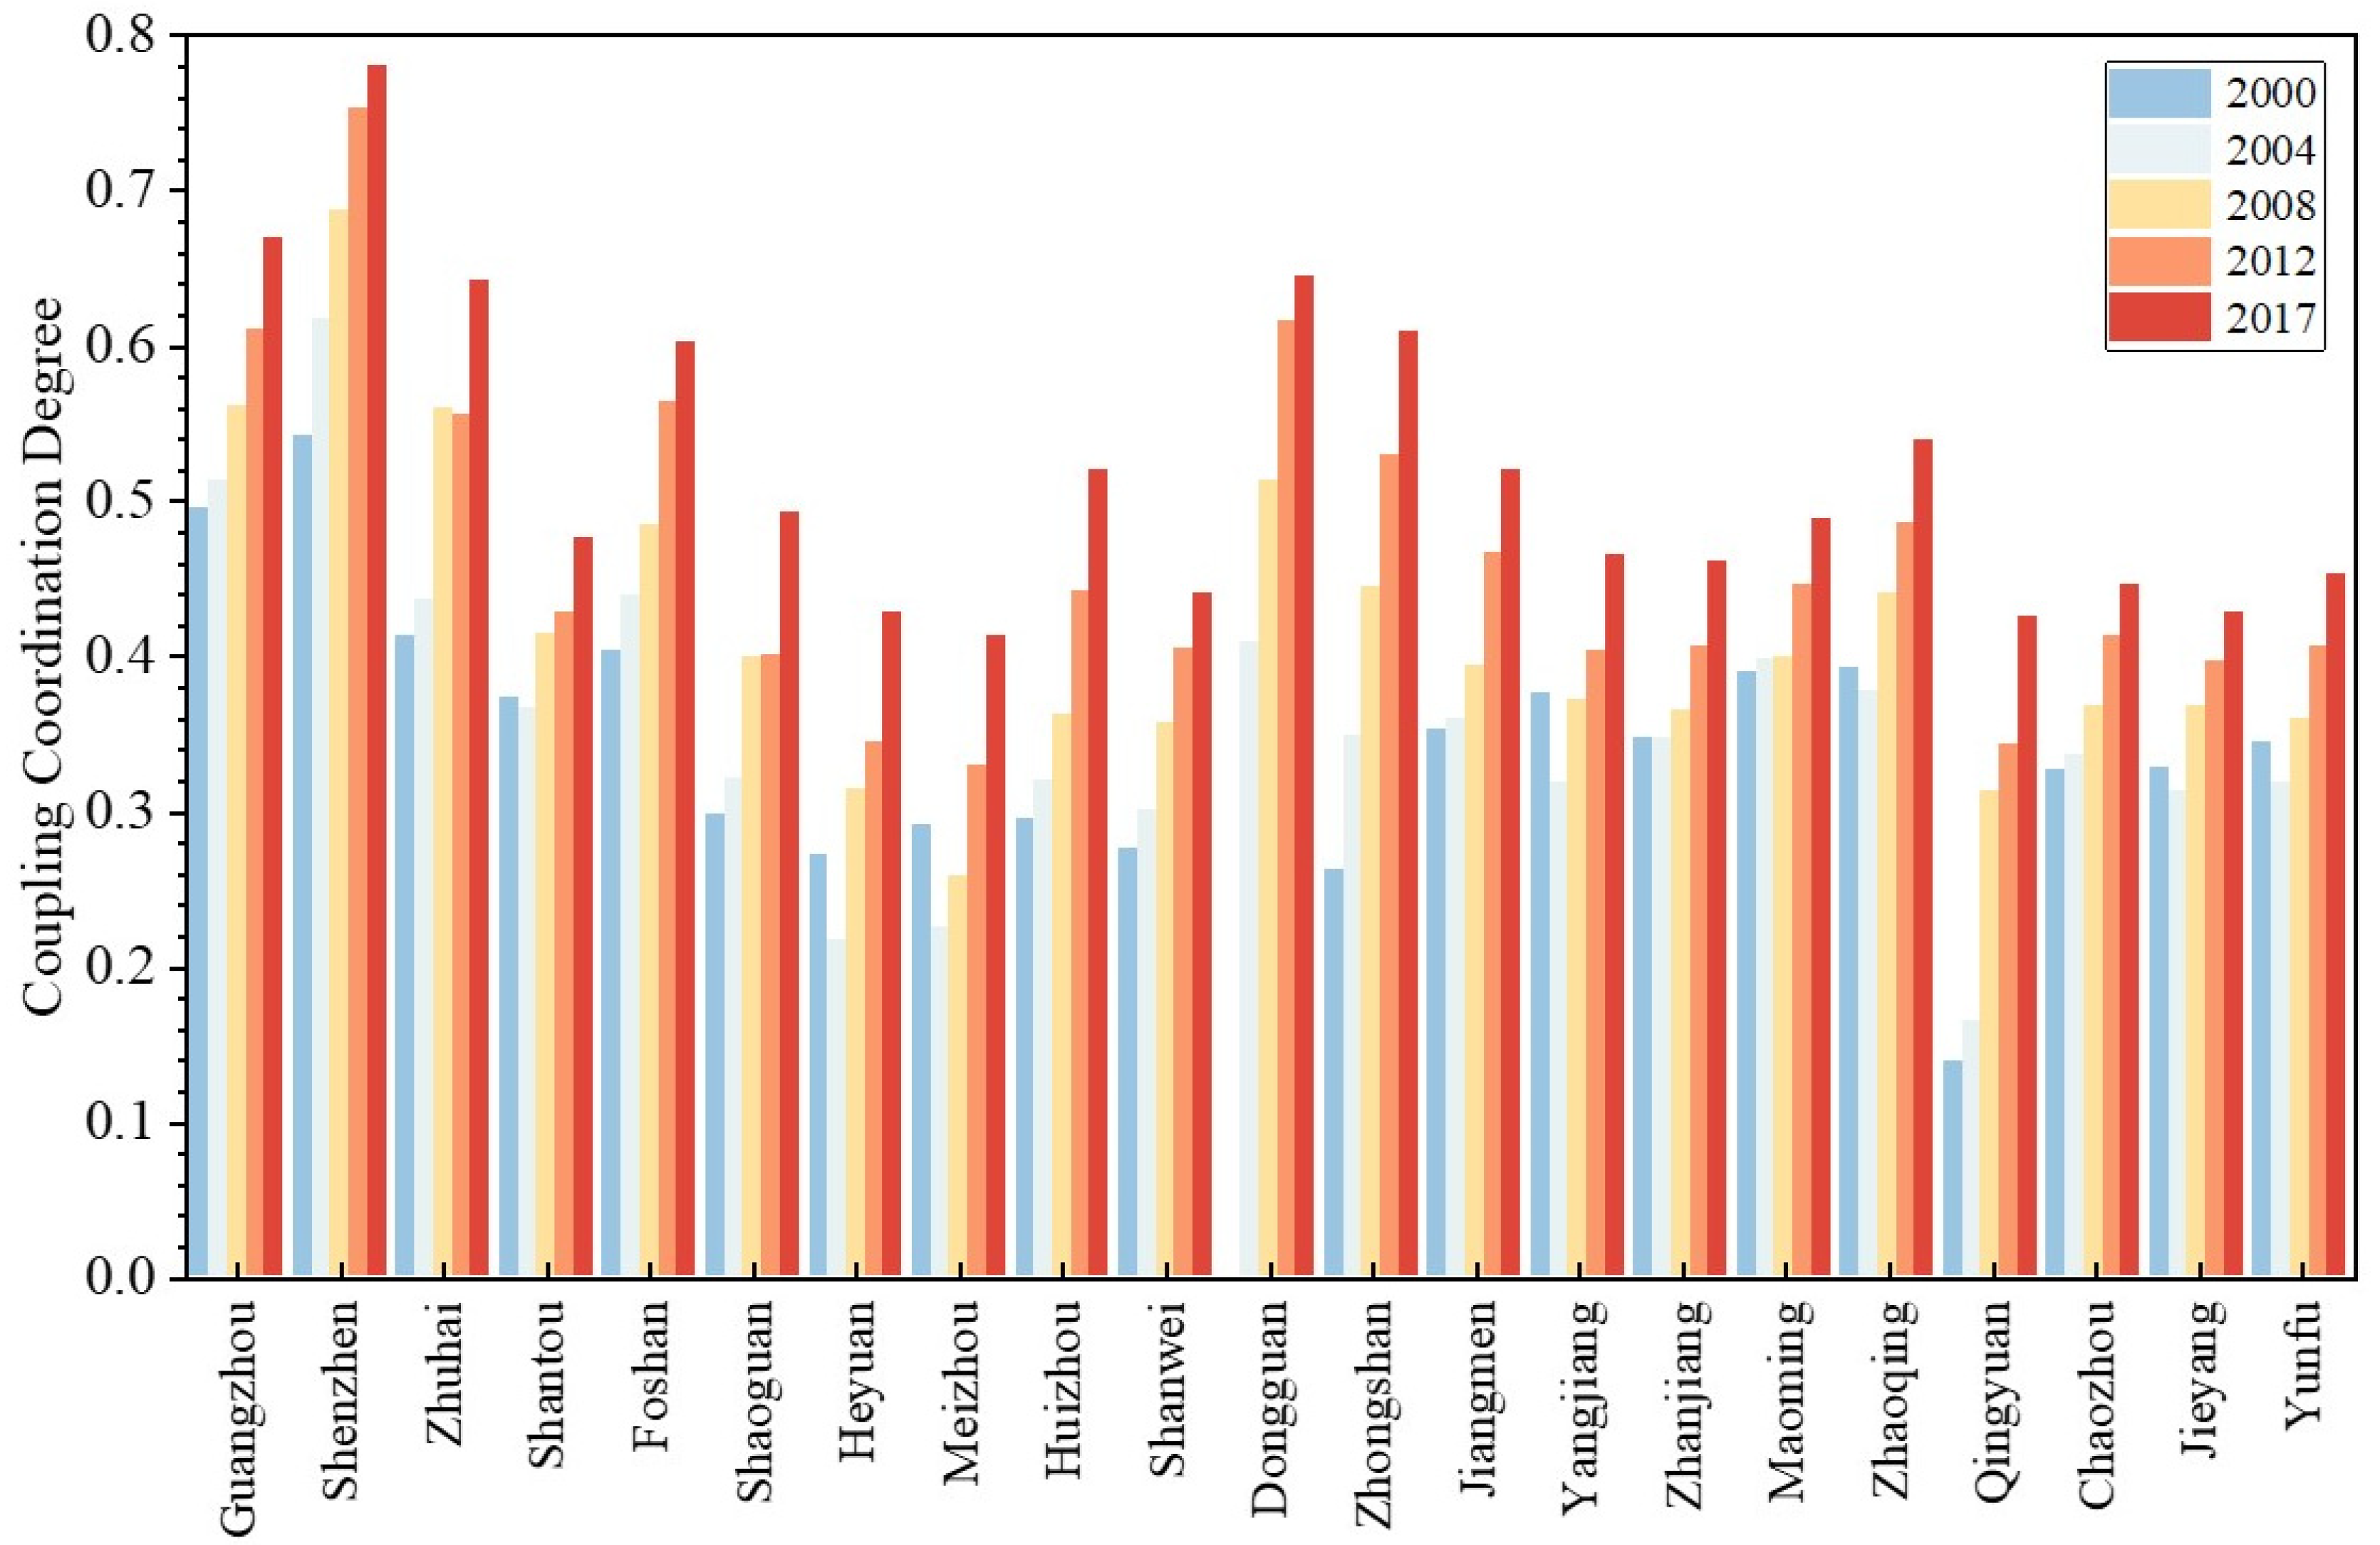
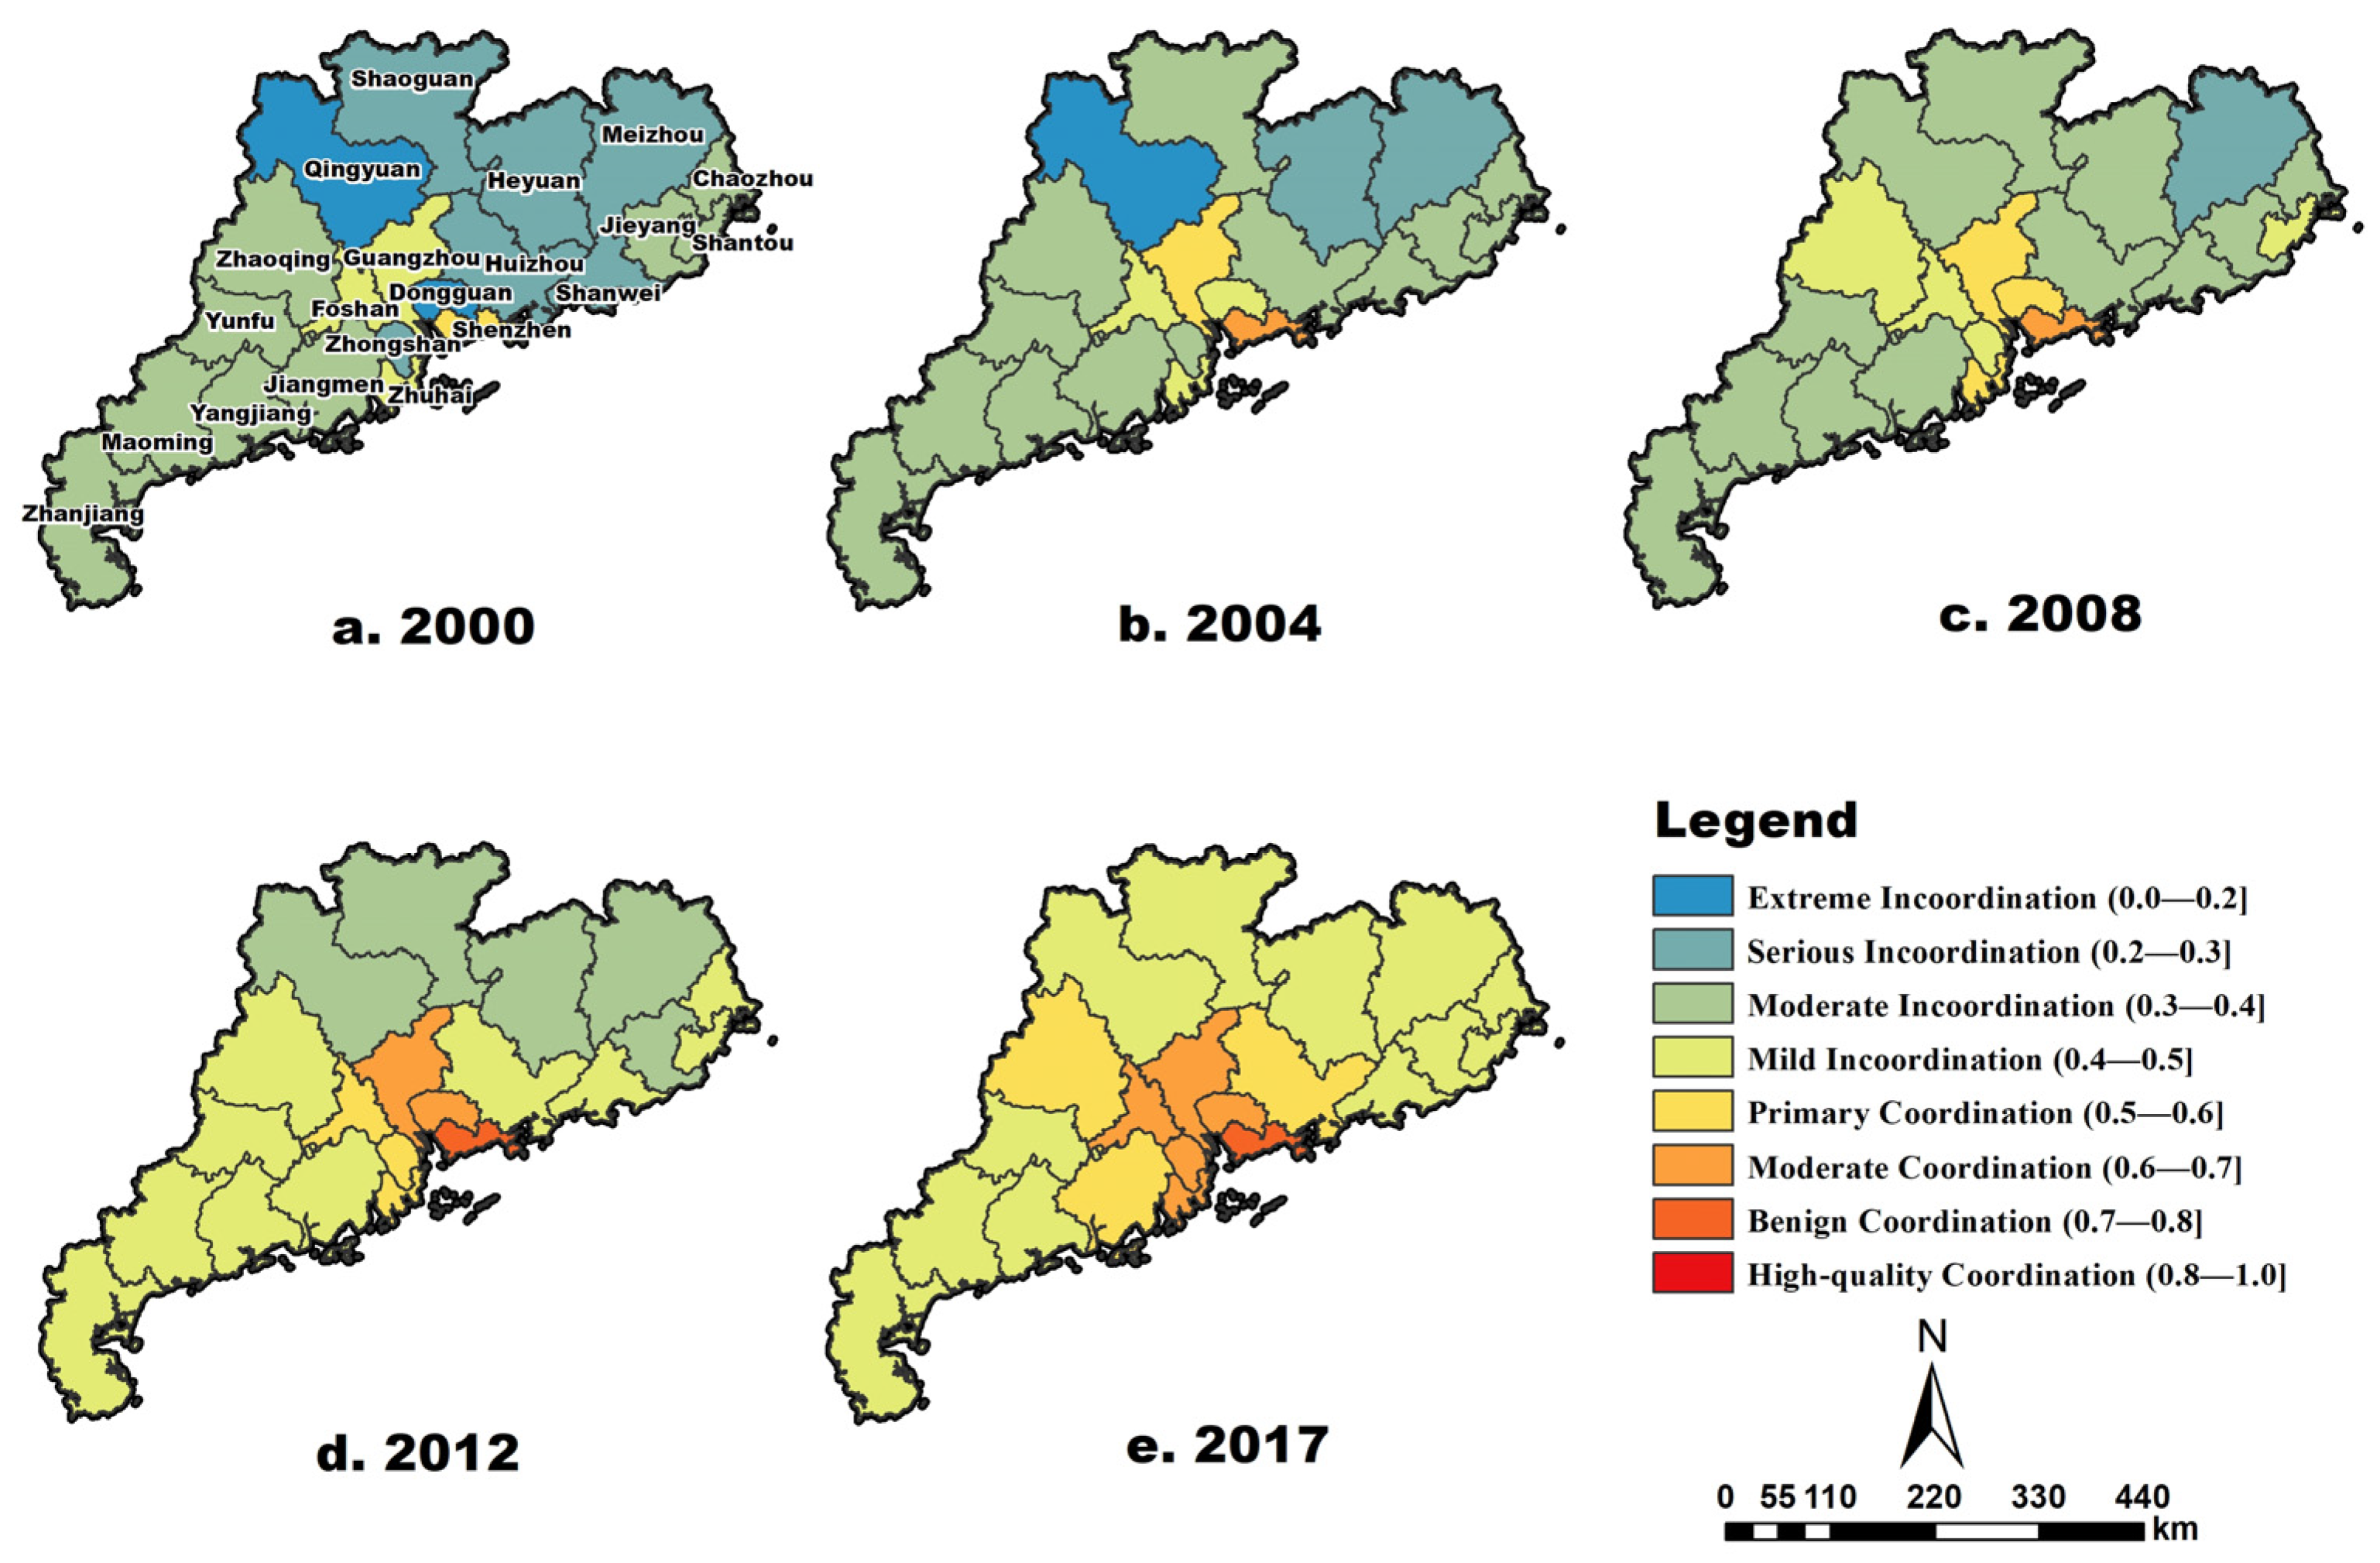
3.2. Spatial Patterns of Coupling Coordination Degree
3.3. Analysis of Influencing Factors
4. Discussion
5. Conclusions
Author Contributions
Funding
Data Availability Statement
Conflicts of Interest
| 1 | https://www.ceads.net/ (accessed on 22 October 2023). |
| 2 | The Fifth Plenary Session of the 18th Central Committee of the Communist Party of China (CPC) is a significant political meeting within the CPC’s organizational structure. This session took place in October 2015 and was a crucial event in China’s political calendar. During this meeting, China will set forth the country’s development goals and strategies for the following five years. The outcomes of the Fifth Plenary Session are encapsulated in the “13th Five-Year Plan,” which provided a comprehensive roadmap for China’s social, economic, and political development from 2016 to 2020. This plan included various policy initiatives and targets that covered areas such as economic growth, environmental protection, technological innovation, and social welfare. |
References
- Kim, H.; Choi, H.; Kang, H.; An, J.; Yeom, S.; Hong, T. A systematic review of the smart energy conservation system: From smart homes to sustainable smart cities. Renew. Sust. Energy Rev. 2021, 140, 110755. [Google Scholar] [CrossRef]
- Liu, Q.; Wang, S.; Zhang, W.; Li, J.; Kong, Y. Examining the effects of income inequality on CO2 emissions: Evidence from non-spatial and spatial perspectives. Appl. Energy 2019, 236, 163–171. [Google Scholar] [CrossRef]
- Wang, J.; Luo, X.; Zhu, J. Does the digital economy contribute to carbon emissions reduction? A city-level spatial analysis in China. Chin. J. Popul. Resour. Environ. 2022, 20, 105–114. [Google Scholar] [CrossRef]
- Chen, L.; Xu, L.; Cai, Y.; Yang, Z. Spatiotemporal patterns of industrial carbon emissions at the city level. Resour. Conserv. Recycl. 2021, 169, 105499. [Google Scholar] [CrossRef]
- Xia, F. On the concept of coupling, its modeling and measurement. J. Syst. Softw. 2000, 50, 75–84. [Google Scholar] [CrossRef]
- Kunz, N.C.; Moran, C.J.; Kastelle, T. Conceptualising “coupling” for sustainability implementation in the industrial sector: A review of the field and projection of future research opportunities. J. Clean. Prod. 2013, 53, 69–80. [Google Scholar] [CrossRef]
- Liu, J.; Wang, J.; Tan, G.; Sheng, Y.; Chang, H.; Xie, Q.; Liu, H. Correlation evaluation of functional corticomuscular coupling with abnormal muscle synergy after stroke. IEEE Trans. Biomed. Eng. 2021, 68, 3261–3272. [Google Scholar] [CrossRef]
- Fang, C.; Liu, H.; Li, G. International progress and evaluation on interactive coupling effects between urbanization and the eco-environment. J. Geogr. Sci. 2016, 26, 1081–1116. [Google Scholar] [CrossRef]
- An, S.; Zhang, S.; Hou, H.; Zhang, Y.; Xu, H.; Liang, J. Coupling coordination analysis of the ecology and economy in the Yellow River Basin under the background of high-quality development. Land 2022, 11, 1235. [Google Scholar] [CrossRef]
- Xin, Y.; Liu, X. Coupling driving factors of eco-environmental protection and high-quality development in the yellow river basin. Front. Environ. Sci. 2022, 10, 951218. [Google Scholar] [CrossRef]
- Beugelsdijk, S.; Klasing, M.J.; Milionis, P. Regional economic development in Europe: The role of total factor productivity. Reg. Stud. 2018, 52, 461–476. [Google Scholar] [CrossRef]
- Meng, C.; Du, X.; Ren, Y.; Shen, L.; Cheng, G.; Wang, J. Sustainable urban development: An examination of literature evolution on urban carrying capacity in the Chinese context. J. Clean. Prod. 2020, 277, 122802. [Google Scholar] [CrossRef]
- Yang, Y.; Su, X.; Yao, S. Nexus between green finance, fintech, and high-quality economic development: Empirical evidence from China. Resour. Policy 2021, 74, 102445. [Google Scholar] [CrossRef]
- Guo, B.; Wang, Y.; Zhang, H.; Liang, C.; Feng, Y.; Hu, F. Impact of the digital economy on high-quality urban economic development: Evidence from Chinese cities. Econ. Model. 2023, 120, 106194. [Google Scholar] [CrossRef]
- Chen, Y.; Zhu, M.; Lu, J.; Zhou, Q.; Ma, W. Evaluation of ecological city and analysis of obstacle factors under the background of high-quality development: Taking cities in the Yellow River Basin as examples. Ecol. Indic. 2020, 118, 106771. [Google Scholar] [CrossRef]
- Li, X.; Li, S.; Li, C.; Shi, J.; Wang, N. The impact of high-quality development on ecological footprint: An empirical research based on STIRPAT model. Ecol. Indic. 2023, 154, 110881. [Google Scholar] [CrossRef]
- Artmann, M.; Kohler, M.; Meinel, G.; Gan, J.; Ioja, I.C. How smart growth and green infrastructure can mutually support each other—A conceptual framework for compact and green cities. Ecol Indic. 2019, 96, 10–22. [Google Scholar] [CrossRef]
- Wang, A.; Wang, S.; Liang, S.; Yang, R.; Yang, M.; Yang, J. Research on Ecological Protection and High-Quality Development of the Lower Yellow River Based on System Dynamics. Water 2023, 15, 3046. [Google Scholar] [CrossRef]
- Hosseinzadeh, A.; Algomaiah, M.; Kluger, R.; Li, Z. E-scooters and sustainability: Investigating the relationship between the density of E-scooter trips and characteristics of sustainable urban development. Sustain. Cities Soc. 2021, 66, 102624. [Google Scholar] [CrossRef]
- Zhong, C.; Guo, H.; Swan, I.; Gao, P.; Yao, Q.; Li, H. Evaluating trends, profits, and risks of global cities in recent urban expansion for advancing sustainable development. Habitat Int. 2023, 138, 102869. [Google Scholar] [CrossRef]
- Steiniger, S.; Wagemann, E.; de la Barrera, F.; Molinos-Senante, M.; Villegas, R.; de la Fuente, H.; Barton, J.R. Localising urban sustainability indicators: The CEDEUS indicator set, and lessons from an expert-driven process. Cities 2020, 101, 102683. [Google Scholar] [CrossRef]
- Zhou, Y.; Liu, Y.; Wu, W.; Li, Y. Effects of rural–urban development transformation on energy consumption and CO2 emissions: A regional analysis in China. Renew. Sust. Energy Rev. 2015, 52, 863–875. [Google Scholar] [CrossRef]
- Li, K.; Lin, B. Impacts of urbanization and industrialization on energy consumption/CO2 emissions: Does the level of development matter? Renew. Sust. Energy Rev. 2015, 52, 1107–1122. [Google Scholar] [CrossRef]
- Dong, F.; Wang, Y.; Su, B.; Hua, Y.; Zhang, Y. The process of peak CO2 emissions in developed economies: A perspective of industrialization and urbanization. Resour. Conserv. Recycl. 2019, 141, 61–75. [Google Scholar] [CrossRef]
- Zheng, W.; Zhang, L.; Hu, J. Green credit, carbon emission and high quality development of green economy in China. Energy Rep. 2022, 8, 12215–12226. [Google Scholar] [CrossRef]
- Yu, Y.; Zhang, N. Low-carbon city pilot and carbon emission efficiency: Quasi-experimental evidence from China. Energ. Econ. 2016, 96, 105125. [Google Scholar] [CrossRef]
- Elfaki, K.E.; Khan, Z.; Kirikkaleli, D.; Khan, N. On the nexus between industrialization and carbon emissions: Evidence from ASEAN+ 3 economies. Environ. Sci. Pollut. Res. 2022, 29, 31476–31485. [Google Scholar] [CrossRef]
- Liu, M.; Hu, H. Carbon emissions, consumption structure upgrading, and high-quality economic development: Empirical evidence from China. J. Asia Pac. Econ. 2021, 26, 1–23. [Google Scholar] [CrossRef]
- Fan, L.; Liu, H.; Shao, Z.; Li, C. Panel data analysis of energy conservation and emission reduction on high-quality development of logistics industry in Yangtze River Delta of China. Environ. Sci. Pollut. Res. 2022, 29, 78361–78380. [Google Scholar] [CrossRef]
- Hanif, I.; Raza, S.M.F.; Gago-de-Santos, P.; Abbas, Q. Fossil fuels, foreign direct investment, and economic growth have triggered CO2 emissions in emerging Asian economies: Some empirical evidence. Energy 2019, 171, 493–501. [Google Scholar] [CrossRef]
- Wahba, S.; Kamil, B.; Nassar, K.; Abdelsalam, A. Green envelop impact on reducing air temperature and enhancing outdoor thermal comfort in arid climates. Civ. Eng. J. 2019, 5, 1124–1135. [Google Scholar] [CrossRef]
- Pan, H.; Page, J.; Zhang, L.; Cong, C.; Ferreira, C.; Jonsson, E.; Kalantari, Z. Understanding interactions between urban development policies and GHG emissions: A case study in Stockholm Region. Ambio 2020, 49, 1313–1327. [Google Scholar] [CrossRef] [PubMed]
- Wang, Y.; Li, L.; Kubota, J.; Han, R.; Zhu, X.; Lu, G. Does urbanization lead to more carbon emission? Evidence from a panel of BRICS countries. Appl. Energy 2016, 168, 375–380. [Google Scholar] [CrossRef]
- Chen, X.; Di, Q.; Jia, W.; Hou, Z. Spatial correlation network of pollution and carbon emission reductions coupled with high-quality economic development in three Chinese urban agglomerations. Sustain. Cities Soc. 2023, 94, 104552. [Google Scholar] [CrossRef]
- Zhang, Q.; Li, J.; Li, Y.; Huang, H. Coupling analysis and driving factors between carbon emission intensity and high-quality economic development: Evidence from the Yellow River Basin, China. J. Clean. Prod. 2023, 423, 138831. [Google Scholar] [CrossRef]
- Zhang, Y.; Li, Y.; Wei, Y. Understanding the relation between the socio-economic development and CO2 emission of 76 contracting countries in The Paris Agreement. Environ. Dev. Sustain. 2023, 25, 14131–14153. [Google Scholar] [CrossRef]
- Wang, Y.; Zhang, X.; Kubota, J.; Zhu, X.; Lu, G. A semi-parametric panel data analysis on the urbanization-carbon emissions nexus for OECD countries. Renew. Sustain. Energy Rev. 2015, 48, 704–709. [Google Scholar] [CrossRef]
- Huang, J.; Na, Y.; Guo, Y. Spatiotemporal characteristics and driving mechanism of the coupling coordination degree of urbanization and ecological environment in Kazakhstan. J. Geogr. Sci. 2020, 30, 1802–1824. [Google Scholar] [CrossRef]
- Duan, H.; Sun, X.; Song, J.; Xing, J.; Yang, W. Peaking carbon emissions under a coupled socioeconomic-energy system: Evidence from typical developed countries. Resour. Conserv. Recycl. 2022, 187, 106641. [Google Scholar] [CrossRef]
- Jiang, J.; Zhu, S.; Wang, W.; Li, Y.; Li, N. Coupling coordination between new urbanisation and carbon emissions in China. Sci. Total Environ. 2022, 850, 158076. [Google Scholar] [CrossRef]
- Cui, C.; Cai, B.; Bin, G.; Wang, Z. Decennary spatial pattern changes and scaling effects of CO2 emissions of urban agglomerations in China. Cities 2020, 105, 102818. [Google Scholar] [CrossRef]
- Yang, W.; Feng, L.; Wang, Z.; Fan, X. Carbon Emissions and National Sustainable Development Goals Coupling Coordination Degree Study from a Global Perspective: Characteristics, Heterogeneity, and Spatial Effects. Sustainability 2023, 15, 9070. [Google Scholar] [CrossRef]
- Chontanawat, J. Decomposition analysis of CO2 emission in ASEAN: An extended IPAT model. Energy Procedia 2018, 153, 186–190. [Google Scholar] [CrossRef]
- Chu, H.; Liu, M.; Wang, M.; Qie, X.; Ning, Y. Measurement and analysis of the comprehensive emission intensity and coupling coordination relationship of carbon dioxide emissions and pollutant emissions in the Yangtze River Delta Urban Agglomeration. Atmos. Pollut. Res. 2023, 14, 101897. [Google Scholar] [CrossRef]
- Ren, H.; Ou, X.; Zhu, H. Spatial characteristics and coupling coordination between carbon emission efficiency and industrial structure in three metropolitan areas of Jiangsu Province, China. Sci Progress 2023, 106, 00368504231176146. [Google Scholar] [CrossRef]
- Huang, X.; Cai, B.; Li, Y. Evaluation index system and measurement of high-quality development in China. Rev. Cercet. Interv. Soc. 2020, 68, 163. [Google Scholar] [CrossRef]
- Asian Development Bank. The 14th Five-Year Plan of the People’s Republic of China—Fostering High-Quality Development; Asian Development Bank: Mandaluyong, Philippines, 2021. [Google Scholar]
- Luo, G.; Guo, J.; Yang, F.; Wang, C. Environmental regulation, green innovation and high-quality development of enterprise: Evidence from China. J. Clean. Prod. 2023, 418, 138112. [Google Scholar] [CrossRef]
- Gan, W.; Yao, W.; Huang, S. Evaluation of green logistics efficiency in Jiangxi Province based on Three-Stage DEA from the perspective of high-quality development. Sustainability 2022, 14, 797. [Google Scholar] [CrossRef]
- Bei, J. Study on the “high-quality development” economics. China Political Econ. 2018, 1, 163–180. [Google Scholar] [CrossRef]
- Liu, C.; Sun, W.; Li, P. Characteristics of spatiotemporal variations in coupling coordination between integrated carbon emission and sequestration index: A case study of the Yangtze River Delta, China. Ecol. Indic. 2022, 135, 108520. [Google Scholar] [CrossRef]
- He, J.; Wang, S.; Liu, Y.; Ma, H.; Liu, Q. Examining the relationship between urbanization and the eco-environment using a coupling analysis: Case study of Shanghai, China. Ecol. Indic. 2017, 77, 185–193. [Google Scholar] [CrossRef]
- Wu, R.M.; Zhang, Z.; Yan, W.; Fan, J.; Gou, J.; Liu, B.; Wang, Y. A comparative analysis of the principal component analysis and entropy weight methods to establish the indexing measurement. PLoS ONE 2022, 17, e0262261. [Google Scholar] [CrossRef] [PubMed]
- Wu, R.M. Which objective weight method is better: PCA or entropy? Sci. J. Res. Rev. 2022, 3, 1–4. [Google Scholar] [CrossRef]
- Ziarh, G.F.; Asaduzzaman, M.; Dewan, A.; Nashwan, M.S.; Shahid, S. Integration of catastrophe and entropy theories for flood risk mapping in peninsular Malaysia. J. Flood Risk Manag. 2021, 14, e12686. [Google Scholar] [CrossRef]
- Hong, J.-H.; Su, Z.L.-T.; Lu, E.H.-C. Spatial perspectives toward the recommendation of remote sensing images using the INDEX indicator, based on principal component analysis. Remote Sens. 2020, 12, 1277. [Google Scholar] [CrossRef]
- Yang, C.; Zeng, W.; Yang, X. Coupling coordination evaluation and sustainable development pattern of geo-ecological environment and urbanization in Chongqing municipality, China. Sustain. Cities Soc. 2020, 61, 102271. [Google Scholar] [CrossRef]
- Sun, C.; Hao, S.; Zhao, L. Spatial-temporal differentiation characteristics of water resources-energy-food nexus system efficiency in China. Water Resour. Prot. 2021, 37, 61–68. [Google Scholar]
- Qiu, Y.; Jia, S.; Liao, J.; Yang, X. Evaluation of urban high quality development level based on entropy weight-TOPSIS two step method. J. Econ. Anal. 2022, 1, 50–65. [Google Scholar] [CrossRef]
- Chen, Z.; Zhuansun, G. Study on Coupling Coordination between Sci-Tech Innovation and High-Quality Economic Development in the Guangdong-Hong Kong-Macao Greater Bay Area. Front. Econ. China 2022, 17, 615–642. [Google Scholar]
- Zhou, T.; Ding, R.; Du, Y.; Zhang, Y.; Cheng, S.; Zhang, T. Study on the coupling coordination and spatial correlation effect of green finance and high-quality economic development—Evidence from China. Sustainability 2022, 14, 3137. [Google Scholar] [CrossRef]
- Yang, Z.; Wu, Y.; Wang, F.; Chen, A.; Wang, Y. Spatial-temporal differences and influencing factors of coupling coordination between urban quality and technology innovation in the Guangdong-Hong Kong-Macao Greater Bay Area. PLoS ONE 2023, 18, e0289988. [Google Scholar] [CrossRef] [PubMed]
- Xu, X.; Huang, G.; Liu, L.; Guan, Y.; Zhai, M.; Li, Y. Revealing dynamic impacts of socioeconomic factors on air pollution changes in Guangdong Province, China. Sci. Total Environ. 2020, 699, 134178. [Google Scholar] [CrossRef] [PubMed]
- Wang, F.; Wang, C.; Su, Y.; Jin, L.; Wang, Y.; Zhang, X. Decomposition analysis of carbon emission factors from energy consumption in Guangdong Province from 1990 to 2014. Sustainability 2017, 9, 274. [Google Scholar] [CrossRef]
- Zhang, J.; Zhang, N.; Bai, S. Assessing the carbon emission changing for sustainability and high-quality economic development. Environ. Technol. Inno. 2021, 22, 101464. [Google Scholar] [CrossRef]
- Dou, J.; Han, X. How does the industry mobility affect pollution industry transfer in China: Empirical test on Pollution Haven Hypothesis and Porter Hypothesis. J. Clean. Prod. 2019, 217, 105–115. [Google Scholar] [CrossRef]
- Zhao, S.; Cao, Y.; Feng, C.; Guo, K.; Zhang, J. How do heterogeneous RD investments affect China’s green productivity: Revisiting the Porter hypothesis. Sci. Total Environ. 2022, 825, 154090. [Google Scholar] [CrossRef]
- Shi, T.; Yang, S.; Zhang, W.; Zhou, Q. Coupling coordination degree measurement and spatiotemporal heterogeneity between economic development and ecological environment----Empirical evidence from tropical and subtropical regions of China. J. Clean. Prod. 2020, 244, 118739. [Google Scholar] [CrossRef]
- Zhou, Y.; Shan, Y.; Liu, G.; Guan, D. Emissions and low-carbon development in Guangdong-Hong Kong-Macao Greater Bay Area cities and their surroundings. Appl. Energy 2018, 228, 1683–1692. [Google Scholar] [CrossRef]
- Cheng, X.; Long, R.; Chen, H.; Li, Q. Coupling coordination degree and spatial dynamic evolution of a regional green competitiveness system–A case study from China. Ecol. Indic. 2019, 104, 489–500. [Google Scholar] [CrossRef]
- Dong, G.; Ge, Y.; Zhu, W.; Qu, Y.; Zhang, W. Coupling coordination and spatiotemporal dynamic evolution between green urbanization and green finance: A case study in China. Front. Environ. Sci. 2021, 8, 621846. [Google Scholar] [CrossRef]
- Wu, M.; Wu, J.; Zang, C. A comprehensive evaluation of the eco-carrying capacity and green economy in the Guangdong-Hong Kong-Macao Greater Bay Area, China. J. Clean. Prod. 2021, 281, 124945. [Google Scholar] [CrossRef]
- Xu, F.; Wang, B.; Zhao, X.; Yun, J.; Zhang, S.; Wang, H.; Yang, Y. Thoughts and suggestions on promoting high quality development of China’s CBM business under the goal of “double carbon”. China Pet. Explor. 2021, 26, 9. [Google Scholar]
- Tang, H.L.; Liu, J.M.; Wu, J.G. The impact of command-and-control environmental regulation on enterprise total factor productivity: A quasi-natural experiment based on China’s “Two Control Zone” policy. J Clean Prod. 2020, 254, 120011. [Google Scholar] [CrossRef]

| Dimensions | Variables | Description | Unit | Properties |
|---|---|---|---|---|
| Innovation | R&D personnel input intensity | Number of R&D employed persons/Number of employed persons | % | + |
| R&D funding input intensity | R&D expenditure/GDP | % | + | |
| Scientific and technological expenditure intensity | Financial expenditure on science and technology/General public budget expenditure | % | + | |
| Coordination | Per capita GDP | GDP/Permanent population | Ten thousand CNY | + |
| Share of the secondary industry’s added value in GDP | Secondary industry’s added value/GDP | % | - | |
| Share of the tertiary industry’s added value in GDP | Tertiary industry’s added value/GDP | % | + | |
| Green | Industrial SO2 emission intensity | Volume of industrial sulfur dioxide emission/GDP | % | - |
| Industrial soot emission intensity | Volume of industrial soot emission/GDP | % | - | |
| Rate of harmless disposal of domestic waste | Quantity of harmless disposal of domestic waste/Total volume of domestic waste | % | + | |
| Rate of solid wastes comprehensively utilized | Volume of solid wastes comprehensively utilized */Volume of industrial solid wastes produced and comprehensively utilized in previous years | % | + | |
| Openness | Share of actual utilization of foreign capital in GDP | Actual utilization of foreign capital/GDP | % | + |
| Number of international internet users per 100 people | Number of international internet users/Permanent population | Households per 100 people | + | |
| Sharing | Education expenditure intensity | Financial expenditure on education/General public budget expenditure | % | + |
| Number of books per person | Number of books in public libraries/Permanent population | Books per 100 people | + | |
| Number of beds per ten thousand persons | Number of beds/Permanent population | Per 10,000 people | + | |
| Share of registered unemployed persons in urban area at the year-end of total population at the year-end | Registered unemployed persons in urban area at the year-end/Total population at the year-end | % | - |
| First-Level Indicators | Second-Level Indicators | Description | Units |
|---|---|---|---|
| Technology development (TECH) | Human capital (TECH1) | Number of university students per 10,000 people | / |
| Technology expenditure intensity (TECH2) | Technology expenditure/GDP | % | |
| Environmental governance (ENVI) | Qualified amount of industrial waste water (ENVI1) | / | Ten thousand tons |
| Percentage of municipal sewage disposal (ENVI2) | Volume of municipal sewage disposal/Total wastewater discharge | % | |
| Economic development (ECO) | Proportion of fixed asset investment (ECO1) | Amount of fixed asset investment/GDP | % |
| Number of employed persons at the year-end (ECO2) | / | Ten thousand persons | |
| Financial efficiency (ECO3) | Loans in financial institutes at the year-end/Deposits in financial institutes at the year-end | / | |
| Population density (ECO4) | Permanent population/Land area | Thousand persons/sq.km |
| Range of D Value | Stages | Range of D Value | Stages |
|---|---|---|---|
| 0.0~0.2 | Extreme Incoordination | 0.5~0.6 | Primary Coordination |
| 0.2~0.3 | Serious Incoordination | 0.6~0.7 | Moderate Coordination |
| 0.3~0.4 | Moderate Incoordination | 0.7~0.8 | Benign Coordination |
| 0.4~0.5 | Mild Incoordination | 0.8~1.0 | High-quality Coordination |
| Year | Moran’s I | E(I) | Z | P |
|---|---|---|---|---|
| 2000 | −0.363 | −0.05 | −2.115 | 0.034 |
| 2001 | −0.192 | −0.05 | −0.938 | 0.348 |
| 2002 | −0.086 | −0.05 | −0.238 | 0.812 |
| 2003 | −0.02 | −0.05 | 0.197 | 0.844 |
| 2004 | 0.137 | −0.05 | 1.226 | 0.22 |
| 2005 | 0.203 | −0.05 | 1.661 | 0.097 |
| 2006 | 0.259 | −0.05 | 2.05 | 0.04 |
| 2007 | 0.312 | −0.05 | 2.383 | 0.017 |
| 2008 | 0.254 | −0.05 | 1.977 | 0.048 |
| 2009 | 0.321 | −0.05 | 2.462 | 0.014 |
| 2010 | 0.342 | −0.05 | 2.63 | 0.009 |
| 2011 | 0.367 | −0.05 | 2.711 | 0.007 |
| 2012 | 0.404 | −0.05 | 2.932 | 0.003 |
| 2013 | 0.427 | −0.05 | 3.15 | 0.002 |
| 2014 | 0.443 | −0.05 | 3.184 | 0.001 |
| 2015 | 0.439 | −0.05 | 3.211 | 0.001 |
| 2016 | 0.464 | −0.05 | 3.379 | 0.001 |
| 2017 | 0.476 | −0.05 | 3.339 | 0.001 |
| Variables | OLS | SAR |
|---|---|---|
| TECH | 0.595 *** (0.078) | 0.631 *** (8.240) |
| ENVI | 2.827 *** (0.197) | 2.025 *** (5.430) |
| ECO | 2.979 *** (0.179) | 2.818 *** (14.190) |
| _cons | 0.184 *** (0.009) | |
| ρ | −0.125 (−1.770) | |
| R2 | 0.737 | 0.723 |
| LM-spatiallag | 4.338 ** | |
| Robust LM-spatiallag | 4.547 ** | |
| LM-spatialerror | 0.005 | |
| Robust LM-spatialerror | 0.214 | |
| LR-spatiallag | 32.980 *** | |
| LR-spatialerror | 26.780 *** | |
| Hausman test | −66.2 | |
Disclaimer/Publisher’s Note: The statements, opinions and data contained in all publications are solely those of the individual author(s) and contributor(s) and not of MDPI and/or the editor(s). MDPI and/or the editor(s) disclaim responsibility for any injury to people or property resulting from any ideas, methods, instructions or products referred to in the content. |
© 2023 by the authors. Licensee MDPI, Basel, Switzerland. This article is an open access article distributed under the terms and conditions of the Creative Commons Attribution (CC BY) license (https://creativecommons.org/licenses/by/4.0/).
Share and Cite
Yang, X.; Liang, J.; Wang, S. Spatial–Temporal Evolution and Driving Factors of Coupling Coordination between High-Quality Urban Development and Carbon Emissions Intensity in Guangdong Province. Land 2023, 12, 2082. https://doi.org/10.3390/land12112082
Yang X, Liang J, Wang S. Spatial–Temporal Evolution and Driving Factors of Coupling Coordination between High-Quality Urban Development and Carbon Emissions Intensity in Guangdong Province. Land. 2023; 12(11):2082. https://doi.org/10.3390/land12112082
Chicago/Turabian StyleYang, Xiaoning, Junyi Liang, and Shaojian Wang. 2023. "Spatial–Temporal Evolution and Driving Factors of Coupling Coordination between High-Quality Urban Development and Carbon Emissions Intensity in Guangdong Province" Land 12, no. 11: 2082. https://doi.org/10.3390/land12112082