1. Introduction
With the acceleration of urbanization and the continuous growth of the population, China’s cultivated land resources are facing an increasingly tense situation [
1]. Traditional cultivated land management methods are becoming increasingly inadequate in the current technological and economic contexts. Considering this, the application and research of artificial intelligence (AI) in intelligent agricultural systems can provide valuable insights for cultivated land management.
In this study, we integrated AI technology to address the pressing challenges of cultivated land management in China. AI has proven its potential in optimizing resource allocation, crop monitoring, and decision-making processes in agriculture. By harnessing the power of AI, farmers can make more informed choices, leading to increased crop yields and reduced resource wastage. This interdisciplinary approach not only enhances productivity but also contributes to the conservation of valuable cultivated land resources, ultimately benefiting farmers and the nation as a whole.
Historically, China’s responsibilities and compensation mechanisms for cultivated land preservation have primarily focused on safeguarding the fundamental rights of farmers, ensuring they possess sufficient land for agricultural production [
2]. However, with the evolution of the economy and the advent of technologies such as AI, which can be applied to aspects such as land optimization and crop forecasting, there is a potential to reshape conventional land management and allocation methodologies [
3]. Such advancements might aid in the more efficient and scientific utilization of land, reduce waste, and enhance yield outputs.
At present, the applications of AI in agriculture encompass but are not limited to soil quality detection, climate forecasting, pest and disease detection and prevention, and crop-planting recommendations. These technological interventions offer substantial assistance in addressing China’s current cultivated land dilemmas: strategies optimized through AI can achieve higher yields on limited land; AI-driven weather predictions enable farmers to prepare in advance, reducing weather-induced losses; and soil testing facilitates more rational land resource allocation and utilization.
Nevertheless, relying solely on technology will not resolve all challenges, and striking a balance between technology and traditional land management [
4], ensuring not only higher outputs but also safeguarding the interests of farmers and ensuring the sustainability of the ecosystem and environment, presents a formidable task [
5].
Considering the above, we investigated how the application and research of artificial intelligence (AI) in agriculture can contribute to refining China’s cultivated land management strategies. This objective arose from the dual challenge of meeting the escalating demands for food while ensuring ecological sustainability. Our primary aims of this paper can be delineated as follows:
(1) Focusing on provincial regions as the research subject and incorporating the perspective of AI-driven analytics, we extensively explored the quest for fairness in the management of cultivated land responsibilities and compensation mechanisms at the provincial level. We sought to elucidate how AI can optimize allocation and management practices, thereby ensuring the equitable distribution of responsibilities and compensation among provinces.
(2) By employing AI-driven forecasting for cultivated land productivity and calculating the ecological carrying capacity of cultivated land, we endeavored to analyze food security and ecological safety at the provincial level. Through these analyses, we aimed to establish the minimum needed amount of cultivated land that each province should maintain, thereby ensuring both food and ecological security.
(3) Employing the opportunity cost method bolstered by AI algorithms, we calculated the standard for compensation concerning cultivated land conservation at the provincial level. The intention was to provide a scientific foundation for the formulation and adjustment of cultivated land protection policies in the new era, ensuring their effectiveness and equity. This approach seeks to align cultivated land protection policies with contemporary challenges and technological advancements, fostering a balance between efficiency and fairness.
3. Research Framework and Methods
The theory of fairness and justice posits that society should be guided by the principles of fairness and justice, ensuring the equitable distribution of resources and benefits and providing every individual with equal opportunities and rights to pursue their own happiness [
26]. In the context of cultivated land protection, it is crucial to address the potential issues of generating excessive profits or losses, which may lead to imbalances for landowners. Furthermore, the surplus areas of cultivated land conservation play a crucial role in providing ecosystem services and ensuring food security for deficit areas. By preserving cultivated land, these surplus areas sacrifice the opportunities and space available for local governments, organizations, and individuals to engage in nonagricultural construction. These areas also give up the potential maximum opportunity cost that could be attained by converting cultivated land to other land uses [
27]. The country accounts for various factors in the planning process, such as the quality of cultivated land resources, population size, and economic development requirements. In the allocation of cultivated land resources, a policy of bias has been implemented, allowing areas with better quality and production conditions to focus on economic development, while areas with poorer quality and production conditions bear greater responsibility for cultivated land protection. However, this allocation policy has led to an unfair phenomenon of regional cultivated land protection responsibility to some extent. To address this, the determination of the minimum amount of responsibility ownership of cultivated land in each province is based on the principles of fairness and justice. This ensures that cultivated land resources in each province are protected and used reasonably, thus avoiding unfair resource utilization arising from regional disparities.
In this study, the amount of cultivated land is divided into three categories: actual ownership, planned ownership, and responsibility ownership. The actual ownership refers to the total amount of cultivated land that exists in each province. Planned ownership, on the other hand, denotes the amount of cultivated land that each province is designated to possess according to national regulations. Responsibility ownership represents the cultivated land quantity that each province is accountable for, accounting for the conditions of food security and ecological safety within the province. Determining provincial responsibility ownership generally involves considering the quality, quantity, and ecological aspects of cultivated land. Typically, actual ownership should not be lower than planned ownership and responsibility ownership. However, in reality, there may be certain discrepancies between actual ownership and planned and responsibility ownership among different provinces.
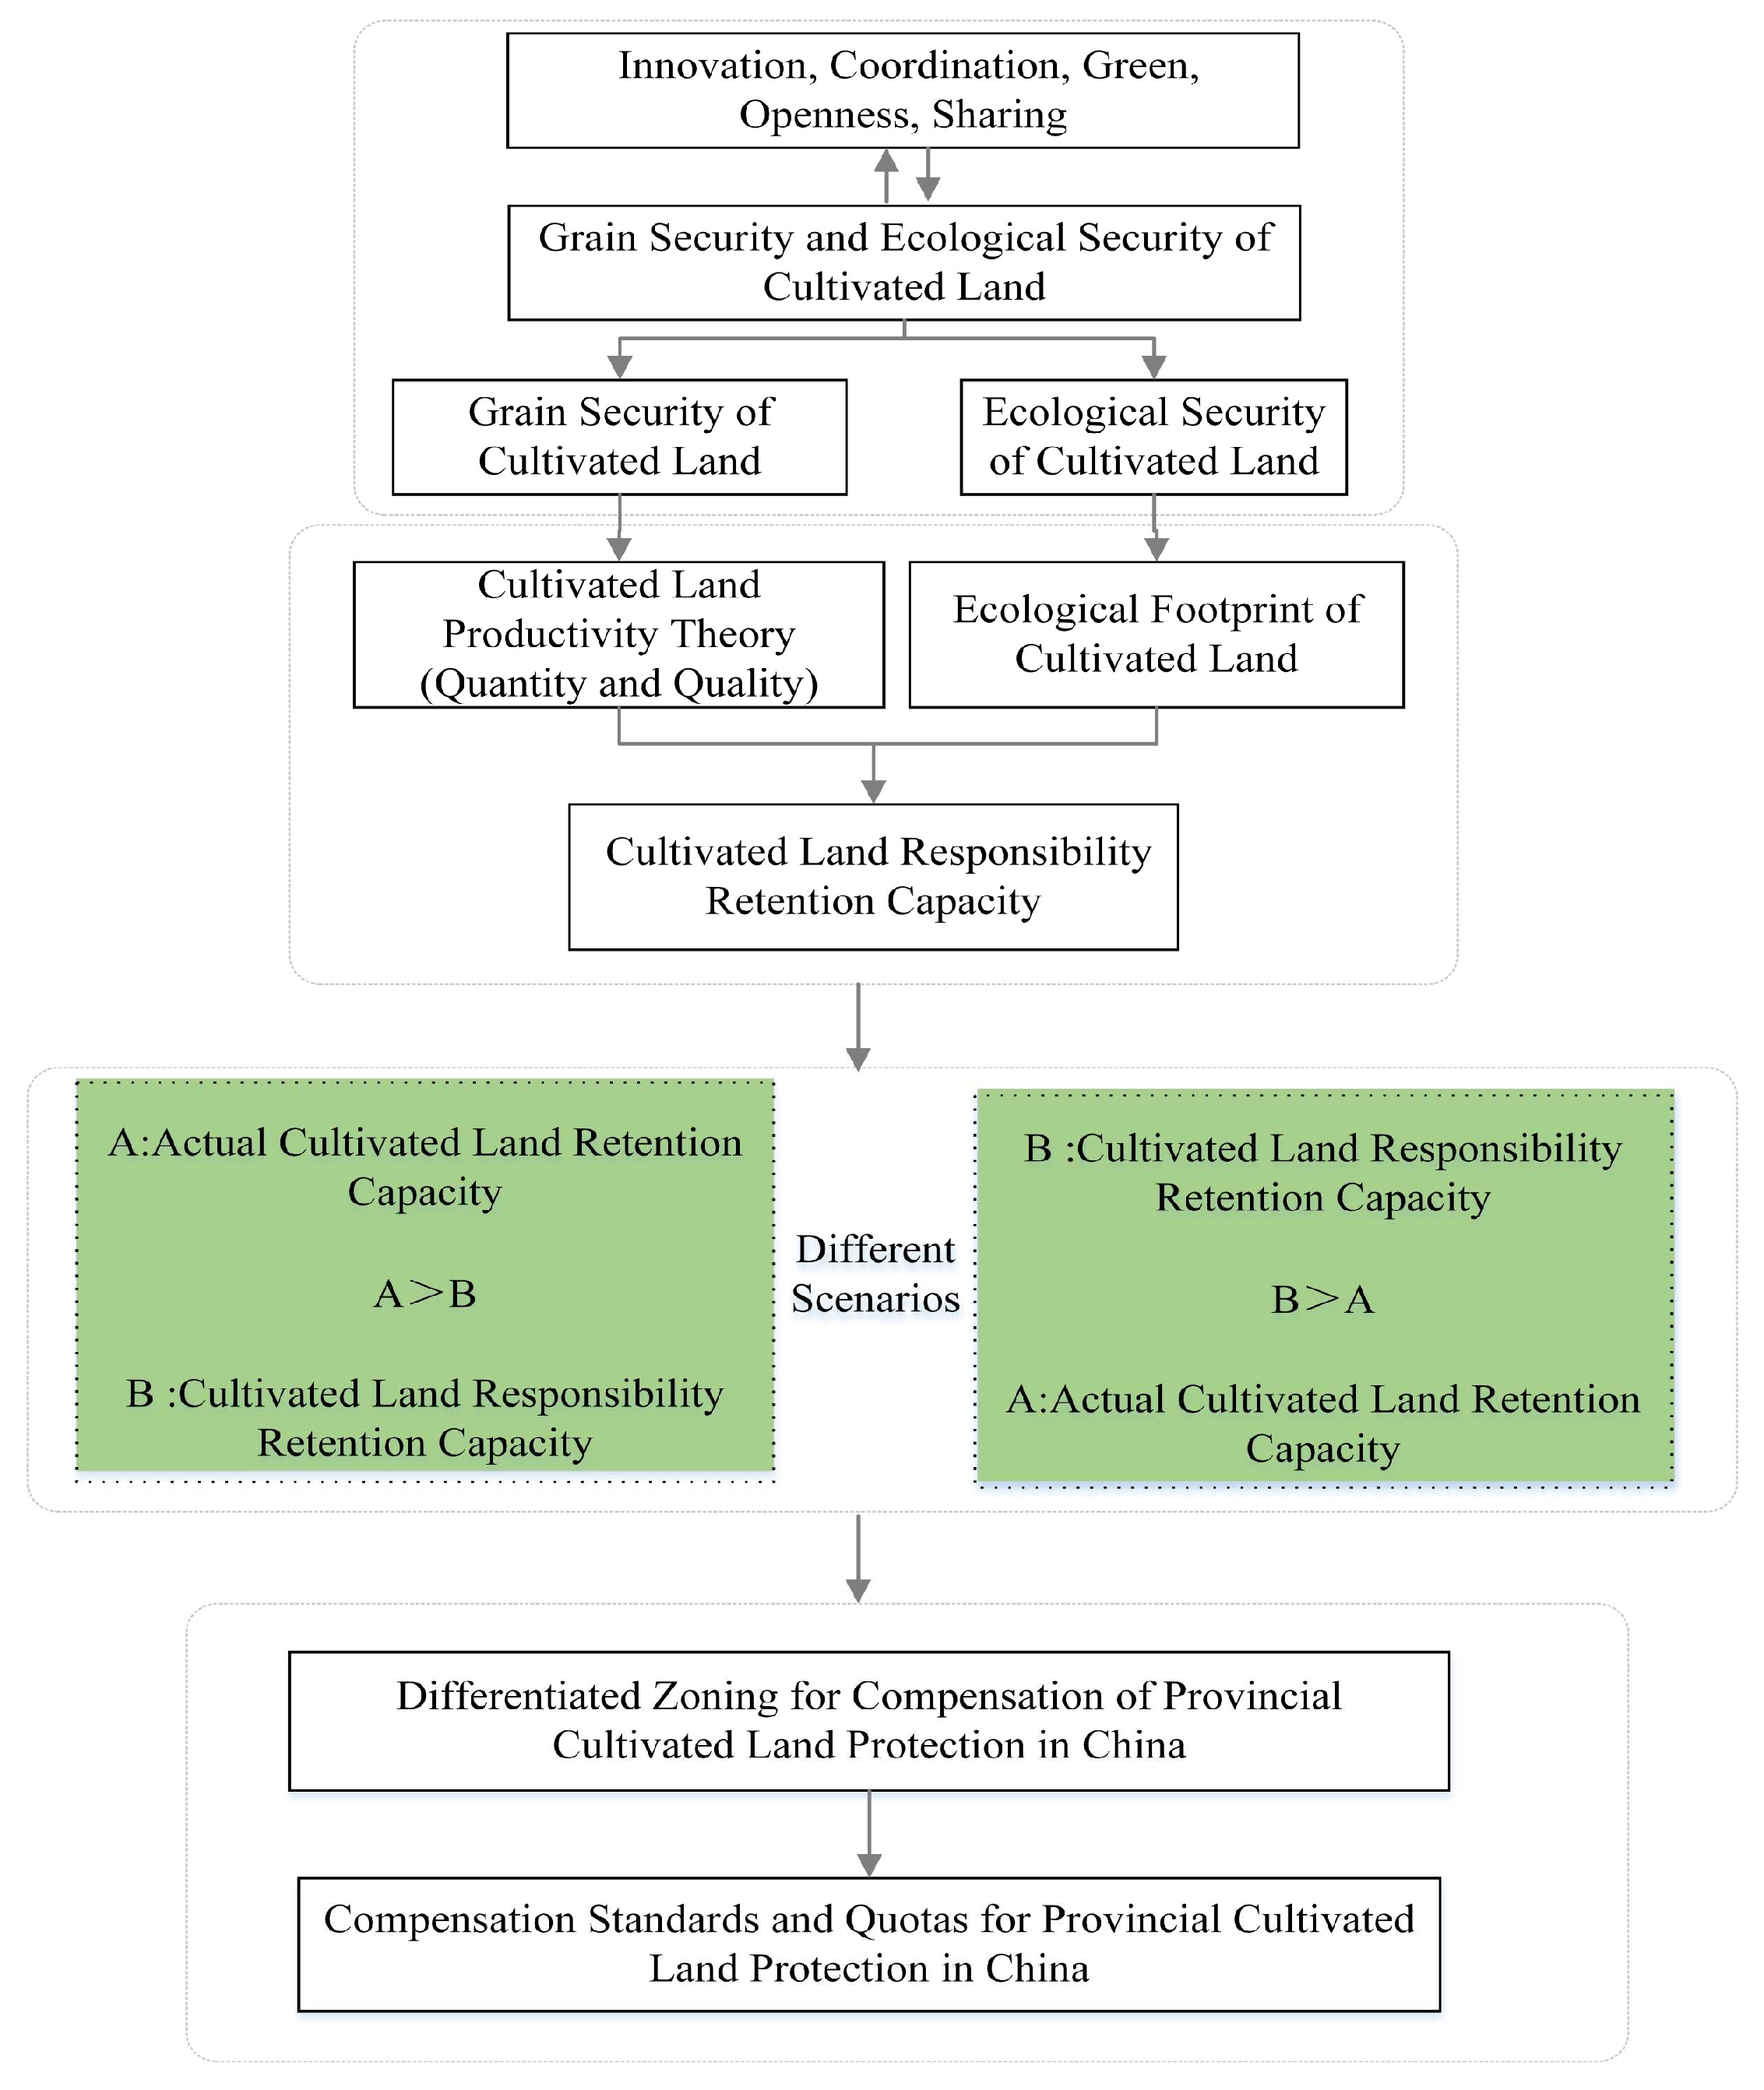
The research framework outlined in
Figure 1 is integral to our methodology. Aligned with the new development concepts of “Innovation, Coordination, Green, Open, and Sharing,” and harnessing the capabilities of artificial intelligence technologies, our focus is on provincial regions as the primary unit of study. Guided by theories of fairness and justice, we employed a methodology encompassing condition analysis, situation assessment, and policy recommendations.
The initial investigation centered on scrutinizing cultivated land retention across 31 provinces and cities, excluding Hong Kong, Macau, and Taiwan. This analytical approach involved integrating provincial land requirements with protective compensation by utilizing AI-driven methodologies. To establish the minimum requisite amount of cultivated land that each province should uphold, we factored in the perspectives of both food security and ecological safety. Subsequently, we conducted a comparative analysis between the actual cultivated land retained in each province and the predetermined responsibility quota, thereby identifying any disparities.
Furthermore, employing AI algorithms and integrating the opportunity cost method, we calculated the standardized compensation for cultivated land conservation. This meticulous process aimed to establish a compensation mechanism that is not only tailored to regional specificities but also incorporates technological advancements.
3.1. Cultivated Land Food Security Reserve Measurement
Food security not only focuses on the yield of crops and the quantity of cultivated land but also examines whether these can meet the basic needs of a population. The theory of cultivated land capacity further points out that the output from the land is directly influenced by its quality and management methods. In the current technological context, artificial intelligence offers unparalleled depth and precision for such analyses. Therefore, we primarily leveraged AI tools that integrate climate change perception and neural network analysis to identify fluctuating regions within cultivated land. Through AI, we can assess the potential output of cultivated land while exploring optimized management methods.
(1) Cultivated land productivity estimation
The climate production potential (CPP) refers to the maximum yield that crops can potentially achieve [
28]. The amount of sunlight, temperature, and water availability in a given natural geographic context are maintained at certain levels, and the soil quality affects crop productivity to a certain extent [
29]. This article combines the CPP and cultivated land quality to calculate cultivated land productivity:
In the formula provided,
represents the production potential based on the annual average temperature (measured in t/km
2), where t denotes the annual average temperature in degrees Celsius (°C). Similarly,
refers to the production potential based on the annual average precipitation (measured in t/km
2), where p represents the annual average precipitation in millimeters (mm). According to Liebig’s law of limiting factors [
30], the lesser value between
and
is utilized to estimate the CPP. This equation accounts for the influence of temperature and precipitation on crop yield and provides an estimation of the CPP of cultivated land.
The cultivated land productivity potential (LPP) represents the productivity determined by climatic conditions and comprehensive fertility factors, such as site conditions, soil profile patterns, the physicochemical properties of the soil, and soil management. The cultivated LPP is closely related to the level of cultivated land quality. Therefore, in this study, considering the CPP, the coefficient of cultivated land quality level is accounted for to obtain the potential cultivated LPP [
29], where the cultivated LPP represents the maximum achievable yield.
The coefficient of cultivated land quality level is constructed based on the results of China’s cultivated land quality grade survey and assessment, and it represents the quality level of cultivated land [
31]. The calculation is as follows:
where CPP is as mentioned above,
represents the cultivated land quality level in province i,
is the area of grade n cultivated land in province i,
is the total area of province i, and f is the number of cultivated land quality grades. In this study, we utilized the results of the national cultivated land quality grade survey and assessment conducted in 2015, which consists of 15 different grades. F represents the national cultivated land quality level, and
represents the score for grade n.
represents the cultivated LPP in province i.
In the equation,
represents the cultivated land area in province i that is dedicated to ensuring food security, specifically to guaranteeing the regional food supply for the general population.
represents the population of province i, measured in terms of permanent residents. FS represents the standard per capita grain yield, which is set at 400 kg [
32].
(2) Calculation of cultivated land food security
The calculation of the surplus or deficit in cultivated land area for food security is as follows:
where
refers to the surplus or deficit in cultivated land area for food security in province i.
represents the actual cultivated land area in province i.
remains the same as mentioned earlier, representing the cultivated land area dedicated to ensuring food security.
3.2. Calculation of the Ecological Security Reserve of Cultivated Land
(1) Calculation of the ecological footprint of cultivated land [
33]:
where
represents the ecological footprint of cultivated land in province i, measured in hectares (hm
2).
represents the resident population of province i.
represents the per capita ecological footprint, measured in hectares per person (hm
2/person).
is the equilibrium factor, which converts the potential productivity of different land types into a unified standard [
33]. In this calculation, we consider only the ecological footprint of cultivated land, so we assume A = 1.
represents the annual per capita consumption of the kth crop type, measured in kilograms per person (kg/person).
represents the average yield of the kth crop type per unit area, measured in kilograms per hectare (kg/hm
2).
Using the consumption statistical method to measure food consumption has demonstrated considerable accuracy [
34]. However, as economic development progresses, the dietary habits of residents undergo significant changes, leading to noticeable regional disparities. This shift not only pertains to grain consumption but also encompasses varying preferences for meat, eggs, milk, vegetables, oilseeds, and sweeteners. Hence, we suggest that integrating modern AI data technology and conducting an in-depth analysis of crop types cultivated and consumption patterns within provinces can aid in identifying distinct food consumption patterns, trends, and correlations in each region. Leveraging AI’s capabilities in deep learning and data analysis enables a more comprehensive understanding of these disparities and facilitates more precise predictive modeling. The specific calculation method is detailed as follows:
In the equation, remains the same., and represent the per capita direct consumption of grains (cereal crops), plant oils, sugar, and vegetables in the province, measured in kilograms per person (kg/person). represents the quantity of grains needed per capita for meat, eggs, and dairy consumption.
The calculation method for
is as follows:
where
represents the quantity of grains needed per capita for meat, eggs, and dairy consumption.
represents the per capita consumption of the jth type of animal-based food, including pork, beef, mutton, poultry, eggs, and dairy products.
represents the loss rate of animal products.
represents the grain conversion efficiency [
34].
(2) Calculation of the ecological carrying capacity of the cropland:
where
represents the ecological carrying capacity of cropland in a certain province, measured in hm
2;
and
remain the same as above; and
represents the yield factor of cropland, which describes the difference between the average production capacity of cropland in a specific region and the corresponding overall average level. Previous research was based on cropland yield factors in various provinces in China [
35,
36].
represents the per capita biologically productive cropland area, measured in hm
2 per person. The value of 0.88 represents 88% of the actual ecological carrying capacity of the region, based on the biologically productive land area after deducting 12% for maintaining biodiversity [
37].
(3) Calculation of the surplus/deficit of the ecological carrying capacity of cropland:
In the equation, represents the surplus or deficit of the ecological carrying capacity of cropland in province i, with and remaining the same as above.
3.3. Minimum Provincial Cropland Conservation Threshold in China
Using AI technology, we can delineate the obligatory cultivated land conservation quantity with greater precision. The determination of the minimum provincial cropland conservation threshold in China is a fundamental responsibility associated with ensuring the food security and ecological resource sustainability of cultivated land. The local government assumes this responsibility once both objectives are achieved. The minimum value of the provincial cropland conservation threshold is determined by subtracting the ecological surplus or deficit of cropland, as well as the surplus or deficit in food security, from the actual cropland area. If either of these conditions is met, the responsibility ownership of cultivated land in the province needs to be increased to include the additional area where the respective condition is not satisfied. In the scenario where both conditions are not fulfilled, the minimum threshold is based on the total area encompassing the satisfaction of both conditions simultaneously. Through AI’s data analysis and prediction capabilities, we can provide higher accuracy and efficiency for this process.
The basic idea of the minimum provincial cropland conservation threshold can be simply described using a mathematical formula:
Minimum provincial cropland conservation threshold = Current cropland area − minimum of the provincial cropland food security surplus or deficit and the ecological surplus or deficit.
In this formula, represents the minimum provincial cropland conservation threshold for province i, represents the same value for province i, and denotes the minimum value between the provincial cropland food security surplus and the ecological surplus.
3.4. Calculation of Compensation Standards for Cultivated Land Protection
China abolished its agricultural tax in 2006. As a result, local governments no longer generate income from cultivating the land. Instead, they rely on the conversion of agricultural land into construction land, which can generate transfer fees and even other indirect tax revenues [
25]. Therefore, the direct opportunity cost for the cultivated land protected by local governments in China is the net income generated from the conversion of agricultural land to construction land. This article adopts the opportunity cost method to calculate the compensation standard for cultivated land protection.
(1) Average income generated from the conversion of agricultural land to construction land:
In the equation, G represents the average income from the conversion of cultivated land to construction land in each province. represents the net income from land transfer fees in each province. represents the contract tax on land-use rights transfer in each province. represents the occupation tax on cultivated land in each province. Furthermore, China abolished its agricultural tax in 2006, meaning that is 0. n represents the land-use period, with a chosen comprehensive land transfer period of 50 years. r represents the discount rate.
① Net income from land transfer:
In the equation, and represent the average nationwide net income from land transfer in 2019 and 2004, respectively. and represent the comprehensive land price indexes for 2019 and 2004. represents the average net income from land transfer in each province in 2019. is the correction index. represents the per capita GDP of province i in 2019, and represents the national per capita GDP in 2019.
Based on the county (district) as the basic unit and using the weight of each level of land as a proportion of the total provincial land area [
38], the weighted calculation yields an average land transfer income
of 34.00 million CNY per hectare in 2004. According to the China Land Price Monitoring website, the land price index in 2004 (
) was 124, and the national comprehensive land price index in 2019 (
) was 310.
② Land-use rights transfer contract tax
:
Based on existing research [
39], this study adopts the land price of established towns as the average land price for construction purposes in the urban-rural fringe. The average land price level is approximately 1/9 of the urban land price, with a contractual tax rate of 3%. According to the “2019 National Urban Land Price Monitoring Report”, the national composite land price in 2019 was 4447.66 CNY/m
2. The determination of composite land prices in each province is adjusted according to the proportion of each province’s per capita GDP to the national per capita GDP.
③ Cultivated land occupation tax (): The average amount of cultivated land occupation tax in each province (city, autonomous region) can be determined according to the “Interim Regulations on Cultivated land Occupation Tax of the People’s Republic of China and Detailed Implementation Rules” (Ministry of Finance Order No. 49).
④ Recovery interest rate r: The “safe rate + risk-adjusted rate” method [
40] is used. The safe rate is taken as the annual interest rate of one-year fixed-term deposits in 2019, which is 1.5%. The risk-adjusted rate is calculated as the geometric mean of the changes in the consumer price index for residents in all provinces nationwide over the past 5 years.
(2) Provincial-level cultivated land protection compensation standards and compensation amounts.
Under the assumption that the local government acts as a rational economic agent and assuming land homogeneity, based on the laws of land price fluctuations and differential income changes, 50% of the land transfer revenue for urban construction can be considered as the net income from converting agricultural land to construction land. It can be regarded as the average opportunity cost of protecting cultivated land in the region, serving as the average value standard for compensating cultivated land protection. The calculation for cultivated land protection compensation standards is as follows:
In the formula, represents the cultivated land compensation standard for province i, represents the cultivated land protection compensation amount for province i, and and are the same as mentioned above.
3.5. Data Sources
The area of cultivated land is sourced from the data of the Third National Land Survey. The population, grain production, and sown area of each province are sourced from the “China Statistical Yearbook 2020”. The consumption of various products is sourced from the “China Household Survey Yearbook 2020”. The constant e, which represents the natural logarithm base, is an irrational constant with a value of approximately 2.71828. Meteorological data are sourced from the Chinese Meteorological Data Sharing Service website.
4. Results and Analysis
4.1. Analysis of Provincial Responsibility for Food Security in China’s Cultivated Land
4.1.1. Analysis of CPP and Provincial Cultivated Land Productivity Outcomes
Analyses indicate that the production potential range based on the average annual precipitation in provinces nationwide is between 71.56 t/km
2 and 336.28 t/km
2 (
Table 1). The national average production potential based on the average annual precipitation is 125.87 t/km
2, with a general decreasing trend from south to north. The production potential range of cultivated land at the provincial level is between 0.66 t/hm
2 and 28.47 t/hm
2, with an average national cultivated LPP of 4.42 t/hm
2. Overall, there is a decreasing trend from south to north, largely influenced by the quality level of provincial cultivated land.
To validate the results of the cultivated land production capacity theory, the calculated theoretical results of cultivated land production capacity were compared with the actual yields of cultivated land at the provincial level in 2019. The overall trends of the predicted production capacity and actual yields were consistent, indicating the effectiveness of the forecasting method. The lower predicted production capacities of some provinces mainly resulted from suboptimal land quality and insufficient production conditions (such as rainfall). On the other hand, the provinces with higher predicted values were mostly regions with excellent production conditions and better land quality, indicating the strong potential productivity of cultivated land.
For instance, in 2019, the average precipitation in Hebei Province was 442.7 mm, which was 89.0 mm less than the long-term average, indicating a relatively dry year. This resulted in lower predicted yields. In contrast, Guangdong Province received 12.6% more rainfall than the long-term average, indicating a relatively wet year, which led to higher predicted yields. Inner Mongolia had a large proportion (97% and above) of class 11–15 cultivated land, with overall lower land quality compared to the national average, resulting in lower predicted yields. But regions such as Hubei, Hunan, and Jiangsu had a higher proportion of class 1–4 cultivated land, indicating better land quality.
In addition, when comparing the actual average production capacity of cultivated land with the predicted production capacity, the regions with a higher predicted capacity were generally found in economically developed areas. On the other hand, economically underdeveloped regions had lower predicted productivity levels than developed regions. However, economically developed regions had a smaller area of cultivated land, while underdeveloped regions had a larger area of cultivated land. This indirectly confirms the shift in China’s focus on grain production, where regions with better economic conditions and land quality tend to prioritize other land uses, leading to less agricultural production. On the other hand, regions with poorer economic conditions and lower land quality bear a greater responsibility for food production, resulting in an imbalance in fairness and responsibility. These regions, which shoulder more responsibility for protecting cultivated land, need additional compensation to promote enthusiasm for cultivated land protection.
4.1.2. Chinese Agricultural Land Food Security
Overall, China’s national food security is in a surplus state, with a surplus of 2.4376 million hectares. However, there is an interesting phenomenon where provinces with smaller cultivated land areas have greater farming potential, while provinces with larger land areas have lower farming potential (
Figure 2). Within the total cultivated land area in the country, 20 provinces, accounting for 76.93%, have a food security surplus, while 11 provinces, accounting for 23.06%, face deficits (
Table 2).
The three provinces with the highest food security surpluses are Heilongjiang (12.56 million hectares), Jilin (4.80 million hectares), and Hubei (3.47 million hectares). Heilongjiang and Jilin have not only larger cultivated land areas but also higher land quality, resulting in significant farming potential. Hubei, on the other hand, exhibits one of the highest comprehensive land quality indices nationwide, indicating a high capacity for agricultural production.
Conversely, the three provinces with the largest deficits are Hebei (−7.87 million hectares), Shanxi (−5.46 million hectares), and Gansu (−3.47 million hectares). These provinces face challenges due to lower rainfall and lower land quality, leading to reduced farming potential. Moreover, these regions have higher population densities, exacerbating their food security deficits, particularly in areas with lower rainfall.
Overall, these findings emphasize the importance of considering factors such as land quality, rainfall, and population density when addressing the issue of food security and developing strategies to ensure a balanced distribution of agricultural production capabilities across different provinces.
4.2. Analysis of Ecological Security Responsibility for Provincial Cultivated Land in China
Overall, the ecological condition of cultivated land in China is in a surplus state, with a surplus area of 10.99 million hectares. There are 15 provinces with a surplus in ecological security for cultivated land, accounting for 74.90% of the total cultivated land area in the country. On the other hand, 16 provinces face deficits, accounting for 25.10% of the total cultivated land area.
The top three provinces with the highest surplus in ecological security for cultivated land are Heilongjiang (6.82 million hectares), Henan (4.41 million hectares), and Jilin (4.34 million hectares). Heilongjiang and Jilin have large cultivated land areas and strong ecological carrying capacities, while Henan has a high factor of cultivated land production and strong ecological carrying capacity.
In contrast, the three provinces with the largest deficits in cultivated land ecological security are Guangdong (−7.13 million hectares), Zhejiang (−3.04 million hectares), and Sichuan (−1.65 million hectares). This is related to their local dietary structure and production factors. Guangdong and Sichuan have the highest grain consumption in the country, while Zhejiang has relatively low production factors for cultivated land. These provinces have higher levels of urbanization and industrialization, with a large GDP, reflecting the contradiction between economic development and cultivated land ecological security.
4.3. Analysis of the Minimum Responsibility for Cultivated Land Preservation at the Provincial Level in China
There are 11 provinces in China that successfully meet the minimum requirement for maintaining provincial responsibility for cultivated land, ensuring both food security and ecological security. These provinces are predominantly in the northeastern, central, and western regions, with Yunnan Province being particularly notable (
Figure 3). Collectively, they account for 54.75% of the country’s total cultivated land area.
On the other hand, 20 provinces have not yet reached the minimum requirement for provincial responsibility, encompassing 45.25% of the total cultivated land area. Among these provinces, notably, some satisfy food security requirements but fall short in terms of ecological security. These provinces include Guangxi, Hainan, Chongqing, Sichuan, and Guizhou, totaling 11.23% of the national cultivated land area. Provinces that fail to meet the food security requirement but satisfy the ecological security requirement include Hebei, Inner Mongolia, Ningxia, and Xinjiang, accounting for 20.15% of the country’s total cultivated land area.
Additionally, provinces that struggle with both food security and ecological security concerns include economically prosperous regions such as Beijing, Shanghai, and Guangdong, as well as regions facing challenges due to unfavorable climate conditions and lower-quality land resources, such as Tibet, Gansu, and Qinghai. Combined, these provinces make up 13.87% of the total cultivated land area in the country.
4.4. Compensation for Provincial Cultivated Land Protection in China
4.4.1. Compensation Zoning for Protection of Cultivated Land in China
The amount of compensation for interprovincial cultivated land protection is primarily influenced by factors such as the quantity of preserved cultivated land, changes in cultivated land area, ecological environmental quality, and the level of economic development. In this study, the determination of the minimum requirement for cultivated land responsibility accounts for the variations in the quantity, quality, and ecological aspects of cultivated land across different provinces. Additionally, the calculation of the cultivated land ecological footprint adequately considers the shifts in dietary structure resulting from economic development.
Based on the completion of the minimum requirement for cultivated land responsibility, compensation zones can be delineated to distinguish between zones that receive compensation and those that pay compensation. Provinces with cultivated land areas that exceed the minimum requirement are considered compensation-paying zones. These provinces bear the responsibility of ensuring food security and ecological preservation not only within their own territories but also within deficit zones. Surplus zones provide vital ecosystem services and food security guarantees, sacrificing opportunities for nonagricultural development.
Provinces that have not met the minimum requirement for cultivated land responsibility require compensation for assuming a greater regional burden. They fall under the compensation-receiving zone category, which is designed to address the imbalance in responsibilities and promote the proactive involvement of stakeholders in cultivated land protection. In this study, we aimed to incentivize cultivated land protection in surplus zones, restrict nonagricultural conversion in deficit zones, and ensure fairness in payment zones. Within the payment zone, certain areas meet the criteria for either food security or ecological security, ultimately providing these services to other regions. As cultivated land security necessitates the fulfillment of at least one requirement, these areas are designated as differential payment zones with a payment coefficient of 0.5. Specific details on the partitioning results can be found in
Figure 4.
Compared to the national annual zoning in 2003 (
Table 3), the number of surplus zones for cultivated land decreased from 13 to 11. Notably, Inner Mongolia and Hebei provinces only partially meet the criteria for ensuring the dual security of cultivated land; thus, they are classified as “partially meeting” zones in this study. Similarly, the balanced zones for cultivated land, which were previously aligned with the production and sales equilibrium, decreased from 11 to 9. On the other hand, the number of deficit zones for cultivated land increased from 7 to 11. These trends indicate a general decline in the overall quality and ecological conditions of national cultivated land, elucidating the urgent need for strengthened cultivated land protection measures.
Furthermore, when compared to the findings of other researchers [
39,
41,
42], the cultivated land compensation zoning proposed in this study demonstrates a high level of credibility, and the research outcomes can be considered reliable.
Table 3.
Comparison of changes in the surplus and deficit zones of cultivated land.
Table 3.
Comparison of changes in the surplus and deficit zones of cultivated land.
| | Surplus Cultivated Land Zone
(Meeting the Dual Security of Cultivated Land) | Balanced Cultivated Land Zone
(Partially Meeting the Dual Security Requirements) | Deficit Cultivated Land Zone
(No Dual Security Requirements Met in the Area) |
|---|
| China (2003 Divisions) [42] | Heilongjiang (including the Provincial Agricultural Reclamation Bureau), Jilin, Liaoning (excluding Dalian), Inner Mongolia, Hebei, Henan, Shandong (excluding Qingdao), Jiangsu, Anhui, Sichuan, Hunan, Hubei, Jiangxi (13 provinces) | Shanxi, Guangxi, Chongqing, Guizhou, Yunnan, Tibet, Shaanxi, Gansu, Qinghai, Ningxia, Xinjiang (11 provinces) | Beijing, Tianjin, Shanghai, Zhejiang, Fujian, Guangdong, Hainan (7 provinces) |
| Zhou Xiaoping, et al. (2008 Divisions) [42] | Xinjiang, Hunan, Jiangxi, Hebei, Liaoning, Shandong, Anhui, Henan, Jilin, Inner Mongolia, Heilongjiang (11 provinces) | Tibet, Yunnan, Gansu, Sichuan, Hubei, Chongqing, Ningxia, Jiangsu (8 provinces) | Beijing, Tianjin, Shanghai, Guangdong, Zhejiang, Fujian, Qinghai, Hainan, Guangxi, Shaanxi, Shanxi, Guizhou (12 provinces) |
| Sun Jingjing, et al. (2015 Divisions) [39] | Heilongjiang, Jilin, Inner Mongolia, Shandong, Henan, Jiangsu, Anhui, Hunan (8 provinces) | Liaoning, Hebei, Hubei, Jiangxi, Chongqing, Sichuan, Qinghai, Xinjiang, Tibet, Ningxia, Hainan (11 provinces) | Beijing, Tianjin, Shanghai, Shanxi, Shaanxi, Gansu, Yunnan, Guizhou, Guangxi, Guangdong, Fujian, Zhejiang (12 provinces) |
| This study (2019 Divisions) | Liaoning, Jilin, Heilongjiang, Jiangsu,
Anhui, Jiangxi, Shandong, Henan,
Hubei, Hunan, Yunnan (11 provinces) | Guizhou, Hainan, Chongqing, Sichuan, Guizhou, Hebei, Inner Mongolia, Ningxia, Xinjiang (9 provinces) | Beijing, Tianjin, Shanxi, Shanghai, Zhejiang, Fujian, Guangdong, Tibet, Shaanxi, Gansu, Qinghai (11 provinces) |
4.4.2. Analysis of Compensation Standards and Quota for Cultivated Land Protection in Provincial Areas of China
(1) Compensation Standards for Cultivated Land Protection in Various Provinces of China
The average standard for compensation for the protection of cultivated land in China is 26,900 CNY per hectare. The top three regions with the highest compensation standards for cultivated land protection are Shanghai, Beijing, and Jiangsu at 57,400 CNY per hectare, 57,000 CNY per hectare, and 46,200 CNY per hectare, respectively (
Table 4). The three provinces with the lowest compensation standards are Shanxi, Heilongjiang, and Gansu at 16,700 CNY per hectare, 14,400 CNY per hectare, and 12,000 CNY per hectare, respectively.
From the perspective of the paying areas and the compensated areas, the average compensation standard for the compensated areas is 24,100 CNY per hectare, while the average compensation standard for the paying areas is 26,900 CNY per hectare. The compensation standard in paying areas is 1.12 times higher than that in compensated areas. In 2019, the per capita GDP in paying areas was CNY 73,000, while in the compensated areas, it was CNY 61,900. The per capita GDP in the paying areas is 1.18 times higher than that in the compensated areas, indicating a significantly higher level of economic development in the paying areas. Therefore, the relatively high compensation standard for cultivated land is justified based on the calculated results.
From the perspective of geographical division, the average compensation standards for the eastern, central, western, and northeastern regions are 38,100 CNY per hectare, 22,600 CNY per hectare, 19,300 CNY per hectare, and 18,000 CNY per hectare, respectively. The compensation standard in the eastern region is 1.68 times, 1.97 times, and 2.12 times higher than those in the central, western, and northeastern regions, respectively. The eastern region is economically developed, with a per capita GDP 1.75 times, 1.90 times, and 2.22 times higher than that of the central, western, and northeastern regions, respectively. With a higher level of urbanization, the contradiction between economic development and cultivated land protection is more prominent in the eastern region, and relatively speaking, the value of cultivated land is higher.
(2) Compensation Amount for Cultivated Land Conservation
The total compensation amount for cultivated land conservation in China is approximately CNY 65.631 billion. According to theoretical considerations, the three provinces with the highest payment amounts in the payment area are Guangdong, Zhejiang, and Beijing, with respective amounts of CNY 260.342 billion, CNY 122.709 billion, and CNY 98.719 billion (
Table 4). In terms of the compensated area, the three provinces receiving the highest compensation amounts are Heilongjiang, Jilin, and Henan, with respective amounts of CNY 98.206 billion, CNY 73.852 billion, and CNY 38.350 billion.
5. Conclusions and Discussion
5.1. Conclusions
In this study, we conducted an in-depth analysis and optimization of the responsibility and compensation mechanisms for preserving cultivated land in Chinese provinces, with a focus on fairness. By systematically analyzing existing policies and practices, we identified the shortcomings and issues of the current mechanisms. Building on this foundation, we proposed a series of scientifically sound and reasonable optimization strategies to promote fairness and sustainable development in the responsibility and compensation mechanisms for cultivated land preservation. Additionally, we considered the unique characteristics and variations among different provinces and provided personalized solutions to ensure their feasibility and effectiveness.
Our findings are as follows:
(1) The food security and ecological security of China’s cultivated land are in surplus, with a surplus of 2.44 million hectares for food security and 10.99 million hectares for ecological security.
(2) Twenty provinces have a surplus in food security, accounting for 76.93% of the total cultivated land area in the country. Conversely, 11 provinces have a deficit, accounting for 23.06% of the total cultivated land area. Heilongjiang, Jilin, and Hubei have the highest food security surpluses, while Hebei, Shanxi, and Gansu face the greatest deficits.
(3) Fifteen provinces have a surplus in ecological security, representing 74.90% of the total cultivated land area in the country. On the other hand, 16 provinces have a deficit, accounting for 25.10% of the total cultivated land area. Heilongjiang, Henan, and Jilin have the highest ecological security surpluses, while Guangdong, Zhejiang, and Sichuan face the highest ecological risks.
(4) Eleven provinces have successfully met the minimum threshold for cultivated land preservation and responsibility; they are primarily in the northeastern, central, and western regions of China and include Yunnan Province in the southwest. These provinces account for 54.75% of the total cultivated land area in the country. Conversely, 20 provinces have not reached the minimum threshold for cultivated land preservation.
(5) Our AI-assisted calculations indicated that the national average compensation standard for cultivated land conservation is 26,900 CNY per hectare. Shanghai, Beijing, and Jiangsu have the highest compensation standards, while Shanxi, Heilongjiang, and Gansu have the lowest. Guangdong, Zhejiang, and Beijing have the highest payment amounts in the payment zone, while Heilongjiang, Jilin, and Henan have the highest compensation amounts in the compensated zone.
These findings provide valuable insights into the development and implementation of effective cultivated land preservation policies and practices. They contribute to promoting sustainable agricultural development and ensuring a balance between food security and ecological security in Chinese provinces.
5.2. Discussion
The innovative aspect of this study lies in its utilization of a cultivated land productivity prediction model, which enables an integrated approach to managing and controlling cultivated land quality, quantity, and ecology. Taking a fair perspective, this study delves into the research of provincial-level cultivated land’s food security and ecological security, establishing the minimum threshold for provincial cultivated land responsibility and proposing targeted compensation standards. The aim is to promote fairness, reasonableness, and sustainability in cultivated land protection.
(1) Regarding Data and Models: We utilized a climate productivity potential model to forecast cultivated land productivity, yet it overlooked variations in yield due to changes in cultivated land input management, such as increased fertilizer application. Future prediction models should consider the influence of changes in cultivated land input management on yields. Additionally, using the opportunity cost method requires the consideration of various influencing factors. While we incorporated factors such as the provincial fiscal capacity and average land prices for construction purposes, we gave less weight to factors related to provincial construction land demand. Thus, to enhance the accuracy and effectiveness of cultivated land protection compensation standards, subsequent research will prioritize a systematic examination from the perspective of provincial construction land demand, comprehensively encompassing diverse influencing factors.
(2) Regarding Research Findings: In a prior study, Xinqing, Yong et al. (2012) calculated the national average compensation standard for cultivated land protection at 13,100 CNY per hectare [
41]. Jingjing, Sun. et al. (2019) estimated the national average cultivated land protection compensation standard at 29,000 CNY per hectare [
39]. In this study, the national average compensation standard was calculated at 26,900 CNY per hectare, aligning closely with previous research and affirming the reliability of our results. Reasonable compensation for cultivated land protection mitigates challenges such as declining cultivated land numbers and escalating ecological risks faced by China’s cultivated land resources, thereby fostering proactive cultivated land preservation. Economic compensation stands as a crucial means and assurance to attain fairness, offering an essential approach to rectifying imbalanced regional responsibilities in cultivated land protection.


