Article

Fractal Characteristics of the Particle Size Distribution of Soil along an Urban–Suburban–Rural–Desert Gradient

1
College of Geographical Science and Tourism, Xinjiang Normal University, Urumqi 830054, China
2
Xinjiang Laboratory of Arid Zone Lake Environment and Resources, Xinjiang Normal University, Urumqi 830054, China
*
Author to whom correspondence should be addressed.
Land 2023, 12(12), 2120; https://doi.org/10.3390/land12122120
Submission received: 28 October 2023 / Revised: 21 November 2023 / Accepted: 27 November 2023 / Published: 29 November 2023

Abstract

:
In order to investigate the difference in particle size distribution of soil along an urban–suburban–rural–desert (USRD) gradient in an arid zone, surface soil (0–20 cm) samples were gathered at the urban, suburban, rural, and desert gradients in Urumqi, a northwestern Chinese city. Laser diffraction technology was adopted for determining the particle size distribution of the soil. Comparisons were made regarding the particle size distribution traits and soil properties in different gradient zones based on parameters such as the mean particle size (MG), fractal dimension (Dv), sorting coefficient (ơG), kurtosis (KG), and skewness (SKG). Results indicate that (1) particle size distribution in the urban, suburban, and rural soils was mainly sand particle sizes, whereas the desert soil was mainly composed of silt particle sizes. The average Dv value ranking for soil in each gradient is desert > suburban > urban > rural. (2) The width and peak of the soil particle size frequency curve ranged within 0–500 μm, and the width and peak of the soil particle size frequency curve of each gradient were different. (3) The MG of rural soil was the highest, whereas the MG of desert soil was the lowest. The ơG values of the surface soil of each gradient were all greater than 4.0, and the sorting performance was extremely poor. The SKG of the desert and urban soil particle size showed extremely positive and negative skewness, respectively, while the SKG of the rural and suburban soil particle size showed extremely negative skewness. The KG values of the particle sizes of the rural and suburban soils exhibited narrow and medium peaks, whereas those of the urban and desert soils exhibited very broad and flat peaks. (4) The Dv of the soil in each gradient was strongly influenced by the soil particle size distribution, with the clay content of the soil playing a dominant role. Finally, the fractal dimension was identified as an indicator of the characteristics of the fine particle matter content in the soil structure. The novel contribution of this work is to clarify the fractal differences in the particle size distribution of soil along an urbanization gradient. The present research findings can offer fundamental information relating to the characteristics of soil particle size distribution along an urbanization gradient zone.

1. Introduction

The particle size distribution of soil is a main physical trait that affects soil structure and is associated closely with soil texture and behavior [1]. As a crucial and stable natural trait of soil, it not only integrates biological, chemical, and physical features of soil with the formation process, but it is also one of the basic physical parameters that promotes matter and energy exchange in the soil environment [2]. Soil particle size distribution not only affect soil permeability and organic matter content but also affects soil fertility, soil erodibility, soil conservation, moisture and nutrient migration, vegetation productivity, ecological remediation, and land degradation [3]. Therefore, the quantitative analysis of the fractal characteristics of particle size distribution in soil is a hot topic in the research area of soil environments.
Many studies have explored the fractal characteristics of particle size distribution of soils in different regions [4,5]. To investigate the relationship between soil particle size distribution and other factors, fractal theory and associated indices (e.g., mean particle size, skewness, sorting coefficient, and kurtosis) have been applied to soil systems [6,7]. According to prior research findings, the mean particle size is capable of reflecting the scope of the soil particle size distribution [8,9], while the skewness can quantitatively reflect the distribution symmetry, indicating if the distribution is skewed towards a designated size class [10]. The sorting coefficient is an intricacy indicator for the dynamic aeolian near-surface events [11], while kurtosis characterizes the dispersive degree of soil particle size distribution [12].
In recent years, a volume-based fractal model has been extensively utilized for reflecting soil structural compositions, as well as textural homogeneity [13,14,15,16]. The fractal dimension value for the particle size distribution of soil has been proven to accurately express the structural form, textural homogeneity, salinization features, and nutrient status of soil, which can also reflect the influences of environmental changes and anthropogenic activities over the variations in soil properties [17,18]. Meanwhile, the soil fractal dimension has also been applied for predicting and estimating soil erosion, desertification, and land deterioration resulting from climatic fluctuations and anthropogenic activities [19,20]. Recently, Wang et al. [21] observed the variability in soil particle size distribution through fractal theory and a geostatistical method in an underground coal-mine area and found that this area did not present a high spatial variability. Chen et al. [22] used multifractal theory to analyze the particle size distribution of soil physical crusts and revealed the features of erodibility and sediment transport and deposition on the soil surface. Jing et al. [23] used fractal analysis to explore the effects of land subsidence and rehabilitation on the spatial variability in soil physical properties and revealed that fractal analysis is highly sensitive to the spatial variability in soil physical properties. Sowinski et al. [24] analyzed the influence of soil agricultural use on particle size distribution and found that the soil particle size distribution in the moraine landscape was heterogeneous, whereas in the landscape of ice-dammed-lake origin, it was homogeneous. Zhang et al. [25] compared the particle size distribution prediction ability of three types of mathematical models and suggested that the flexibility, simplicity, and practical applicability of the model parameters are all important considerations when selecting an optimum particle size distribution model. Jena et al. [26] predicted soil particle size fractions using a random forest (RF) model and found that geographic variation in soil particle size fractions can be accurately estimated on both a national scale and a detailed level using an RF model. Bi et al. [27] found a close relationship between soil particle size, nitrogen content, and cation exchange capacity. Li et al. [28] established a particle size content prediction model to retrieve the particle size distribution in arid and semi-arid mining areas and suggested that the support vector machine (SVM) combined with the Second Simulation of the Satellite Signal in the Solar Spectrum Vector version 6SV can effectively predict the soil particle size distribution and provide effective data to support topsoil quality. The results above suggest that the research on soil particle size distribution can offer some scientific advice for land rehabilitation and ecological restoration in subsided areas.
The land surface type significantly impacts the heterogeneity of soil particle size distribution [29,30]. Land use types, environmental factors, and human activities can influence the particle size distribution features of soil, probably inducing a loss of fine soil particle sizes, so the soil texture is coarsened and the soil properties and structure deteriorate [31]. For example, Wang et al. [32] examined the particle size distribution of soil in various sedimentary contexts at a watershed scale, finding that the soil structures varied spatially across contexts. Sha et al. [33] analyzed the influences of different forest allocations over vertical variations in soil particle size distribution on the Chinese Loess Plateau. Fu et al. [34] found differences in the fractal dimension of the soil particle size distribution features of different farmlands and natural grasslands in Wuchuan County of China. The above-mentioned research mostly focused on the fractal feature differences in the soil particle size distribution of different land types. However, soils in various urban gradient zones have different fractal characteristics [35]. Gao et al. [36] used the fractal theory method to examine the changes in soil particle size distribution in the different land cover types in the Qinghai–Tibet Plateau of China, and found that the clay and silt particles resulted in a more evenly distributed soil particle size distribution, while the vegetation degradation may cause a narrow range of soil particle distribution. Niu et al. [37] used the fractal theory to explore the fractal features of the soil particle size distribution under five vegetation types in the mountainous land of the northern China. Their results revealed that the fractal dimension of the soil particle size distribution can be the quantitative index to describe the influences of the Return Farmland to Forests Projects on the soil structure. Chen et al. [38] collected samples from four kinds of land use patterns in an agricultural catchment in the Three Gorges Reservoir Region of China and analyzed the soil particle size distribution using the fractal method. Their results suggested that the farming behavior may refine the soil particles and enhance the heterogeneity of the soil particle size distribution. However, the differences in the soil particle size distribution along an urbanization gradient in arid zone oases have not been studied.
The particle composition distribution curve and accumulative frequency distribution curve of the soil particle size have been widely used to analyze the soil particle size distribution in different plant communities, different land surfaces, dune sediment, and halophytic landscapes [2,4,6,33]. However, considering the different soil particle size distribution characteristics of different land use types, the main components, features, and the main driving factors of soil particle size distribution in the urban, suburban, rural, and desert gradient zones in arid zone oasis cities are not clear [19,29,30,31]. In this study, the soil particle size distribution and its parameters (mean particle size, sorting coefficient, skewness, kurtosis, and fractal dimension) were analyzed for soils along an urban–suburban–rural–desert (USRD) gradient and the relationships between soil particle size distribution and these parameters were explored.
The purposes of the present research were: (1) to identify the particle size distribution of the surface soil in a representative urban, suburban, rural, and desert (USRD) gradient in Urumqi, northwestern arid zone of China; (2) to investigate the correlation of the particle size distribution with the fractal dimension; (3) to discuss factors impacting the soil particle size distribution in different urbanization gradients. The present research results are significant to understand the influences of the urbanization process over the soil structure.

2. Materials and Methods

2.1. Study Area

Urumqi is situated in the southern part of the Kurbantunggut Desert, northwest arid zone of China [39]. Its representative feature is a typical continental desert climate, where the annual mean precipitation is 280 mm and the annual mean temperature is 6.7 °C [40,41]. A representative continuous USRD gradient (30 km × 11 km) within 87°30′–87°48′E and 43°48′–44°13′ N was chosen as the study area (Figure 1). Every gradient extends over an approximately 8 km distance. Main soil types are oasis grey soil, grey desert soil, oasis fluvo-aquic soil, paddy soil, meadow grey desert soil, and brown calcium soil.
Commercial, educational, and residential areas constitute the major land use types in the investigated urban gradient, which has a large human settlement, and the residents are primarily engaged in non-agricultural tasks. The rural gradient generally refers to settlements dominated by agricultural populations, where cultivated land is the primary land use type [42]. The suburban gradient, an urban–rural transitional zone, includes residential, industrial, and agricultural lands. The suburban gradient is in the extension area of the urban gradient with a large population [43,44]. The desert gradient is an extension region of the rural gradient, and it is an area with sparse vegetation and very low population density [41].

2.2. Sample Collection and Analysis

From the typical USRD gradient in the city of Urumqi, we gathered 88 topsoil samples (0–20 cm soil layer) in total in April 2021. The urban soils were sampled at places with dense roadways and populations, while the rural soils were obtained from farming lands with a minimum of a 50 m distance from roadways. The suburban soils were sampled from the zones between urban and rural gradients, and the desert soils were obtained from the extension area of the rural gradient.
Considering the spatial heterogeneity of the soil environment in the urban downtown, we collected 42, 19, 16, and 11 samples separately from the urban, suburban, rural, and desert gradients. Five sub-samples were obtained at every sampling point from 100 × 100 m areas, which were blended into one representative monolithic soil sample and later mixed inside a clean polyethylene bag manually.
All the involved samples were subjected to an approximately 72 h air-drying at room temperature, and then sieved via 10-mesh nylon for elimination of detritus and roots to prepare for subsequent particle size distribution analysis. For elimination of carbonate and organic matter, HCl (10%) and H2O2 (30%) were utilized to pretreat the soil samples. Then, diluted ionized water was added to let stand for 12 h, thereby removing supernatant and controlling the pH value between 6.5 and 7.0. Finally, a Mastersizer 2000 (Malvern Instruments, Malvern, UK) was utilized to assess the soil particle size distribution through a laser detection procedure. The measurement errors were below 2%, while the soil particle diameters were within the range of 0.02–2000 μm.

2.3. Calculation of Particle Size Parameters

Computational formulas for the mean particle size (MG), sorting coefficient (σG), skewness (SKG), and kurtosis (KG) are as follows [45]:
MG = (Φ16 + Φ50 + Φ84) ÷ 3
σG = (Φ84 − Φ16) ÷ 4 + (Φ95 − Φ5) ÷ 6.6
SKG = [(Φ84 + Φ16 − 2Φ50) ÷ (Φ84 − Φ16) + (Φ95 + Φ5 − 2Φ50) ÷ (Φ95 − Φ5)] ÷ 2
KG = (Φ95 − Φ5) ÷ [(Φ75 − Φ25) × 2.44]
where Φ5, Φ16, Φ25, Φ50, Φ75, Φ84, and Φ95 represent the soil particle sizes of various frequencies. According to standards for US classification, the soil particle sizes were categorized as clay fraction (<2 μm), silt fraction (2–50 μm), and sand fraction (>50 μm).

2.4. Estimation of the Fractal Dimension

The fractal dimension (Dv) of the soil particle size distribution is an effective parameter for quantitatively characterizing the soil particle composition. It reflects the relationship between soil particles and soil texture. With the utilization of a particle volume fractal model for soil, the fractal dimension (Dv) was computed following the Tyler and Wheatcraft [46] procedure.
Vi ÷ Vt = (di ÷ dmax)3–D
where Vi denotes the overall volume of the soil particles with sizes below di, Vt represents the overall volume percentage of the soil particles, di stands for the average diameter of particles between two adjacent sizes di and di+1, and dmax represents the average diameter for the greatest particles. Based on the slope of the logarithmic linear regression equation, we can acquire the value of Dv by taking logarithms on both sides of Equation (5).
The mean particle size (MG) reflects the mean condition of the particle size composition of soil, and the higher the MG value, the lower the number of fine particle sizes. The sorting coefficient (σG) reflects the dispersion degree of particle size composition distribution in soil. The skewness (SKG) reflects the symmetry of the coarse and fine distribution of soil particle size. The kurtosis (KG) reflects the degree of peaks and troughs of the soil particle size frequency distribution curve. The classification standards of (σG, SKG, and KG) are detailed in Table 1 [1,34].

2.5. Statistical Analysis

Origin 2022 software (Origin Lab, Northampton, MA, USA) was utilized for plotting figures. The associations of the fractal dimension with the clay, sand, and silt contents of soil in the urban, suburban, rural, and desert gradients were explored by one-way analysis of variance (ANOVA).

3. Results

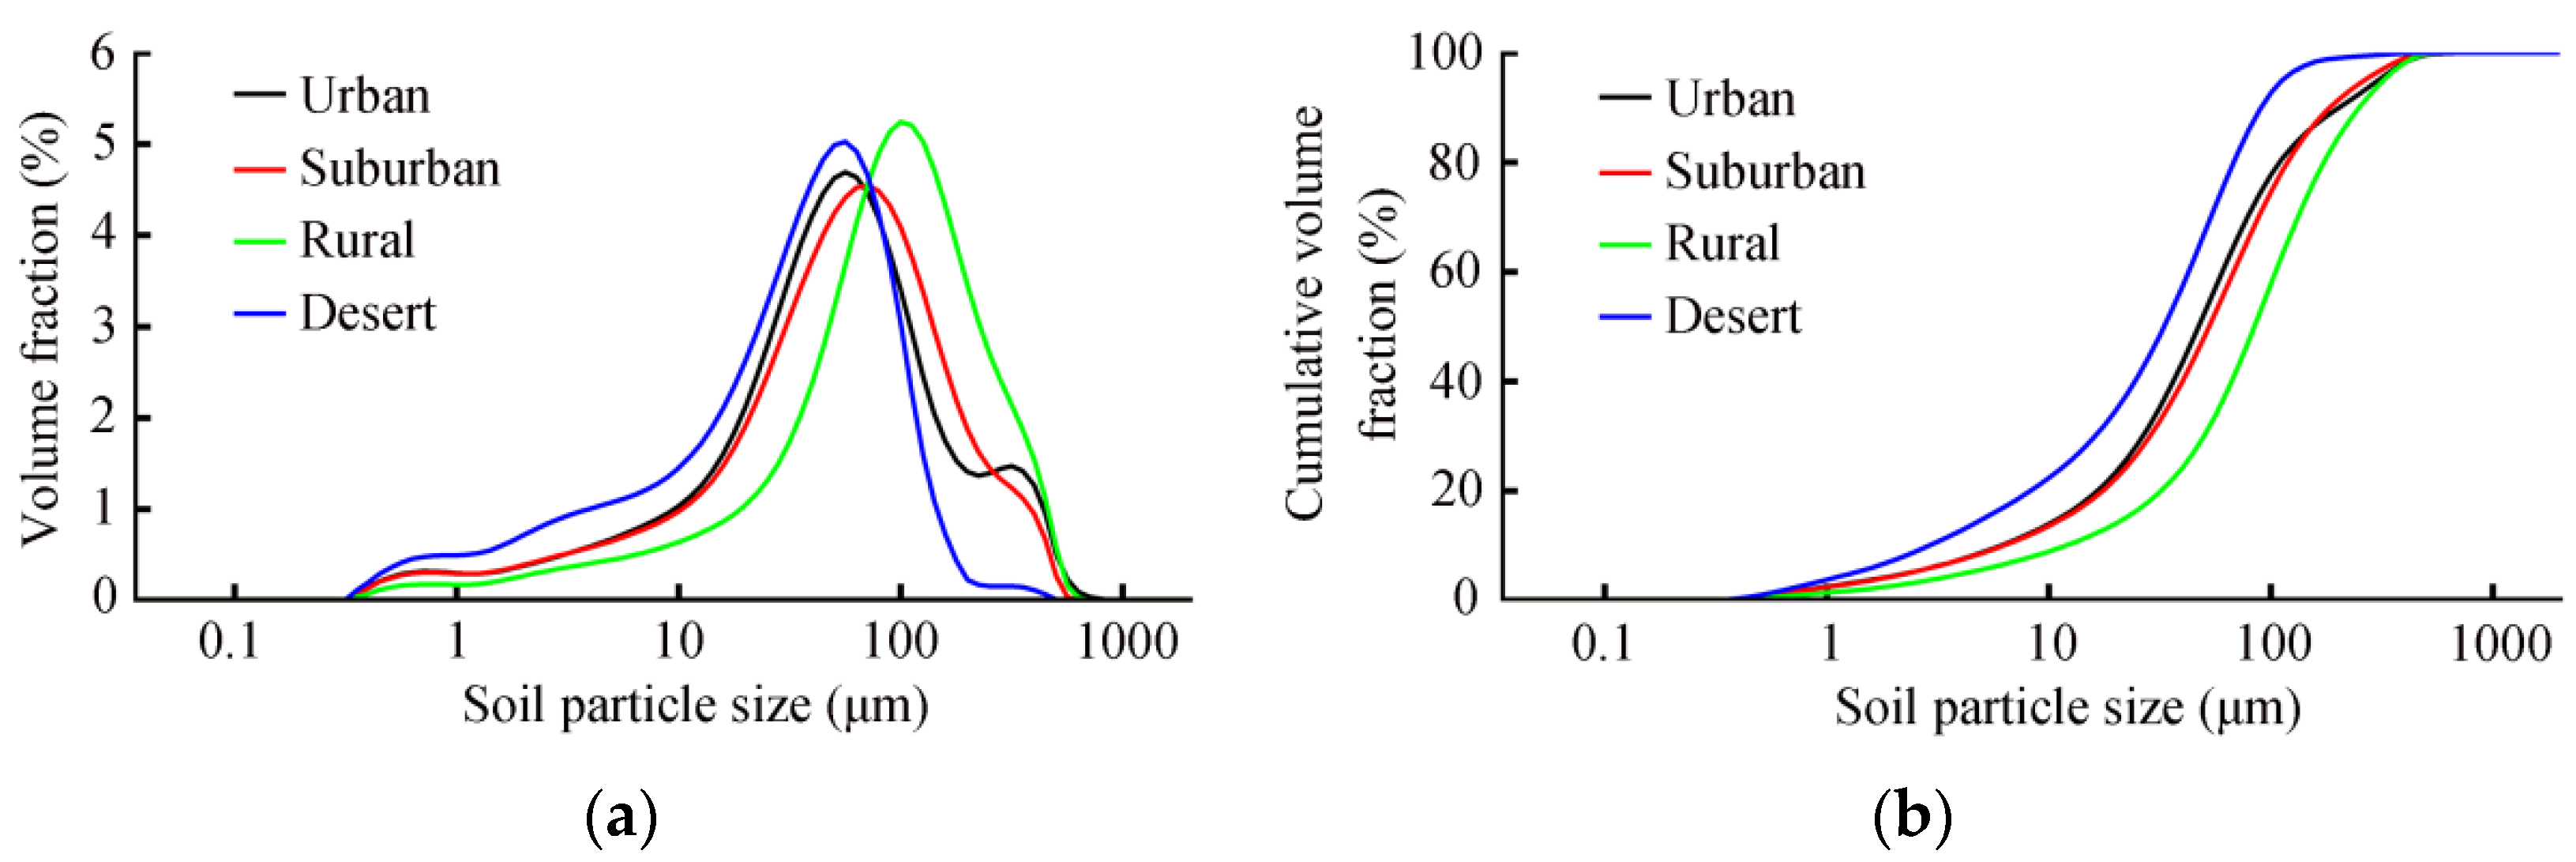
3.1. Characteristics of Soil Particle Size Distribution

As an essential physical property, the particle size distribution of soil is normally used for soil texture categorization and identification. Table 2 shows the soil texture information of the USRD gradient in Urumqi. The loamy sand percentages in the urban, suburban, rural, and desert gradients were 80.85%, 94.74%, 81.25%, and 72.73%, respectively. It indicates that the loamy sand was the prominent soil texture of all gradients in the investigated area. Clay soil was present only in the urban gradient, while sandy soil was found only in the rural gradient. Overall, the structural compositions of the soil textures in the USRD gradient were complicated in the investigated area. Loamy sand was the primary type of soil texture, and small amounts of sandy soil, clay loam, and clay soil were present throughout the whole study area.
Table 3 shows the soil particle size distribution in different gradients in the study area. As is clear, the mean content of fine-sized particles (silt and clay contents) in the desert gradient (62.10%) was obviously higher compared to those in the urban gradient (47.84%), the suburban gradient (43.95%), and the rural gradient (26.94%). The mean content of sand in the rural gradient (73.06%) was significantly higher than those in the urban (52.16%), suburban (56.05%), and desert gradients (37.90%).
On the whole, the mean percentages of particle size distribution of soil in the whole investigated area decreased in the order of: sand (55.02%) > silt (40.90%) > clay (4.08%). It indicates that sand is the predominant soil content, while clay is the least common soil content in the whole study area. The mean fractal dimension (Dv) values of the urban, suburban, rural, and desert soil particle sizes were 2.44, 2.45, 2.36, and 2.51, respectively. It indicates that the desert soil has the highest content of fine-sized particles, whereas the rural soil has the lowest content of fine-sized particles.
Coefficient of variation (CV) is a distribution heterogeneity indicator for soil particle sizes. CV has high variability when its value exceeds 0.51; moderate variability when its value is 0.26–0.50; and low variability when its value falls below 0.25 [41]. According to the CV statistics for the analyzed contents of the soil particle sizes in various urbanization gradients (Table 3), the CV values were all below 0.25 for fractal dimensions in all four soil types, for clay, sand, and silt contents in the suburban soil, for sand content in the rural soil, as well as for silt content in the desert soil. It indicates that the fractal dimension and these soil particle sizes are most likely affected by natural factors. The CV values for silt and sand contents in the urban soil, clay and silt contents in the rural soil, and sand content in the desert soil were all within 0.25–0.50, suggesting moderate variability of these soil particle sizes, which may be attributed to both natural and anthropogenic impacts. The CV values of clay content in the urban soil and desert soil were 0.59 and 0.67, respectively. It indicates that the clay content is easily impacted by anthropogenic activities. The CV values for clay, silt, and sand contents were 0.64, 0.35, and 0.30, respectively, throughout the whole study area. It shows that the urbanization progress may apparently change the distribution structure of the soil particle sizes, especially the content of clay.
Overall, difference in the soil particle size distribution reflected the difference in the soil texture in the USRD gradients in the investigated area. However, the soil texture was comparatively coarser in the rural gradient than in other gradients, whereas the desert gradient had a relatively finer texture.
The soil particle size volume fraction curve in each gradient zone in Urumqi is illustrated in Figure 2. As displayed in Figure 2a, the particle size volume fraction curves for soil in the rural and desert gradients in the investigated area increased first and then decreased, and the high peak values of the soil particle size distribution were observed at 100 μm and 56 μm, respectively. The frequency distribution curves of soil particle size in the urban and suburban gradients also showed the same trend as that in the rural and desert gradients, which first increased and then decreased, but showed the characteristic of a bimodal distribution pattern (black and red lines in Figure 2a). In the urban and suburban gradients, the distribution peak values of the soil particle size distribution at 63 μm and 71 μm were the greatest, while the secondary peaks were observed at 317 μm and 356 μm. The cumulative particle size volume fraction curve for soil (Figure 2b) indicated that the particle size range of the urban, suburban, rural, and desert soils in the study area was concentrated within 0–500 μm.

3.2. Characteristics of Soil Particle Size Parameters

The characteristics of soil particle size parameters including the mean particle size (MG), sorting coefficient (ơG), kurtosis (KG), and skewness (SKG) in each gradient are illustrated in Figure 3. As is clear, the features of the particle size parameters in the USRD gradients were significantly different across the investigated area. The mean MG values for various gradients in the investigated area can be ranked as: rural (44.15 μm) > suburban (16.11 μm) > urban (9.46 μm) > desert (5.41 μm). The MG value of the rural soil was higher than that of other gradients. This is because the rural soil is mainly irrigated soil, which contains especially abundant coarse particles in contrast to the rest of the land use types in other gradient zones [8]. The MG value of desert soil was the least because desert soil is mostly eolian sandy soil and the fine particle size is especially abundant relative to the other particle sizes [2].
The mean value of the sorting coefficient G) for soil in each gradient reduced in the order of: suburban (12.15) > urban (9.62) > rural (7.01) > desert (5.58), with a value of greater than 4 for each gradient. According to the classification standards of the σG (Table 1), the soil was extremely poorly sorted in each gradient of the investigated area. The large degree of dispersion for the sorting coefficient indicates uneven soil particle size distribution in all gradients in the study area. Among them, the mean σG value of the desert soil was found to be the least compared to soils in other gradients because of the relatively better sorting ability of the eolian dunes [16].
The mean value of skewness (SKG) for soil in each gradient can be ranked as: desert (0.47) > urban (–0.30) > rural (–0.32) > suburban (–0.51). According to the classification standards of the SKG (Table 1), the soil particle size distribution exhibited a very positive skewness in the desert gradient, indicating the finer-sized particles in the surface soil [2]. The skewness of the soil particle size distribution was negative for the urban gradient, while it was very negative for the rural and suburban gradients. It indicates the coarse-sized particles in the surface soil and movement of the mean value in the direction of a coarser median in these three gradients [47].
The mean kurtosis (KG) for soil in each gradient in the investigated area can be ranked as: rural (1.30) > suburban (0.97) > urban (0.31) > desert (0.30). According to the classification standards of the KG (Table 1), the narrow KG in the rural gradient reflected a sharpness feature. The moderate KG in the suburban gradient indicated a mesocratic peak feature, whereas the very broad flat KG in the urban and desert gradients showed a relatively gentle feature.

3.3. Fractal Dimension of Soil Particle Size Distribution

The Dv values of soil in the USRD gradients were computed for the investigated area, and Figure 4 depicts relevant results. Figure 4 shows that the Dv values for the soil particle size distribution ranged within 2.22–2.69 in the whole investigated area, with a mean value of 2.44. The mean Dv for soil in the various gradients can be ranked as: desert (2.51) > suburban (2.45) > urban (2.44) > rural (2.36), suggesting apparently higher fitness of the soil texture in the desert gradient compared to the other three gradients. The urban and suburban soils exhibited similar fractal characteristics. The Dv of soil in the urban gradient ranged from 2.32–2.68, and the Dv of suburban gradient ranged from 2.42–2.49. The ranges of Dv values of soil in the rural and desert gradients were 2.22–2.46 and 2.38–2.69, respectively. These results suggest that the surface soil structure in all gradient zones is poor, with a partial lack of particle size composition [48,49]. This can be verified by Figure 2b showing that the percentages of the cumulative volume fraction curve of soil in all gradients in the study area reached 99% when the soil particle size diameter reached 500 μm.

3.4. Relationship between Fractal Dimension and Soil Particle Size Distribution

The correlation of the fractal dimension with the soil particle size distribution in the USRD gradients of the study area was analyzed by a simple linear regression analysis (Figure 5).
As illustrated in Figure 5, the Dv values showed a good relationship with soil particle size distribution for the urban, rural, and desert gradients in the investigated area. The Dv values of soil for the urban gradient showed a better fitness with the contents of clay, sand, and silt, and the fitting degree decreased in the order of: clay (R2 = 0.92) > sand (R2 = 0.73) > silt (R2 = 0.64). In the suburban gradient, the Dv values showed a good fitness with the clay content, low fitness with the silt and sand contents, and the fitting degree decreased in the order of: clay (R2 = 0.99) > sand (R2 = 0.45) > silt (R2 = 0.39). In the rural gradient, the Dv values of soil showed a better fitness with the contents of clay, sand, and silt, and the fitting degree decreased in the order of: clay (R2 = 0.95) > sand (R2 = 0.84) > silt (R2 = 0.80). In the desert soil, the Dv values exhibited better fitness with the contents of clay, sand, and silt, and the fitting degree decreased in the order of: clay (R2 = 0.94) > sand (R2 = 0.86) > silt (R2 = 0.74).
The results above suggest that the fractal dimension is a fundamental parameter that can reflect the soil structure and morphology, and the change in its value can obviously indicate the change in the coarse and fine particle size distributions in urbanization gradients in arid zone oasis cities. The Dv is apparently influenced by the distribution of soil particle sizes [50], and the content of clay particles plays a dominant role for soils in each urbanization gradient zone.

4. Discussion

Generally, the soil particle size distribution comprises different contents of clay, sand, and silt, among which clay has a colloidal character that can obviously promote the soil aggregate formation, enhance the stability of soil structure, and improve the soil erosion resistance. According to prior research findings, the soil texture characteristics and nutrient status are assessable by the content of fine-sized particles (<50 μm) [51,52]. The fine particle size content was high in the investigated soil types in the study area, indicating relatively higher organic matter content of soil. In the present study, the particle size distribution of the entire investigated area is dominated by sand, followed by silt and clay, indicating the relatively worse soil texture in this area. However, the characteristic of soil particle size distribution was different across investigated urbanization gradients. The mean sand content in the rural gradient was obviously higher compared to the rest of the three gradients, while the mean content of silt in the desert gradient was also significantly higher compared to the rest of the three gradients. The CV values for the sand content in the rural soil and for the silt content in the desert soil were all lower than 0.25. Therefore, it can be determined that sand content observed mainly in the rural soil and the silt content observed mainly in the desert soil are likely to have a close relationship with natural factors, such as the soil parent material [53]. The CV values for the clay and silt contents of the rural soil were 0.39 and 0.28, respectively, with a moderate variability. It can be concluded that clay and silt contents of the rural soil may be influenced by both natural and anthropogenic factors. However, in the case of the rural gradient, the main land use type is agricultural land, so a series of anthropogenic practices such as tillage and fertilization may destroy the rural soil structure and crush the coarse soil particle sizes into the fine particle sizes, so that the nutrient utilization is enhanced for the vegetation grown therein [54,55]. The CV values for clay, sand, and silt contents of the urban soil were 0.59, 0.29, and 0.30, respectively. The high spatial heterogeneity of the particle size distribution implies the influences of the urbanization process and natural factors, such as soil erosion, road construction, industrial emissions, commercial activities, and atmospheric deposition [56,57,58].
In the study area, the structural and textural conditions of the soil were reflected by the Dv value of soil particle size, whose value from small to large probably displays the loose-to-dense or coarse-to-fine alteration in texture [59,60]. Previous studies have revealed that the Dv value is around 2.55–2.80 for well-textured loamy soil with high productivity and fertility [61,62]. The fractal dimensions of the soil in the studied urban, suburban, rural, and desert gradients were 2.44, 2.45, 2.36, and 2.51, respectively. The fractal dimension value for all gradient zones was less than 2.55, indicating the poor texture in all urbanization gradient zones in the study area. However, apart from reflecting the fragmentation level of particle size distribution, the fractal dimension can also indicate the degree of soil degradation resulting from urbanization.
The fractal dimension–texture relationships of soils are rather consistent in that the Dv value exhibits a significant positive correlation with the percentages of silt and clay in soil, while it displays a significant negative association with the sand percentage [63]. We obtained the same conclusion in this study that the fractal dimension is linked positively to the silt and clay percentages of soil, whereas negatively to the sand percentage of soil in all urbanization gradient zones in the study area. Therefore, the fractal dimension can also be an indicator that can reflect the characteristics of the fine particle matter content in the soil structure in an arid zone oasis.
However, fractal theory is the most effective way to study complex irregular geometries with fractal characteristics. In this study, we explored the fractal characteristics of soil particle size distribution and the relationship between the fractal dimensions with the parameters of soil along an urban–suburban–rural–desert gradient. Only a single fractal dimension model was used in this study, and it may be unable to reflect the complex spatial variation and heterogeneous behavior [21,22,23]. In future research, the application of a new multifractal dimension model combined with geostatistics can compensate for this shortcoming and can reflect more detailed soil particle size distribution information. The range of the pH values of all collected soil samples in this study was 7.38–8.41, with an average value of 7.85, which is alkaline soil. The physicochemical properties of soil such as pH value can influence the soil particle size distribution [27]. Therefore, future research should consider the relationship between the soil physicochemical properties and soil particle size distribution in different urbanization gradient zones. Due to the differences in human activities in different gradient zones, the particle size distribution characteristics of the same soil type in various gradient zones are different. Future research should also consider the differences and influencing factors of the particle size distribution characteristics of the same soil type in different gradient zones. Moreover, the present study revealed the soil particle size distribution along an urbanization gradient zone in an arid zone oasis city. Future research may focus on the soil particle size distribution along an urbanization gradient in other cities worldwide.

5. Conclusions

Overall, in order to clarify how the soil texture is impacted by the urbanization in arid zones, this study analyzed the distribution characteristics of the soil particle sizes along a representative urban–suburban–rural–desert gradient in the city of Urumqi of the northwest arid zone of China, based on parameters such as the fractal dimension (Dv), sorting coefficient (ơG), skewness (SKG), mean particle size (MG), and kurtosis (KG). The obtained results showed that:
(1)
Sand particles were prevalent in the urban, suburban, and rural soils, followed by silt particles, while the content of clay particles is lowest in the study area. The desert soil is mainly composed of silt particle sizes, followed by sand particle sizes, and the content of clay particle sizes was low. The soil texture was not very good in the study area.
(2)
The soil particle size distribution of the soil in the rural and desert gradients showed a similar frequency curve, while soils in the urban and suburban gradients showed a similar frequency curve.
(3)
The urbanization process and human activities in the study area can obviously affect the percentages of clay, sand, and silt in soil in the urban gradients, as well as the percentages of clay and silt in the rural gradient.
(4)
In each urbanization gradient, the soil particle size distribution features can be indicated by the fractal dimension, which increased with an increase in clay and silt contents and decreased with an increase in sand content.
(5)
The content of fine particle matter in soil structure can be reflected by the fractal dimension.
The present research findings can offer fundamental information relating to the characteristics of soil particle size distribution along an urbanization gradient zone.

Author Contributions

Conceptualization, N.W. and M.E.; methodology, N.W. and D.M.; software, N.W.; validation, N.W. and M.E.; formal analysis, N.W. and N.S.; investigation, N.W.; resources, D.M.; data curation, N.W. and N.S.; writing—original draft preparation, N.W.; writing—review and editing, N.W. and M.E.; visualization, N.W.; supervision, M.E.; project administration, M.E.; funding acquisition, M.E. All authors have read and agreed to the published version of the manuscript.

Funding

This research is funded by the National Natural Science Foundation of China (No. U2003301).

Data Availability Statement

Data will be available upon request to the corresponding author.

Conflicts of Interest

The authors declare no conflict of interest.

References

  1. Dong, Z.-W.; Li, S.-Y.; Mao, D.-L.; Lei, J.-Q. Distribution pattern of soil grain size in Tamarix sand dune in the southwest of Gurbantunggut desert. J. Soil Water Conserv. 2021, 35, 64–72. [Google Scholar]
  2. He, Q.-Q.; Mao, D.-L.; Xu, J.-R.; Zhang, K.-L.; Liu, L.; Yang, G.-C. Sediment granularity characteristics and deposition environment of different dunes in the Cele oasis-desert ecotone. Res. Soil Water Conserv. 2023, 30, 135–145. [Google Scholar]
  3. Chi, Z.; Xu, X.-Y.; Liu, K.-L.; Liu, H.-J.; Meng, R.-L.; Li, Y.-Q.; Fu, L.; Li, X.-N. Study on soil particle size characteristics and spatial pattern of sand deposition in two types of sand barriers. J. Soil Water Conserv. 2021, 35, 113–121. [Google Scholar]
  4. Bai, Y.-F.; Sun, J.; Li, X.-J.; Chen, G.-S.; Li, X.-Y.; Lu, X.-R.; Wen, B.-L.; Zhang, J.-T. Fractal dimension and salinization characteristics of typical halophytic landscape soil in western Songnen plain. J. Soil Water Conserv. 2021, 35, 163–169. [Google Scholar]
  5. Zhao, W.-J.; Cui, Z.; Ma, H. Fractal features of soil particle size distributions and their relationships with soil properties in gravel-mulched fields. Arab. J. Geosci. 2017, 10, 211–218. [Google Scholar] [CrossRef]
  6. He, Y.; Wei, X.; Wei, N.; Yu, W.-Z.; Cui, X.; Zhao, H.-C. Characteristics of soil particle size distribution of mainland surfaces in Qilian mountains. Res. Soil Water Conserv. 2020, 27, 42–47. [Google Scholar]
  7. Zha, C.; Shao, M.; Jia, X.; Zhang, C. Particle size distribution of soils (0~500 cm) in the Loess Plateau, China. Geoderma 2016, 7, 251–258. [Google Scholar] [CrossRef]
  8. Lou, B.-Y.; Wang, Y.-D.; Zhou, N.; Yan, J.-S.; Akida, A. Soil particle size composition characteristics of Pinus sylvestris plantations in Nur-Sultan City. Arid Land Geogr. 2022, 45, 219–225. [Google Scholar]
  9. Wang, M.; Lu, J.-F.; Fu, P.; Dong, Z.-B. Characteristics of soil nutrients and grain size around Badain Jaran Desert. J. Desert Res. 2022, 42, 232–244. [Google Scholar]
  10. Song, X.-Y.; Li, H.-Y. Fractal characteristics of soil particle-size distributions under different landform and land-use types. Adv. Mater. Res. 2011, 201–203, 2679–2684. [Google Scholar] [CrossRef]
  11. Xia, J.; Ren, R.; Chen, Y. Multifractal Characteristics of soil particle distribution under different vegetation types in the Yellow River Delta Chenier of China. Geoderma 2020, 368, 114311. [Google Scholar] [CrossRef]
  12. Wang, Y.-Q.; Shao, M.-G.; Gao, L. Spatial variability of soil particle size distribution and fractal features in water-wind erosion crisscross region on the Loess Plateau of China. Soil Sci. 2010, 175, 579–585. [Google Scholar] [CrossRef]
  13. Hossein, K.; María, G.; Ali, A.; Silvia, M.; Angel, F.; Jose, A.-A. Environmental impact assessment of industrial activities on heavy metals distribution in street dust and soil. Chemosphere 2018, 217, 695–705. [Google Scholar]
  14. Zhu, Q.; Su, L.-J.; Liu, Z.-Y.; Wang, B. An evaluation method for internal erosion potential of gravelly soil based on particle size distribution. J. Mountain Sci. 2022, 19, 1203–1214. [Google Scholar] [CrossRef]
  15. Li, X.-P.; Gao, Y.; Zhang, M.; Zhang, Y.; Yu, H.-T. In vitro lung and gastrointestinal bioaccessibility of potentially toxic metals in Pb-contaminated alkaline urban soil: The role of particle size fractions. Ecotoxicol. Environ. Saf. 2020, 190, 110151. [Google Scholar] [CrossRef] [PubMed]
  16. Chang, C.-S.; Deng, Y.-B. Modeling for critical state line of granular soil with evolution of grain size distribution due to particle breakage. Geosci. Front. 2020, 11, 473–486. [Google Scholar] [CrossRef]
  17. Liu, W.-G.; Liu, Z.-H.; Sun, J.-M.; Song, C.-H.; Chang, H.; Wang, H.-Y.; Wang, Z.; An, Z.-S. Onset of permanent Taklimakan Desert linked to the mid-Pleistocene transition. Geology 2020, 48, 782–786. [Google Scholar] [CrossRef]
  18. Su, Y.-Z.; Yang, R.; Liu, T.-N. Effects of long-term different fertilization on soil fertility and soil organic carbon accumulation in psamments of oasis farmland. J. Desert Res. 2019, 39, 1–6. [Google Scholar]
  19. Hu, H.-C.; Tian, F.-Q.; Hu, H.-P. Soil particle size distribution and its relationship with soil water and salt under mulched drip irrigation in Xinjiang of China. Technol. Sci. 2011, 54, 1568–1574. [Google Scholar] [CrossRef]
  20. Cheng, H.; He, W.-W.; Liu, C.-C.; Zou, X.-Y.; Kang, L.-Q.; Chen, T.-L.; Zhang, K.-D. Transition model for airflow fields from single plants to multiple plants. Agric. For. Meteorol. 2019, 266–267, 29–42. [Google Scholar] [CrossRef]
  21. Wang, J.-M.; Zhang, J.-R.; Feng, Y. Characterizing the spatial variability of soil particle size distribution in an underground coal mining area: An approach combining multi-fractal theory and geostatistics. Catena 2019, 176, 94–103. [Google Scholar] [CrossRef]
  22. Chen, L.; Wang, H.; Liu, C.; Cao, B.-Z.; Wang, J. Use of multifractal parameters to determine soil particle size distribution and erodibility of a physical soil crust in the Loess Plateau, China. Catena 2022, 219, 106641. [Google Scholar] [CrossRef]
  23. Jing, Z.-R.; Wang, J.-M.; Wang, R.-G.; Wang, P. Using multi-fractal analysis to characterize the variability of soil physical properties in subsided land in coal-mined area. Geoderma 2019, 176, 94–103. [Google Scholar] [CrossRef]
  24. Sowinski, P.; Smólczynski, S.; Orzechowski, M.; Kalisz, B.; Bieniek, A. Effect of soil agricultural use on particle-size distribution in Young Glacial landscape slopes. Agriculture 2023, 13, 584. [Google Scholar] [CrossRef]
  25. Zhang, H.; Wang, C.; Chen, Z.; Kang, Q.; Xu, X.; Gao, T. Performance comparison of different particle size distribution models in the prediction of soil particle size characteristics. Land 2022, 11, 2068. [Google Scholar] [CrossRef]
  26. Jena, R.-K.; Moharana, P.-C.; Dharumarajan, S.; Sharma, G.-K.; Ray, P.; Deb Roy, P.; Ghosh, D.; Das, B.; Alsuhaibani, A.-M.; Gaber, A. Spatial prediction of soil particle-size fractions using digital soil mapping in the North Eastern Region of India. Land 2023, 12, 1295. [Google Scholar] [CrossRef]
  27. Bi, X.-Q.; Chu, H.; Fu, M.-M.; Xu, D.-D.; Zhao, W.-Y.; Zhong, Y.-J.; Wang, M.; Li, K.; Zhang, Y.-N. Distribution characteristics of organic carbon (nitrogen) content, cation exchange capacity, and specific surface area in different soil particle sizes. Sci. Rep. 2023, 13, 12242. [Google Scholar] [CrossRef]
  28. Li, Q.; Hu, Z.; Zhang, F.; Song, D.; Liang, Y.; Yu, Y. Multispectral remote sensing monitoring of soil particle-size distribution in arid and semi-arid mining areas in the middle and upper reaches of the Yellow River Basin: A case study of Wuhai City, Inner Mongolia Autonomous Region. Remote Sens. 2023, 15, 2137. [Google Scholar] [CrossRef]
  29. Li, X.-S.; Chang, C.-P.; Wang, R.-D. Influence of land use ways on the farmland soil wind erosion in Bashang area, Hebei, China. J. Desert Res. 2014, 34, 23–28. [Google Scholar]
  30. Qiu, J.; Wang, H.-D.; Zheng, Y.-P.; Xu, C.-L.; Shi, D.-L. Fractal features of soil particles under different land uses in a coastal reclamation area. Res. Agric. Mod. 2020, 41, 882–888. [Google Scholar]
  31. Qi, F.; Zhang, H.-R.; Liu, X.; Niu, Y.; Zhang, D.-H.; Li, H.; Li, Z.-J.; Wang, Y.-B.; Zhang, C.-G. Soil particle size distribution characteristics of different land-use types in the Funiu mountainous region. Soil Tillage Res. 2018, 184, 45–51. [Google Scholar] [CrossRef]
  32. Wang, Y.-Y.; He, J.-Y.; Zhan, J.; Li, P.-Z. Identification of soil particle size distribution in different sedimentary environments at river basin scale by fractal dimension. Sci. Rep. 2022, 12, 10960. [Google Scholar] [CrossRef] [PubMed]
  33. Sha, G.-L.; Wei, T.-X.; Chen, Y.-X.; Fu, Y.-C.; Ren, K. Characteristics of soil particle size distribution of typical plant communities on the hilly areas of Loess Plateau. Arid Land Geogr. 2022, 45, 1224–1234. [Google Scholar]
  34. Fu, D.-S.; Ren, X.-M.; Wang, Y.-L.; Zhang, C.-Y.; Meng, Z.-J. Distribution characteristics of soil particle size in farming-pastoral ecotone: A case study of Wuchuan county in Inner Mongolia. Arid Zone Res. 2022, 39, 1322–1332. [Google Scholar]
  35. Liu, Y.-L.; Zhang, L.-J.; Han, X.-F.; Zhang, T.-F.; Shi, Z.-X.; Lu, X.-Z. Spatial variability and evaluation of soil heavy metal contamination in the urban transect of Shanghai. Chin. J. Environ. Sci. 2012, 33, 599–605. [Google Scholar]
  36. Gao, Z.-Y.; Niu, F.-J.; Liu, Z.-J.; Luo, J. Fractal and multifractal analysis of soil particle-size distribution and correlation with soil hydrological properties in active layer of Qinghai-Tibet Plateau, China. Catena 2021, 203, 105373. [Google Scholar] [CrossRef]
  37. Niu, X.; Gao, P.; Wang, B.; Liu, Y. Fractal characteristics of soil retention curve and particle size distribution with different vegetation types in mountain areas of Northern China. Environ. Res. Public Health 2015, 12, 15379–15389. [Google Scholar] [CrossRef] [PubMed]
  38. Chen, T.-L.; Shi, Z.-L.; Wen, A.-B.; Yan, D.-C.; Gou, J.; Chen, J.-C.; Liu, Y.; Chen, R.-Y. Multifractal characteristics and spatial variability of soil particle-size distribution in different land use patterns in a small catchment of the Three Gorges Reservoir Region, China. J. Mt. Sci. 2021, 18, 111–125. [Google Scholar] [CrossRef]
  39. Li, J.-M.; Zhang, Y.-T. Characteristics of heavy metal pollution in forest belt soil of different functional zones in Urumqi, Xinjiang. Ecol. Environ. Sci. 2019, 28, 1859–1866. [Google Scholar]
  40. Wang, Y. Urban Spatial Morphological Evolution Based on GIS Analysis of Remote Sensing Data—A Case Study of Urumqi. Master’s Thesis, Xinjiang University, Urumqi, China, 2019. [Google Scholar]
  41. Nazupar, S.; Mamattursun, E.; Li, X.-G.; Wang, Y.-H. Spatial distribution, contamination levels, and health risks of trace elements in topsoil along an urbanization gradient in the city of Urumqi, China. Sustainability 2022, 14, 12646. [Google Scholar]
  42. Maas, S.; Scheifler, R.; Benslama, M.; Crini, N.; Lucot, E.; Brahmia, Z.; Benyacoub, S.; Giraudoux, P. Spatial distribution of heavy metal concentrations in urban, suburban, and agricultural soils in a Mediterranean city of Algeria. Environ. Pollut. 2010, 158, 2294–2301. [Google Scholar] [CrossRef] [PubMed]
  43. Wei, B.-G.; Jiang, Q.-F.; Li, M.-X.; Mu, Y.-S. Heavy metal induced ecological risk in the city of Urumqi, NW China. Environ. Monit. Assess. 2010, 160, 33–45. [Google Scholar] [CrossRef] [PubMed]
  44. Gulbanu, H.; Mamattursun, E.; Wang, W.-W.; Ili, A.; Li, X.-G. Spatial distribution, contamination levels, sources, and potential health risk assessment of trace elements in street dust of Urumqi city, NW China. Hum. Ecol. Risk Assess. 2020, 26, 2112–2128. [Google Scholar]
  45. Folk, R.-L.; Ward, W.-C. Brazos River bar: A study in the significance of grain size parameters. J. Sediment. Petrol. 1957, 27, 3–26. [Google Scholar] [CrossRef]
  46. Tyler, S.-W.; Wheatcraft, S.-W. Fractal scaling of soil particle-size distributions: Analysis and limitations. Soil Sci. Soc. Am. J. 1992, 56, 362–369. [Google Scholar] [CrossRef]
  47. Markovic, S.; Stojanovic, Z. Determination of particle size distributions by laser diffraction. Tech.-New Mater. 2012, 21, 11–20. [Google Scholar]
  48. Wei, C.-H.; Shen, G.; Pei, Z.-X.; Ren, M.-L.; Lu, J.-L.; Wang, Q.; Wang, W.-J. Effects of different plant cultivation on soil physical-chemical properties and fine root growth in saline-alkaline soil in Songnen Plain, northeastern China. Bull. Bot. Res. 2015, 35, 759–764. [Google Scholar]
  49. Mohammadi, M.-H.; Meskini-Vishkaee, F. Predicting soil moisture characteristic curves from continuous particle-size distribution data. Pedosphere 2013, 23, 70–80. [Google Scholar] [CrossRef]
  50. Dong, Z.-W.; Li, S.-Y.; Mao, D.-L.; Lei, J.-Q. Fractal features of soil grain-size distribution in a typical Tamarix cone in the Taklimakan Desert, China. Sci. Rep. 2022, 12, 16461. [Google Scholar] [CrossRef]
  51. Tang, G.-Y.; Xiao, H.; Su, Y.-R.; Huang, D.-Y.; Liu, S.-L.; Huang, M.; Tong, C.-L.; Wu, J.-H. Spatial variation in organic carbon, nutrients and microbial biomass contents of paddy soils in a hilly red soil region. Front. Agric. China 2007, 1, 424–429. [Google Scholar] [CrossRef]
  52. Zuo, X.-A.; Zhao, H.-L.; Zhao, X.-Y.; Guo, Y.-R.; Yun, J.-Y.; Wang, S.-K.; Miyasaka, T. Vegetation pattern variation, soil degradation and their relationship along a grassland desertification gradient in Horqin Sandy Land, northern China. Environ. Geol. 2009, 58, 1227–1237. [Google Scholar] [CrossRef]
  53. Deng, J.-F.; Li, J.-H.; Deng, G.; Zhu, H.-Y.; Zhang, R.-H. Fractal scaling of particle-size distribution and associations with soil properties of Mongolian pine plantations in the Mu Us Desert, China. Sci. Rep. 2017, 7, 6742. [Google Scholar] [CrossRef] [PubMed]
  54. Xu, G.-C.; Li, Z.-B.; Li, P. Fractal features of soil particle-size distribution and total soil nitrogen distribution in a typical watershed in the source area of the middle Dan River, China. Catena 2013, 101, 17–23. [Google Scholar] [CrossRef]
  55. Li, Q.; Ji, H.-B.; Qin, F.; Tang, L.; Guo, X.-Y.; Feng, J.-G. Sources and the distribution of heavy metals in the particle size of soil polluted by gold mining upstream of Miyun Reservoir, Beijing: Implications for assessing the potential risks. Environ. Monit. Assess. 2014, 186, 6605. [Google Scholar] [CrossRef]
  56. Zhang, X.; Zhao, W.-W.; Wang, L.-X.; Liu, Y.-X.; Liu, Y.; Feng, Q. Relationship between soil water content and soil particle size on typical slopes of the Loess Plateau during a drought year. Sci. Total Environ. 2019, 648, 943–954. [Google Scholar] [CrossRef] [PubMed]
  57. Guo, Z.-L.; Li, J.-F.; Chang, C.-P.; Zou, X.-Y.; Wang, R.; Zhou, N.; Li, Q. Logistic growth models for describing the fetch effect of aeolian sand transport. Soil Tillage Res. 2019, 194, 104306. [Google Scholar] [CrossRef]
  58. Margaret, R.-D.; Pamela, A.-H.; Anne, M.-C. Potential for using soil particle-size data to infer geological parent material in the Sydney Region. Soil Res. 2013, 51, 301–310. [Google Scholar]
  59. Liu, X.; Zhang, G.-C.; Heathman, G.-C.; Wang, Y.-Q.; Huang, C.-H. Fractal features of soil particle-size distribution as affected by plant communities in the forested region of Moutain Yimeng, China. Geoderma 2009, 154, 123–130. [Google Scholar] [CrossRef]
  60. Anwar, E.; Mamattursun, E.; Jin, W.-G.; Li, X.-G. The environmental capacity of heavy metals in farmland soils in Yanqi Basin, Xinjiang. Environ. Eng. 2020, 38, 168–173. [Google Scholar]
  61. Mamattursun, E.; Anwar, M.; Ajigul, M.; Gulbanu, H. A human health risk assessment of heavy metals in agricultural soils of Yanqi Basin, Silk Road Economic Belt, China. Hum. Ecol. Risk Assess. 2018, 24, 1352–1366. [Google Scholar]
  62. Marhaba, T.; Mamattursun, E.; Aynur, M.; Wang, W.-W. Evaluation and prediction of environmental capacities of heavy metals in vineyard soils in the Turpan Basin. Earth Environ. 2020, 48, 584–592. [Google Scholar]
  63. Huang, J.; Li, Y.; Fu, C.; Chen, F.; Fu, Q.; Dai, A.; Shinoda, M.; Ma, Z.; Guo, W.; Li, Z. Dryland climate change: Recent progress and challenges. Rev. Geophys. 2017, 55, 719–778. [Google Scholar] [CrossRef]
Figure 1. Map of the study area and sample sites.
Land 12 02120 g001
Figure 2. The soil particle size volume fraction curve of different gradients. (a) Frequency distribution curve of soil particle size; (b) Accumulative frequency distribution curve of soil particle size.
Land 12 02120 g002
Figure 3. Soil parameter characteristics in each gradient in the investigated area.
Land 12 02120 g003
Figure 4. Soil fractal dimension features under various gradients.
Land 12 02120 g004
Figure 5. Linear regression relationship between soil particle size and fractal dimension.
Land 12 02120 g005
Table 1. Grades of sorting coefficient (σG), skewness (SKG), and kurtosis (KG).
σGSorting GradeSKGSkewness GradeKGKurtosis Grade
ơG ≤ 0.35Excellent–1.00 ≤ SKG < –0.30Extremely negativeKG ≤ 0.67Very broad and flat
0.35 < ơG ≤ 0.50Good–0.30 ≤ SKG < –0.10Negative0.67 < KG ≤ 0.90Broad and flat
0.50 < ơG ≤ 0.71Better–0.10 ≤ SKG < 0.10Nearly symmetric0.90 < KG ≤ 1.11Medium
0.71 < ơG ≤ 1.00Medium0.10 ≤ SKG < 0.30Positive1.11 < KG ≤ 1.50Narrow
1.00 < ơG ≤ 2.00Rather poor0.30 ≤ SKG ≤ 1.00Extremely positive1.50 < KG ≤ 3.00Very narrow
2.00 < ơG ≤ 4.00Poor KG > 3.00Extremely narrow
ơG > 4.00Extremely poor
Table 2. Proportion of samples with different textures in different gradients in the study area.
RegionsLoamy Sand (%)Clay Soil (%)Clay Loam (%)Sandy Soil (%)
Urban 80.8511.907.140
Suburban 94.7405.260
Rural81.250018.75
Desert72.73027.270
Whole study area82.955.687.953.41
Table 3. Distribution of soil particle sizes in different gradients for the study area.
GradientStatisticsClay (%)Silt (%)Sand (%)Dv
Urban
(n = 42)
Min1.6820.849.102.32
Max15.0175.8977.492.68
Mean4.0843.7652.162.44
SD2.3913.1915.030.06
CV0.590.300.290.03
Suburban
(n = 19)
Min3.2030.9732.162.42
Max4.8863.7365.712.49
Mean4.0239.9356.052.45
SD0.567.577.900.02
CV0.140.190.140.01
Rural
(n = 16)
Min0.2511.4359.652.22
Max4.1436.4787.682.46
Mean2.4124.5373.062.36
SD0.946.867.700.06
CV0.390.280.110.03
Desert
(n = 11)
Min2.5637.365.632.38
Max16.5677.8159.642.69
Mean6.6055.5037.902.51
SD4.4413.0816.780.10
CV0.670.240.440.04
Whole study area
(n = 88)
Min0.2511.435.632.22
Max16.5677.8187.682.69
Mean4.0840.9055.022.44
SD2.5914.3116.350.08
CV0.640.350.300.03
Disclaimer/Publisher’s Note: The statements, opinions and data contained in all publications are solely those of the individual author(s) and contributor(s) and not of MDPI and/or the editor(s). MDPI and/or the editor(s) disclaim responsibility for any injury to people or property resulting from any ideas, methods, instructions or products referred to in the content.

