Abstract
Water use efficiency (WUE) has garnered considerable attention at global and regional levels. However, spatio-temporal variations of WUE and related influencing factors in the complex karst landforms of southwest China require further elucidation. Herein, the ratio of gross primary productivity (GPP) to evapotranspiration (ET) obtained through the PML-V2 product was used to characterize ecosystem WUE, the spatio-temporal variations to ecosystem WUE, and responses to temperature, precipitation, and the enhanced vegetation index (EVI) in southwest China. The results showed that: (1) The ecosystem WUE in southwest China decreased with increasing latitude and altitude. Spatially, the ecosystem WUE fluctuates in a “W” pattern with increasing longitude because of the karst landforms’ distribution patterns. (2) The non-significant trend in increased ecosystem WUE during 2003–2017 may be associated with significant increases in the ET offsetting part of the GPP contribution to ecosystem WUE. Spatial distribution of changes in WUE is similar to GPP owing to the dominant role of GPP in changes to ecosystem WUE. (3) The multi-year average ecosystem WUE was lower in karst than in non-karst landforms; however, vegetation restoration projects have contributed in significantly increasing variation rate of ecosystem WUE in karst than that in non-karst landforms. (4) Temperature, precipitation, and EVI were generally positively correlated with ecosystem WUE and were important factors for the increase in ecosystem WUE. EVI characterized vegetation restoration indicators showed that the ecological engineering construction in the study area was effective and was the dominant factor of ecosystem WUE change in 59.59% of the study area. The results of this study are important for further understanding carbon and water cycling processes in karst regions.
1. Introduction
Water use efficiency (WUE) is crucial to plant photosynthesis and transpiration, and is an important indicator of the carbon and water cycles in ecosystems [1]. WUE of ecosystems is commonly defined as the ratio of gross primary productivity (GPP) to evapotranspiration (ET) to quantify the amount of water consumed by an ecosystem relative to the obtained carbon. Notable differences have been observed in the spatio-temporal variations in WUE and other factors that drive regional ecosystems [2,3,4,5]. Therefore, it is important to explore these differences in spatio-temporal variations and the underlying control mechanisms to evaluate and predict the impact of global changes on the carbon and water cycles of regional ecosystems and to plan and manage regional water resources.
To date, many scholars have conducted research in different regions to explore the spatio-temporal variations of ecosystem WUE and their influencing factors. For example, in degraded grassland zones of the Tibetan Plateau, which are sensitive to climate change, interannual variation in WUE tends to increase, with temperature being the main factor [6]. In the Loess Plateau, where large-scale afforestation was implemented, vegetation greening was responsible for the increase in WUE of most regional ecosystems, and precipitation and soil moisture also contributed positively to it [7]. In arid and water-scarce northwest China, precipitation is the primary driver of increased WUE, whereas secondary drivers vary among different landforms [8]. The above studies show that climate change and the significant differences in the subsurface have resulted in different characteristics and drivers for spatio-temporal variations to WUE at the regional level.
Southwest China is the largest contiguous karst region globally, which is characterized by fragile ecosystems because of extensive stone desertification and soil erosion [9]. To mitigate the ecological issues in this region, the government of China has conducted a series of critical projects aimed to restore the ecosystems and increase vegetation coverage [10,11,12]. These projects have achieved remarkable success in significantly increasing vegetation coverage [13,14]. In addition, the spatial distribution of meteorological elements in the mountainous areas of southwest China is notably heterogeneous. Therefore, to gain a comprehensive understanding of the spatio-temporal variations to WUE and related influencing factors, it is imperative to conduct research in the karst region of southwest China.
Thus far, studies of WUE in southwest China have been somewhat fruitful. For example, Sun et al. [15] found that WUE increased with elevation at the Gongga Station located on the eastern slope of the Tibetan Plateau and gradient and temperature are among the main factors driving variations in WUE. Ding et al. [16] studied four provincial administrative regions in southwest China using Breathing Earth System Simulator (BESS) products and reported that ecosystem WUE therein had significantly increased from 2001 to 2015, which was driven by ecological restoration projects, such as afforestation and planting of grasslands. In contrast, Shi et al. [17] analyzed eight administrative districts in southwest China on the basis of Moderate Resolution Imaging Spectroradiometer (MODIS) products and found that WUE tended to decrease therein and was positively correlated with temperature but negatively correlated with precipitation. In summary, although there are some results on WUE in southwest China, the spatio-temporal variations and drivers are somewhat different because the study area, data sources, and methods are not fully consistent. Therefore, further studies are warranted to identify factors influencing spatio-temporal variations to WUE in karst landforms.
The objective of this study is to understand the spatial and temporal variation of WUE and the driving factors in the karst region of southwest China. In this study, three provincial administrative regions of China (i.e., Yunnan, Guizhou, and Guangxi), which are characterized by widely distributed and relatively continuous karst landforms, were considered the study area. The Penman–Monteith–Leuning V2 (PML-V2) product with higher spatial resolution and accuracy was chosen to calculate WUE, and more robust methods, such as partial correlation analysis and random forest model, were used to study the spatio-temporal variations of WUE and explore the influence of temperature, precipitation, and enhanced vegetation index (EVI) on ecosystem WUE changes. The results of this study will help to clarify the factors driving carbon and water cycles in karst regions and provide important theoretical support for ecological restoration.
2. Data and Methods
2.1. Study Area
In this study, the southwestern region of China was divided into three administrative districts: Yunnan, Guizhou, and Guangxi (Figure 1a). The study area extends between 97.5–112° E and 21.1–29.2° N, covering an area of 796,773 km2. The topography is high in the west and low in the east, with an average elevation of 1276 m above sea level. Among the three administrative districts, Yunnan and Guizhou form the main part of the Yunnan-Guizhou Plateau, while the Guangxi Zhuang Autonomous Region is a relatively low hilly area (Figure 1b). Most of the study area is a karst landform with a mixed distribution of pure and impure carbonates in the bedrock, with the remaining area consisting of a non-karst landform with clastic rocks distributed within bedrock (Figure 1c). The study area has a predominantly monsoonal climate with an average annual temperature of 17.6 °C and total annual precipitation of 1021 mm. Past high-intensity human activities have resulted in ecological degradation of the fragile karst area, whereas recent large-scale ecological engineering projects have gradually improved the ecological environment.
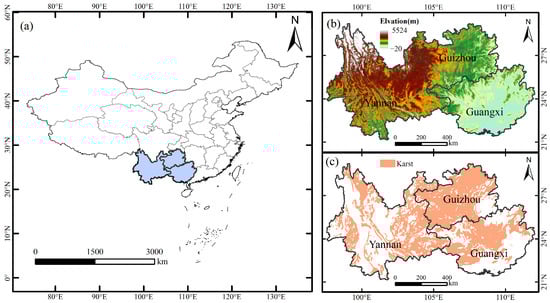
Figure 1.
(a) Location of the study area in China. (b) Elevation of the study area. (c) Distribution of karst landforms in the study area.
2.2. Data Sources and Processing
2.2.1. Remote Sensing Data
The ecosystem WUE was calculated with the PML-V2 product with GPP and ET and a spatial resolution of 500 m. This product uses the same forcing data and couples the two internal processes of GPP and vegetative transpiration with high accuracy [18]. In this study, the Google earth engine platform was downloaded (https://code.earthengine.google.com/?asset=projects/pml_evapotranspiration/PML/OUTPUT/PML_V2_8day_v014 (accessed on 1 December 2022)) and preprocessed to obtain the annual WUE from 2003 to 2017, as calculated by the ratio of GPP and ET.
EVI data from 2003 to 2017 were obtained from the MOD13A1 product (https://lpdaac.usgs.gov/products/mod13a1v006/ (accessed on 1 December 2022)), which has a temporal resolution of 16 days and spatial resolution of 500 m. To remove cloud contamination, data were reconstructed with the harmonic analysis of time series method [19] and corrected with quality control files. Pixels affected by clouds and noise were filled with reconstructed data. Finally, monthly EVI data were obtained with the maximum value composite method and annual data were obtained by averaging the monthly EVI for each year.
2.2.2. Meteorological and Other Auxiliary Data
Annual average temperature and total annual precipitation data from 2003 to 2017 were obtained from 280 stations in and around the study area from the China Meteorological Data Network (http://www.data.cma.cn (accessed on 1 December 2022)). Data with a spatial resolution of 90 m were obtained from a digital elevation model (Shuttle Radar Topography Mission version 3.0; U.S. Geological Survey) and resampled to 500 m using bilinear interpolation. Precipitation was interpolated using thin plate splines with ANUSPLIN software [20] with longitude and latitude as independent variables. Due to the high correlation between temperature and elevation, elevation was used as a covariate of temperature and interpolated using the same method. Finally, temperature and precipitation data with a spatial resolution of 500 m were generated.
2.3. Data Analysis Methods
2.3.1. Theil–Sen Median Trend Analysis and the Mann–Kendall (M-K) Test
Theil-Sen median trend analysis and the M-K test were performed to investigate the variation rates and significance of the GPP, ET, and ecosystem WUE at a pixel scale. Theil-Sen median trend analysis can eliminate the effects of anomalous data on the trend to some extent and is more suitable to assess the variation rate of variables in short-term series. The M-K test does not require the assumption of variance normality and has a more solid statistical theoretical basis for testing of significance [21], rendering the results more scientifically credible, and is widely used in ecology-related studies [22,23,24].
where Sen is the slope and xj and xi are the data values at time j and i, respectively.
The Z statistic for the M-K test was:
where
The Z statistic is the standard normal distribution, where |Z| > 1.96 and 2.58 indicate significance at the 95% and 99% confidence levels, respectively.
2.3.2. Partial Correlation Analysis
The relationship between WUE and temperature, precipitation, and EVI was explored by second-order partial correlation. The correlation between one independent variable and ecosystem WUE, as the dependent variable, was analyzed separately by controlling for other variables. This method has been used in prior studies to overcome the shortcomings of simple correlation analysis [25,26,27].
rxy,z2, rxz1,z2, and ryz1,z2 are calculated from Equation (7) as follows:
rxy is the correlation coefficient, which is calculated from Equation (8):
rxy,z1z2 is the partial correlation coefficient of variables x and y after excluding the effect of the control variables z1 and z2.
The significance of the partial correlation coefficient was determined with the t-test:
where r is the partial correlation coefficient, n is the number of samples, and q is the number of degrees of freedom. A probability (p) value ≤ 0.05 was considered statistically significant.
2.3.3. Random Forest (RF) Model
In this study, the influence of temperature, precipitation, and EVI on changes to ecosystem WUE were ranked on a pixel scale using the RF model, which is a powerful nonparametric machine learning algorithm with a clear structure that is easy to interpret and stable with less susceptibility to overfitting [28]. The RF model is commonly used for clustering and regression analysis and to assess the importance of influencing factors [29,30,31]. In this study, RF regression analysis was conducted with the “randomForest” function of R software (https://www.r-project.org/ (accessed on 1 December 2022)) with WUE as the dependent variable and temperature, precipitation, and EVI as the independent variables. After adjustments, the parameters “mtry” and “ntree” were set at 3 and 500, respectively, while all other parameters were set at default values. The mean decrease accuracy (%IncMSE) was calculated to quantify the relative importance of the independent variables. The RF model defines %IncMSE as the extent that model accuracy is reduced by excluding a variable. Therefore, for a given variable, the larger the %IncMSE, the greater the importance.
3. Results
3.1. Spatial Distribution Characteristics of Ecosystem WUE, GPP, and ET
The spatial distribution patterns of GPP, ET, and ecosystem WUE were analyzed in terms of three dimensions describing geospatial location: longitude, latitude, and elevation. As shown in Figure 2, the multi-year averages of GPP, ET, and ecosystem WUE were 2009.41 gC m−2 yr−1, 719.01 mm yr−1, and 2.80 gC mm−1 m−2 yr−1, respectively. The spatial distributions of GPP, ET, and ecosystem WUE were relatively similar, with multi-year averages showing distributions of high values in the south and low values in the north, and all increased with decreasing latitude, as illustrated in the statistical plots on the left of each panel in Figure 2.
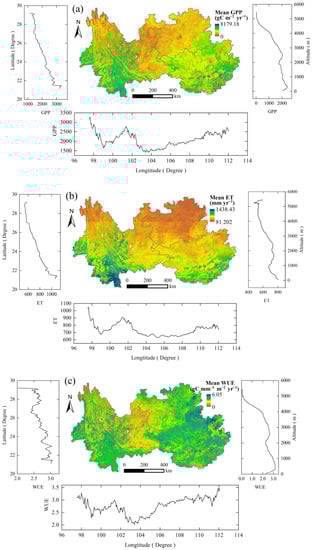
Figure 2.
Spatial patterns of multi-year mean values of (a) GPP, (b) ET, and (c) ecosystem WUE. The statistics of longitude, latitude, and elevation are presented in the bottom panel, left panel, and right panel, respectively.
As demonstrated by the combination of Figure 1b and Figure 2, the comparatively high values of GPP, ET, and ecosystem WUE are distributed in non-karst landform areas in Guangxi, southeastern Guizhou, and southern Yunnan. GPP, ET, and ecosystem WUE fluctuate in a “W” pattern with increasing longitude (Figure 2, bottom panel). The spatial distribution is influenced by geomorphology, with two low valley areas and numerous karst landforms distributed along the longitude.
The combination of Figure 1b and the right panel of Figure 2 demonstrates that topographically, GPP, ET, and ecosystem WUE decreased with increasing elevation. As an explanation for this obvious phenomenon, the higher the altitude, the lower the temperature and precipitation, which are unfavorable for the growth, photosynthesis, and transpiration of vegetation; thus, the lower GPP, ET, and ecosystem WUE.
3.2. Interannual Change Trends of Ecosystem WUE, GPP, and ET
The interannual variation of GPP, ET, and ecosystem WUE over a 15-year period is shown in Figure 3a. Ecosystem WUE was highest in 2009 at 3.14 gC mm−1 m−2 yr−1 and lowest in 2005 at 2.62 gC mm−1 m−2 yr−1. The study area experienced drought conditions for three consecutive years from 2009 to 2012. It has been shown that a slight drought at the beginning of the drought can improve the water use efficiency of plants [32], which may be the reason for the large WUE of the ecosystem in 2009. However, persistent drought conditions cause severe water stress to vegetation [33], as demonstrated by the rapid decrease in ecosystem WUE after 2009. Although GPP, ET, and ecosystem WUE all exhibited an upward trend from 2003 to 2017, passing the significance test of p < 0.05, the change to WUE was not significant. The variation rate of GPP was much greater than that of ET. Hence, GPP had a greater impact on changes to ecosystem WUE than ET.
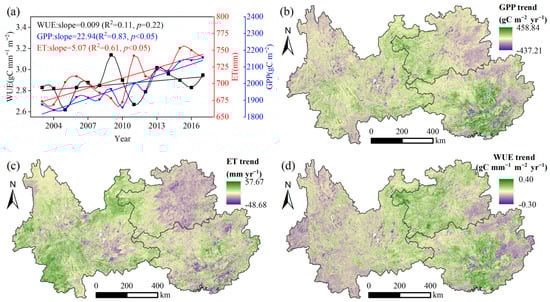
Figure 3.
(a) Interannual variations of GPP, ET, and ecosystem WUE from 2003 to 2017. Spatial trends of (b) GPP, (c) ET, and (d) ecosystem WUE.
The regions with greater variations to GPP were distributed in central Guangxi, western Guizhou, and the border with Yunnan (Figure 3b). The combination of Figure 2a and Figure 3b illustrates that the rate of change to GPP was greater in regions with a lower annual average GPP, which may be related to the implementation of large-scale ecological projects by the government of China in the ecologically fragile region. The areas with increasing and decreasing GPP trends accounted for 85.60% and 14.40% of the total study area, respectively, and the percentage of the area of the pixels that reached significance (p < 0.05) was 58.10% and 3.41%, respectively. The regions with higher ET variation rates were distributed in southwest Yunnan and northwest Guizhou bordering Yunnan. The areas with increasing and decreasing trends of ET accounted for 85.53% and 14.47% of the total study area, respectively, and the percentage of areas with significant change to the pixels were 46.41% and 2.60%, respectively.
The spatial distributions of ecosystem WUE and GPP tended to be very similar, indicating that among the effects of GPP and ET on ecosystem WUE, the trends in ecosystem WUE were strongly influenced by variations in GPP, demonstrating the dominant role of GPP. This is the same result derived from the greater interannual GPP variation rate than ET in Figure 3a. The areas with increasing and decreasing trends in ecosystem WUE accounted for 65.89% and 34.11% of the total study area, respectively, while areas with significant variations in pixels accounted for 37.05% and 10.52%, respectively. Ecosystem WUE variations tended to increase with GPP and ET, but were not significant in most of the study area.
3.3. Relationship between Impact Factors and Ecosystem WUE
The multi-year averages of temperature, precipitation, and EVI in the study area are presented in Figure 4(a1)–(a3), respectively. Vegetation growth is improved in warm and humid areas, and areas with greater temperatures and precipitation have high distributions of EVI. The spatial distribution patterns of temperature, precipitation, and EVI are very similar to those of GPP and ET, demonstrating that temperature, precipitation, and EVI influence the spatial distribution pattern of ecosystem WUE, mainly in the form of overall decreases in temperature, precipitation, EVI, and ecosystem WUE with increasing latitude and altitude.
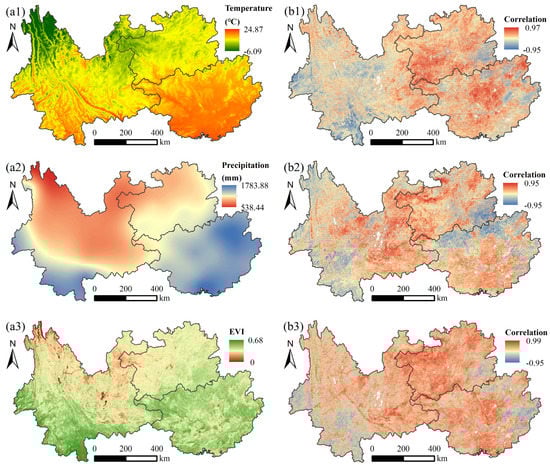
Figure 4.
Spatial distribution patterns of multi-year mean of temperature (a1), precipitation (a2), and EVI (a3). Partial correlation coefficient between annual mean temperature (b1), total annual precipitation (b2), EVI (b3) and ecosystem WUE.
The partial correlation coefficients of the mean annual temperature, total annual precipitation, EVI, and annual ecosystem WUE exhibited heterogeneous spatial distributions (Figure 4(b1–b3)). Temperature was generally positively correlated with ecosystem WUE, accounting for 68.90% of the total study area, with significant associations in 12.37% (p < 0.05). The regions positively correlated with temperature were mainly distributed in Guizhou and Guangxi (Figure 4(b1)). The proportions of the area with positive and negative correlations between precipitation and ecosystem WUE in the study area were not significantly different, accounting for 57.65% and 42.35% of the total study area, respectively, with 9.58% and 7.95% demonstrating a significant correlation (p < 0.05). The regions with negative correlations were concentrated in western Yunnan and the border between Guizhou and Guangxi (Figure 4(b2)). The overall positive correlation between EVI and ecosystem WUE was significant, and the pixels with positive correlation coefficients were distributed throughout almost the entire study area, and the proportion of positive correlation was 77.97% of the total study area with 33.46% significantly correlated (p < 0.05). Meanwhile, regions with negative correlations were sporadically distributed throughout the study area (Figure 4(b3)).
3.4. Dominant Factors Influencing Variations in Ecosystem WUE
The spatial distribution patterns of the dominant factors influencing WUE variation are shown in Figure 5, as indicated by the maximum %IncMSE value among these factors (temperature, precipitation, and EVI) at each pixel. Specifically, EVI was the largest contributor to the spatio-temporal variations in WUE, accounting for 59.59% of the entire study area, especially western and northeastern Guizhou and west-central Guangxi. The regions most influenced by temperature and precipitation accounted for 18.23% and 22.18%, respectively, of the total study area, showing only a small difference. Temperature was the most influential factor influencing variation in WUE in southern Yunnan and southwestern Guizhou, while precipitation was the most influential factor mainly in southeastern Guizhou and northeastern Guangxi, with the other meteorological factors sporadically distributed in southern Yunnan and southern Guangxi. Combined with the landform areas (Figure 1c), the non-karst landform areas were mostly dominated by meteorological factors, such as temperature and precipitation, while the karst areas were mostly dominated by EVI.
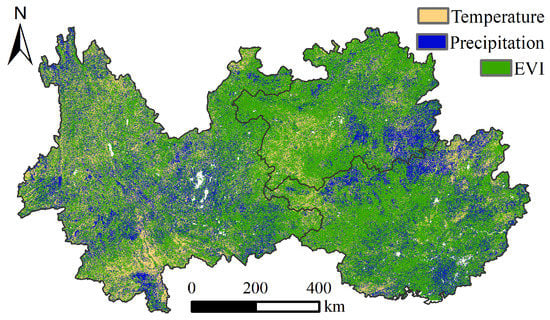
Figure 5.
Spatial distribution of dominant factors influencing variations in ecosystem WUE.
To further investigate how EVI is the dominate factor influencing changes to ecosystem WUE, the interannual rate of EVI variation was divided into regions exhibiting significant increases and decreases (p < 0.05). The areas with significant increases were almost always the same as the areas with EVI as the most dominate factor influencing WUE variation, accounting for 65.83% of the total study area, with 1.56% demonstrating a significant decrease, which were scattered throughout northern Yunnan (Figure 6a). The mean value of ecosystem WUE was high in areas exhibiting a significant increase in EVI and showed an increasing trend (Figure 6b). The mean ecosystem WUE was low in areas with significant degradation in EVI and exhibited a decreasing trend, demonstrating that the increase in EVI in the study area is an important factor for an increase in ecosystem WUE. The EVI indicators characterizing vegetation coverage were relatively largely increased in the study area, thereby maintaining the overall increase in ecosystem WUE throughout the total study area (Figure 3a).
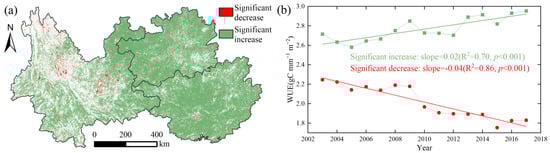
Figure 6.
(a) Regional distribution of significant interannual variations in EVI from 2003 to 2017. (b) Interannual variation in ecosystem WUE in regions exhibiting significant changes.
4. Discussion
4.1. Spatial Distribution Patterns of Ecosystem WUE in Southwest China
Under the influence of latitudinal zonation, the climate of the study area transitions from subtropical to tropical monsoon systems from higher to lower latitudes, while the type of vegetation gradually transitions from subtropical evergreen broad-leaved forests to tropical rainforests. This resulted in similarities in the spatial distribution of multi-year mean values of GPP, ET, and ecosystem WUE with significant increases with decreasing latitude and altitude (Figure 2, left and right panels). This finding is consistent with the result of a previous study [34]. Similarly, from high to low latitudes, vegetation growth became better with increasing temperature and precipitation, which increases the GPP [35] and ET [36] of ecosystems. However, the rate of change of GPP dominates the rate of change of ecosystem WUE (Figure 3a), so this is why the interannual trend of ecosystem WUE in the study area is very similar to GPP in spatial distribution (Figure 3b,d).
GPP, ET, and ecosystem WUE vary in longitude, but clearly decrease near a latitude of 104°. Spatially, from Figure 1c, this low-value area also has a high concentration of karst landforms. Previous studies [37,38,39,40] have reported that karst landforms are susceptible to drought and shallow soils with sparse vegetation due to precipitation infiltration and low carbon sequestration capacity as compared to non-karst landforms [41]; thus, the ecosystem WUE is also low and fluctuates in a “W” shape with longitude.
4.2. Differences in Ecosystem WUE between Karst and Non-Karst Landforms
We explored the differences in ecosystem WUE between non-karst and karst landforms. As shown by the results presented in Table 1, the mean values of ecosystem WUE were higher in non-karst than karst landforms, consistent with previous studies [16,42]. However, some studies had shown that leaf and ecosystem WUE showed almost opposite results [43]. The WUE of individual plants is reportedly higher in karst than non-karst landforms [44,45]. In fact, these findings are not contradictory to our findings. With adaptation to the habitats of karst areas, monocots coexist with multiple species and have higher leaf phosphorus content with increased upper and lower epidermal thickness, and higher leaf photosynthetic capacity, resulting in higher WUE in non-karst areas [44,45]. Nonetheless, this study focused on the larger regional scale of the ecosystem. Karst areas have severe rock desertification and low forest coverage, while non-karst areas have high forest coverage, so the WUE is greater in non-karst than karst areas.

Table 1.
Mean values and variation rates of GPP, ET, and ecosystem WUE in karst and non-karst landforms.
The variation rate of ecosystem WUE was much greater in karst than non-karst landforms, which is consistent with the expected results. Ecological restoration projects have restored vegetation in both karst and non-karst areas, but more ecological projects have been invested in karst landforms to address ecological problems, such as stone desertification [9]. In addition, vegetation restoration has been more effective in karst than non-karst areas [46], as demonstrated by the comparatively increased rate of GPP. Meanwhile, the rate of GPP variation is relatively slower for indigenous vegetation in non-karst landforms. Along with the return of farmland to forests and grasslands and agricultural intensification in karst, vegetation recovery has continued to improve [47] with an increased GPP variation rate. Therefore, with little change in ET, the variation rate of GPP dominated the trend of ecosystem WUE, which significantly increased the ecosystem WUE in karst landforms greater than in non-karst landforms.
4.3. Effects of Meteorological Factors and EVI on Changes to Ecosystem WUE
This study focused on the effects of temperature, precipitation, and EVI on ecosystem WUE. Temperature, precipitation, and EVI were generally positively correlated with ecosystem WUE and the largest proportion of the area of the pixel exhibited a positive correlation between EVI and ecosystem WUE. EVI was significantly increased in 65.83% of the total study area, demonstrating a significant increasing trend in ecosystem WUE. EVI was the dominate factor influencing ecosystem WUE variations throughout most of the study area (Figure 5). These findings suggest, at least to some extent, that vegetation restoration was associated with increased ecosystem WUE. The government of China has conducted large-scale afforestation activities since 2000 to combat stone desertification in the study area, which has accelerated recovery of regional vegetation [13] and continues to improve [48]. EVI as a biophysical parameter of the leaf canopy increases rapidly with biomass on a long-term scale and is highly correlated with GPP. Hence, both EVI and GPP are important indicators of the effectiveness of ecological projects, such as vegetation restoration [49]. In this study, the cumulative area of afforestation was positively correlated with EVI from 2003 to 2017 (Figure 7). Thus, the ecological projects implemented in the southwest have resulted in good recovery of vegetation coverage, thereby effectively improving ecosystem WUE. Meanwhile, afforestation has led to major restoration of the karst regions of southwest China and has positively influenced the ecosystem WUE in southwest China [16], consistent with the findings of the present study.
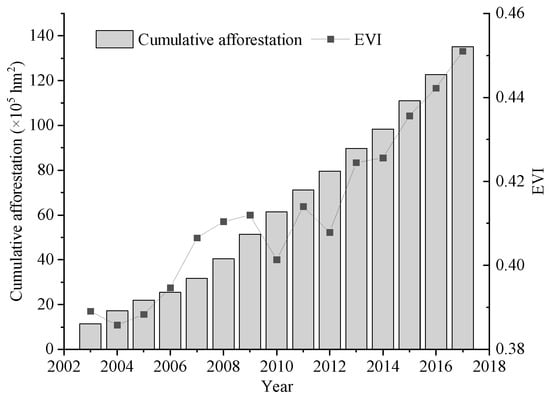
Figure 7.
Relationship between cumulative afforestation areas and EVI in the study area from 2003 to 2017.
In this investigation of the variation to ecosystem WUE with latitude, longitude, and altitude, two meteorological elements, temperature and precipitation, were found to influence the spatial distribution of ecosystem WUE, in agreement with the findings of previous studies [34,50]. Both temperature and precipitation are commonly cited meteorological factors and both were positively correlated with ecosystem WUE throughout most of the study area. Liu et al. [51] also showed that ecosystem WUE was particularly sensitive to temperature. A previous study [17] concluded that ecosystem WUE is negatively correlated with precipitation in southwest China. This inconsistency may be due to differences in study areas and research methods, as the study area in the previous report included eight provincial administrative regions in southwest China and employed simple correlation analysis, while the study area in the present report included three provincial administrative regions in southwest China, which resulted in differences area share statistics for positive and negative correlations. The influence of other variables was eliminated when calculating the correlation coefficient between any two variables by partial correlation analysis, as applied in previous studies with more reliable results [52,53]. Although precipitation is abundant in southwest China, karst landforms have unique geological conditions that impede water storage and are susceptible to drought [54], which seriously affects the availability of water to sustain vegetation growth [55,56]. On the other hand, the relatively excessive precipitation and cloudiness of non-karst landforms can lower temperatures and solar radiation [57,58], which is detrimental to vegetation growth [59]. Thus, precipitation is positively correlated with ecosystem WUE in karst landforms and mostly negatively correlated in non-karst landforms (Figure 4(b2)), resulting in a positive correlation between precipitation and ecosystem WUE in most of the study area.
4.4. Potential Inaccuracies and Limitations
Uncertainty in GPP and ET data is the main source of ambiguity in WUE. Since both GPP and ET are calculated with relatively complex computational models and various input data, potential uncertainties can exist in space and time and ultimately affect the accuracy of WUE. The PML-V2 product used in this study has been validated for GPP and ET in some studies and has concluded that it has similar or higher accuracy than other products [18,60,61]. For example, this product was validated using 95 flux sites worldwide, ET and GPP had high correlation with flux stations, with correlation coefficients of 0.83 and 0.85, respectively [18]. He et al. used 26 flux stations in China to be verified GPP and ET, and their correlation coefficients were both 0.87 [62]. In addition, the PML-V2 product also has a spatial resolution of 500 m, and the higher spatial resolution is more suitable for conducting research in areas with high heterogeneity. For this reason, this study used the highly accurate PML-V2 product to largely reduce the errors caused by WUE. In addition, the temperature and precipitation data were generated by interpolation of thin plate splines applicable to mountainous areas [63], which reduced the uncertainty of our results to some extent.
In the Section 4, our results are compared with previous related studies, and most of them are consistent. Thus, making our results of the present study highly reliable and transferable. However, as those limitations mentioned earlier, there is much room for improvement in future research. For study areas with complex karst landforms with high spatial heterogeneity in the subsurface, as in this study, perhaps the use of higher resolution data would improve the reliability of the study results of the region. Temperature and precipitation are the most commonly used, easily accessible, and representative meteorological variables. Vegetation EVI, as a biophysical parameter of the leaf canopy, is an important indicator of the effectiveness of ecological projects. Thus, we adopted it as the driving factor of WUE change in this paper. However, CO2 concentration [4], vapor pressure deficit [64], leaf area index, soil water, and other meteorological variables (e.g., relative humidity, sunshine hours) [65] all play an important role in the influence of WUE, besides temperature, precipitation, and vegetation EVI. Hence, future studies employing multifactorial analysis of the effects of ecosystem WUE are warranted to ensure that these conclusions are comprehensive, specific, and highly reliable.
5. Conclusions
In this study, the main objective was to understand the spatio-temporal trends of ecosystem WUE and responses to influencing factors in southwest China. The results showed that latitude and altitude exploited the same mechanism of action on the spatial variation of ecosystem WUE and that ecosystem WUE increased with decreasing latitude and altitude. Ecosystem WUE, which is spatially influenced by the distribution of karst landforms, fluctuates in a “W” shape with increasing longitude. Ecosystem WUE was relatively increased in non-karst than karst landforms, and ecological restoration projects led to rapid increases in ecosystem WUE in karst landforms. Vegetation restoration indicators characterized by EVI have confirmed that ecological engineering projects in southwest China have been effective and EVI was the dominate factor influencing change to ecosystem WUE throughout most of the region. These findings of this study will contribute to better understanding of the impacts of carbon and water cycling processes in karst landforms.
Author Contributions
Conceptualization, S.Y. (Shengtian Yang) and X.Z.; methodology, J.Z. and S.Y. (Shiqi Yang); software, J.Z. and L.F.; validation, X.Z.; writing—original draft preparation, J.Z.; writing—review and editing, J.Z. and X.Z.; funding acquisition, S.Y. (Shengtian Yang) and S.Y. (Shiqi Yang). All authors have read and agreed to the published version of the manuscript.
Funding
This research was funded by the Joint Fund of the National Natural Science Foundation of China and Karst Science Research Center of Guizhou Province (U1812401), and the National Natural Science Foundation of China (42175193), and the National Key Research and Development Program of China (2021YFB3901400).
Data Availability Statement
Publicly available datasets were analyzed in this study. The data source and access links are indicated in the text.
Acknowledgments
We are very grateful to the scientists who have made the MODIS, PML-V2 products, and meteorological data available. We thank the reviewers and the editor for their constructive comments and suggestions, which have significantly improved this paper.
Conflicts of Interest
The authors declare no conflict of interest.
References
- Yu, G.; Song, X.; Wang, Q.; Liu, Y.; Guan, D.; Yan, J.; Sun, X.; Zhang, L.; Wen, X. Water-use efficiency of forest ecosystems in eastern China and its relations to climatic variables. New. Phytol. 2008, 177, 927–937. [Google Scholar] [CrossRef] [PubMed]
- Tang, X.; Li, H.; Desai, A.R.; Nagy, Z.; Luo, J.; Kolb, T.E.; Olioso, A.; Xu, X.; Yao, L.; Kutsch, W. How is water-use efficiency of terrestrial ecosystems distributed and changing on Earth? Sci. Rep. 2014, 4, 7483. [Google Scholar] [CrossRef]
- Wang, L.; Li, M.; Wang, J.; Li, X.; Wang, L. An analytical reductionist framework to separate the effects of climate change and human activities on variation in water use efficiency. Sci. Total Environ. 2020, 727, 138306. [Google Scholar] [CrossRef]
- Zhu, Q.; Jiang, H.; Peng, C.; Liu, J.; Wei, X.; Fang, X.; Liu, S.; Zhou, G.; Yu, S. Evaluating the effects of future climate change and elevated CO₂ on the water use efficiency in terrestrial ecosystems of China. Ecol. Model. 2011, 222, 2414–2429. [Google Scholar] [CrossRef]
- Xue, Y.; Liang, H.; Zhang, B.; He, C. Vegetation restoration dominated the variation of water use efficiency in China. J. Hydrol. 2022, 612, 128257. [Google Scholar] [CrossRef]
- Ji, Z.; Pei, T.; Chen, Y.; Wu, H.; Hou, Q.; Shi, F.; Xie, B.; Zhang, J. The driving factors of grassland water use efficiency along degradation gradients on the Qinghai-Tibet Plateau, China. Glob. Ecol. Conserv. 2022, 35, e2090. [Google Scholar] [CrossRef]
- Tian, F.; Yang, J.; Du, R.; Lin, J.; Chen, M.; Wu, J. Sustained vegetation greening enhanced ecosystem water-use efficiency in the Loess Plateau of China in recent 20 years. Ecol. Eng. 2022, 184, 106768. [Google Scholar] [CrossRef]
- Yang, L.; Feng, Q.; Wen, X.; Barzegar, R.; Adamowski, J.F.; Zhu, M.; Yin, Z. Contributions of climate, elevated atmospheric CO2 concentration and land surface changes to variation in water use efficiency in Northwest China. Catena 2022, 213, 106220. [Google Scholar] [CrossRef]
- Wang, K.; Zhang, C.; Chen, H.; Yue, Y.; Zhang, W.; Zhang, M.; Qi, X.; Fu, Z. Karst landscapes of China: Patterns, ecosystem processes and services. Landscape Ecol. 2019, 34, 2743–2763. [Google Scholar] [CrossRef]
- Gao, J.; Liu, X.; Wang, C.; Wang, Y.; Fu, Z.; Hou, P.; Lyu, N. Evaluating changes in ecological land and effect of protecting important ecological spaces in China. J. Geogr. Sci. 2021, 31, 1245–1260. [Google Scholar] [CrossRef]
- Tong, X.; Wang, K.; Yue, Y.; Brandt, M.; Liu, B.; Zhang, C.; Liao, C.; Fensholt, R. Quantifying the effectiveness of ecological restoration projects on long-term vegetation dynamics in the karst regions of Southwest China. Int. J. Appl. Earth Obs. 2017, 54, 105–113. [Google Scholar] [CrossRef]
- Kong, X.; Fu, M.; Zhao, X.; Wang, J.; Jiang, P. Ecological effects of land-use change on two sides of the Hu Huanyong Line in China. Land Use Policy 2022, 113, 105895. [Google Scholar] [CrossRef]
- Chen, C.; Park, T.; Wang, X.; Piao, S.; Xu, B.; Chaturvedi, R.K.; Fuchs, R.; Brovkin, V.; Ciais, P.; Fensholt, R. China and India lead in greening of the world through land-use management. Nat. Sustain. 2019, 2, 122–129. [Google Scholar] [CrossRef]
- Tong, X.; Brandt, M.; Yue, Y.; Horion, S.; Wang, K.; Keersmaecker, W.D.; Tian, F.; Schurgers, G.; Xiao, X.; Luo, Y. Increased vegetation growth and carbon stock in China karst via ecological engineering. Nat. Sustain. 2018, 1, 44–50. [Google Scholar] [CrossRef]
- Sun, X.; Wang, G.; Huang, M.; Chang, R.; Hu, Z.; Song, C.; Sun, J. The asynchronous response of carbon gain and water loss generate spatio-temporal pattern of WUE along elevation gradient in southwest China. J. Hydrol. 2020, 581, 124389. [Google Scholar] [CrossRef]
- Ding, Z.; Liu, Y.; Wang, L.; Chen, Y.; Yu, P.; Ma, M.; Tang, X. Effects and implications of ecological restoration projects on ecosystem water use efficiency in the karst region of Southwest China. Ecol. Eng. 2021, 170, 106356. [Google Scholar] [CrossRef]
- Shi, X.; Bai, S.; Chen, W. Remote sensing of water use efficiency in Southwest China’s karst area. Environ. Sci. Pollut. R. 2022, 29, 71166–71178. [Google Scholar] [CrossRef]
- Zhang, Y.; Kong, D.; Gan, R.; Chiew, F.H.S.; McVicar, T.R.; Zhang, Q.; Yang, Y. Coupled estimation of 500 m and 8-day resolution global evapotranspiration and gross primary production in 2002–2017. Remote Sens. Environ. 2019, 222, 165–182. [Google Scholar] [CrossRef]
- Zhou, J.; Jia, L.; Menenti, M. Reconstruction of global MODIS NDVI time series: Performance of Harmonic ANalysis of Time Series (HANTS). Remote Sens. Environ. 2015, 163, 217–228. [Google Scholar] [CrossRef]
- Hutchinson, M.F.; Xu, T. Anusplin Version 4.2 User Guide; Centre for Resource and Environmental Studies, The Australian National University: Canberra, Australia, 2004; p. 54. [Google Scholar]
- Kendall, M.G. Rank Correlation Methods; Griffin: London, UK, 1955. [Google Scholar]
- Yang, S.; Zhang, J.; Han, J.; Wang, J.; Zhang, S.; Bai, Y.; Cao, D.; Xun, L.; Zheng, M.; Chen, H.; et al. Evaluating global ecosystem water use efficiency response to drought based on multi-model analysis. Sci. Total Environ. 2021, 778, 146356. [Google Scholar] [CrossRef]
- Huang, L.; He, B.; Han, L.; Liu, J.; Wang, H.; Chen, Z. A global examination of the response of ecosystem water-use efficiency to drought based on MODIS data. Sci. Total Environ. 2017, 601, 1097–1107. [Google Scholar] [CrossRef] [PubMed]
- Chen, T.; Bao, A.; Jiapaer, G.; Guo, H.; Zheng, G.; Jiang, L.; Chang, C.; Tuerhanjiang, L. Disentangling the relative impacts of climate change and human activities on arid and semiarid grasslands in Central Asia during 1982–2015. Sci. Total Environ. 2019, 653, 1311–1325. [Google Scholar] [CrossRef] [PubMed]
- Tian, F.; Zhang, Y.; Lu, S. Spatial-temporal dynamics of cropland ecosystem water-use efficiency and the responses to agricultural water management in the Shiyang River Basin, northwestern China. Agr. Water Manag. 2020, 237, 106176. [Google Scholar] [CrossRef]
- Chen, J.; Shao, Z.; Huang, X.; Zhuang, Q.; Dang, C.; Cai, B.; Zheng, X.; Ding, Q. Assessing the impact of drought-land cover change on global vegetation greenness and productivity. Sci. Total Environ. 2022, 852, 158499. [Google Scholar] [CrossRef] [PubMed]
- Sun, S.; Song, Z.; Wu, X.; Wang, T.; Wu, Y.; Du, W.; Che, T.; Huang, C.; Zhang, X.; Ping, B.; et al. Spatio-temporal variations in water use efficiency and its drivers in China over the last three decades. Ecol. Indic. 2018, 94, 292–304. [Google Scholar] [CrossRef]
- Breiman, L. Random forests. Mach. Learn. 2001, 45, 5–32. [Google Scholar] [CrossRef]
- Peng, D.; Zhou, Q.; Tang, X.; Yan, W.; Chen, M. Changes in soil moisture caused solely by vegetation restoration in the karst region of southwest China. J. Hydrol. 2022, 613, 128460. [Google Scholar] [CrossRef]
- Liu, Q.; Liu, L.; Zhang, Y.; Wang, Z.; Wu, J.; Li, L.; Li, S.; Paudel, B. Identification of impact factors for differentiated patterns of NDVI change in the headwater source region of Brahmaputra and Indus, Southwestern Tibetan Plateau. Ecol. Indic. 2021, 125, 107604. [Google Scholar] [CrossRef]
- Qiao, Y.; Chen, H.; Jiang, Y. Quantifying the impacts of lithology on vegetation restoration using a random forest model in a karst trough valley, China. Ecol. Eng. 2020, 156, 105973. [Google Scholar] [CrossRef]
- Song, Q.; Fei, X.; Zhang, Y.; Sha, L.; Liu, Y.; Zhou, W.; Wu, C.; Lu, Z.; Luo, K.; Gao, J.; et al. Water use efficiency in a primary subtropical evergreen forest in Southwest China. Sci. Rep. 2017, 7, 43031. [Google Scholar] [CrossRef]
- Zhao, M.; Running, S.W. Drought-induced reduction in global terrestrial net primary production from 2000 through 2009. Science 2010, 329, 940–943. [Google Scholar] [CrossRef]
- Zhu, X.; Yu, G.; Wang, Q.; Hu, Z.; Zheng, H.; Li, S.; Sun, X.; Zhang, Y.; Yan, J.; Wang, H.; et al. Spatial variability of water use efficiency in China’s terrestrial ecosystems. Global Planet. Change 2015, 129, 37–44. [Google Scholar] [CrossRef]
- Tang, X.; Xiao, J.; Ma, M.; Yang, H.; Li, X.; Ding, Z.; Yu, P.; Zhang, Y.; Wu, C.; Huang, J.; et al. Satellite evidence for China’s leading role in restoring vegetation productivity over global karst ecosystems. Forest Ecol. Manag. 2022, 507, 120000. [Google Scholar] [CrossRef]
- Liu, Y.; Lian, J.; Luo, Z.; Chen, H. Spatiotemporal variations in evapotranspiration and transpiration fraction following changes in climate and vegetation in a karst basin of southwest China. J. Hydrol. 2022, 612, 128216. [Google Scholar] [CrossRef]
- Zhang, Z.; Chen, X.; Ghadouani, A.; Shi, P. Modelling hydrological processes influenced by soil, rock and vegetation in a small karst basin of southwest China. Hydrol. Process 2011, 25, 2456–2470. [Google Scholar] [CrossRef]
- Zhong, F.; Xu, X.; Li, Z.; Zeng, X.; Yi, R.; Luo, W.; Zhang, Y.; Xu, C. Relationships between lithology, topography, soil, and vegetation, and their implications for karst vegetation restoration. Catena 2022, 209, 105831. [Google Scholar] [CrossRef]
- Li, X.; Li, Y.; Chen, A.; Gao, M.; Slette, I.J.; Piao, S. The impact of the 2009/2010 drought on vegetation growth and terrestrial carbon balance in Southwest China. Agr. Forest Meteorol. 2019, 269–270, 239–248. [Google Scholar] [CrossRef]
- Zhou, Q.; Zhu, A.; Yan, W.; Sun, Z. Impacts of forestland vegetation restoration on soil moisture content in humid karst region: A case study on a limestone slope. Ecol. Eng. 2022, 180, 106648. [Google Scholar] [CrossRef]
- Wang, B.; Yang, S.; Lü, C.; Zhang, J.; Wang, Y. Comparison of net primary productivity in karst and non-karst areas; a case study in Guizhou Province, China. Environ. Earth Sci. 2010, 59, 1337–1347. [Google Scholar] [CrossRef]
- Wang, M.; Ding, Z.; Wu, C.; Song, L.; Ma, M.; Yu, P.; Lu, B.; Tang, X. Divergent responses of ecosystem water-use efficiency to extreme seasonal droughts in Southwest China. Sci. Total Environ. 2021, 760, 143427. [Google Scholar]
- Li, H.; Wei, M.; Dong, L.; Hu, W.; Xiong, J.; Sun, Y.; Sun, Y.; Yao, S.; Gong, H.; Zhang, Y.; et al. Leaf and ecosystem water use efficiencies differ in their global-scale patterns and drivers. Agr. Forest Meteorol. 2022, 319, 108919. [Google Scholar] [CrossRef]
- Fu, P.; Zhu, S.; Zhang, J.; Finnegan, P.M.; Jiang, Y.; Lin, H.; Fan, Z.; Cao, K. The contrasting leaf functional traits between a karst forest and a nearby non-karst forest in south-west China. Funct. Plant. Biol. 2019, 46, 907–915. [Google Scholar] [CrossRef]
- Huang, F.Z.; Li, D.X.; Wang, B.; Xiang, W.S.; Guo, Y.L.; Wen, S.J.; Chen, T.; Li, X.K. Foliar stable carbon isotope composition and water use efficiency of plant in the Karst seasonal rain forest. Chin. J. Appl. Ecol. 2019, 30, 1833–1839. [Google Scholar]
- Zhang, X.; Yue, Y.; Tong, X.; Wang, K.; Qi, X.; Deng, C.; Brandt, M. Eco-engineering controls vegetation trends in southwest China karst. Sci. Total Environ. 2021, 770, 145160. [Google Scholar] [CrossRef]
- Tian, Y.; Bai, X.; Wang, S.; Qin, L.; Li, Y. Spatial-temporal Changes of Vegetation Cover in Guizhou Province, Southern China. Chin. Geogr. Sci. 2017, 27, 25–38. [Google Scholar] [CrossRef]
- Liao, C.; Yue, Y.; Wang, K.; Fensholt, R.; Tong, X.; Brandt, M. Ecological restoration enhances ecosystem health in the karst regions of southwest China. Ecol. Indic. 2018, 90, 416–425. [Google Scholar] [CrossRef]
- Liu, X.; Jiang, W.; Li, J.; Wang, W. Evaluation of the Vegetation Coverage Resilience in Areas Damaged by the Wenchuan Earthquake Based on MODIS-EVI Data. Sensors 2017, 17, 259. [Google Scholar] [CrossRef]
- Xiao, J.; Sun, G.; Chen, J.; Chen, H.; Chen, S.; Dong, G.; Gao, S.; Guo, H.; Guo, J.; Han, S. Carbon fluxes, evapotranspiration, and water use efficiency of terrestrial ecosystems in China. Agric. Forest Meteorol. 2013, 182, 76–90. [Google Scholar] [CrossRef]
- Liu, Z.; Ji, X.; Ye, L.; Jiang, J. Inherent Water-Use Efficiency of Different Forest Ecosystems and Its Relations to Climatic Variables. Forests 2022, 13, 775. [Google Scholar] [CrossRef]
- Wu, Y.; Gu, L.; Li, S.; Guo, C.; Yang, X.; Xu, Y.; Yue, F.; Peng, H.; Chen, Y.; Yang, J. Responses of NDVI to Climate Change and LUCC along Large-Scale Transportation Projects in Fragile Karst Areas, SW China. Land 2022, 11, 1771. [Google Scholar] [CrossRef]
- Yan, J.; Zhang, G.; Ling, H.; Han, F. Comparison of time-integrated NDVI and annual maximum NDVI for assessing grassland dynamics. Ecol. Indic. 2022, 136, 108611. [Google Scholar] [CrossRef]
- Wan, L.; Zhou, J.; Guo, H.; Cui, M.; Liu, Y. Trend of water resource amount, drought frequency, and agricultural exposure to water stresses in the karst regions of South China. Nat. Hazards 2016, 80, 23–42. [Google Scholar] [CrossRef]
- Xu, T.; Wu, X.; Tian, Y.; Li, Y.; Zhang, W.; Zhang, C. Soil Property Plays a Vital Role in Vegetation Drought Recovery in Karst Region of Southwest China. J. Geophys. Res. Biogeosci. 2021, 126, e2021JG006544. [Google Scholar] [CrossRef]
- Luo, H.; Zhou, T.; Liu, X.; Shi, P.; Mao, R.; Zhao, X.; Xu, P.; Yu, P.; Liu, J. Dual Roles of Water Availability in Forest Vigor: A Multiperspective Analysis in China. Remote Sens. 2021, 13, 91. [Google Scholar] [CrossRef]
- Aigang, L. Precipitation effects on temperature—A case study in China. J. Earth Sci. 2011, 22, 792–798. [Google Scholar] [CrossRef]
- Li, Z.; He, Y.; An, W.; Song, L.; Zhang, W.; Catto, N.; Wang, Y.; Wang, S.; Liu, H.; Cao, W. Climate and glacier change in southwestern China during the past several decades. Environ. Res. Lett. 2011, 6, 45404. [Google Scholar] [CrossRef]
- Hou, W.; Gao, J.; Wu, S.; Dai, E. Interannual Variations in Growing-Season NDVI and Its Correlation with Climate Variables in the Southwestern Karst Region of China. Remote Sens. 2015, 7, 11105–11124. [Google Scholar] [CrossRef]
- Chang, X.; Wang, Z.; Wei, F.; Xiao, P.; Shen, Z.; Lv, X.; Shi, Y. Determining the Contributions of Vegetation and Climate Change to Ecosystem WUE Variation over the Last Two Decades on the Loess Plateau, China. Forests 2021, 12, 1442. [Google Scholar] [CrossRef]
- Ma, R.; Wang, D.; Cui, X.; Yao, X.; Li, S.; Wang, H.; Liu, B. Distribution and Driving Force of Water Use Efficiency under Vegetation Restoration on the Loess Plateau. Remote Sens. 2022, 14, 4513. [Google Scholar] [CrossRef]
- He, S.; Zhang, Y.; Ma, N.; Tian, J.; Kong, D.; Liu, C. A daily and 500 m coupled evapotranspiration and gross primary production product across China during 2000–2020. Earth Syst. Sci. Data 2022, 14, 5463–5488. [Google Scholar] [CrossRef]
- Qing-ling, S.; Xian-feng, F.; Yong, G.; Bao-lin, L. Topographical effects of climate data and their impacts on the estimation of net primary productivity in complex terrain: A case study in Wuling mountainous area, China. Ecol. Inform. 2015, 27, 44–54. [Google Scholar] [CrossRef]
- Cao, R.; Hu, Z.; Jiang, Z.; Yang, Y.; Zhao, W.; Wu, G.; Feng, X.; Chen, R.; Hao, G. Shifts in ecosystem water use efficiency on china’s loess plateau caused by the interaction of climatic and biotic factors over 1985–2015. Agric. Forest Meteorol. 2020, 291, 108100. [Google Scholar] [CrossRef]
- Hu, Z.; Yu, G.; Fu, Y.; Sun, X.; Li, Y.; Shi, P.; Wang, Y.; Zheng, Z. Effects of vegetation control on ecosystem water use efficiency within and among four grassland ecosystems in China. Glob. Ecol. Conserv. 2008, 14, 1609–1619. [Google Scholar] [CrossRef]


Disclaimer/Publisher’s Note: The statements, opinions and data contained in all publications are solely those of the individual author(s) and contributor(s) and not of MDPI and/or the editor(s). MDPI and/or the editor(s) disclaim responsibility for any injury to people or property resulting from any ideas, methods, instructions or products referred to in the content. |
© 2023 by the authors. Licensee MDPI, Basel, Switzerland. This article is an open access article distributed under the terms and conditions of the Creative Commons Attribution (CC BY) license (https://creativecommons.org/licenses/by/4.0/).