Article

Quantitatively Evaluating the Ecological Product Value of Nine Provinces in the Yellow River Basin from the Perspective of the Dual-Carbon Strategy

1
School of Urban Economics and Public Administration, Capital University of Economics and Business, Beijing 100070, China
2
Beijing Key Laboratory of Megaregions Sustainable Development Modelling, Beijing 100070, China
3
Human Resource Development Center, Ministry of Natural Resources, Beijing 100860, China
4
Business School, Ningbo Tech University, Ningbo 315100, China
*
Author to whom correspondence should be addressed.
Land 2023, 12(2), 516; https://doi.org/10.3390/land12020516
Submission received: 16 October 2022 / Revised: 13 February 2023 / Accepted: 14 February 2023 / Published: 20 February 2023

Abstract

:
At the 75th session of the United Nations General Assembly, China formally proposed the goal of achieving carbon peak by 2030 and carbon neutrality by 2060, which is called the dual-carbon strategy. In this study, we incorporated the dual-carbon strategy perspective into ecological product value (EPV) evaluation. The EPV is the sum of the final product and service value provided by regional ecosystems for human production and life. A significant uncertainty exists in evaluating the EPV. To bridge this gap, we explored the quantitative evaluation index system of EPV based on the dual-carbon perspective and conducted an empirical analysis relating to four subindexes (ecological protection, ecological products carbon neutral capacity transformation, ecological value, and ecological product value realization safeguard mechanism). The EPV in nine provinces of the Yellow River basin in 2020 was measured. The results showed that the total evaluation score of EPV realization in the Yellow River basin was relatively low, and the average scores of ecological product protection level, carbon neutrality capacity, value transformation level, and value realization guarantee mechanism were all at a low level. Overall, the protection level of ecological products and the guarantee mechanism to realize the EPV were relatively good. However, the carbon neutrality capacity and the value transformation level were relatively poor. From the spatial perspective, the value realization level of ecological products was roughly upstream region > downstream region > midstream region in the Yellow River basin. Finally, corresponding countermeasures and suggestions are put forward according to the comprehensive evaluation index of EPV realization and analysis of the four subindexes.

1. Introduction

Global warming is closely related to human activities and also affects the quality of ecological products provided by ecosystems to human beings [1]. The Paris Agreement has received strong support from the international community, which not only proves the urgency of taking action on climate change but also shows that governments all over the world agree that strong international cooperation is needed to address climate change. Governments and all sectors of society should take action to reduce greenhouse gas emissions and enhance their ability to cope with climate change [2]. As a responsible big country, China has implemented a clear “emission peak and carbon neutral” (dual-carbon) strategy and a specific implementation plan [3]. The dual-carbon strategy is one of the cores of China’s ecological civilization construction. The realization of the ecological product value (EPV) is closely related to the construction of ecological civilization, which is also a direct reflection of the concept that “green water and green mountains are golden mountains and silver mountains” [4,5]. As the material carrier and practical grasp of the “clear waters and green mountains are as good as mountains of gold and silver” theory and ecological civilization construction, ecological products are the Chinese expression of ecosystem services [6]. To realize the EPV, it is necessary to deeply study the concept and connotation of ecological products, the main classification of ecological products, and the principle and path of realizing the EPV.
In order to better understand the research status of EPV, this paper summarizes four aspects. The first aspect is the connotation of ecological products. A search of existing research at home and abroad showed that there is no concept of ecological products abroad and that the related concepts are ecosystem services or environmental services [7,8,9,10,11]. Daily believes that ecosystem services refer to “the environmental conditions and utility formed by the ecosystem that can sustain human survival” [12]. The Millennium Ecosystem Assessment (MEA) considers ecosystem services as “all the benefits that humans derive from ecosystems” [13]. Ecosystem services include not only the direct and indirect services provided by the ecosystem for human beings [14] but also the structure and functions of the ecosystem itself as well as some ecological resource stocks, excluding clean water and fresh air [15,16,17]. The concept of ecological products was first put forward in the National Main Function Zoning released in 2010, which listed ecological products, agricultural products, industrial products, and service products as necessary and consumable products for human life [18]. In recent years, the concept of ecological products has been widely studied by scholars with the deepening of ecological civilization construction. Some scholars define ecological products as “the final products or services provided by ecosystems for human well-being through biological production and joint action with human production, which are the necessities of life that are parallel to agricultural products and industrial products and meet the needs of human beings for a better life” [19,20]. Although different scholars have different views on ecological products, the essence of ecological products is the general term of materials and services that human beings can obtain from nature to maintain their survival and meet their own needs.
The second aspect is the main classification of ecological products. The classification of ecological products is the basis for studying their value sources [21,22] and realization paths [23,24,25]. Their main classifications are also different depending on the different attributes of ecological products. Specifically, ecological products are divided into natural elements, natural attributes, ecological derivatives, and ecological labels based on supplied attributes [26,27,28]; into public ecological products, quasi-public ecological products, club ecological products, and private ecological products [29,30,31] based on consumption attributes; and into material supplied products [32], ecological regulation service products, and cultural service products [33,34,35] based on ecological attributes.
The third aspect is the principle of realizing the EPV. Some scholars have summarized that there are two different perspectives on the principle of realizing the EPV in China at present. One perspective is that the realization of the EPV is the process of “internalization” of its “externality” characteristics [36,37,38]. The other perspective is that ecological products are taken into consideration in the socioeconomic system and that the realization of the EPV is the process of realizing value creation and appreciation in the process of ecological products from production to circulation, consumption, and completion of transactions.
The fourth aspect relates to the path to realizing the EPV. The way to realize the EPV is determined by many factors [39]. At present, relevant scholars have proposed that the realization path of the EPV depends on the types of ecological products, the consumption and trading methods of ecological products, and the different stages of the whole process of realizing the EPV [40]. The above research provides important theoretical support for the construction of the EPV evaluation system in the Yellow River basin and is of great significance for realizing the EPV.
However, due to the various types of ecological products, huge differences in their attribute characteristics, and the various forms of expression of their contribution to human society, in-depth research on the indicator system of ecological products, the path mechanism for realizing the EPV, and policy guarantee is limited. Due to the lack of a mature indicator system to evaluate the value of ecological products, this study attempted to establish an indicator system based on the dual-carbon perspective to solve the quantitative problem of ecological product value evaluation.
The Yellow River basin is an important ecological barrier in China and a national critical ecological functional area. It is also an important source of energy, resources for the chemical industry, and raw materials and is an essential industrial base in China. It plays a very important role in China’s ecological civilization construction and economic development. However, extensive development has always been the main form of economic development in the Yellow River basin. All provinces in the basin have problems (e.g., excessive resource consumption, difficulties in industrial structure transformation, and serious ecological environment pollution) that are contrary to green and low-carbon development in the context of the dual-carbon strategy and also seriously hinder the value transformation and realization of ecological products. In the period 2001 to 2015, the total ecosystem service value and the ecosystem service value per unit area in the Yellow River basin generally showed a U-shaped pattern (decreasing slightly then increasing rapidly) [41]. The embodied carbon emission transfer between the provinces in the middle and lower reaches of the Yellow River basin is much higher than that between the upstream provinces [42]. However, the EPV of the Yellow River basin has not been systematically studied. The realization of the EPV and double-carbon goals is an endogenous requirement for high-quality economic development and the only way to comprehensively promote the construction of ecological civilization. In this sense, exploring and building an EPV evaluation system is of great theoretical and practical significance for realizing the EPV, the long-term goal of carbon peaking and carbon neutralization as scheduled, and the dynamic balance of ecological construction and economic development with the EPV as the core.
How do we build an appropriate indicator system to evaluate EPV? How do we apply this indicator system in the Yellow River basin? According to the evaluation results, how can we optimize the supply of ecological products in the Yellow River basin? The above problems need to be solved. Therefore, based on the four subindicators of ecological product protection, carbon neutralization capacity of ecological products, value transformation of ecological products, and the guarantee mechanism for realizing the EPV, we constructed an EPV evaluation index system and used the TOPSIS (Technique for Order Preference by Similarity to an Ideal Solution) model of entropy weight to measure and evaluate the EPV of nine provinces in the Yellow River basin in 2020. This study is expected to support data-oriented decision-making for the research on EPV in the nine provinces of the Yellow River basin.

2. Methodology

2.1. Methodological Flow

This paper proposes a solution to build an EPV evaluation index system based on the perspective of dual-carbon strategy and outlines the results of empirical research conducted through the entropy weight TOPSIS method. Firstly, we preprocessed the Yellow River basin’s research data from the National Bureau of Statistics of the People’s Republic of China (NBSPRC) and Ministry of Natural Resources of the People’s Republic of China (MNRPRC). Secondly, we integrated the most critical dimension of carbon neutrality into the indicator system. In this way, we built an indicator system with four dimensions (ecological product protection level, carbon neutralization capacity, transformation level, and security mechanism). Thirdly, we calculated the weight of each index by the entropy method and obtained fitness between the evaluation value of EPV and the optimal scheme by the TOPSIS method. Finally, we calculated the total score and subscore of the EPV. The comprehensive evaluation score was used to judge and measure the ranking of EPV in nine provinces of the Yellow River basin (Figure 1).

2.2. Research Area and Data Sources

The Yellow River flows through Qinghai, Sichuan, Gansu, Ningxia, Inner Mongolia, Shaanxi, Shanxi, Henan, and Shandong provinces, cities, and autonomous regions from west to east and finally flows into the Bohai Sea, as shown in Figure 2.
In 2019, the ecological protection and high-quality development of the Yellow River basin became a major national strategy, together with the coordinated development of Beijing–Tianjin–Hebei, development of the Yangtze River Economic Belt, construction of the Guangdong–Hong Kong–Macao Greater Bay Area, and the integrated development of the Yangtze River Delta. The protection of the Yellow River is a grand long-term plan concerning the great rejuvenation of the Chinese nation. Therefore, it is of great significance to study the value of ecological products in the Yellow River basin. This study took nine provinces, cities, and autonomous regions where the Yellow River flows as the research area and selected relevant data from 2020 as the time node to measure and evaluate their EPV. The data used in this study are mainly from the China Statistical Yearbook in 2021, China Energy Statistical Yearbook in 2021, Statistical Yearbook of the provinces in the Yellow River basin in 2021, ecological environment status bulletins of the provinces in 2020, financial bulletins, and official websites of provincial-level government departments. The data source information is shown in Table 1.

2.3. Index System

2.3.1. Ecological Product Protection Subindex

To better realize the EPV in the nine provinces of the Yellow River basin, it is necessary to strengthen the protection of ecological products. Air quality, water environment, and waste disposal are all important indicators that affect the quality of ecological products and have important reference value for measuring the level of ecological product protection. Therefore, this subindex was composed of five indicators (Table 2).

2.3.2. Carbon Neutralization Capacity Subindex of Ecological Products

The realization of the EPV is closely related to carbon neutralization. Carbon neutralization refers to the offset of the total amount of carbon dioxide or greenhouse gas emissions directly or indirectly generated in a certain time period by afforestation, energy conservation, and emission reduction to achieve relative “zero emissions” [43,44]. In a sense, carbon neutralization capability is the capability to reduce carbon dioxide emissions. There are two ways to reduce carbon dioxide emissions. One is carbon sequestration, that is, carbon dioxide in the air is mainly absorbed and stored by natural carbon sinks (e.g., soil and forests), such as afforestation. The other is carbon offset, that is, reducing the carbon dioxide emissions of one industry to offset the emissions of another industry by developing renewable energy and low-carbon clean technology. The forest area, grassland area, cultivated land area, and energy consumption per unit of GDP of each province are important reference indicators for measuring the carbon neutralization capacity of ecological products, so the subindex was set with four subindicators (Table 3).

2.3.3. EPV Transformation Subindex

Different connotations and characteristics of ecological products lead to significant differences in the ecological products themselves, so classification of ecological products according to their manifestations can reflect different transformation modes of ecological products.
  • Material ecological products refer to various products processed by human beings, including green agricultural products, such as agriculture, forestry, animal husbandry, and fishery, as well as green energy products that can represent the double-carbon strategy;
  • Service-oriented ecological products refer to the service products provided by the ecosystem that can meet the daily ecological experience of human beings, among which ecotourism products are typical representatives.
  • Equity-based ecological products refer to those whose property rights improve the ecological environment and internalize the externalities of resources through the market trading mechanism, such as carbon emission trading rights, water rights, pollution discharge rights, energy use rights, and green power certificates.
  • Ecological-compensation-type ecological products refer to cross-regional ecological compensation products constructed with the overall function of the ecosystem as the core. Cross-regional ecological products include forests, wetlands, grasslands, rivers, deserts, and cultivated land. For example, a river flows through the economically developed area and the less developed area, so the economically developed area should give economic compensation for the corresponding cost of river ecological management to the economically underdeveloped area.
  • Based on the above classification of ecological products, five subindicators were set for this subindex (Table 4).

2.3.4. Subindex of the EPV Realization Guarantee Mechanism

Reasonable use of security mechanisms and related policies is essential in realizing EPV. Therefore, measuring the construction effect of the EPV realization guarantee mechanism is particularly important to assess. As the contents, forms, and methods of various security mechanisms are different, a unified scoring system was adopted to evaluate them. Five subindicators were set for this subindex (Table 5).

2.4. Evaluation Method of the EPV

2.4.1. Entropy Weight TOPSIS

At present, the method to determine the indicator weights in the multi-indicator comprehensive evaluation is mainly divided into subjective methods (i.e., expert evaluation method and analytic hierarchy process) and objective methods (i.e., entropy weight method, variation coefficient method, etc.) [45,46]. Compared to other methods, using the entropy weight method to determine the weight can prevent significant deviations of the evaluation outcomes due to the subjective will. The TOPSIS calculates the distance between each evaluation object and the optimal and the worst scheme and obtains the relative proximity of each evaluation object to the optimal solution, which is used as the evaluation basis to reflect the gap between the evaluation objects [47]. Drawing on the experience of other scholars, a combination of the entropy weight method and the TOPSIS comprehensive evaluation method is adopted for multi-index comprehensive evaluations in many fields. Therefore, in this study, we constructed an EPV evaluation system according to four sub-indicators (Table 6) and used the entropy weight TOPSIS model for EPV evaluation in the Yellow River basin from the perspective of carbon peaking and carbon neutrality strategy.
(1)
Evaluate the indicator type
The evaluation indicator is a forward indicator, that is, the larger the value, the better it is. In terms of a negative indicator, the smaller the value, the better it is.
(2)
Positive processing of indicators
There are differences in the indicator units, so it is necessary to unify the indicator data before calculation, that is, to transform the negative indicator into a forward indicator. The specific formula is as follows:
X i j = ( x m a x j x i j )
where i represents the province; j represents indicator;   X i j represents the value of the desired forward index; x i j represents the original value of the indicator; and x m a x j represents the initial value of the maximum indicator.
(3)
Build a standardized matrix
Z i j = X i j / i = 1 n X i j 2
where i represents the province; j represents indicator;   Z i j is each element in the normalized matrix; and X i j represents the value of the desired forward index.
(4)
Calculate the probability matrix P i j :
P i j = Z i j / i = 1 m Z i j
where i represents the province; j represents indicator; and   Z i j is each element in the normalized matrix.
(5)
Calculate the entropy value for each indicator e j :
e j = 1 ln m i = 1 m P i j ln P i j
(6)
Calculate the information utility value   d j :
d j = 1 e j
(7)
Calculate the entropy weight of the j indicator   W j :
W j = d j / j = 1 m d j ( j = 1 , 2 , , m )
where m represents the number of provinces.
(8)
Conduct an evaluation of the EPV realization level.
Construct a weighted normalized decision matrix:
V = ( V i j ) m × n ,   V i j = W j X i j
Determine the positive ideal solution   V + and negative ideal solution V :
V + = ( max V i j | i = 1 , 2 , , m ) V = ( min V i j | i = 1 , 2 , , m )
Calculate the actual distance to the positive ideal solution L + and the distance to the negative ideal solution   L :
L + = j = 1 n ( V j + V i j ) 2 L = j = 1 n ( V j V i j ) 2
Calculate the fit between the evaluation object and the optimal solution   C i .
C i = L i L i + + L i
The value range of C i is between 0 and 1. A higher value of C i in this province means the level of realizing the value of ecological products is higher.

2.4.2. Advantages and Disadvantages of the Method

The advantages of the TOPSIS method are as follows: there is no special requirement for sample data; the original data information is fully used and more consistent with the actual situation; and the advantages and disadvantages of each evaluation object can be ranked. The disadvantages of the TOPSIS method are as follows: when the index values of two evaluation objects are symmetrical for the connection between the best and worst schemes, accurate results cannot be obtained; only the advantages and disadvantages of each evaluation object can be sorted instead of hierarchical management; and the sensitivity is low [48].
The classical TOPSIS algorithm has the same weight value for each indicator by default, which means that its essence is to determine the contribution of distance in the result according to the position of each sample in the maximum absolute difference of each feature [49]. There may be better choices than this, so we wanted to give each indicator a weight based on TOPSIS in some way. As a result, we introduced the entropy weight method to give each indicator a weight value.

3. Results

3.1. Comprehensive Evaluation

Table 7 provides the comprehensive evaluation scores of the EPV index system of the nine provinces in the Yellow River basin in 2020 and the evaluation scores of each subindex.
On the whole, it can be seen from Table 6 that the Ci comprehensive evaluation score of the nine provinces in the Yellow River basin is 0.4520, with a range of 0.3100, which indicates that the overall realization level of the EPV in the nine provinces is low. There is a particular gap in the EPV between the provinces (Figure 3).
The main reasons for this are as follows: the realization and development of the EPV in each province is still relatively immature, a complete set of the EPV realization mechanisms have not been formed, and relevant policies in the various regions have not been fully implemented. Therefore, realizing the EPV still needs time to be implemented.
Spatially, the realization level of the EPV in the Yellow River basin is roughly as follows: upstream region > downstream region > middle reaches. The main reason for this is that although each province in the upstream region has rich natural resources, its ecosystem is also relatively fragile and needs to be protected more vigorously. Excellent natural resource endowments promote economic growth, but we should also pay attention to the reverse compensation of economic growth for ecological construction. The government should increase its support for ecological protection through macroeconomic regulation. To promote the virtuous cycle of ecological construction and economic development, the upstream provinces focus on the construction of ecological products, so the realization of the EPV in the upstream areas is more significant. In comparison, the natural endowment of the downstream region is poor, but the capital is more abundant and the technology is more advanced. Therefore, the EPV realization effect of the downstream region is lower than that of the upstream region but higher than that of the midstream region. Shanxi Province in the middle reaches of Shaanxi Province is a large industrial province dominated by coal. There are still some difficulties in transforming industrial structure and developing a green economy. Therefore, there is still much potential for improvement in realizing the EPV in the two provinces.

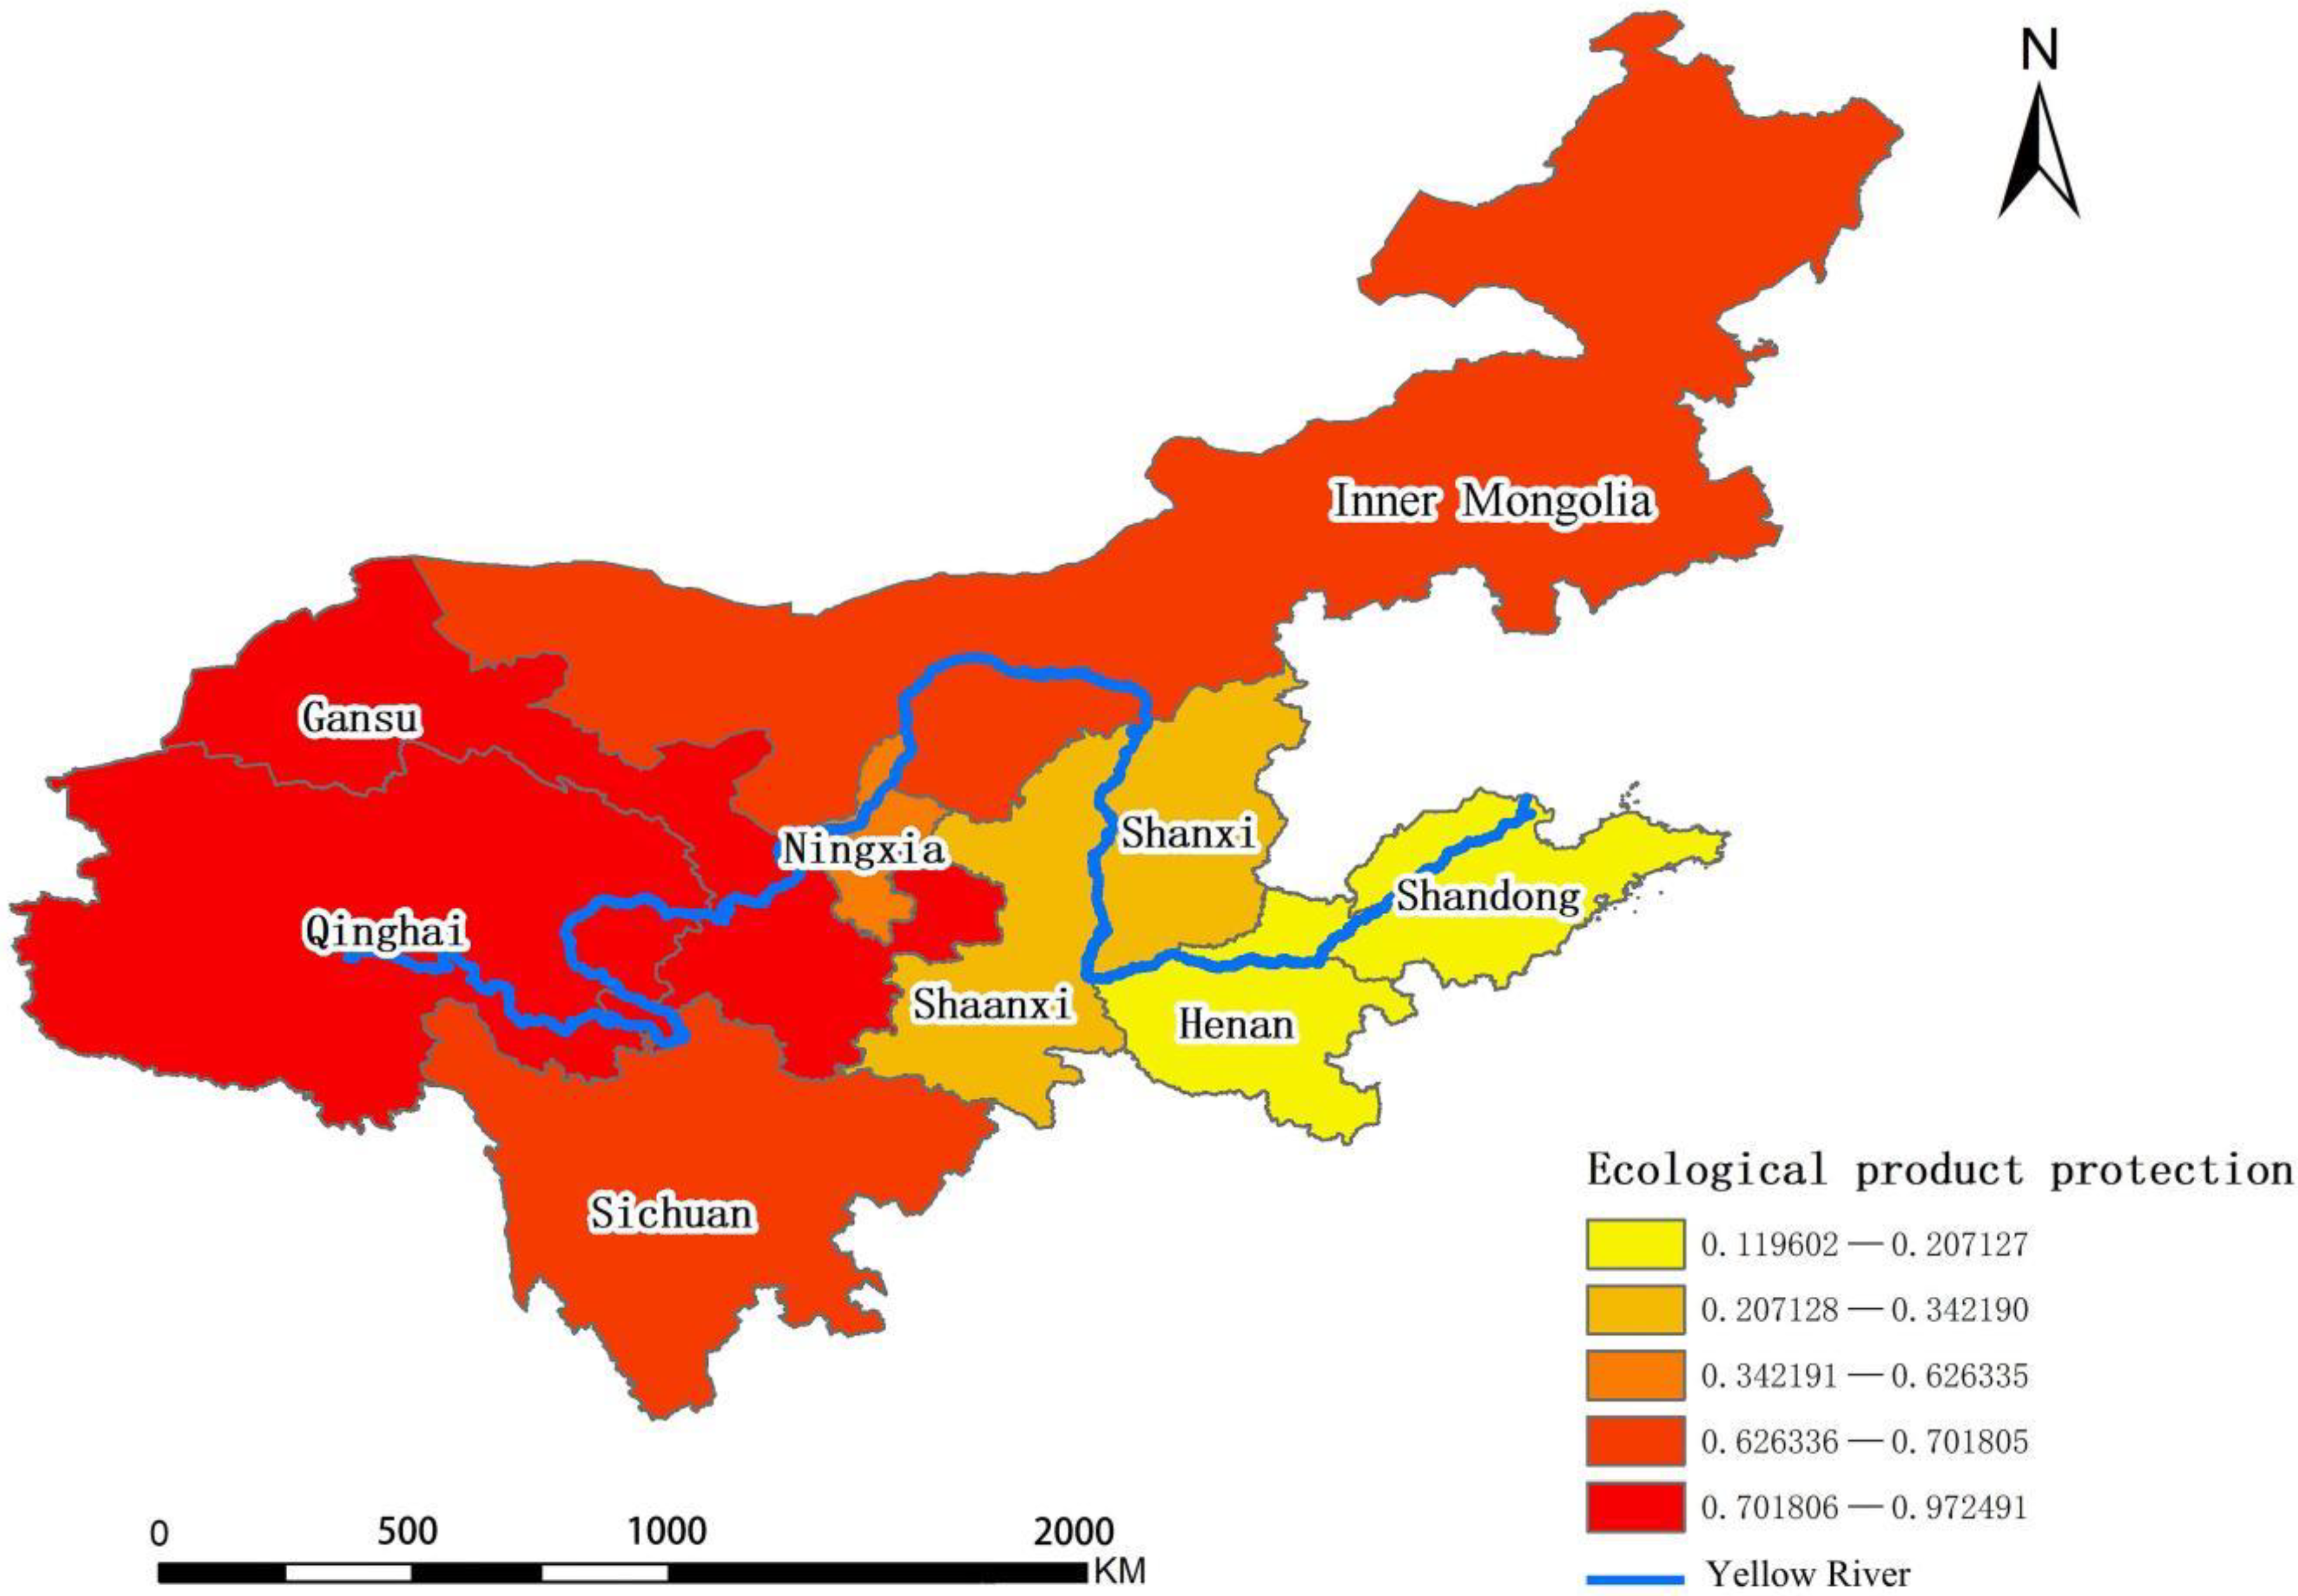
3.2. Ecological Product Protection Level

It can be seen from Table 6 that the Ci average evaluation score of the ecological product protection level in the nine provinces of the Yellow River basin is 0.5287. Moreover, the range is 0.8529. This indicates significant differences in the protection level of ecological products in each province (Figure 4).
Generally, the protection level average score l of ecological products is higher than the total evaluation score and ranks first among the subindicator systems, indicating that the protection level of ecological products in nine provinces is relatively good. In the subindicator system of the ecological product protection level, the harmless treatment level of sewage and domestic garbage in each province is relatively average and the treatment is relatively good. The sewage treatment rate and the harmless treatment rate of domestic garbage reached more than 95%. Comparatively speaking, although the ambient air quality and the proportion of excellent water quality have also been significantly improved, the governance level of each province (district) is still quite different.
From the spatial perspective, the protection level of ecological products in the Yellow River basin is the upper reaches > the middle reaches > the lower reaches. The main reasons are as follows: compared with the middle and lower reaches, the five upstream provinces have natural advantages in natural resources, and have not caused excessive damage to the ecological environment with the economic development; In the middle reaches of Shaanxi Province and Shanxi Province, the coal industry is developed, and due to the special terrain, the industrial pollutants discharged are not easy to spread, resulting in relatively poor ambient air quality in the two provinces, with relatively high average concentrations in the air, so the measured score of ecological product protection level is relatively low; Henan Province and Shandong Province in the lower reaches are in the last two places in the subindex system of the ecological product protection level in the nine provinces of the Yellow River basin. Due to poor air quality, relatively high average concentrations in the air, and low proportion of good water quality, it is not conducive to the construction of ecological products. At the same time, the significant differences in the protection level of ecological products in various provinces are also not conducive to the regional green coordinated development.

3.3. Carbon Neutralization Capacity

It can be seen from Table 6 that the Ci average score of carbon neutralization capacity of ecological products in nine provinces of the Yellow River basin is 0.3705, with a range of 0.7700. There is a significant difference in the carbon neutralization capacity of ecological products among provinces (Figure 5).
In general, the subindicator average value of ecological product carbon neutralization capacity is far lower than the average value of the comprehensive evaluation and other subindicators, and the carbon neutralization capacity of ecological products in all provinces is relatively poor. On the one hand, irrational land use, inadequate protection of forest, other resources and other reasons lead to insufficient forest, grassland, and cultivated land, which affects the carbon storage of natural resources and cannot achieve the purpose of increasing sinks. On the other hand, the energy structure cannot be changed rapidly. Among the nine provinces in the Yellow River basin, some provinces still have coal as the main energy structure. The energy consumption in industry and energy fields is still high, which hinders the reduction of carbon emissions. Therefore, the average score of carbon neutralization capacity assessment of ecological products in each province in the basin is low.
From the spatial perspective, the carbon neutralization capacity of ecological products in the Yellow River basin is roughly as follows: upper reaches > lower reaches > middle reaches. The main reason for this is that most of the upstream regions have the advantage of natural resources and invest heavily in the protection of natural resources, and there are few heavy industrial regions. The industry and energy efficiency has been improved rapidly. The average score of this subindex in the Inner Mongolia Autonomous Region, which is also the upstream region, is 24.3 times that of Ningxia Hui Autonomous Region. The index value of grassland cultivated land and other natural resources area is small, and the energy consumption per unit GDP is the highest. Although Henan and Shandong in the downstream area have less natural resources, their primary industries are more developed and their added value of the primary industry accounts for a higher proportion of GDP, so their energy consumption per unit GDP is smaller than that of other provinces. The natural resource conditions of Shaanxi Province and Shanxi Province in the middle reaches are relatively poor. The energy consumption of the two provinces is mainly coal, and they mainly rely on heavy industry to drive economic growth. Therefore, the energy consumption per unit of GDP is relatively high. Therefore, the carbon neutralization capacity of the ecological products of the two provinces in the middle reaches is lower than that of the upstream and downstream regions.

3.4. Transformation Level

It can be seen from Table 6 that the Ci average score of the EPV transformation level in the nine provinces in the Yellow River basin is 0.4878, and the range is 0.6262. This indicates that the EPV transformation level of each province in the Yellow River basin is significantly different (Figure 6).
On the whole, the value transformation level average score of ecological products is slightly higher than the comprehensive evaluation score. This indicates that although the value transformation of ecological products in each province has achieved certain results, a complete set of the EPV transformation mechanism has not been established. Firstly, with the improvement of economic development and consumption capacity, especially in the post epidemic era, people pay more attention to health, so the demand for organic and pollution-free ecological agricultural products is becoming stronger and the market share of ecological agricultural products is gradually expanding. However, due to insufficient scale and standardized production of ecological agricultural products, tighter constraints on the ecological environment, limited soil quality and water resources, and other factors, the supply of ecological agricultural products is insufficient. It is therefore difficult to meet the differentiated market demand. Secondly, in the context of the dual-carbon strategy, the development of clean energy is particularly important. However, wind energy and solar energy are constrained by natural factors at this stage, and it will be difficult for the cost of energy storage to decline. Water energy and nuclear energy have the characteristics of a long construction cycle, large investment scale, etc., so China’s thermal power generation transformation is more difficult. Thirdly, in the post-epidemic era, the demand for ecotourism has never been higher, which provides a huge potential market for the construction of ecotourism products. However, at this stage, there is a wrong understanding of ecotourism, with too much pursuit of economic interests and neglect of the ecological protection and environmental education functions of ecotourism. Ecotourism is still in the primary stage of development, so the ecotourism product system is not perfect. Finally, in the study area, the ecological product protection and compensation mechanism of each province is relatively perfect, but the construction of ecological rights and interests products has only stayed at the level of policy documents and has not really been implemented, thus affecting the value transformation level of ecological products.
From the spatial perspective, the transformation level of the EPV in the Yellow River basin is roughly as follows: upstream region > downstream region > middle reaches. The main reasons for this are as follows: the upstream region has always sought the balance between ecological protection and economic development and is committed to achieving green and healthy economic development and a virtuous circle in the context of the double-carbon strategy; comparatively speaking, the downstream area has a large population and a high level of economic development, so Henan Province and Shandong Province prefer to use labor, capital, technology, and other conditions to promote the green development of social economy, but due to the poor natural resource endowment, the value transformation level of ecological products is not high; in the middle reaches of Shaanxi and Shanxi Provinces, the secondary industry is the main industry, and the difficulties in industrial structure transformation and ecological construction have lowered the value of ecological products in the two provinces.

3.5. Guarantee Mechanism

It can be seen from Table 6 that the Ci average score of the EPV realization guarantee mechanism of the nine provinces in the Yellow River basin is 0.5127, and the range is 0.4328. This indicates specific differences in the EPV realization guarantee mechanism among the provinces in the Yellow River basin (Figure 7).
On the whole, the average score of the EPV realization guarantee mechanism is slightly higher than the comprehensive evaluation score, indicating that the guarantee mechanism of the EPV realization in the nine provinces is gradually improving. Given the “two mountains theory” and the “double carbon strategy”, provinces in China are paying more and more attention to the construction of ecological civilization, actively exploring the path to realize the EPV, and carrying out relevant pilot demonstration activities. All provinces (autonomous regions) have also continuously improved and updated relevant technologies, strengthened technical support, and introduced a series of reward and punishment policies with publicity and promotion mechanisms to combine technology with policies and systems to strengthen the guarantee mechanism for the EPV realization. However, there are also corresponding problems. For example, some system guarantees have only stayed at the document level, with few actually being implemented, and there has also been insufficient promotional efforts, thus reducing the potential of the EPV realization guarantee mechanism.
Spatially, the level of the guarantee mechanism for the realization of EPV in the Yellow River basin is roughly as follows: the lower reaches > the upper reaches > the middle reaches. It can be seen that Henan and Shandong in the lower reaches are economically developed, so the construction of the security mechanism is more perfect, while the upper and middle reaches should strengthen the protection of relevant systems and improve publicity.

4. Discussion

We believe that it is of positive significance to add a dual-carbon perspective to EPV evaluation and conduct empirical research. There is currently no unified index system for evaluating EPV in the academic circle [50,51]. The articles that do exist also lack the perspective of the dual-carbon strategy to study ways to achieve EPV [52,53]. Nevertheless, for human beings, the importance of EPV is obvious. This study attempted to construct an index system that can quantitatively evaluate EPV from the perspective of carbon peaking and carbon neutrality to be used as reference by relevant decision-makers and researchers. Based on entropy weight TOPSIS, we analyzed the protection level, carbon neutral capacity, transformation level, and safeguard mechanism of EPV ecological products in nine provinces of the Yellow River basin and explained the results. This study has positive significance for the quantitative evaluation of EPV, but it also has certain limitations. The index system we constructed can reflect the distribution characteristics of EPV in the nine provinces of the Yellow River basin to a certain extent. However, particular emphasis should be given when studying other regions. When looking at EPV of areas such as river basins, cities, mountains, farmland, and wetland, the indicators should be optimized according to the characteristics of the research object. Secondly, the classical TOPSIS algorithm as a research method has the same weight value for each indicator by default, which means that its essence is to determine the contribution of distance in the result according to the position of each sample in the maximum absolute difference of each feature. Our method used the entropy weight method to improve TOPSIS and achieved good results. Besides us, many scholars have also applied this method [54,55], which proves that entropy weight TOPSIS has been widely used. Scholars in the same field can consider building a more comprehensive indicator system or a new artificial intelligence method on the basis of this article. The limitations of the data are also worth considering. Each quantitative evaluation index data will have more or less impact on the comprehensive evaluation results. Therefore, we should start from the evaluation goal and obtain more comprehensive data for evaluation as much as possible. Only then can we have a deeper understanding of the evaluation object.
Through experiments, we verified the practicability of the EPV evaluation index from the dual-carbon perspective. At the same time, we have the following suggestions for improving the EPV of the nine provinces in the Yellow River basin. Firstly, the ecosystem of the Yellow River basin needs coordinated development. The upstream region requires enhanced ecosystem protection, more pollution control is needed in the middle reaches, and greater attention should be paid to the maintenance of biodiversity in the downstream region. For the middle and lower reaches of the Yellow River basin, we should increase investment in ecological protection and strengthen environmental monitoring and governance in this region. Secondly, on the one hand, backward production capacity and production process should be eliminated. The industrial structure needs to be adjusted and upgraded, and a modern industrial system should be established. On the other hand, we need to coordinate the development and utilization of ecological resources, increase the total amount of ecological resources, and improve land greening to increase carbon sinks. Thirdly, the development of different types of ecological products needs to be increased and measures should be adjusted to suit local conditions. For example, the Yellow River basin has rich natural resources and landscapes, colorful national culture, distinctive regional characteristics, and other advantages. We should strengthen the construction of supporting infrastructure, increase the supply of high-quality ecological agricultural products and ecotourism products, and establish an efficient ecological resource market system. Finally, institutional and technical guarantees should be strengthened, and there should be greater promotion of the application of ecological product value in ecological protection compensation, ecological environment damage compensation, ecological management, and ecological resource rights and interests transactions. The guiding mechanism of ecological environment interest protection should be established to encourage enterprises, society, and individuals to actively participate in ecological environment protection.

5. Conclusions

In this work, to solve the problem of the lack of a quantitative evaluation index system in EPV research, we proposed an EPV evaluation index system based on the dual-carbon perspective. For this purpose, using the nine provinces in the Yellow River basin as the research object, we evaluate the results using entropy weight TOPSIS, which has been proven to be a promising choice for this kind of task. The results showed that the comprehensive evaluation score of the EPV was 0.4520, indicating that the overall level of EPV realization in the nine provinces was low. The overall realization level of the EPV was the best in the upstream region, followed by the downstream region, and the worst in the middle reaches. The average score of carbon neutralization capacity was 0.3705, indicating that the carbon neutralization capacity of ecological products in all provinces was relatively poor. In the context of the dual-carbon strategy, all regions should strive to improve this indicator. The carbon neutralization capacity of ecological products was generally best in the upstream region, followed by the downstream region, and poor in the midstream region. The average score of the EPV transformation level was 0.4878, which indicates that although the EPV transformation of each province has achieved certain results, the EPV transformation mechanism is still being explored. The value transformation level of ecological products generally showed the best results in the upstream region, followed by the downstream region, and the worst results in the midstream region. The average score of the guarantee mechanism for realizing the EPV was 0.5127, which indicates that the guarantee mechanism for realizing the value of ecological products in the nine provinces is being strengthened. The level of guarantee mechanism for the realization of EPV showed the best results in the downstream region, followed by the upstream region, and worst results in the midstream region. Given the double-carbon strategy, we should speed up the improvement of various guarantee measures to realize the value of ecological products. The EPV evaluation framework from the perspective of dual-carbon strategy scientifically solves the problem of lack of quantitative methods for EPV measurement. Assessing the EPV in nine provinces in the Yellow River basin provides a meaningful decision-making reference for the basin’s spatial planning and ecological governance.

Author Contributions

Conceptualization, Y.Z.; methodology, Z.M.; software, M.S.; validation, J.S.; formal analysis, Y.J.; investigation, Q.L.; resources, Y.Z.; data curation, M.S.; writing—original draft preparation, M.S.; writing—review and editing, Y.Z.; visualization, Y.Y.; supervision, Q.L.; project administration, Y.J.; funding acquisition, J.S. All authors have read and agreed to the published version of the manuscript.

Funding

This research was supported by the Beijing Social Science Foundation Major Project Research on building an ecological civilization system (19ZDA03).

Data Availability Statement

Not applicable.

Conflicts of Interest

The authors declare no conflict of interest.

References

  1. Marchese, D.; Reynolds, E.; Bates, M.E.; Morgan, H.; Clark, S.S.; Linkov, I. Resilience and sustainability: Similarities and differences in environmental management applications. Sci. Total Environ. 2018, 613, 1275–1283. [Google Scholar] [CrossRef]
  2. Dong, C.; Dong, X.C.; Jiang, Q.Z.; Dong, K.Y.; Liu, G.X. What is the probability of achieving the carbon dioxide emission targets of the Paris Agreement? Evidence from the top ten emitters. Sci. Total Environ. 2018, 622, 1294–1303. [Google Scholar] [CrossRef]
  3. Hu, Y.; Chi, Y.Y.; Zhou, W.B.; Wang, Z.Z.; Yuan, Y.K.; Li, R.Y. Research on Energy Structure Optimization and Carbon Emission Reduction Path in Beijing under the Dual Carbon Target. Energies 2022, 16, 5954. [Google Scholar] [CrossRef]
  4. Zhang, Z.Z.; Xiong, K.N.; Chang, H.H.; Zhang, W.X.; Huang, D.H. A Review of Eco-Product Value Realization and Ecological Civilization and Its Enlightenment to Karst Protected Areas. Int. J. Environ. Res. Public Health 2022, 19, 5892. [Google Scholar] [CrossRef]
  5. Zhang, Y.; Yang, Y.; Jiang, P.; Deng, H.D.; Qi, F.; Li, Q.; Chang, X.W.; Cheng, P. Scientific cognition, path and governance system guarantee of the Life Community of Mountains, Rivers, Forests, Fields, Lakes and Grasses. J. Nat. Resour. 2022, 37, 3005–3018. [Google Scholar] [CrossRef]
  6. Liu, K.; Tao, Y.M.; Wu, Y.; Wang, C.X. How does ecological civilization construction affect carbon emission intensity? Evidence from Chinese provinces’ panel data. Chin. J. Popul. Resour. 2019, 18, 97–102. [Google Scholar] [CrossRef]
  7. Acharya, R.P.; Maraseni, T.; Cockfield, G. Global trend of forest ecosystem services valuation: An analysis of publications. Ecosyst. Serv. 2019, 39, 161–175. [Google Scholar] [CrossRef]
  8. Zhao, J.C.; Ji, G.X.; Yue, Y.L.; Lai, Z.Z.; Chen, Y.L.; Dong, Y.; Yang, X.; Wang, Z. Spatio-temporal dynamics of urban residential CO2 emissions and their driving forces in China using the integrated two nighttime light datasets. Appl. Energy 2018, 235, 612–624. [Google Scholar] [CrossRef]
  9. Ye, C.; Chen, M.X.; Duan, J.J.; Yang, D.Y. Uneven development, urbanization, and production of space in the middle-scale region based on the case of Jiangsu province, China. Habitat Int. 2017, 66, 106–116. [Google Scholar] [CrossRef]
  10. Costanza, R.; Arge, R.; De Groot, R.; Farber, S.; Grasso, M.; Hannon, B.; Limburg, K.; Naeem, S.; O’Neill, R.V.; Paruelo, J.; et al. The value of the world’s ecosystem services and natural capital. Ecol. Econ. 1998, 25, 3–15. [Google Scholar] [CrossRef]
  11. Li, L.; Qian, Y.C.; Yan, W.D. Research on the evaluation index system for ecological civilization construction in major function zoning. J. Cent. South Univ. For. Technol. 2021, 15, 1–8. [Google Scholar] [CrossRef]
  12. Daily, G.C. Nature’s Services: Societal Dependence on Natural Ecosystems; Island Press: Washington, DC, USA, 1997; pp. 220–221. [Google Scholar]
  13. Zhang, Y.; Jiang, P.; Cui, L.Y.; Yang, Y.; Ma, Z.J.; Wang, Y.; Miao, D.H. Study on the spatial variation of China’s territorial ecological space based on the standard deviation ellipse. Front. Environ. Sci. 2022, 10, 982734. [Google Scholar] [CrossRef]
  14. Zhou, W.; Shen, L.; Zhong, S.; Yuan, G.H. System margin and path research of ecological product value implementation. Resour. Ind. 2021, 23, 94–104. [Google Scholar] [CrossRef]
  15. Wong, C.; Jiang, B.; Kinzig, A.; Lee, K.; Ouyang, Z.Y. Linking ecosystem characteristics to final ecosystem services for public policy. Ecol. Lett. 2015, 18, 108–118. [Google Scholar] [CrossRef] [Green Version]
  16. Wang, J.N.; Yu, F.; Ma, G.X.; Peng, F.; Zhou, X.F.; Wu, C.S.; Yang, W.S.; Wang, C.Y.; Cao, D.; Jiang, H.Q.; et al. Gross economic-ecological product as an integrated measure for ecological service and economic products. Resour. Conserv. Recycl. 2021, 171, 105566. [Google Scholar] [CrossRef]
  17. Ruckelshaus, M.; McKenzie, E.; Tallis, H.; Guerry, A.; Daily, G.; Kareiva, P.; Polasky, S.; Ricketts, T.; Bhagabati, N.; Wood, S.; et al. Notes from the field: Lessons learned from using ecosystem service approaches to inform real-world decisions. Ecol. Econ. 2015, 115, 11–21. [Google Scholar] [CrossRef] [Green Version]
  18. John, J.; Niels, C.K.; Antonio, B.; Keith, E.B. Environmental and public health related risk of veterinary zinc in pig production—Using Denmark as an example. Environ. Int. 2018, 114, 181–190. [Google Scholar] [CrossRef]
  19. Lu, N.; Fu, B.J.; Jin, T.T.; Chang, R.Y. Trade-off analyses of multiple ecosystem services by plantations along a precipitation gradient across Loess Plateau landscapes. Landsc. Ecol. 2014, 29, 1697–1708. [Google Scholar] [CrossRef]
  20. Zhang, L.B.; Yang, J.; Li, D.Q.; Liu, H.J.; Xie, Y.X.; Song, T.; Luo, S.H. Evaluation of the ecological civilization index of China based on the double benchmark progressive method. J. Clean. Prod. 2019, 222, 511–519. [Google Scholar] [CrossRef]
  21. Shen, H.T.; Liu, Z.Q.; Xiong, K.N.; Li, L. A study revelation on market and value-realization of ecological product to the control of rocky desertifification in south China karst. Sustainability 2022, 14, 3060. [Google Scholar] [CrossRef]
  22. Li, G.D.; Fang, C.L. Global mapping and estimation of ecosystem services values and gross domestic product: A spatially explicit integration of national ‘green GDP’ accounting. Ecol. Indic. 2014, 46, 293–314. [Google Scholar] [CrossRef]
  23. Aryal, K.; Ojha, B.; Maraseni, T. Perceived importance and economic valuation of ecosystem services in Ghodaghodi wetland of Nepal. Land Use Policy 2021, 106, 105450. [Google Scholar] [CrossRef]
  24. Wang, K.L.; Zhang, C.H.; Chen, H.S.; Yue, Y.M.; Zhang, W.; Zhang, M.Y.; Qi, X.K.; Fu, Z.Y. Karst landscapes of China: Patterns, ecosystem processes and services. Landsc. Ecol. 2019, 34, 2743–2763. [Google Scholar] [CrossRef] [Green Version]
  25. Zoderer, B.M.; Tasser, E.; Carver, S.; Tappeiner, U. Stakeholder perspectives on ecosystem service supply and ecosystem service demand bundles. Ecosyst. Serv. 2019, 37, 100938. [Google Scholar] [CrossRef]
  26. Shi, Y.; Zhou, C.B.; Wang, R.S.; Xu, W.Y. Measuring China’s regional ecological development through “EcoDP”. Ecol. Indic. 2012, 15, 253–262. [Google Scholar] [CrossRef]
  27. Asare, E.; Mantyka-Pringle, C.; Anderson, E.; Belcher, K.; Clark, R. Evaluating ecosystem services for agricultural wetlands: A systematic review and meta-analysis. Wetl. Ecol. Manag. 2022, 30, 1129–1149. [Google Scholar] [CrossRef]
  28. De Groot, R.; Brander, L.; van der Ploeg, S.; Costanza, R.; Braat, L.; Christie, M.; Crossman, N.; Ghermandi, A.; Hein, L.; Hussain, S.; et al. Global estimates of the value of ecosystems and their services in monetary units. Ecosyst. Serv. 2012, 1, 50–61. [Google Scholar] [CrossRef]
  29. Gao, X.L.; Cheng, H.Q.; Zheng, H.; Ouyang, Z.Y. Research on the policy instruments for the value realization of ecological products. Acta Ecol. Sin. 2019, 39, 8746–8754. [Google Scholar] [CrossRef]
  30. Wang, N.; Xu, C.; Kong, F. Value Realization and Optimization Path of Forest Ecological Products—Case Study from Zhejiang Province, China. Int. J. Environ. Res. Public Health 2022, 19, 7538. [Google Scholar] [CrossRef]
  31. Zhou, J.; Xiong, K.; Wang, Q.; Tang, J.; Lin, L. A Review of Ecological Assets and Ecological Products Supply: Implications for the Karst Rocky Desertification Control. Int. J. Environ. Res. Public Health 2022, 19, 10168. [Google Scholar] [CrossRef]
  32. Hamel, P.; Bryant, B. Uncertainty assessment in ecosystem services analyses: Seven challenges and practical responses. Ecosyst. Serv. 2017, 24, 1–15. [Google Scholar] [CrossRef]
  33. Yu, H.Y.; Zhang, L.B.; Li, D.Q.; Yang, C.Y.; Gao, Y.N.; Song, T.; Wu, F.C. Practical experience and enlightenment of value Implementation of ecological products. Res. Environ. Sci. 2020, 33, 685–690. [Google Scholar] [CrossRef]
  34. Fisher, B.; Turner, R.K.; Morling, P. Defining and classifying ecosystem services for decision making. Ecol. Econ. 2009, 68, 643–653. [Google Scholar] [CrossRef] [Green Version]
  35. Defries, R.; Nagendra, H. Ecosystem management as a wicked problem. Science 2017, 356, 265–270. [Google Scholar] [CrossRef]
  36. Ma, G.X.; Wang, J.N.; Yu, F.; Yang, W.S.; Ning, J.; Peng, F.; Zhou, X.F.; Zhou, Y.; Cao, D. Framework construction and application of China’s Gross Economic-Ecological Product accounting. J. Environ. Manag. 2020, 264, 109852. [Google Scholar] [CrossRef]
  37. Matzek, V.; Wilson, K.; Kragt, M. Mainstreaming of ecosystem services as a rationale for ecological restoration in Australia. Ecosyst. Serv. 2019, 35, 79–86. [Google Scholar] [CrossRef]
  38. Zheng, H.; Li, Y.F.; Robinson, B.E.; Liu, G.; Ma, D.C.; Wang, F.C.; Lu, F.; Ouyang, Z.Y.; Daily, G.C. Using ecosystem service trade-offs to inform water conservation policies and management practices. Front. Ecol. Environ. 2016, 14, 527–532. [Google Scholar] [CrossRef]
  39. Jayachandran, S.; De Laat, J.; Lambin, E.F.; Stanton, C.Y.; Audy, R.; Thomas, N.E. Cash for carbon: A randomized trial of payments for ecosystem services to reduce deforestation. Science 2017, 357, 267–273. [Google Scholar] [CrossRef] [Green Version]
  40. Wunder, S. Revisiting the concept of payments for environmental services. Ecol. Econ. 2015, 117, 234–243. [Google Scholar] [CrossRef]
  41. Guo, A.J.; Zhang, Y.N.; Zhong, F.L.; Jiang, D.W. Spatiotemporal Patterns of Ecosystem Service Value Changes and Their Coordination with Economic Development: A Case Study of the Yellow River Basin, China. Int. J. Environ. Res. Public Health 2020, 17, 8474. [Google Scholar] [CrossRef]
  42. Yuan, X.L.; Sheng, X.R.; Chen, L.P.; Tang, Y.Z.; Li, Y.; Jia, Y.S.; Qu, D.F.; Wang, Q.S.; Ma, Q.; Zuo, J. Carbon footprint and embodied carbon transfer at the provincial level of the Yellow River Basin. Sci. Total Environ. 2022, 803, 149993. [Google Scholar] [CrossRef] [PubMed]
  43. Bateman, I.J.; Harwood, A.R.; Mace, G.M.; Watson, R.T.; Abson, D.J.; Andrews, B.; Binner, A.; Crowe, A.; Day, B.H.; Dugdale, S.; et al. Bringing Ecosystem Services into Economic Decision-Making: Land Use in the United Kingdom. Science 2013, 341, 45–50. [Google Scholar] [CrossRef] [PubMed]
  44. Jin, B.H. Research on performance evaluation of green supply chain of automobile enterprises under the background of carbon peak and carbon neutralization. Energy Rep. 2021, 7, 594–604. [Google Scholar] [CrossRef]
  45. Chen, Y.; Li, W.W.; Yi, P.T. Evaluation of city innovation capability using the TOPSIS-based order relation method: The case of Liaoning province, China. Technol. Soc. 2020, 63, 101330. [Google Scholar] [CrossRef]
  46. Ferraro, P.J.; Hanauer, M.M.; Miteva, D.A.; Nelson, J.L.; Pattanayak, S.K.; Nolte, C.; Sims, K.R.E. Estimating the impacts of conservation on ecosystem services and poverty by integrating modeling and evaluation. Proc. Natl. Acad. Sci. USA 2015, 112, 7420–7425. [Google Scholar] [CrossRef] [Green Version]
  47. Zhao, D.F.; Li, C.B.; Wang, Q.Q.; Yuan, J.H. Comprehensive Evaluation of National Electric Power Development Based on Cloud Model and Entropy Method and TOPSIS: A Case Study in 11 Countries. J. Clean. Prod. 2020, 277, 123190. [Google Scholar] [CrossRef]
  48. Da, K.N.; An, J.R.; Chen, Z.S. Research about Suppliers Selection upon Entropy Weight and TOPSIS in the Perspective of Supply Chain. Appl. Mech. Mater. 2014, 638-640, 2455–2459. [Google Scholar] [CrossRef]
  49. Chen, C.H. A Hybrid Multi-Criteria Decision-Making Approach Based on ANP-Entropy TOPSIS for Building Materials Supplier Selection. Entropy 2022, 23, 1597. [Google Scholar] [CrossRef]
  50. Lei, S.; Meng, X.J.; Hou, C.F.; Ye, L.F.; Deng, H.D.; Chai, Y.Y.; Han, Y.W. Ecological products value realization mechanism and effectiveness evaluation in the Yangtze River Basin. J. Environ. Eng. Technol. 2022, 12, 399–407. [Google Scholar] [CrossRef]
  51. Su, W.Z.; Zhou, J.; Peng, Q.; Shao, S.Y. Ecosystem service products trading in the transboundary basin of the Yangtze River Delta: An example of Tianmu Lake Basin. J. Nat. Resour. 2022, 37, 1598–1608. [Google Scholar] [CrossRef]
  52. Zhou, X.; Wang, Q.; Zhang, R.; Ren, B.; Wu, X.; Wu, Y.; Tang, J. A Spatiotemporal Analysis of Hainan Island’s 2010–2020 Gross Ecosystem Product Accounting. Sustainability 2022, 14, 15624. [Google Scholar] [CrossRef]
  53. Yu, H.; Shao, C.; Wang, X.; Hao, C. Transformation Path of Ecological Product Value and Efficiency Evaluation: The Case of the Qilihai Wetland in Tianjin. Int. J. Environ. Res. Public Health 2022, 19, 14575. [Google Scholar] [CrossRef] [PubMed]
  54. Yu, X.; Suntrayuth, S.; Su, J.F. A Comprehensive Evaluation Method for Industrial Sewage Treatment Projects Based on the Improved Entropy-TOPSIS. Sustainability 2020, 12, 6734. [Google Scholar] [CrossRef]
  55. Li, X.F. TOPSIS model with entropy weight for eco geological environmental carrying capacity assessment. Microprocess. Microsyst. 2022, 82, 103805. [Google Scholar] [CrossRef]
Figure 1. Methodological flow diagram.
Land 12 00516 g001
Figure 2. Research area of nine provinces in the Yellow River basin, China.
Land 12 00516 g002
Figure 3. Comprehensive evaluation index.
Land 12 00516 g003
Figure 4. Ecological product protection level subindex.
Land 12 00516 g004
Figure 5. The carbon neutral capacity of ecological products subindex.
Land 12 00516 g005
Figure 6. The EPV transformation subindex.
Land 12 00516 g006
Figure 7. The guarantee mechanism for the realization of the EPV subindex.
Land 12 00516 g007
Table 1. Dataset source information.
Data NameData FormatData Support Organization
China Statistical Yearbook (2021)Statistics in Excel formatNational Bureau of statistics of the People’s Republic of China (NBSPRC)
China Energy Statistical Yearbook (2021)Statistics in Excel formatNational Bureau of statistics of the People’s Republic of China (NBSPRC)
Statistical Yearbook of the provinces in the Yellow River basin (2021)Statistics in Excel formatNational Bureau of statistics of the People’s Republic of China (NBSPRC)
Map of ChinaVector format, Arcgis.shp filesMinistry of Natural Resources of the People’s Republic of China (MNRPRC)
Table 2. Indicators and index interpretation of ecological product protection subindex.
Serial NumberIndexMeaning
W 1 Proportion of days with excellent air quality (%)The proportion of monitoring days with good air quality or above in the whole year.
W 2 Average concentration of PM 2.5 (μg/m3)The concentration of dust or drifting dust in ambient air with a diameter of less than or equal to 2.5 μm.
W 3 Excellent cross-sectional ratio of water quality (%)Water quality at or better than Class III.
W 4 Sewage treatment rate (%)The amount of treated domestic sewage and industrial wastewater accounts for the proportion of total sewage discharge.
W 5 Harmless treatment rate of domestic waste (%)The harmless treatment of domestic waste (sanitary landfill, composting, and incineration) as a proportion of domestic waste production.
Table 3. Indicators and index interpretation of the carbon neutral capacity of ecological product subindex.
Serial NumberIndexMeaning
X 1 Forest area (ten thousand hectares)The area of woodland or forest belt with a closure of 0.2 or more (including 0.2) or a crown width of more than 10 m is composed of tree species, that is, it is a woodland area.
X 2 Grass area (ten thousand hectares)Pastoral areas and agricultural areas are used for grazing livestock or mowing grass, and the vegetation cover is more than 5% of the grasslands, grass slopes, grass mountains, and other areas.
X 3 cultivated land (ten thousand hectares)Area of land that is frequently cultivated, including mature land, newly opened wasteland in the current year, cultivated land that has been abandoned for less than three consecutive years, and leisure land in that year.
X 4 Energy consumption per unit of GDP (tons of standard coal/ten thousand yuan)The energy consumed by a country for each unit of GDP produced in a certain period of time.
Notes: X1–X3 adopts the absolute area index, which emphasizes the absolute importance of the scale of ecological land for the EPV.
Table 4. Indicators and index interpretation of the EPV transformation subindex.
Serial NumberIndexMeaning
Y 1 Construction of ecological agricultural productsThe total output value of agriculture, forestry, animal husbandry, and fishery.
Y 2 Construction of ecological energy productsClean energy power generation as a proportion of total power generation.
Y 3 Construction of ecotourism productsTourism revenue as a proportion of total revenue from the service industry.
Y 4 Construction of ecological rights and interests products For the trading mechanism of ecological rights and interests, such as pollutant discharge rights, carbon emission rights, water rights, carbon sinks, energy use rights, forest indicators, and cultivated land indicators, each item is awarded 1 point, up to a maximum of 7 points.
Y 5 Construction of ecological compensation productsFor ecological compensation mechanisms, such as forests, wetlands, grasslands, rivers, deserts, and cultivated land, 1 point is awarded for each item, up to a maximum of 6 points.
Table 5. Indicators and index interpretation of the guarantee mechanism for the EPV realization subindex.
Serial NumberIndexMeaning
Z 1 Institutional guaranteesFor the active creation of pilot demonstrations related to the realization of the value of ecological products by ministries and commissions, such as the Ministry of Ecology and Environment, the National Development and Reform Commission, the Ministry of Agriculture and Rural Affairs, the Ministry of Natural Resources, the Ministry of Culture and Tourism, and the State Forestry and Grassland Administration, 1 point is awarded for each item, up to a maximum of 5 points.
Z 2 Technical supportFor the unified right confirmation registration system for natural resources, the grid environmental monitoring system, the construction of the ecological environment big data cloud monitoring platform, the EPV accounting mechanism, the strengthening of intellectual support, and inter-regional discussion and exchange, each item is awarded 1 point, up to a maximum of 5 points.
Z 3 Funding guaranteeFiscal expenditure related to ecological protection and ecological industry as a proportion of total fiscal spending.
Z 4 Policy rewards and punishmentsFor policies such as preferential taxes and fees for industries related to ecological products, policies for rewarding and compensating for ecological brand building, auditing leading cadres leaving office, and guiding the establishment of social welfare funds, each preferential mechanism established will receive 1 point, up to a maximum of 4 points.
Z 5 Publicity and promotionFor the active promotion of local classic cases, 1 point is awarded for the establishment of a special publicity platform for ecological products, 1 point is awarded for actively holding ecological-product-related publicity activities, and 2 points/1 point is awarded for being recommended by national/provincial authoritative media, up to a maximum of 5 points.
Table 6. Evaluation index system of the EPV.
SubindexIndicatorsAttributeSerial NumberWeight
The protection of ecological productsProportion of excellent days (%)Forward W 1 0.0531
Average concentration of PM 2.5 (μg/m3)Negative W 2 0.0569
Excellent cross-sectional ratio of water quality (%)Forward W 3 0.0641
Sewage treatment rate (%)Forward W 4 0.0587
Harmless treatment rate of domestic waste (%)Forward W 5 0.0571
The carbon neutral capacity of ecological productsForest area (ten thousand hectares)Forward X 1 0.0421
Grass area (ten thousand hectares)Forward X 2 0.0267
Cultivated land (ten thousand hectares)Forward X 3 0.0527
Energy consumption per unit of GDP (tons of standard coal/ten thousand yuan)Negative X 4 0.0549
The value transformation of ecological productsConstruction of ecological agricultural productsForward Y 1 0.0406
Construction of ecological energy productsForward Y 2 0.0404
Construction of ecotourism productsForward Y 3 0.0539
Construction of ecological rights and interests products Forward Y 4 0.0539
Construction of ecological compensation productsForward Y 5 0.0613
The value guarantee mechanism of ecological productsInstitutional guaranteesForward Z 1 0.0565
Technical supportForward Z 2 0.0559
Funding guaranteeForward Z 3 0.0610
Policy rewards and punishmentsForward Z 4 0.0587
Publicity and promotionForward Z 5 0.0516
Table 7. The value evaluation score of ecological products in nine provinces of the Yellow River basin in 2020.
ProvinceThe Protection of Ecological ProductsThe Carbon Neutral Capacity of Ecological ProductsThe Value Transformation of Ecological ProductsThe Value Guarantee Mechanism of Ecological ProductsComprehensive Evaluation Score
Qinghai Province0.9725 (1)0.3903 (3)0.5401 (3)0.5173 (6)0.4988 (3)
Sichuan Province 0.7018 (3)0.4956 (2)0.8925 (1)0.3748 (7)0.5287 (2)
Gansu Province0.8457 (2)0.3422 (5)0.5495 (2)0.2971 (9)0.4117 (6)
Ningxia Hui Autonomous Region0.6263 (5)0.0331 (9)0.2663 (9)0.6361 (2)0.3650 (8)
Inner Mongolia Autonomous Region0.6947 (4)0.8031 (1)0.4485 (5)0.5870 (3)0.6419 (1)
Shaanxi Province0.3422 (6)0.3274 (7)0.3987 (8)0.5358 (6)0.4048 (7)
Shanxi Province0.2484 (7)0.2455 (8)0.4297 (6)0.3566 (8)0.3319 (9)
Henan Province0.1196 (9)0.3678 (4)0.4501 (4)0.7300 (1)0.4680 (4)
Shandong Province0.2071 (8)0.3292 (6)0.4152 (7)0.5792 (4)0.4174 (5)
Average value0.52870.37050.48780.51270.4520
Range0.85290.77000.62620.43280.3100
Disclaimer/Publisher’s Note: The statements, opinions and data contained in all publications are solely those of the individual author(s) and contributor(s) and not of MDPI and/or the editor(s). MDPI and/or the editor(s) disclaim responsibility for any injury to people or property resulting from any ideas, methods, instructions or products referred to in the content.

