Abstract
Tracking changes in the structure of landscape dynamics as a result of flood activity is a complex process. This study presents a model for determining changes to landscapes caused by flood events by evaluating a specific territory in Eastern Slovakia, which has been affected by repeated large-scale flood events in the past. The area has not been subject to a comprehensive monitoring of changes in the landscape structure. Based on the observation of several sets of data, a combination of statistical methods and GIS spatial analysis tools (visualizing tools for compare categories, mapping, and modelling techniques, spatial analysis models for land use change and flood modelling) were used to identify changes in the landscape structure in the period from 1998 to 2021. The results point to the significance of the year 2010, with the precipitation totals for this year showing a level significantly higher than the rolling average and confirming the occurrence of an extreme flood event. The dynamics of landscape structure changes were evaluated based on changes in the representation of selected types of land cover classes. The results of a spatial evaluation of the Corine Land Cover demonstrate that the most-significant area changes were recorded in 2012 in the pasture class, with a decrease of 31% or approximately 96.5 ha. The identified difference in the frequency of representation of individual values of the normalized differential vegetation index confirms the loss of landscape diversity and the emergence of a more homogeneous type of landscape. An assessment of the state of pastures in the study area shows that this class has completely disappeared from the site near the watercourse.
1. Introduction
The process of urbanization results in changes to the natural environment and to the use of agricultural land [1], and this can leave the surrounding landscape vulnerable to frequent flood events even in areas that are not located in the vicinity of the watercourses. Studies have shown that changes in land use have a significant impact on extreme weather events, making it difficult to accurately predict the extent and intensity of floods [2]. All changes to the landscape structure caused by floods leave visible traces in the landscape and change its usability character. The image of a landscape repeatedly exposed to the effects of flood events shows clear evidence of negative impacts, not only visually, but also materially, and the landscape patterns affected by flood activities change significantly over time. Previous studies have suggested that several factors may explain why this process occurs, such as urban expansion [3], geomorphology [4], or hydrological cycles [5]. These changes are particularly apparent in the land use of affected areas. Land cover or land use is an important indicator that affects the course of floods [6,7]. A study by Malíková [8] demonstrated that changes in land use and cultivated areas can result in the gradual transformation of affected areas into overgrown meadows and afforestation. It has been acknowledged that the intensity of these changes is variable elements in both time and space, and it is therefore necessary to monitor and identify changes to the landscape on a regular basis, including analyses of the hydrological landscape and its factors [9] and assessments of individual factors such as soil, geology, landscape shape, land use, and landscape models [10]. Previous studies have estimated that these types of analyses typically employ techniques such as geographical information system (GIS) tools [11,12,13], remote sensing aerial imagery [14,15,16], the use of hydrodynamical models [17], and on-site terrain exploration [18,19]. Hydrometeorological data, especially precipitation measurements, are vital for identifying the potential for flooding and the consequent changes in the landscape structure. A study of the Subansiri River Basin in India [20] used satellite images and on-site field surveys to identify the role of meteorology and local orthography in the development of flood activity. Several other studies [21,22] have applied methodologies similar to those used in the current study to assess the role of meteorological data for the prediction and impact of flooding before the event. Both studies showed the importance of the precipitation indicator either using artificial neural networks or existing meteorological and hydrological models such as ALADIN, HYDROG, and AQUALOG.
The use of conventional methods to monitor changes in landscape patterns and to reconstruct potential flood events [23] are demanding, not only in terms of time, but also in terms of their implementation. In an effort to address the aforementioned research gaps, this study will rely on an in-depth topographic survey and the application of visualization techniques. Previous studies have shown that Corine land cover (CLC) databases are a useful tool for applying spatial analyses to identify different types of land use [24], as are image-processing tools developed and used to process data obtained remotely [25]. Data available from sources such as the Sentinel-2 satellites are divided into spectral bands, with each type of landscape structure featuring specific reflectances in individual spectra, which allow us to assign or unassign their classification or to apply machine learning tools to identify secondary landscape structures at a resolution of 10 m.
The variety of landscape patterns is a vulnerable aspect, and this is also the case in conjunction with several factors such as urban sprawl [24], anthropogenic activities [26], and flood events [27]. This study also offers a novel approach through its investigation of complex interactions between the above-mentioned factors, monitoring changes in landscape complexity in relation to the specific nature and representation of CLC classifications, the presence of anthropogenic technological features (in this case, a small hydroelectric power plant), and the impact of localized flooding in the area. For these reasons, the study will focus primarily on currently available data to create a topographic basis for land use information in combination with the results of hydrodynamic methodologies that identify the extent and course of the flood. The authors are unaware of any other studies that have monitored the dynamics of changes in the landscape structure in the chosen area. When monitoring changes in landscape structure over time using the Normalized Difference Vegetation Index (NDVI), we found in this study a penetration in several scientific studies [28,29,30].
The area examined in this paper, the Hornád basin, is located in a sub-region that experienced extremely serious flood activities in 2010 and 2014, but prior to this study, the spatial landscape changes that the area underwent as a result of extreme flood events have not been evaluated in detail. A rural area with a stable landscape structure, without any large-scale investment interventions or an agglomeration effect, was chosen as the pi-lot territory for our study. The major anthropogenic change in the landscape of the selected area was the construction of a small hydro power plant. There is no evidence of any natural forces such as earthquakes; the area is subject only to wind and agricultural interventions. The study area forms part of a collective farm, and although the land has been used for agricultural purposes, it has not been intensively farmed. The area was found to be suitable for further study as it is an isolated plot on which we could concentrate on the main focus of our research, the investigation of the impact of the construction of a small hydroelectric power plant and flood activities. The only significant changes that have occurred in the landscape appeared after the extreme flood events, and considerable attention will be paid to this factor in the following parts of the study. This paper aimed to provide an overview of these transformations through a comparison of several different time periods and using selected evaluation parameters.
The study applied a combination of GIS tools and statistical methods to assess the dynamics of a flood-prone region based on several scenarios: meteorological data, the dynamics of change in selected types of land cover classes, and the frequency of the representation of individual NDVI values in a selected area. The study discusses suitable strategies for identifying these factors using a combination of different types of spatial data layers.
While previous approaches have applied individual data sources in their analyses, the approach presented here integrates data from multiple sources to provide a more comprehensive overview of landscape changes associated with flooding. Another innovative characteristic of the study is the newly developed methodology of monitoring the frequency and intensity of flood activities, which are expected to increase from year to year due to more intense climate changes.
2. Materials and Methods
2.1. Study Area and Vulnerability to Flood Events
Monitoring changes in the structure of landscape dynamics due to floods is a complex process. The area exposed to repeated large-scale flood events that was chosen for investigation in this study is lined with small, fragmented fields with boundaries. The area also features an anthropogenic element, more specifically a small hydroelectric power plant (SHP). For a more detailed description of the characteristics of the chosen area, it is necessary to define and assess the features and structure of the river basin/micro-basin and its surrounding landscape from several perspectives.
The chosen area is formed from the Hornád basin and a sub-basin of Branisko stream at its confluence with the Žehrica stream in the central part of Eastern Slovakia (Figure 1). In terms of geomorphological division [31], the territory is part of the Alpine–Himalayan system, the Carpathian subsystem, the Western Carpathian province, the Inner Western Carpathian subprovince, the Fatranskotatrans region, the Hornádska Kotlina unit, the Hornádske Podolie subunit, and part of the Vlašská Kotlina. The area borders the Levočská Vrchovina and the Podtatranská Kotlina to the north, Branisko and Čierna Hora to the east, the Volovské Vrchy and the Spišsko-Gemerský Karst to the south, and the Low Tatras and the Goat Back Mountains to the west. The altitude of the area ranges from approximately 395 to 402 m above sea level and lies in a warm climate area (M), with an average of less than 50 summer days per year with a daily maximum air temperature ≥ 25 °C, to district M2, a moderately warm, moderately humid valley/basin type of climate with cold winters (January less than −5 °C, July more than 16 °C, Iz = 0 to 60).
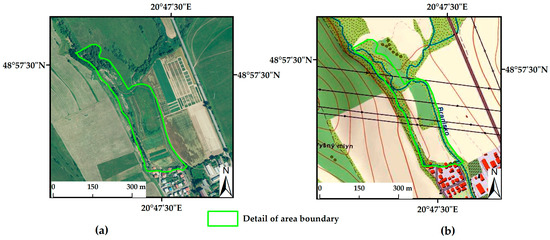
Figure 1.
Location of the studied area: (a) range of detail part on the basis of the orthophoto map; (b) two-dimensional topographic representation of the range of the detailed area.
In order to examine the spatial changes in the dynamics of the landscape in sufficient detail, a 5 km × 5 km area was chosen for the case study, more specifically an area located in the northern part of the cadastral territory of Spišské Vlachy. The study area largely covers the territory mapped out in several map sheets (37-21-07; 37-21-08; 37-21-12; 37-21-13) of the 1:10,000 scale map series (WMS services freely available at: https://zbgisws.skgeodesy.sk/klady_mapovych_listov_wms/service.svc/get, accessed on 20 January 2023). The basic characteristics of the study area in terms of the SK-NUTS (Nomenclature of Statistical Territorial Units) regional statistical territorial units are outlined in Table 1.

Table 1.
Territorial classification according to the territorial systemization of the Slovak Republic as processed at the level NUTS 1-NUTS 3 and LAU 1-LAU 2.
The average monthly flow rate of the area in the years 2010 and 2014 is presented in Figure 2. The flow rate was measured at the water gauging station Spišské Vlachy (ID:8460, Name of station: Spišké Vlachy, Stream: Branisko, coordinates: x: −295351.00; y: −1212356.51).
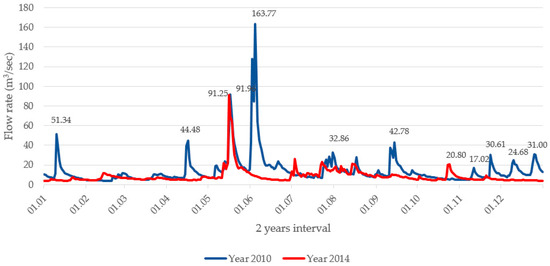
Figure 2.
Average monthly flow rate (m3/s) in 2010 and 2014.
On 20 July 1998, the Žehrica SHP and the Spiš region as a whole were exposed to an extreme flood event, which resulted in extensive damage and claimed several lives. Historically, the event was the first recorded serious flood in the area and has not been exceeded in severity to date. Meteorological data from the day of the flood shows that the Žehrica stream peaked at 21:00 with a flow rate of 60 m3/s (Slovak Hydrometeorological Institute (SHI)). Another major flood occurred in June 2010, when several areas of Slovakia were inundated after extraordinarily heavy and prolonged rainfall. On this occasion, the Žehrica stream in Spišské Vlachy peaked at 11:30 am on 4 June 2010 with a flow rate of 27.5 m3/s (SHI). As a result of water saturation, the slope above the SHP collapsed, filling the bed of the stream, and floodwater inundated the adjacent meadows. The most-recent flood in the area occurred in May 2014 and was comparable in scale to the flood of 2010. More data regarding historical flood events in the area is shown Figure 3. The information is presented through a visual interpretation of aerial images: the range of flood levels for Q100 (presented by red-colored line), Q50 (presented by yellow-colored line), the river system represents Branisko stream (presented by blue-colored line). This figure shows the situation in the area in more detail.
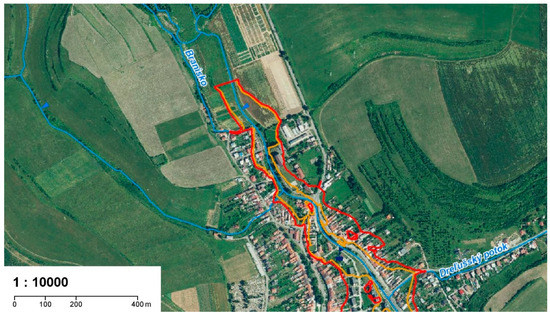
Figure 3.
Geolocation of the studied area: flood levels for Q100 (red-colored line); Q50 (yellow-colored line); the river system represents Branisko stream (blue-colored line). Source: Slovak Hydrometeorological Institute.
As was mentioned in the Introduction, the area in question can be characterized as a stable territory; the orthophoto maps in Figure 4a–c corroborate the absence of any known historical references to the effects on the changes in the landscape (either anthropological or caused by other natural forces).
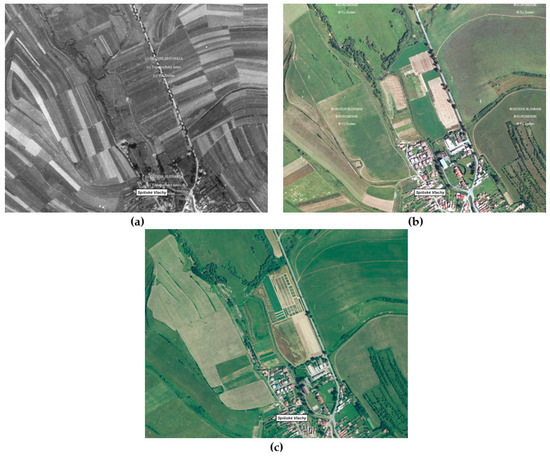
Figure 4.
Historical development of the study area: (a) detail of the area from the year 1950; (b) detail of the area from the year 2010; (c) detail of the area in the period 2017–2019. Source: https://mapy.tuzvo.sk/hofm/default1.aspx (accessed on 13 December 2023).
2.2. Data Collection and Processing
In this study, an extensive dataset was collected, which allowed a comprehensive evaluation of the temporal and spatial dynamic changes undergone in a selected area part of the landscape with small fragmented fields with boundaries and the influence of an anthropogenic feature (SHP) as a result of flood events. In this section, the impact of floods on the surrounding landscape will be assessed by focusing on the agricultural landscape in the form of a landscape flood impact assessment. The processing stage applied many datasets, data analyses, classification, and processing techniques of the datasets in order to corroborate and confirm the findings. The datasets were processed in open-source databases, libraries, and software GIS tools and using statistical data processing and visualization software (QGIS, ArcGIS Desktop, HEC-RAS, Jupyter Notebooks, MS Excel, Digital Innovation Hub).
The methodological workflow was applied to the processing of selected data layers (DMR 3.5, Orthophotography, Data from RS, CLC, LPIS, meteorological datasets and indexes, boundaries of the selected area, meteorological data) from several sources (open data, satellite data, INSPIRE Dataset, other registries and geodatabases, EO browser datasets, and datasets from Earth Explorer USGS, the Copernicus Program, and European Climate Assessment & Dataset).
Within the meteorological datasets, several groups of indices were monitored.
Several indices (https://www.ecad.eu/indicesextremes/, accessed on 17 July 2022) were used to analyze changes in year-on-year trends in the precipitation variable:
- R10MM (heavy precipitation days)—RRij is the daily precipitation amount for day i of period j (calendar year). Then, the index value is calculated as
- R20MM (very heavy precipitation days)—RRij is the daily precipitation amount for day i of period j (calendar year). Then, the index value is calculated as:
- PRCPTOT (total precipitation in mm)—RRwj is the daily precipitation amount on a wet day (precipitation amount ≥ 1.0 mm) of period j (calendar year). Then, the index value is calculated as:
- RX5DAY (highest 5-day precipitation amount in mm)—RRkj is the precipitation amount for the 5-day interval k of period j (calendar year). Then, the index value is calculated as:
LPIS data layers (range land in agricultural areas) and NDVI data layers for detecting changes were used in CLC to calculate the area [32] covered by the presented data layers and raster histograms.
Using procedures described in the relevant literature [33,34,35,36], several data inputs were selected as primary sources, which defined the area under analysis. An overview of this approach including a summary of the core files used in this study, the stated data types, the temporal coverage, the data source, and the data format is shown in Table 2.
Table 2.
List of used datasets.
2.3. Integrated Methodological Framework for Flood Event Impact Evaluation on Selected Indicators of Landscape Changes
The methodology of this study is based on a spatial evaluation framework, which analyzes the local impact of flood events using selected indicators (Figure 5). In order to achieve the main goal of this study, a group of evaluated indicators was selected, which were subjected to analysis using the selected methodology. A series of six indicators were chosen for the study (meteorological data, topography/morphometry, Corine Land Cover, flood simulation, Normalized Vegetation Index, and land parcel identification system).
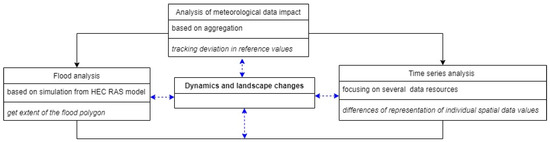
Figure 5.
Methodological flow chart.
The methodological framework adopted in the current study is illustrated in Figure 3. The selected indicators were examined using geospatial analysis in the ESRI ArcMap environment [37] on several levels:
- Flood event simulations;
- Historical evaluation of land use and other identified land cover patterns;
- Landscape temporal and spatial/spectral indexes.
The methodology focuses on identifying the dynamics of changes in all types of data in comparison to previous periods. For this purpose, the monitored groups of parameters were divided into two basic levels: definite groups of variables and numbered groups of variables. A combined form of evaluation was also applied to ensure diversity in the presentation of individual groups of the evaluated parameters including statistical, geoprocessing, and modelling approaches.
Several indicators were chosen to identify the extent of spatial changes in the area. The statistical analysis of the meteorological data, digitization, and the spatial analysis of CLC changes was based on vector and raster data processing and temporal and spatial/spectral indexes. In addition, hydrodynamic flood event modelling was applied in the subsequent processing. The analytical approach for obtaining the results was carried out on several levels [26].
2.4. In Situ Survey of Dynamic Changes in Landscape and Procedure
A field survey of landscape changes was performed in a pilot area of 5.0 km × 5.0 km. Several indicators for assessing the local impact of flood events on landscape changes were selected based on the integrated methodological framework (see Figure 5).
Some anthropogenic changes were observed in the urban and rural area of the town Spišské Vlachy between 1998 to 2022, the most important of which was the construction of the Žehrica small hydroelectric power plant in the northern part of the town on the course of Branisko stream (Figure 6). The hydropower plant has been in operation since 2010 and consists of two separate facilities: SHP Žehrica, which was built in the early 1990s (Figure 6a), and SHP Žehrica II, which was constructed after 2006 (Figure 6b).
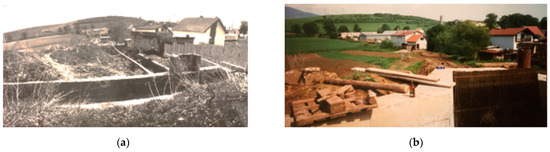
Figure 6.
Process of the construction of SHP Žehrica and SHP Žehrica II. Source: Lukas Olejnik, accessed date: May 2019. (a) In the foreground the original entrance building, in the middle the remains of the mill, in the background the SHP building; (b) New entrance building of SHP Žehrica II., in the background the building of SHP Žehrica.
The extent of spatial changes in the area was determined using statistical processing, digitization, a spatial analysis of CLC changes based on a combination of vector and raster data processing, and the hydrodynamic modeling of flood events. The analytical procedure for obtaining the results was performed in several steps, which are outlined in the following section [26].
2.5. Modelling of the Study Area
2.5.1. Digital Relief Model Definition
The digital relief model (DRM) is one of a series of digital products provided by the Institute of Geodesy and Cartography of the Bratislava (GCCA SR) for the entire territory of Slovakia (https://www.geoportal.sk/sk/zbgis/udaje-zbgis/, accessed on 17 July 2022), and the projects form part of the basic reference database for the ZBGIS® geographic information system. DMR3.5 was processed to create contours for the cartographic representation of elevation under ZBGIS data. At the same time, a digital representation of terrain relief, comprised of data and an interpolation algorithm (without closer specification), allowed altitudes to be derived at arbitrary terrain points [11]. DMR3.5 is based on the original DMR3 model and employs the 3D topography of the ZBGIS geodatabase supplemented by recalculated areas of flat sections of the lowlands, basins, and valleys of large rivers. The photogrammetric method was used as the input data source, and the output format is an ESRI GRID with practical parameters of 10 m × 10 m in resolutions of 10 m per pixel, 25 m per pixel, 50 m per pixel, and 100 m per pixel [38]. Accurate digital relief models are the most-important step for modelling flood scenarios [39,40]. Altitude usually has an inverse effect on floods, with the susceptibility of an area to flood events increasing with decreasing altitudes [41,42]. It should be noted that a new and improved version of DMR, DMR5.0, was released in 2017, which offers a new digital relief model of the entire territory of the Slovak Republic created from aerial laser scanning data (ALS). DMR 5.0 was created by interpolation from a classified point cloud and produces a processing output of raster grids in ASC, ESRI GRID, or TIFF format at a resolution of 1 × 1 m in the coordinate and height systems: S-JTSK(JTSK03)+HBpv; ETRS89-TM34+hETRS89 (https://www.geoportal.sk/sk/zbgis/udaje-zbgis/, accessed on 17 July 2022). However, the area under investigation in this study is not currently available in DMR5.0 (https://www.geoportal.sk/sk/zbgis/lls-dmr/, accessed on 17 July 2022), and therefore, the older version, DMR3.5, was used for the study. The study area is expected to be included in DMR 5.0 by the end of 2022.
2.5.2. Corine Land Cover
The Corine Land Cover (CLC) database is an important resource for monitoring flood-related landscape changes. In our study, a multipurpose approach to using the CLC dataset was used in line with the methodology described by Antzoulatos et al. [43], a classification system of land cover data and an estimate of the roughness coefficients for hydrodynamic modeling. The spatial dataset is available in several interchange formats (vector format—ESRI Geodatabase, raster format—100 m GeoTiff, available at: https://land.copernicus.eu/pan-european/corine-land-cover, accessed on 17 July 2022) for the European region. According to a study by Falt’an et al. [44], the CLC project is one of the most-important sources of real LC/LU data to monitor all changes in the landscape structure. CLC datasets used in the study were taken from the European Copernicus program. The Copernicus Landscape Monitoring Service offers several databases, such as the Corine Land Cover dataset, which are of considerable value in monitoring changes in the landscape caused by flood events [45,46].
The CLC database classifies the territory of Slovakia into 44 classes, eight of which are represented in the selected area of study. The land cover of the area was classified into eight primary classes (discontinuous urban fabric, mineral extraction sites, non-irrigated arable land, pastures, land principally occupied by agriculture, with significant areas of natural vegetation, coniferous forest, mixed forest, and natural grasslands). Figure 7 presents the individual land cover classes in the study area. Class 131 (mineral extraction sites (131)) is not included in Figure 7 due to its insignificant area.
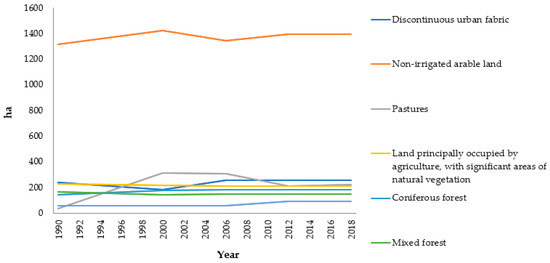
Figure 7.
Overview of changes in the individual CLC classes represented in the studied area expressed in ha for each year.
2.5.3. Hydrodynamic Model and Flooding Events Simulation
The 2D/3D processing of the selected datasets formed the basis for the hydrodynamic modelling of the studied area. Several different models are available for hydrodynamic modeling [47,48,49], but this study investigated flooding using the HEC-RAS model. This model was chosen due to its suitability for the purposes of the study, as its inputs allow the time course of flows and the spatial character of individual parameters of the riverbed geometry to be captured.
The model solves complete 2D shallow water equations on unstructured triangular networks. The simulation of flood scenarios was carried out based on geodetic measurements, which played the role of the spatial (2D/3D) documentation of the main channel and the surrounding topography data [11]. A more detailed description of the specific parameter settings for the implemented hydrodynamic modelling under the specific conditions of the study is provided in the following section.
In terms of water management characteristics, the studied area is located in the Hornád river basin at river kilometers 1.00 to 4.00 of Branisko stream, in the northern part of the built area of the village of Spišské Vlachy in the district of Spišská Nová Ves. The selected study area covers an area of 1.73 km2, and the boundaries are formed by the confluence of Branisko and Žehrica streams in the village of Žehra and the center of Spišské Vlachy. Hydrodynamic modelling was set according to a previously described methodology [11], and HEC-RAS (Version HEC-RAS 6.0.0) was used to construct the hydrodynamic model. The model consisted of a set of spatial data that thematically presented vector topographic data of the watercourse, berms, and zones behind the riverbank line, raster data presented in DMR3.5/DTM, and the hydrological conditions of the area [41].
The raw DTM with a horizontal and vertical accuracy of 0.6 m was refined using the results of geodetic measurements. The chosen approach in the form of 2D modelling produced reliable results. The flexible computing network was represented by the limits of possible flooding approximately 5 m above the terrain along the section of the stream. The spatial resolution of the base cell was set at 4 m × 4 m. The breaklines inserted into the model were combined with the original breaklines and the newly created lines after the data integration into the DTM. The spatial resolution around these breaklines was set at 2 m. The 2D model consisted of a series of transverse profiles of the main riverbed and the inundation area. The representation of individual categories of objects was grouped into sub-units, and a total of nine types of objects were represented in the area in the study: grasslands and meadows, arable land, sparse forest, residential gardens, buildings, the surroundings of buildings, watercourses, roads, and playgrounds. Roughness values (based on Manning’s roughness coefficients) were determined according to valid roughness coefficients based on previously described methodologies [50,51] for the series of generalized features.
The following values of Manning’s roughness coefficient were determined for each of the sub-units: grasslands and meadows (n = 0.035), arable land (n = 0.04), sparse forest (n = 0.143), gardens behind houses (n = 0.05), surroundings of buildings (n = 0.5), buildings (n = 0.034), watercourses (n = 0.04), roads (n = 0.03), playground (n = 0.034). According to the methodology described by Gergel’ová et al. [11], constant roughness values for the watercourse bed were set at n = 0.04, and the values for the berm and the zone behind the watercourse were set at n = 0.05.
All hydrological data were provided by SHI. N-year flow level values were included in the group of measured data, and the accuracy and quality are guaranteed by SHI for the whole territory of Slovakia. The flow value used to model the flood situation was set as m3/s. Boundary conditions were also important in the flood event simulation in order to stabilize the calculation, and therefore, the boundary conditions value was set with a constant setting over time (normal depth 4.10-4).
The deviation in the calculation of the model, i.e., the sensitivity of the hydrodynamic model, was set at 0.003 m. Therefore, the total volume that forms the difference in the result was 5.071 m3, representing 0.001%. The results confirmed that the application of the flood risk evaluation approach based on the HEC-RAS models provides a more realistic view of possible flood hazards [52], including a change in the land cover structure.
3. Results and Discussion
3.1. Meteorological Data Evaluation and Flood Evaluation
Meteorological data were collected from 2000 to 2021 from the European Climate Assessment & Dataset (ECA & D) project [53] (http://www.ecad.eu, accessed on 17 July 2022). This source provided comprehensive data for the study consisting of daily measurements from meteorological stations across the European Union. Slovakia contributes to the project through meteorological stations in Banská Bystrica, Bratislava, Hurbanovo, Košice, Trebišov, Oravská Lesná, Poprad, and Štrba. The nearest meteorological station to the study area is located in Košice and provided daily values from several variables for the study. In addition, datasets for the following group of variables were applied for further analyses:
- Cloud cover (okta);
- Wind speed (m/s);
- Humidity (%);
- Global radiation (W/m2);
- Precipitation (mm);
- Snow depth (cm);
- Sunshine (hours);
- Temperature (°C), including daily mean, max, and min temperatures.
Daily hydro-meteorological measurements were aggregated into monthly averages that covered the following variables: cloud cover, wind speed, humidity, sea level pressure, global radiation, snow depth, sunshine, and mean temperature. The precipitation variable was given as a monthly sum of daily precipitation. Extreme conditions for a given month were considered using the maximum and minimum temperature variables. Years with significant flood activity (2010 and 2014) were compared with average values for the period of 2000–2009 when no flood activity was recorded.
The results of the analysis shown in Figure 8 revealed that, in April, May, and June 2010, a significantly higher level of precipitation was recorded in comparison to the reference value for the given period (a rolling average for ten years). In addition, meteorological data confirmed that, in February 2010, the average daily snow depth was almost three-times higher than the reference value, an additional factor that may have contributed to the water saturation of the soil (Figure 8d).
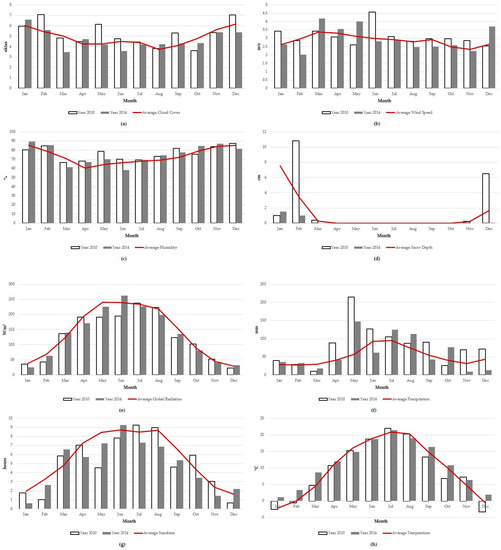
Figure 8.
Monitored meteorological parameters for the years 2010 and 2014: (a) cloud cover (oktas); (b) wind speed (m/s); (c) humidity (%); (d) snow depth (cm); (e) global radiation (W/m2); (f) monthly precipitation (mm); (g) average daily sunshine (hours); (h) mean temperature (°C). Source: http://www.ecad.eu (accessed on 17 July 2022).
The second examined period was the year 2014. In this year, a significant deviation in the level of precipitation (Figure 8f) was recorded in May and June, but it was still minor in comparison to the levels recorded in 2010. This assumption was also confirmed by the study results [21,22]. No significant deviations from the reference value were recorded in the other variables. No significant deviations from the time series were recorded for other variables including cloud cover (oktas), wind speed (m/s), humidity, global radiation, average daily sunshine (hours), and mean temperature (Figure 8a–c,e,g,h). The results of the year-on-year trend analysis are presented in Figure 9. The values confirmed the precipitation abnormality in 2010. The R10MM index, which examines the number of days per year with precipitation levels exceeding 10 mm (Figure 9a), showed a significantly above-average value (31 days). The R20MM (Figure 9b) index, which records precipitation levels exceeding 20 mm, confirmed anomalies in 2016, and the PRCPTOT (Figure 9d) index (an annual precipitation summary) showed abnormalities in 2010.
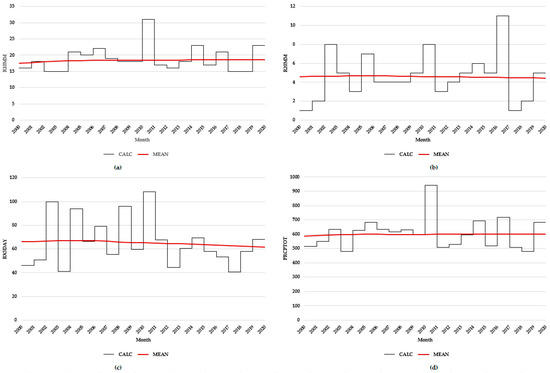
Figure 9.
Overview of monitored annual hydrometeorological indices within the monitored group of variables for the years 2010 and 2014: (a) R10MM; (b) R20MM; (c) RX5DAY; (d) PRCPTOT. Source: http://www.ecad.eu (accessed on 17 July 2022).
The RX5DAY index (Figure 9c) records the highest precipitation on five consecutive days a year and showed that the years 2002, 2004, 2006, 2008, and 2010 significantly exceeded the rolling average. These findings suggest that it is essential to examine other environmental impacts that may have occurred in recent years that could have potentially prevented flood activity.
As was discussed in Section 2.5.3, flood activity was simulated for the selected area of interest.
Figure 10 presents the results from the HEC RAS model of the confluence of Branisko and Žehrica streams and the built-up and rural areas of the village of Spišské Vlachy. The visualization presents the extent of the flood polygon on the level of several base maps (LPIS—Figure 10a; CLC 2018—Figure 10b; DTM—Figure 10c). The obtained results defined the extent of the inundation area with corresponding flow depths. The flooding polygon (shown with transparent light blue) was visualized based on three types of basic layers. Figure 10a shows the extent of the flooding polygon on LPIS types from the point of view of the types of representation of individual cultures (permanent grassland is presented in green, and the range of arable land is presented in red). Figure 10b shows the extent of the flood on the CLC base map, and Figure 10c presents the extent of flood activity on a relief base map.
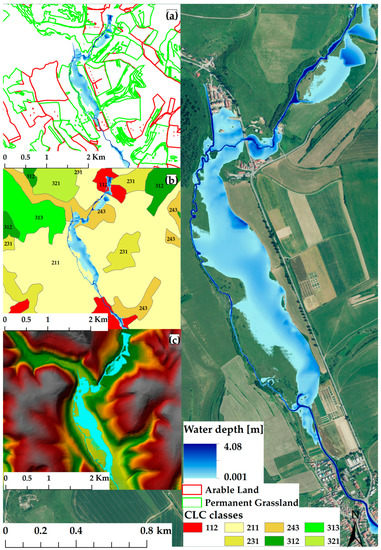
Figure 10.
Visualization of flood risk evaluation results: (a) range of the flood polygon on the base map of LPIS 2018; (b) range of the flood polygon on the base map of CLC 2018; (c) flood simulation using the Ras Mapper interface on the base map of DTM.
Interestingly, the flood simulation shows that the parts of the studied area that are most likely to be affected by flooding are precisely those that had previously been pastureland according to the results of the CLC data.
3.2. Analysis of Time Series Changes in the Landscape Structure
The time series changes in the landscape structure and its qualitative changes were analyzed in order to compare the resulting data from different sources (CLC, datasets from RS, datasets from LPIS). The CLC land cover database was used to indicate and capture the dynamic changes in the selected area, and these findings were carried over into changes in land use in this area. The area was exposed to two specific events (extreme floods and anthropogenic activity in the construction and operation of SHP). Spatial CLC changes were analyzed over multiple time series/periods. In the first processing step, attention was paid to determining the percentage representation of individual classes and determining the percentage change over the course of the period for the total area of the five national CLC projects represented in Slovakia (Figure 11). The results of these projects provided land cover data files for this study for the years 1990, 2000, 2006, 2012, and 2018. The data files in this part of the study were obtained from several sources (Copernicus, USGS). Due to the limited data availability, alternative data of the year 1998 were chosen for the given area; this year was significant in terms of the historical development and change to the landscape structure of the studied area as it included the commencement of the construction of the SHP. Data sources from Landsat 4 were also used for this period.
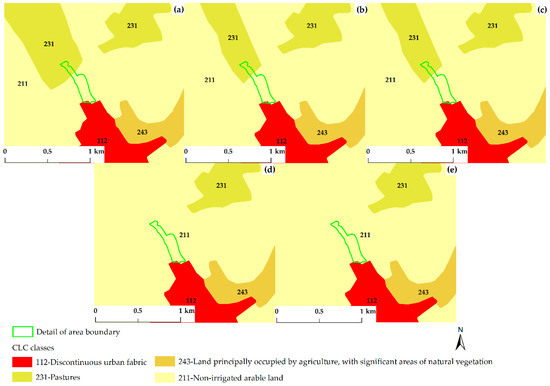
Figure 11.
CLC changes over the period: (a) 1990; (b) 2000; (c) 2006; (d) 2012; (e) 2018.
An integrated approach based on GIS analyses enabled changes in the representation of individual CLC classes to be monitored. The CLC study considered the years 1990, 2000, 2006, 2012, and 2018 and identified rising or falling trends before and after the extreme flood event and in relation to the anthropogenic element (SHP) (Figure 11).
The selection of periods was related to the timing of the mapping of land cover changes in the region of Slovakia and Europe, as the mapping began in the reference year 1990 and recurred at regular six-year cycles from the reference year 2000. The mineral extraction site class was excluded from further analyses as it represented an insignificant area in the selected area.
The above overview of spatial changes was prepared based using the three-level hierarchical classification system of CLC. Figure 11 shows the surrounding area of the watercourse where the most significant changes were recorded cross-sectionally. The Corine Land Cover classes and RGB color codes were taken from the recommendations of the European Environment Agency (https://www.eea.europa.eu/, accessed on 17 July 2022). While there is a dominant representation of pastures in the narrow area in the study in the reference years 1990 (Figure 11a), 2000 (Figure 11b), and 2006 (Figure 11c) (see the legend of Figure 11, the green color detail of the area boundary), there was no confirmed presence of pastures in this area in the years 2012 (Figure 11d) and 2018 (Figure 11e). An assessment of the state of pastures in the study area showed that this class has completely disappeared from the site near the watercourse.
After this processing, a statistical evaluation of the obtained results was performed. The total changes in the percentage of individual CLC classes, the percentage value over the whole area, and the percentage change compared to the previous period are presented in Table 3.
Table 3.
Total percentage changes in the individual CLC classes.
In terms of CLC spatial assessment, the most-significant changes that the area had undergone between 2006 and 2012 were in the pastures class (231), with a decrease of 31% or approximately 96.5 ha recorded since 2012. Changes of landscape structure over this period were also recorded in the classes of natural grasslands (321), with an increase of 64% or approximately 35.5 ha, and in non-irrigated arable land (131), with an increase of 4% or approximately 50.5 ha.
The results showed that the most-significant changes took place in the class of pastures, whose representation in the area near the confluence of Branisko and Žehrica has completely disappeared since 2012. This can be a result of the consequences of flood events, but it is also possible that the methodology for mapping changes in CLC could have affected the results [54,55,56] or the consequences of flood threats [57,58]. First, the results presented in Figure 11d,e confirmed the permanent loss of pastures, which may have become waterlogged and unsuitable for the given purpose of use due to flood activity.
The results confirmed only slight changes in CLC related to the generalization and the minimum mapping unit. The mapping of changes in land cover in the reference year 2018 was one of the most-time-consuming activities at the national level of Slovakia [54]. The CLC layer for the year 2018 was acquired by the spatial identification of the changes in 2012 and 2018 and was comprised of a generalized layer with the given parameters. The minimum mapping unit for identifying a change in CLC is 5 hectares [58], but in this case, the minimum size of the change of the specified area within the individual CLC classes was set at a minimum mapping unit of 25 hectares for the phenomena area and a minimum width of 100 m for the linear phenomena [36,38]. For the study area, this meant that sections with an area of less than 25 ha were not included in the map presentation. To verify the results of CLC for 2018, an approach based on the visualization of the datasets from the Copernicus program (https://www.copernicus.eu/sk, accessed on 17 July 2022) was applied to the local data of a specific area, in this case the Žehrica area boundary. The Copernicus Sentinel-2 data mosaic in the true color scale was a key source in this respect. The application of these data aimed to verify the land cover classification from the presented results with an emphasis on CLC in 2018 (Figure 12). The criteria of time range and cloud coverage were then chosen for further processing, and it was subsequently possible to view the resulting findings. In order to evaluate the CCL changes in the last monitored reference year of 2018, data from the dataset Sentinel-2 L2A—True color (time range: 2017-summer time, 2018-summer time; cloud coverage 2017: 24%; cloud coverage 2018: 3.8%) were selected.
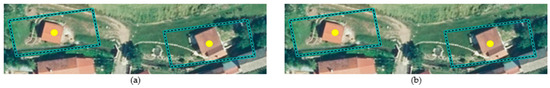
Figure 12.
Example of the verification process based on data from the dataset Sentinel-2 L2A—True color: (a) 2017 dataset on the orthophoto base map 2018; (b) 2018 dataset on the orthophoto base map 2018.
Additional analyses of the landscape changes based on remote sensing was performed. The spatial indexes derived from available data from the satellite images (Landsat 4, Sentinel-2 L2A) were used to analyze changes in the time series of the landscape (Figure 13). The NDVI quantifies vegetation by measuring the difference between the near-infrared (which vegetation strongly reflects) and red light (which vegetation absorbs). This index is often used for monitoring changes in landscape structure [28,29,30].
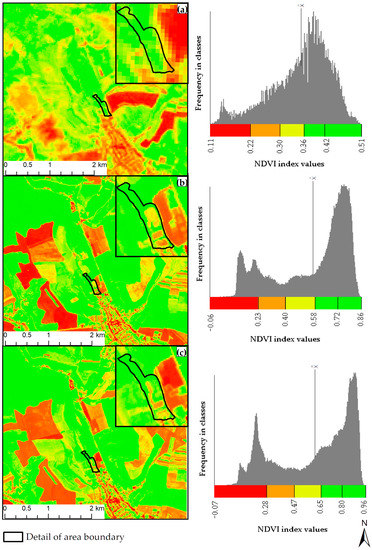
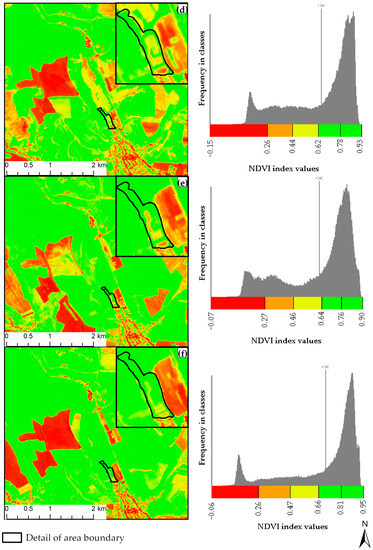
Figure 13.
NDVI index: (a) 1998; (b) 2016; (c) 2017; (d) 2018; (e) 2019; (f) 2020.
Data from 1998 to 2020 were analyzed for the purposes of the study. Although the SHP was built over the course of several years in two phases, 1998 was used as the year of its construction. However, Sentinel data are not available for this year, and therefore, data from Landsat 4 in the USGS Earth Explorer program were used instead in addition to satellite data from the Copernicus program for the years 2016, 2017, 2018, 2019, and 2020. As the bands for the visible red and near-infrared spectra are similar, the NDVI values were determined using the same algorithm with a selection of representative bands. The index was evaluated individually for 2016, 2017, 2018, 2019, and 2020. The NDVI is calculated as a relative number in the range between −1 and 1. Based on the obtained results, the following interval values of the NDVI were determined for individual years: 1998: 0.1–0.51; 2016: −0.6–0.86; 2017: −0.07–0.95; 2018: −0.15–0.98; 2020: −0.05–0.95. The classification of the NDVI values is particularly valuable when displayed in the form of histograms, and the histogram of the NDVI values shows a relatively even distribution of the color spectrum of the index in 1998 (Figure 11a), with the highest number of values detected closer to the center of the spectrum. In the subsequent examined years (Figure 13b–f), the distribution of the NDVI values was found to primarily shift from the center towards the green part of the color spectrum. It is important to note that the NDVI value distribution varied across the studied period. The shape of the NDVI distribution presents the diversity of vegetation and/or landscape changes. The homogeneity represented in the maps as a uniform color and NDVI values with a steep curve in one peak represent the presence of a uniform vegetation type. Time analyses of NDVI changes during the studied period showed a trend of diversity loss in the area.
This difference in the frequency of representation of individual NDVI values confirmed the loss of diversity of the studied area and the emergence of a more homogeneous landscape. The results also confirmed that the CLC and NDVI parameters are effective and important tools in analyzing the effect of floods on changes in the landscape [26].
In addition to the indexes derived from the satellite data, LPIS databases in the *.shp vector formats were also used in the study. In combination with the spatial representation of the LPIS, this approach also provided additional information on the representation of individual types of cultures on the given parcels. The study compared two time periods, 2018 and 2021 (Figure 14), and the comparison of unique reported soils also showed the dynamics of the changes in the types of individual cultures. The data from this dataset cover two land cover classes: Arable Land and Permanent Grassland. As the results presented in Figure 14 show, while the extent of Arable Land cover decreased over the studied period, the area of Permanent Grassland increased.
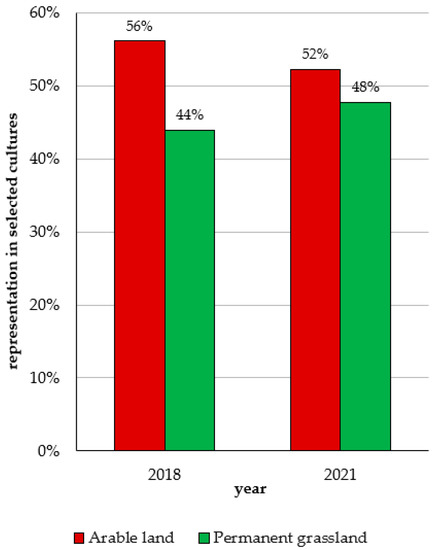
Figure 14.
Changes in LPIS dataset for selected area: (a) 2018; (b) 2021.
4. Conclusions
Landscapes in the vicinity of waterways are vulnerable land elements, which are often threatened by the occurrence of flood events, and the changes that they undergo need to be monitored over time. An effective approach that could help with this issue is the evaluation of the dynamics of changes in the landscape structure in their spatial representation by comparing several time periods and selected groups of parameters. This study focuses on the evaluation of changes in a selected landscape in Eastern Slovakia using four groups of data layers including meteorological data, the dynamics of changes in the representation of selected types of land cover classes, the frequency of representation of individual NDVI values in the study area, and a flood event simulation. The results were obtained through a combination of statistical methods and spatial analyses.
The results of the study confirmed that the landscape located near the confluence of Branisko and Žehrica streams is vulnerable to flood risks. The processing framework presented in the study aimed to determine the dynamics of change in a landscape threatened by flood events confirmed the importance of mapping changes in the landscape structure by examining changes in the area of representation of selected types of land cover classes. Another aspect of the study was the investigation of the NDVI parameters. The observed differences in the frequency of representation of individual NDVI values confirmed the loss of diversity in the area and the emergence of a more homogeneous landscape. The combination of the CLC and NDVI assessments seems to be an effective and essential tool for examining the impact of changes in the landscape. This study provides a basis for further study and more detailed research and also contributes to the creation of a timeline of the Standardized Precipitation Index for the given area.
The obtained results are an important reference for further development in the subject area. The results of the study support the development of projections that can serve as a basis for establishing a flood warning system for Slovakia (https://www.mojandroid.sk/slovensko-sms-varovanie/, accessed on 9 December 2023). The continuous evaluation of landscape changes (not only those resulting from floods) is an invaluable tool for ensuring a multifunctional and sustainable landscape. The presented results of the study introduce a tool that combines data from several sources in order to improve the current cooperation of several interested parties such as the Research Institute of Water Management, the Slovak Water Management Company, and the Ministry of the Environment in developing a unified database. In this context, we are of the opinion that these activities will not be successful without the availability of high-quality data and their effective processing.
Author Contributions
Conceptualization, M.B.G., L.K., H.F.A.-E., M.G. and R.H.; methodology, M.B.G., L.K., H.F.A.-E., A.C. and R.H.; software, M.B.G.; validation, M.B.G., R.H. and A.C.; formal analysis, M.B.G., L.K., H.F.A.-E. and M.G.; investigation, M.B.G.; resources M.B.G. and R.H.; data curation, M.B.G., A.C. and R.H.; writing—original draft preparation, L.K.; writing—review and editing, M.B.G., L.K., H.F.A.-E. and M.G.; visualization, M.B.G., L.K., A.C. and R.H.; supervision, M.B.G. All authors have read and agreed to the published version of the manuscript.
Funding
This research received no external funding.
Data Availability Statement
Not applicable.
Acknowledgments
This research was funded by the Agrihub CZ&SK sub-grant (No. 2282300354-EXPAND-6) of the SmartAgriHubs project (No. 818182) and by the Slovak Research and Development Agency under Contract No. APVV-20-0281 and KEGA Grant No. 055TUKE-4/2021.
Conflicts of Interest
The authors declare no conflict of interest.
References
- Miller, J.D.; Brewer, T. Refining flood estimation in urbanized catchments using landscape metrics. Landsc. Urban Plan. 2018, 175, 34–49. [Google Scholar] [CrossRef]
- Peng, Y.; Wang, Q.; Wang, H.; Lin, Y.; Song, J.; Cui, T.; Fan, M. Does landscape pattern influence the intensity of drought and flood? Ecol. Indic. 2019, 103, 173–181. [Google Scholar] [CrossRef]
- Devi, N.N.; Sridharan, B.; Kuiry, S.N. Impact of urban sprawl on future flooding in Chennai city, India. J. Hydrol. 2019, 574, 486–496. [Google Scholar] [CrossRef]
- Peterson, C.D.; Minor, R.; Peterson, G.L.; Gates, E.B. Pre-and post-Missoula flood geomorphology of the Pre-Holocene ancestral Columbia River Valley in the Portland forearc basin, Oregon and Washington, USA. Geomorphology 2011, 129, 276–293. [Google Scholar] [CrossRef]
- Hu, C.; Xia, J.; She, D.; Song, Z.; Zhang, Y.; Hong, S. A new urban hydrological model considering various land covers for flood simulation. J. Hydrol. 2021, 603, 126833. [Google Scholar] [CrossRef]
- Zhang, Y.; Sun, F.; Pan, M.; Niel, T.V.; Wegehenkel, M. Hydrological Processes in Changing Climate, Land Use, and Cover Change. Adv. Meteorol. 2016, 2016, 7273414. [Google Scholar] [CrossRef]
- Su, M.; Zheng, Y.; Hao, Y.; Chen, Q.; Chen, S.; Chen, Z.; Xie, H. The influence of landscape pattern on the risk of urban water-logging and flood disaster. Ecol. Indic. 2018, 92, 133–140. [Google Scholar] [CrossRef]
- Malíková, L. Zmena využitia zeme vo vybraných poľnohospodársky znevýhodnených oblastiach SR. In Student Scientific Conference PriF UK 2014; Comenius University Bratislava: Bratislava, Slovakia, 2014. [Google Scholar]
- Liu, Y.; Han, J.; Jiao, J.; Liu, B.; Ge, W.; Pan, Q.; Wang, F. Responses of flood peaks to land use and landscape patterns under extreme rainstorms in small catchments—A case study of the rainstorm of Typhoon Lekima in Shandong, China. Int. Soil Water Conserv. Res. 2022, 10, 228–239. [Google Scholar] [CrossRef]
- Fu, S.; Yang, Y.; Liu, B.; Liu, H.; Liu, J.; Liu, L.; Li, P. Peak flow rate response to vegetation and terraces under extreme rainstorms. Agric. Ecosyst. Environ. 2020, 288. [Google Scholar] [CrossRef]
- Gergeľová, M.B.; Kuzevičová, Ž.; Labant, S.; Gašinec, J.; Kuzevič, Š.; Unucka, J.; Liptai, P. Evaluation of Selected Sub-Elements of Spatial Data Quality on 3D Flood Event Modeling: Case Study of Prešov City, Slovakia. Appl. Sci. 2020, 10, 820. [Google Scholar] [CrossRef]
- Zeleňáková, M.; Fijko, R.; Labant, S.; Weiss, E.; Markovič, G.; Weiss, R. Flood risk modelling of the Slatvinec stream in Kružlov village, Slovakia. J. Clean. Prod. 2019, 212, 109–118. [Google Scholar] [CrossRef]
- Doorga, J.R.S.; Magerl, L.; Bunwaree, P.; Zhao, J.; Watkins, S.; Staub, C.G.; Rughooputh, S.D.D.V.; Cunden, T.S.M.; Lollchund, R.; Boojhawon, R. GIS-based multi-criteria modelling of flood risk susceptibility in Port Louis, Mauritius: Towards resilient flood management. Int. J. Disaster Risk Reduct. 2022, 67, 102683. [Google Scholar] [CrossRef]
- Kseňak, Ľ.; Pukanská, K.; Bartoš, K.; Blišťan, P. Assessment of the Usability of SAR and Optical Satellite Data for Monitoring Spatio-Temporal Changes in Surface Water: Bodrog River Case Study. Water 2022, 14, 299. [Google Scholar] [CrossRef]
- Farhadi, H.; Esmaeily, A.; Najafzadeh, M. Flood monitoring by integration of Remote Sensing technique and Multi-Criteria Decision Making method. Comput. Geosci. 2022, 160, 105045. [Google Scholar] [CrossRef]
- Li, J.; Bortolot, Z.J. Quantifying the impacts of land cover change on catchment-scale urban flooding by classifying aerial images. J. Clean. Prod. 2022, 344, 130992. [Google Scholar] [CrossRef]
- Li, J.; Zhou, K.; Xie, B.; Xiao, J. Impact of landscape pattern change on water-related ecosystem services: Comprehensive analysis based on heterogeneity perspective. Ecol. Indic. 2021, 133, 108372. [Google Scholar] [CrossRef]
- Macchione, F.; Costabile, P.; Costanzo, C.; Lorenzo, G.D. Extracting quantitative data from non-conventional information for the hydraulic reconstruction of past urban flood events. A case study. J. Hydrol. 2019, 576, 443–465. [Google Scholar] [CrossRef]
- Kovanič, Ľ.; Blistan, P.; Urban, R.; Štroner, M.; Blišťanová, M.; Bartoš, K.; Pukanská, K. Analysis of the Suitability of High-Resolution DEM Obtained Using ALS and UAS (SfM) for the Identification of Changes and Monitoring the Development of Selected Geohazards in the Alpine Environment—A Case Study in High Tatras, Slovakia. Remote Sens. 2020, 12, 3901. [Google Scholar] [CrossRef]
- Gogoi, P.P.; Vinoj, V.; Phukon, P. Role of Meteorology and Local Orography on a Flood Event in the Lower Subansiri Basin and Post-Flood Changes to Land Use and Land Cover. Curr. Sci. 2020, 118. [Google Scholar] [CrossRef]
- Březková, L.; Šálek, M.; Soukalová, E.; Starý, M. Predictability of flood events in view of current meteorology and hydrology in the conditions of the Czech Republic. Soil Water Res. 2008, 2, 156–168. [Google Scholar] [CrossRef]
- Chai, S.S.; Wong, W.K.; Goh, K.L. Rainfall Classification for Flood Prediction Using Meteorology Data of Kuching, Sarawak, Malaysia: Backpropagation vs Radial Basis Function Neural Network. Int. J. Environ. Sci. Dev. 2017, 8, 385–388. [Google Scholar] [CrossRef]
- Kociuba, W. Different Paths for Developing Terrestrial LiDAR Data for Comparative Analyses of Topographic Surface Changes. Appl. Sci. 2020, 10, 7409. [Google Scholar] [CrossRef]
- Cieślak, I.; Biłozor, A.; Szuniewicz, K. The Use of the CORINE Land Cover (CLC) Database for Analyzing Urban Sprawl. Remote Sens. 2020, 12, 282. [Google Scholar] [CrossRef]
- Marčiš, M.; Fraštia, M.; Augustín, T. Measurement of Flat Slab Deformations by the Multi-Image Photogrammetry Method. Slovak J. Civ. Eng. 2017, 25, 19–25. [Google Scholar] [CrossRef]
- Cieślak, I.; Biłozor, A.; Źróbek-Sokolnik, A.; Zagroba, M. The Use of Geographic Databases for Analyzing Changes in Land Cover—A Case Study of the Region of Warmia and Mazury in Poland. ISPRS Int. J. Geo-Inf. 2020, 9, 358. [Google Scholar] [CrossRef]
- Ceppi, A.; Gambini, E.; Lombardi, G.; Ravazzani, G.; Mancini, M. SOL40: Forty Years of Simulations under Climate and Land Use Change. Water 2022, 14, 837. [Google Scholar] [CrossRef]
- Novillo, C.; Arrogante-Funes, P.; Romero-Calcerrada, R. Recent NDVI Trends in Mainland Spain: Land-Cover and Phytoclimatic-Type Implications. ISPRS Int. J. Geo-Inf. 2019, 8, 43. [Google Scholar] [CrossRef]
- Szabó, L.; Deák, B.; Bíró, T.; Dyke, G.J.; Szabó, S. NDVI as a Proxy for Estimating Sedimentation and Vegetation Spread in Artificial Lakes—Monitoring of Spatial and Temporal Changes by Using Satellite Images Overarching Three Decades. Remote Sens. 2020, 12, 1468. [Google Scholar] [CrossRef]
- Gozdowski, D.; Žukovskis, J.; Razinkovas-Baziukas, A.; Wójcik-Gront, E. Land Cover Changes in Selected Areas Next to Lagoons Located on the Southern Coast of the Baltic Sea, 1984–2021. Sustainability 2022, 14, 2006. [Google Scholar] [CrossRef]
- Miklós, L. Atlas Krajiny Slovenskej Republiky, 1st ed.; Ministerstvo životného prostredia SR: Bratislava, Slovakia, 2002. [Google Scholar]
- Jha, M.K. Impacts of Landscape Changes on Water Resources. Water 2020, 12, 2244. [Google Scholar] [CrossRef]
- Rendenieks, Z.; Tērauds, A.; Nikodemus, O.; Brūmelis, G. Comparison of input data with different spatial resolution in landscape pattern analysis—A case study from northern Latvia. Appl. Geogr. 2017, 83, 100–106. [Google Scholar] [CrossRef]
- Zhao, C.; Sander, H.A. Assessing the sensitivity of urban ecosystem service maps to input spatial data resolution and method choice. Landsc. Urban Plan. 2018, 175, 11–22. [Google Scholar] [CrossRef]
- Ding, Y.; Yang, X.; Wang, Z.; Fu, D.; Li, H.; Meng, D.; Zeng, X.; Zhang, J. A Field-Data-Aided Comparison of Three 10 m Land Cover Products in Southeast Asia. Remote Sens. 2022, 14, 5053. [Google Scholar] [CrossRef]
- Schmid, M.; Heinimann, A.; Zaehringer, J.G. Patterns of land system change in a Southeast Asian biodiversity hotspot. Appl. Geogr. 2021, 126, 102380. [Google Scholar] [CrossRef]
- Feloni, E.; Mousadis, I.; Baltas, E. Flood vulnerability assessment using a GIS-based multi-criteria approach—The case of Attica region. J. Flood Risk Manag. 2020, 13, e12563. [Google Scholar] [CrossRef]
- Chudý, R.; Iring, M.; Feciskanin, R. Evaluation of the Data Quality of Digital Elevation Models in the Context of Inspire / Hodnotenie Kvality Digitálnych Výškových Modelov V Kontexte Inspire. GeoScience Eng. 2013, 59, 9–24. [Google Scholar] [CrossRef]
- Podhorányi, M.; Unucka, J.; Bobál, P.; Říhová, V. Effects of LIDAR DEM resolution in hydrodynamic modelling: Model sensitivity for cross-sections. Int. J. Digit. Earth 2013, 6, 3–27. [Google Scholar] [CrossRef]
- Saleem, N.; Huq, M.E.; Twumasi, N.Y.D.; Javed, A.; Sajjad, A. Parameters Derived from and/or Used with Digital Elevation Models (DEMs) for Landslide Susceptibility Mapping and Landslide Risk Assessment: A Review. ISPRS Int. J. Geo-Inf. 2019, 8, 545. [Google Scholar] [CrossRef]
- Vojtek, M.; Vojteková, J. Flood Susceptibility Mapping on a National Scale in Slovakia Using the Analytical Hierarchy Process. Water 2019, 11, 364. [Google Scholar] [CrossRef]
- Choubin, B.; Moradi, E.; Golshan, M.; Adamowski, J.; Sajedi-Hosseini, F.; Mosavi, A. An ensemble prediction of flood susceptibility using multivariate discriminant analysis, classification and regression trees, and support vector machines. Sci. Total Environ. 2019, 651, 2087–2096. [Google Scholar] [CrossRef]
- Antzoulatos, G.; Kouloglou, I.-O.; Bakratsas, M.; Moumtzidou, A.; Gialampoukidis, I.; Karakostas, A.; Lombardo, F.; Fiorin, R.; Norbiato, D.; Ferri, M.; et al. Flood Hazard and Risk Mapping by Applying an Explainable Machine Learning Framework Using Satellite Imagery and GIS Data. Sustainability 2022, 14, 3251. [Google Scholar] [CrossRef]
- Falťan, V.; Petrovič, F.; Oťaheľ, J.; Feranec, J.; Druga, M.; Hruška, M.; Nováček, J.; Solár, V.; Mechurová, V. Comparison of CORINE Land Cover Data with National Statistics and the Possibility to Record This Data on a Local Scale—Case Studies from Slovakia. Remote Sens. 2020, 12, 2484. [Google Scholar] [CrossRef]
- Büttner, G. CORINE Land Cover and Land Cover Change Products; Springer: Dordrecht, The Netherlands, 2014; pp. 55–74. [Google Scholar]
- Verde, N.; Kokkoris, I.P.; Georgiadis, C.; Kaimaris, D.; Dimopoulos, P.; Mitsopoulos, I.; Mallinis, G. National Scale Land Cover Classification for Ecosystem Services Mapping and Assessment, Using Multitemporal Copernicus EO Data and Google Earth Engine. Remote Sens. 2020, 12, 3303. [Google Scholar] [CrossRef]
- Bates, P.D.; Roo, A.P.J.D. A simple raster-based model for flood inundation simulation. J. Hydrol. 2000, 236, 54–77. [Google Scholar] [CrossRef]
- Fárek, V.; Unucka, J.; Ponížilová, I.; Gergel’ová, M.; Židek, D.; Pallós, R. Assessment of the runoff conditions of small ungauged catchments using GIS and fully distributed hydrologic models. Acta Montan. Slovaca 2014, 19, 22–30. [Google Scholar]
- Gergel’ová, M.; Kuzevičová, Ž.; Kuzevič, Š.; Sabolová, J. Hydrodynamic modeling and GIS tools applied in urban areas. Acta Montan. Slovaca 2013, 18, 226–233. [Google Scholar]
- Chow, V.T. Open-Channel Hydraulics; McGraw-Hill: New York, NY, USA, 1959. [Google Scholar]
- Raplík, M.; Výbora, P.; Mareš, K. Úprava Tokov (Adjustments Flows); Alfa, Vydavateľstvo Technickej a Ekonomickej Literatúry: Bratislava, Slovakia, 1989. [Google Scholar]
- 52Huţanu, E.; Mihu-Pintilie, A.; Urzica, A.; Paveluc, L.E.; Stoleriu, C.C.; Grozavu, A. Using 1D HEC-RAS Modeling and LiDAR Data to Improve Flood Hazard Maps Accuracy: A Case Study from Jijia Floodplain (NE Romania). Water 2020, 12, 1624. [Google Scholar] [CrossRef]
- 53Tank, A.M.G.K.; Wijngaard, J.B.; Können, G.P.; Böhm, R.; Demarée, G.; Gocheva, A.; Mileta, M.; Pashiardis, S.; Hejkrlik, L.; Kern-Hansen, C.; et al. Daily dataset of 20th-century surface air temperature and precipitation series for the European Climate Assessment. Int. J. Climatol. 2002, 22, 1441–1453. [Google Scholar] [CrossRef]
- Kubinský, D.; Balážovič, Ľ.; Koleda, P.; Masný, M.; Weis, K.; Fuska, J. Copernicus Land Monitoring Service—Mapovanie krajinnej pokrývky na Slovensku. Geogr. Rev. 2019, 15, 58–73. [Google Scholar] [CrossRef]
- Falťan, V.; Oťaheľ, J.; Gábor, M.; Ružek, I. Land cover Research Methods—Metódy Výskumu Krajinnej Pokrývky; Comenius University Bratislava: Bratislava, Slovakia, 2018. [Google Scholar]
- Betancourt-Suárez, V.; García-Botella, E.; Ramon-Morte, A. Flood Mapping Proposal in Small Watersheds: A Case Study of the Rebollos and Miranda Ephemeral Streams (Cartagena, Spain). Water 2021, 13, 102. [Google Scholar] [CrossRef]
- Twisa, S.; Buchroithner, M.F. Land-Use and Land-Cover (LULC) Change Detection in Wami River Basin, Tanzania. Land 2019, 8, 136. [Google Scholar] [CrossRef]
- Copernicus Land Monitoring Service. Available online: https://land.copernicus.eu/user-corner/technical-library/clc-product-user-manual/view (accessed on 18 November 2022).


Disclaimer/Publisher’s Note: The statements, opinions and data contained in all publications are solely those of the individual author(s) and contributor(s) and not of MDPI and/or the editor(s). MDPI and/or the editor(s) disclaim responsibility for any injury to people or property resulting from any ideas, methods, instructions or products referred to in the content. |
© 2023 by the authors. Licensee MDPI, Basel, Switzerland. This article is an open access article distributed under the terms and conditions of the Creative Commons Attribution (CC BY) license (https://creativecommons.org/licenses/by/4.0/).