Article

Future Scenarios for Aridity under Conditions of Global Climate Change in Extremadura, Southwestern Spain

by
Francisco J. Moral
1,*,
Cristina Aguirado
2,
Virginia Alberdi
1,
Luis L. Paniagua
2,
Abelardo García-Martín
2 and
Francisco J. Rebollo
3
1
Departamento de Expresión Gráfica, Escuela de Ingenierías Industriales, Universidad de Extremadura, Avda. de Elvas, s/n., 06006 Badajoz, Spain
2
Departamento de Ingeniería del Medio Agronómico y Forestal, Escuela de Ingenierías Agrarias, Universidad de Extremadura, Avda. Adolfo Suárez, s/n., 06007 Badajoz, Spain
3
Departamento de Expresión Gráfica, Escuela de Ingenierías Agrarias, Universidad de Extremadura, Avda. Adolfo Suárez, s/n., 06007 Badajoz, Spain
*
Author to whom correspondence should be addressed.
Land 2023, 12(3), 536; https://doi.org/10.3390/land12030536
Submission received: 7 February 2023 / Revised: 17 February 2023 / Accepted: 20 February 2023 / Published: 22 February 2023

Abstract

:
Aridity conditions in semi-arid lands with warm climates are key variables that must be assessed to properly manage water and plan to minimise the threat of desertification. This study analyses the spatial distribution of aridity in Extremadura, southwestern Spain, using the De Martonne aridity index (IDM), considering a historical reference period (1971–2005) and three-time intervals: 2006–2035 (near future), 2036–2065 (mid-century) and 2066–2095 (end of the century). Projections were computed using a set of ten global climate model (GCM) and regional climate model (RCM) combinations under two representative concentration pathways (RCPs), RCP4.5, an intermediate anthropogenic radiative forcing scenario, and RCP8.5, a fossil-intensive emission scenario. Progressive strengthening of aridity conditions over Extremadura was evident until the end of the century, mainly under the RCP8.5 scenario. From the predominance of the Mediterranean aridity class in the south of the region during the reference period, semi-arid conditions will soon spread across this zone, occupying most of it during mid-century and later. In the north of Extremadura, less arid conditions will be reduced to the highest elevations, increasing the Mediterranean and semi-arid categories, particularly under the RCP8.5 scenario. Consequently, the projected increase in aridity conditions in Extremadura will make this region more vulnerable to climate change. Policies devoted to adapting to the expected conditions and controlling aridity in vulnerable areas will be necessary to mitigate the negative impacts, with significant environmental and socio-economic implications in the region.

1. Introduction

The current scenario of climate change will affect not only many socio-economic sectors but also the environment. Thus, different processes, such as increases in air temperature and evapotranspiration, decreases in precipitation, and higher thermal contrasts related to higher temperature ranges, will modify the aridity conditions. Moreover, these processes can act simultaneously, depending on the region.
Water scarcity will be more important due to low water availability. Consequently, an aridity index has to be used to quantify the water deficiency in any place. It can be used to assess areas sensitive to desertification [1] or monitor and predict drought [2]. Consequently, any aridity index classifies the type of climate based on water availability.
Global warming has caused many changes in the climate, including increases in air temperatures, more frequent heatwaves in inland regions, and an increased risk of drought in the Mediterranean region [3]. During this century, the Mediterranean area, particularly the Iberian Peninsula, is considered a climate change hot spot [4,5,6,7]. Consequently, the analysis of the expected impact of climate change on aridity is fundamental in this area of southwestern Europe. However, few studies have focused on this particular area. García-Garizábal et al. [8] projected aridity for the Middle Ebro Valley, Spain, until the end of the 21st century and, more recently, Andrade et al. [9] performed a study on the Iberian Peninsula.
An appropriate aridity index is necessary when a regional study of aridity has to be performed. Many previous studies have used different aridity indices, but those based on temperature and precipitation are commonly utilized [10,11,12], particularly the De Martonne aridity index (IDM). However, historical periods were considered in these studies without projecting future climate scenarios, though some studies in which projections were computed have been conducted [9,13].
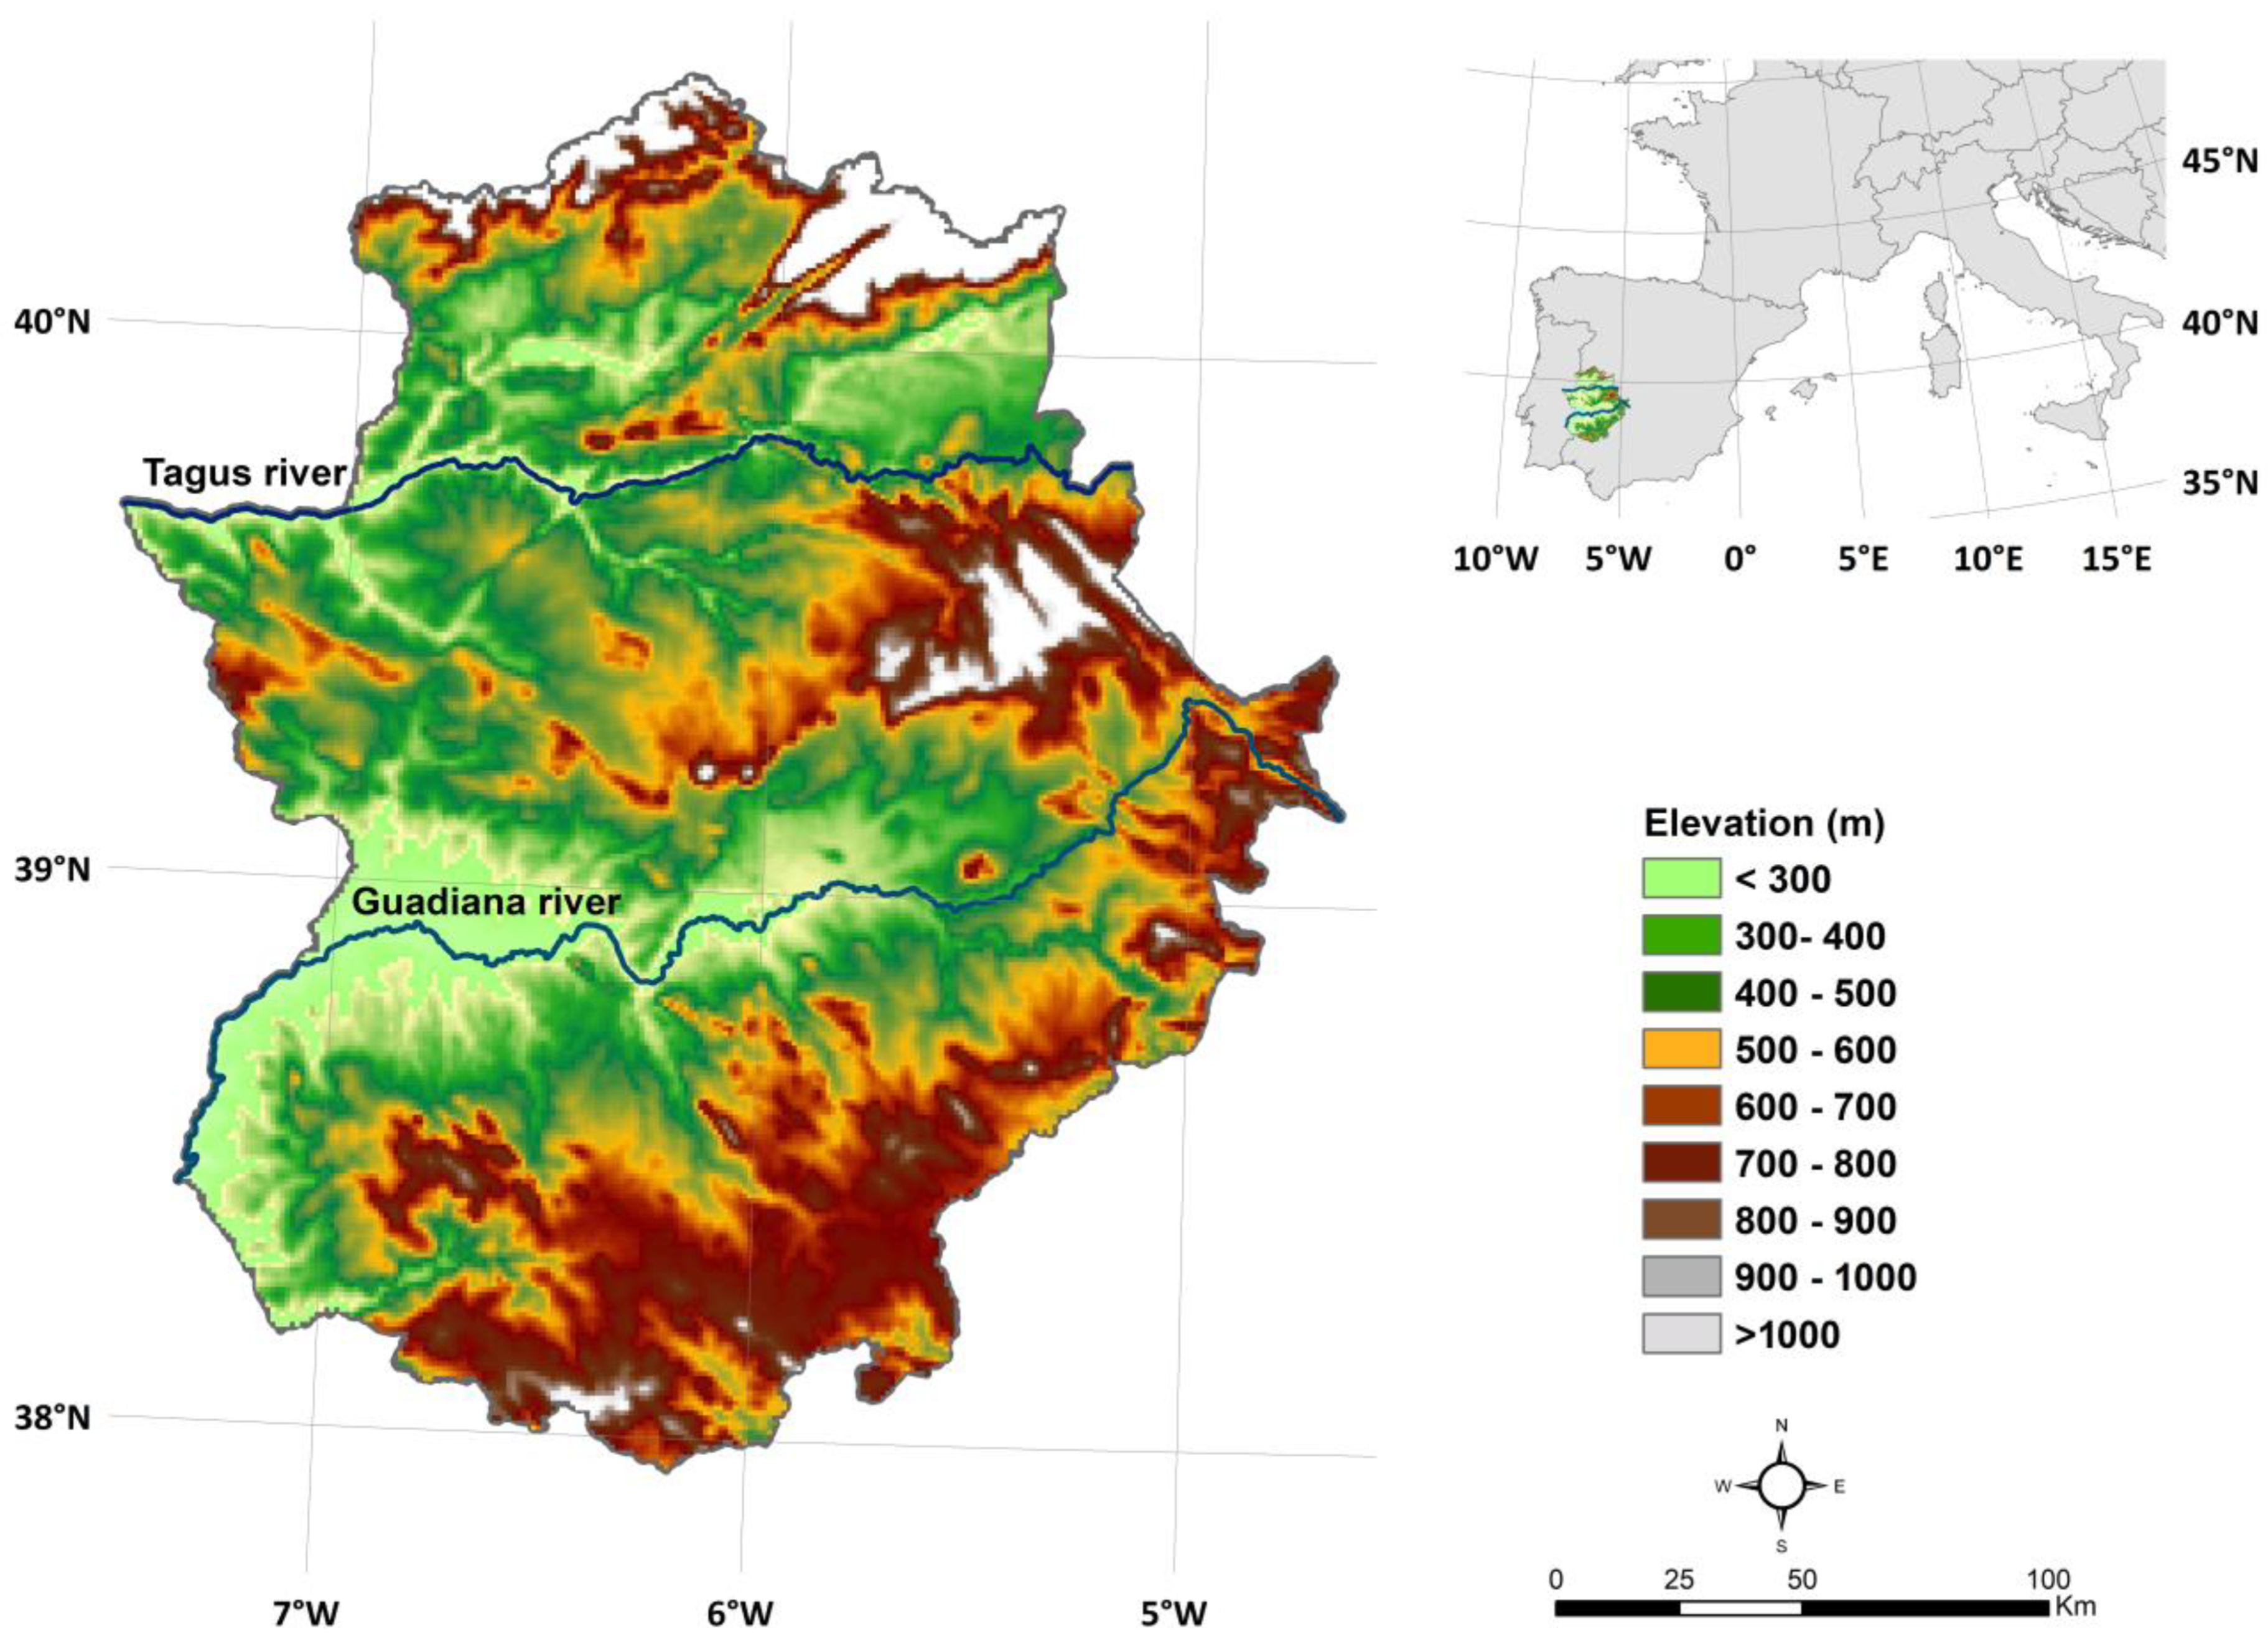
Climate change projections are necessary to estimate the effects of potential permanent drier conditions and future droughts. Furthermore, the study of spatial climate patterns according to different climate scenarios in semi-arid regions is needed. This is the case in Extremadura (Spain), where the main crops and their expected yields are susceptible to extreme climate events. In addition, the existence in this region of the “dehesa”, the most widely extended European agroforestry system [14], makes it particularly necessary to analyse how it can be affected by climate change.
The present research focuses on the spatial distribution and temporal evolution of aridity conditions over Extremadura using the IDM. The climate conditions in Extremadura, one of the driest Spanish regions currently, are described for a historical period (1971–2005) and three-time intervals (2006–2035, 2036–2065, and 2066–2095) to analyse the projected shifts in aridity under two scenarios: an intermediate anthropogenic radiative forcing scenario (RCP4.5) and a fossil-intensive emission scenario (RCP8.5). High-resolution maps were obtained for each case.
The main objectives of this study were to: (1) provide an analysis of the expected aridity conditions in Extremadura, (2) produce high-resolution maps for each considered scenario, (3) perform a regional climate assessment based on the projected shifts in aridity conditions, and (4) compare the spatial patterns of aridity in the region according to the different time intervals.

2. Materials and Methods

2.1. Study Area

Extremadura is located on the Portuguese border, in southwest Spain (Figure 1). Its latitude and longitude are between 37°57′ and 40°29′ N, and between 4°39′ and 7°33′ W, respectively, covering an area of 41,634 km2, one of the largest regions in Europe. This region has highly contrasting features, with vast forest and agricultural areas. It is also an essential ecological enclave.
The digital elevation model (DEM) used in this research is shown in Figure 1. It has a spatial resolution of 1 km. The mean altitude in the region is approximately 425 m a.s.l. The highest point in Extremadura, 2404 m a.s.l., is located in the north, in the Sistema Central Mountains. There are also some gentle-wooded hills, the Sierra de Gata and Hurdes, with the fertile valleys of the Alagón, Jerte, and La Vera between them. In the western area of the region, the rich plain of the Guadiana River, with the minimum elevation in the region at 116 m a.s.l., is located near the border between Spain and Portugal. Moreover, the great plains of Alcántara and Brozas lead into the San Pedro Mountains. In the east, the irrigation lands of the river Tagus, the rugged Villuercas, and the areas of La Serena, with the longest interior coast in the Iberian Peninsula, descends to the south of the agricultural areas of La Campiña, the Sierra Morena, with its great pasture lands, and the mountains of Tentudía, Hornachos and Jerez.
The climate in Extremadura is Mediterranean. However, due to its proximity to the Atlantic, it is modified by oceanic influences that penetrate the peninsula and the interior location of the region.
Summers in this region are very dry and hot. Maximum temperatures above 40 °C are often experienced. Winters are mild and rainy when low-pressure conditions predominate but winters can be also cold and dry when powerful anticyclones from northern Europe are predominant [15]. During the spring and autumn, usually high climatic variability can be found.
The mean annual precipitation is less than 600 mm in the majority of the areas of the region. High interannual variability is the main characteristic of precipitation. From June to September, there is a dry season; from October to May, there is a wet season. 80% of the precipitation occurs during the wet season. Moreover, periodic droughts, over two or more years, are frequent, with an occurrence once in 8–9 years [16].
It is also important to denote that significant variability in microclimatic conditions exists because of the variable topography across the region.

2.2. Climate Data, Future Scenarios, and Aridity Index

Daily minimum temperatures, maximum temperatures, and precipitation data were obtained from the EURO-CORDEX project platform (http://www.euro-cordex.net/, accessed on 15 April 2021) for the historical period 1971–2005 and two scenarios between 2006 and 2095, at 0.125° grid resolution (approximately 12.5 km). The aridity index was computed at the same resolution. For the subsequent statistical downscaling of the index to a 1-km grid resolution, a bilinear method was used, as proposed elsewhere [17,18].
The regional simulations result from global climate projections by dynamical downscaling (Global-Regional model chains) derived from the Coupled Model Intercomparison Project 5 (CMIP5). The Intergovernmental Panel on Climate Change (IPCC) presents four scenarios called representative concentration pathways (RCPs) (Moss et al. 2010): RCP2.0, RCP4.5, RCP6.0, and RCP8.5. They are alternative representations of the future evolution of pollutant emissions, concentration of greenhouse gases, chemically active gases, and land use until 2100, considering RCP2.0 as that which projects a lower emission and RCP8.5 as that with the highest emission. EURO-CORDEX scenario simulations use these RCPs [19,20].
With the aim of evaluating the impact of climate change and the development of adaptation strategies considering a regional scale, high spatial resolution scenarios are necessary. Other projects, such as ESCENA or ENSEMBLES, provide climate projections with a maximum resolution of about 25 km, but under previous IPCC scenarios and the project PRUDENCE, simulations were performed in a 50 km grid. EURO-CORDEX considers current IPCC scenarios, the most recent from those available. Moreover, the spatial resolution is 12.5 km, as was previously indicated, which is suitable for regional analysis.
In this study, two scenarios were considered: RCP4.5, which corresponds to a stabilisation of the additional anthropogenic radiative forcing relative to the pre-industrial levels, without overshoot pathway, at 4.5 W/m2 by the end of the 21st century; and RCP8.5, which corresponds to an increase in radiative forcing of 8.5 W/m2 by the end of the 21st century.
The geographical sector comprising Extremadura was considered, in order to analyse all regional changes, using data for four-time intervals: 1971–2005 (reference), 2006–2035, 2036–2065, and 2066–2095. The study was performed using a set of ten GCM-RCM (Table 1) combinations under both RCP4.5 and RCP8.5. According to http://cordex.org/data-access/bias-adjusted-rcm-data/ (accessed on 5 September 2021), bias correction of the RCM data was performed.
According to different scenarios, temperature and precipitation were estimated at grid points located in Extremadura and others along its boundaries. Later, the same grid points were used to compute the aridity index. Estimates in border areas are better calculate when some points along the boundaries of Extremadura are considered.
Although there are different aridity indices, the IDM was chosen because its capacity to discriminate between climate types is higher, as shown in a previous study in Extremadura [21]. Worldwide, the IDM is one of the most commonly used aridity/humidity indices [10,22,23,24], providing good results when dry/humid conditions have to be identified in a region.
The annual IDM values were defined as follows:
IDM = Pa/(Ta + 10)
where Pa is the annual precipitation (in millimetres), and Ta is the mean annual air temperature (in degrees Celsius).
According to the values obtained by computing the IDM, the climate type of a region can be classified as shown in Table 2.

2.3. Statistical Analysis

The Mann-Kendall test, as recommended by the World Meteorological Organisation [25], was used to analyse the temporal trends in IDM. With the aim of computing the gradients and their direction, the Sen’s non-parametric method was applied and the relative change of IDM throughout the studied period was also identified [26].
A comparison between the three periods (2006–2035, 2036–2065, and 2066–2095) and the past condition during 1971–2005 (reference period) was performed for the IDM under both RCP scenarios.
The differences between the reference period and each projected scenario were computed. The ANOVA test at a 5% significance level was used to assess the statistically significant anomalies for each grid point’s mean values. The null hypothesis indicates that data have the same mean. The rejection of this null hypothesis addresses Tukey’s test. This multiple comparison procedure was used to find significantly different means between each period and the reference.
Figure 2 illustrates the overall methodological framework used in this study. The spatial representation and visualisation of the IDM according to different scenarios were conducted using the GIS software ArcGIS v.10.5.

3. Results and Discussion

The mean IDM for the historical period, 1971–2005, and the three-time intervals, 2006–2035, 2036–2065, and 2066–2095, for both scenarios are shown in Table 3.
Projected mean values of IDM will gradually decrease throughout the 21st century, leading to a more overall arid condition in Extremadura, with a similar temporal variability in each period.
Figure 3 shows the decrease of IDM over the years until the end of the 21st century. This decrease is more evident in the RCP8.5 scenario, as expected. The trend in the near future, 2006–2035, for both scenarios is similar, showing a clear decrease with respect to the historical period. The same could be said for the mid-century, 2036–2065, without differences between scenarios, but fluctuations between years prevent a clear result. During the end of the century, 2066–2095, it seems that the trends diverge; for both scenarios, the trend stabilises, but lower IDM values are reached in the RCP8.5 scenario.
With the aim of smoothing the IDM time series to better visualise the trends, a moving average was computed for each year. In consequence, a 5-year moving average was considered and so the central moving average was calculated using data equally spaced on either side of each year. Therefore, short-term fluctuations were smoothed out and longer-term trends were highlighted (Figure 4). It was more evident that, in the near future, 2006–2035, for both scenarios the trend is similar. The differences between both scenarios are more apparent during the mid-century, 2036–2065, with a clear decrease of IDM over the years, being more intense for the RCP8.5 scenario, in which the Mediterranean class is predominant before 2050. Moreover, for the end of the century, 2066–2095, the differences between both scenarios is also clearer; lower IDM values for the RCP8.5 scenario are expected and semi-arid conditions can be reached during many years, while for the RCP4.5 scenario a stabilisation of the IDM values around the threshold between Mediterranean and semi-humid classes is evident.
Figure 3 and Figure 4 complement the information provided by the spatial patterns of IDM under different scenarios and periods (Figure 5 and Figure 6), highlighting the intensity of change. The coincidences between maxima and minima in different periods and under RCP4.5 and RCP8.5 scenarios are due to the fluctuations of the original values of precipitation and temperature used to compute IDM, since they showed the same coincidence under both scenarios and for the same time periods [27].
Table 4 outlines how significant change trends were found for IDM in the historical period and until the end of the 21st century. However, the intensity of the change will be very different, depending on the scenario, as the Sen slopes indicate. In the RCP4.5 scenario, this intensity is double that in the reference, the historical period. In the RCP8.5 scenario, it is practically quadruple that in the historical period. With respect to the relative change, it is more than five times higher in the RCP4.5 scenario that in the historical period; in the RCP8.5 scenario, when compared with the RCP4.5 scenario, the relative change is double.
When the different periods were considered, the intensity of the changes were obtained for each period (Table 5). Although the change trends were not significant in most of the cases, a higher intensity of change was obtained for the near future under the RCP8.5 scenario. During the mid-century, a similar intensity of change is expected for both scenarios and a stabilization of the IDM values during the end of the century. The relative changes will be higher during the near future and the mid-century, coinciding with the periods of more intense changes of the IDM values.
Considering the baseline climate, 1971–2005, the spatial distribution of the IDM (Figure 5) reveals that the driest zones within the Mediterranean category include most of the south of Extremadura, except the mountainous southern part. The values of the IDM increase towards the north and east, mainly within the semi-humid and humid categories. Very humid and extremely humid classes are located in the high elevation zones along the northern part of the region, where annual precipitation is the highest in Extremadura [28].
An increase in the driest climate categories is projected for 2006–2035, near future, 2036–2065, mid-century, and 2066–2095, end of the century (Figure 6). In the near future, the semi-arid class will be more prevalent throughout the southern part of the region. In both scenarios, the semi-humid class will be predominant in the north, appearing in the Mediterranean category in some zones. This situation is more pronounced in the mid-century, thereby increasing the semi-arid category in the south. Most of the territory will be within this category in both scenarios. The Mediterranean class will be predominant in the north, particularly under RCP8.5. However, a moderate decrease in the humid categories in the northern area was predicted.
Regarding the spatial patterns of IDM at the end of the century, the semi-arid class shows a slight increase concerning the mid-century under RCP4.5, and the same is apparent for the semi-humid category. However, the increase in the semi-arid class was more pronounced at the end of the century under RCP8.5. According to the orography, this scenario is entirely dominated by semi-arid and Mediterranean conditions, except in the north, near the highest elevations, where the climate ranges from semi-humid to extremely humid categories. Figure 7 shows the percentage of each IDM class according to the different scenarios.
These changes in the aridity categories were also quantified (Table 6). The increase in the semi-arid category ranges from approximately 14% to 64% of the territory, under RCP4.5, and RCP8.5, respectively, at the end of the century. In contrast, a decrease in the other categories is predicted in general. In the near future, the humid class will occupy approximately 10% less than that in the baseline period, under both scenarios, and around 15% in the mid-century and the end of the century. Decrease is also projected for both periods in the semi-humid category, particularly under RCP8.5. Although the very humid and extremely humid climates have smaller areas in the reference period, both will decrease considerably under both scenarios and more severely towards the end of the 21st century. If the RCP8.5 scenario occurs, a high percentage of the Extremaduran territory (around 71%) will be classified as semi-arid. The consequences for the main crops of the region, such as vineyards and olive orchards, will be very important, leading to the necessity of adaptative measures, such as the selection of new areas for the traditional crops (which will be drastically reduced in area and production) and the implementation of cultivation techniques aimed at increasing the soil water storage capacity. These techniques include no-till or minimum tillage, permanent plant cover management and the increase of organic matter.
The statistical analysis of the differences between the scenarios for each future period and the baseline climate for IDM indicated significant changes. Figure 6 shows the points of the grid in which statistically significant changes were observed. Under RCP4.5, the main changes were expected to occur in the more humid areas in the north and east of the region in the near future. Still, under RCP8.5, the changes occurred in most of the south of Extremadura, affecting areas where the driest climate is projected. Consequently, less humid conditions are expected in the north, where the highest values of IDM exist nowadays, along with a prominent intensification of the aridity in the south, precisely where the lowest values of IDM are currently found, considering the less favourable scenario.
For the mid-century and the end of the century, changes were statistically significant in the entire region under both RCP scenarios. The extremity is projected to shift to lower values of the IDM. In general, the shifts in the spatial variability of the IDM hinted at an in-crease in dry conditions (aridity) until the end of the 21st century, mainly under the RCP8.5 scenario. This is critical in regions where vulnerability to dryness is very high.
These results follow the previous research of Moral et al. [21]. The IDM showed a decreasing trend after analysing 81 weather stations throughout Extremadura, for the 1951–2010 period.
Consequently, the increase in the area and intensity of aridity conditions in Extremadura until 2095, mainly under RCP8.5, constitutes a real hazard. Desertification throughout Extremadura will also increase since a significant decrease in soil moisture has also been projected in the Mediterranean area for the near future [29].
A recent study on the Iberian Peninsula stated that the general increase in aridity would lead to increased interannual variability [9]. More areas will be classified as desert (BW) and semi-desert (BS) according to Köppen’s climate classification, particularly in the south of Spain.
The impacts of these expected climatic changes on Extremaduran agriculture, particularly on the most important crops in the region, such as olive orchards and vineyards, will be very intense, as has been reported for the Mediterranean basin [30,31,32].
Different results can be generated from different studies on projections of climate change on future aridity levels, due to many factors (such as the number of GCM and RCM combinations, greenhouse emission scenario or the period of aridity changes considered). Consequently, a comparison of the present results with others reported in past studies on aridity projections is difficult. However, as was previously indicated, the results from this study support the findings of past studies in a wider area including Extremadura and at lower spatial resolution. For instance, Huang et al. [33] found that dryland expansion rate will increase at the end of the 21st century with respect to the 1961–1990 baseline, and Lin et al. [34] indicated an increase of 6.4% of mean global aridity during 2055–2080 relative to 1980–2005. In addition, Zarch et al. [13] also reported a global increase of aridity in the future, considering four periods (2006–2025, 2026–2050, 2051–2075, and 2076–2100) relative to the historical period (1901–2005). The results obtained from the present study are generally in agreement with these earlier findings, especially in semi-arid lands.

4. Conclusions

The spatial distribution of aridity in Extremadura shifted to drier conditions until the end of the century, mainly under the RCP8.5 scenario. This situation will be more intense in the south of the region, which will become semi-arid almost wholly, and the more humid areas will be reduced to the highest mountains in the north.
In the near future, projected aridity changes are statistically significant in the more humid zones in the north of the region, under the RCP4.5 scenario, and in the south, under the RCP8.5 scenario. However, in both scenarios, changes were statistically significant throughout Extremadura in the mid-century and the end of the century. Consequently, Extremadura is projected to shift to drier conditions, which is critical in a region where the vulnerability to aridity is very high.
Accurate projections of the spatial patterns of IDM, as one of the most used aridity indices worldwide, are necessary to anticipate the expected negative effects of climate change. The projected increases in the area and intensity of aridity conditions in Extremadura will increase the adverse effects of climate change, including a higher risk of desertification.
The results of this study are of great importance for evaluating water resources at local and regional scales in order to predict practical measures to control aridity in vulnerable areas, because water supply can be seriously compromised, not only for industry, or energy requirements, but also with respect to agricultural needs.

Author Contributions

Conceptualization F.J.M. and C.A.; methodology, F.J.M. and A.G.-M.; software, C.A. and L.L.P.; validation, F.J.M. and C.A.; formal analysis, F.J.M., C.A., L.L.P. and A.G.-M.; investigation, F.J.M., C.A., V.A., L.L.P., A.G.-M. and F.J.R.; resources, F.J.M., C.A., V.A. and L.L.P.; data curation, C.A. and V.A.; writing—original draft preparation, F.J.M.; writing—review and editing, F.J.M.; visualization, C.A., V.A. and F.J.R.; supervision, F.J.M.; project administration F.J.M. and A.G.-M.; funding acquisition, F.J.M. and A.G.-M. All authors have read and agreed to the published version of the manuscript.

Funding

This research was funded by the Junta de Extremadura and the European Regional Development Fund (ERDF) through the projects GR18086 (Research Group TIC008), GR18088 (Research Group RNM028) and IB18001 (Análisis y modelizacion del impacto del cambio climático sobre la distribución de zonas vitícolas en Extremadura).

Institutional Review Board Statement

Not applicable.

Data Availability Statement

Not applicable.

Conflicts of Interest

The authors declare no conflict of interest.

References

  1. Deniz, A.; Toros, H.; Incecik, S. Spatial variations of climate indices in Turkey. Int. J. Climatol. 2011, 31, 394–403. [Google Scholar] [CrossRef]
  2. Nastos, P.T.; Politi, N.; Kapsomenakis, J. Spatial and temporal variability of the aridity index in Greece. Atmos. Res. 2013, 119, 140–152. [Google Scholar] [CrossRef]
  3. IPCC. Summary for Policymakers. In Global Warming of 1.5 °C. An IPCC Special Report on the Impacts of Global Warming of 1.5 °C above Pre-Industrial Levels and Related Global Greenhouse Gas Emission Pathways, in the Context of Strengthening the Global Response to the Threat of Climate Change, Sustainable Development, and Efforts to Eradicate Poverty; Masson-Delmotte, V.P., Zhai, H.-O., Pörtner, D., Roberts, J., Skea, P.R., Shukla, A., Pirani, W., Moufouma-Okia, C., Péan, R., Pidcock, S., et al., Eds.; World Meteorological Organization: Geneva, Switzerland, 2018; 32p. [Google Scholar]
  4. Giorgi, F. Climate Change Hot-Spots. Geophys. Res. Lett. 2006, 33, 101029. [Google Scholar] [CrossRef]
  5. Diffenbaugh, N.S.; Pal, J.S.; Giorgi, F.; Gao, X. Heat Stress Intensification in the Mediterranean Climate Change Hotspot. Geophys. Res. Lett. 2007, 34., L11706. [Google Scholar] [CrossRef] [Green Version]
  6. Diffenbaugh, N.S.; Giorgi, F. Climate Change Hotspots in the CMIP5 Global Climate Model Ensemble. Clim. Chang. 2012, 114, 813–822. [Google Scholar] [CrossRef] [Green Version]
  7. MedECC. Climate and Environmental Change in the Mediterranean Basin–Current Situation and Risks for the Future. First Mediterranean Assessment Report; Cramer, W., Guiot, J., Marini, K., Eds.; Union for the Mediterranean, Plan Bleu, UNEP/MAP: Marseille, France, 2020; 632p. [Google Scholar] [CrossRef]
  8. García-Garizábal, I.; Causapé, J.; Abrahao, R.; Merchan, D. Impact of climate change on Mediterranean irrigation demand: Historical dynamics of climate and future projections. Water Resour. Manag. 2014, 28, 1449–1462. [Google Scholar] [CrossRef]
  9. Andrade, C.; Contente, J.; Santos, J.A. Projections of Aridity Conditions in the Iberian Peninsula. Water 2021, 13, 2035. [Google Scholar] [CrossRef]
  10. Hrnjak, I.; Lukić, T.; Gavrilov, M.B.; Marković, S.B.; Unkašević, M.; Tošić, I. Aridity in Vojvodina, Serbia. Theor. Appl. Climatol. 2014, 115, 323–332. [Google Scholar] [CrossRef]
  11. Paniagua, L.L.; García-Martín, A.; Moral, F.J.; Rebollo, F.J. Aridity in the Iberian Peninsula (1960–2017): Distribution, Tendencies, and Changes. Theor. Appl. Climatol. 2019, 138, 811–830. [Google Scholar] [CrossRef]
  12. Pellicone, G.; Caloiero, T.; Guagliardi, I. The De Martonne Aridity Index in Calabria (Southern Italy). J. Maps 2019, 15, 788–796. [Google Scholar] [CrossRef]
  13. Zarch, M.A.A.; Sivakumar, B.; Malekinezhad, H.; Sharma, A. Future aridity under conditions of global climate change. J. Hydrol. 2017, 554, 451–469. [Google Scholar] [CrossRef]
  14. Simón, N.; Montes, F.; Díaz-Pinés, E.; Benavides, R.; Roig, S.; Rubio, A. Spatial distribution of the soil organic carbon pool in a Holm oak dehesa in Spain. Plant Soil 2012, 366, 537–549. [Google Scholar] [CrossRef] [Green Version]
  15. Hurrell, J.W.; Van Loon, H. Decadal variations in climate associated with the North Atlantic Oscillation. Clim. Chang. 1997, 36, 301–326. [Google Scholar] [CrossRef]
  16. Roig, F.A.; Barriopedro, D.; García-Herrera, R.; Patón-Dominguez, D.; Monge, S. North atlantic oscillation signatures in western iberian tree-rings. Geogr. Ann. Ser. A Phys. Geogr. 2009, 91, 141–157. [Google Scholar] [CrossRef]
  17. Fraga, H.; Malheiro, A.C.; Moutinho-Pereira, J.; Santos, J.A. Future scenarios for viticultural zoning in Europe: Ensemble projections and uncertainties. Int. J. Biometeorol. 2013, 57, 909–925. [Google Scholar] [CrossRef] [PubMed]
  18. Teslić, N.; Vujadinović, M.; Rumi, M.; Ricci, A.; Vuković, A.; Parpinello, G.P.; Versari, A. Future climatic suitability of the Emilia-Romagna (Italy) region for grape production. Reg. Environ. Change 2019, 19, 599–614. [Google Scholar] [CrossRef]
  19. Moss, R.H.; Edmonds, J.A.; Hibbard, K.A.; Manning, M.R.; Rose, S.K.; van Vuuren, D.P.; Carter, T.R.; Emori, S.; Kainuma, M.; Kram, T.; et al. The next Generation of Scenarios for Climate Change Research and Assessment. Nature 2010, 463, 747–756. [Google Scholar] [CrossRef] [PubMed]
  20. van Vuuren, D.P.; Edmonds, J.; Kainuma, M.; Riahi, K.; Thomson, A.; Hibbard, K.; Hurtt, G.C.; Kram, T.; Krey, V.; Lamarque, J.F.; et al. The Representative Concentration Pathways: An Overview. Clim. Chang. 2011, 109, 5–31. [Google Scholar] [CrossRef]
  21. Moral, F.J.; Paniagua, L.L.; Rebollo, F.J.; García-Martín, A. Spatial analysis of the annual and seasonal aridity trends in Extremadura, southwestern Spain. Theor. Appl. Climatol. 2017, 130, 917–932. [Google Scholar] [CrossRef]
  22. Shahid, S. Spatio-temporal variation of aridity and dry period in term of irrigation demand in Bangladesh. Am.-Eurasian J. Agric. Environ. Sci. 2010, 7, 386–396. [Google Scholar]
  23. Croitoru, A.E.; Piticar, A.; Imbroane, A.M.; Burada, D.C. Spatiotemporal distribution of aridity indices based on temperature and precipitation in the extra-Carpathian regions of Romania. Theor. Appl. Climatol. 2013, 112, 597–607. [Google Scholar] [CrossRef]
  24. Baltas, E. Spatial Distribution of Climatic Indices in Northern Greece. Meteorol. Appl. 2007, 14, 69–78. [Google Scholar] [CrossRef]
  25. WMO (World Meteorological Organization). Guide to Hydrological Practices. Volume II—Management of Water Resources and Application of Hydrological Practices, 6th ed.; WMO-No. 168; World Meteorological Organization: Geneva, Switzerland, 2009. [Google Scholar]
  26. Sen, P.K. Estimates of the Regression Coefficient Based on Kendall’s Tau. J. Am. Stat. Assoc. 1968, 63, 1379–1389. [Google Scholar] [CrossRef]
  27. Amblar, P.; Casado, M.J.; Pastor, A.; Ramos, P.; Rodríguez, E. Guide of Regionalised Scenarios of Climate Change on Spain from IPCC-AR5 Results; Ministerio de Agricultura y Pesca, Alimentación y Medio Ambiente, Agencia Estatal de Meteorología: Madrid, Spain, 2017.
  28. Moral, F.J. Comparison of different geostatistical approaches to map climate variables: Application to precipitation. Int. J. Climatol. 2010, 30, 620–631. [Google Scholar] [CrossRef]
  29. Heinrich, G.; Gobiet, A. The Future of Dry and Wet Spells in Europe: A Comprehensive Study Based on the ENSEMBLES Regional Climate Models. Int. J. Climatol. 2012, 32, 1951–1970. [Google Scholar] [CrossRef]
  30. Fraga, H.; Pinto, J.G.; Viola, F.; Santos, J.A. Climate Change Projections for Olive Yields in the Mediterranean Basin. Int. J. Climatol. 2020, 40, 769–781. [Google Scholar] [CrossRef] [Green Version]
  31. Santos, J.A.; Fraga, H.; Malheiro, A.C.; Moutinho-Pereira, J.; Dinis, L.-T.; Correia, C.; Moriondo, M.; Leolini, L.; Dibari, C.; Costafreda-Aumedes, S.; et al. A Review of the Potential Climate Change Impacts and Adaptation Options for European Viticulture. Appl. Sci. 2020, 10, 3092. [Google Scholar] [CrossRef]
  32. Fraga, H.; Moriondo, M.; Leolini, L.; Santos, J.A. Mediterranean Olive Orchards under Climate Change: A Review of Future Impacts and Adaptation Strategies. Agronomy 2021, 11, 56. [Google Scholar] [CrossRef]
  33. Huang, J.; Yu, H.; Guan, X.; Wang, G.; Guo, R. Accelerated dryland expansion under climate change. Nat. Clim. Chang. 2016, 6, 166–171. [Google Scholar] [CrossRef]
  34. Lin, L.; Gettelman, A.; Feng, S.; Fu, Q. Simulated climatology and evolution of aridity in the 21st century. J. Geophys. Res. Atmos. 2015, 120, 5795–5815. [Google Scholar] [CrossRef]
Figure 1. Digital elevation model of Extremadura.
Land 12 00536 g001
Figure 2. Overall methodological framework of this study.
Land 12 00536 g002
Figure 3. Temporal evolution of the De Martonne aridity index (IDM) during the historical period, blue line, and the near future (P1), 2006–2035, the mid-century (P2), 2036–2065, and the end of the century (P3), 2066–2095, under the RCP4.5, green line, and RCP8.5, red line, scenarios.
Land 12 00536 g003
Figure 4. Temporal evolution of the De Martonne aridity index (IDM) using 5-year moving averages during the historical period, blue line, and the near future (P1), 2006–2035, the mid-century (P2), 2036–2065, and the end of the century (P3), 2066–2095, under the RCP4.5, green line, and RCP8.5, red line, scenarios.
Land 12 00536 g004
Figure 5. Spatial distribution of the De Martonne aridity index in Extremadura considering the baseline climate, 1971–2005. Grid cells for the study are also indicated.
Land 12 00536 g005
Figure 6. Spatial distribution of the De Martonne aridity index in Extremadura considering the near future (P1), 2006–2035, the mid-century (P2), 2036–2065, and the end of the century (P3) 2066–2095, under two different scenarios, RCP4.5, and RCP8.5. According to Tukey’s test, changes relative to the baseline period, 1971–2005, in dotted locations are statistically significant at a 5% significance level.
Land 12 00536 g006
Figure 7. Percentage of each De Martonne aridity index class considering the baseline period (P0), 1971–2005, the near future (P1), 2006–2035, the mid-century (P2), 2036–2065, and the end of the century (P3) 2066–2095, under two different scenarios, RCP4.5, and RCP8.5.
Land 12 00536 g007
Table 1. Combinations of the Global Climate Models (GCM) and the Regional Climate Models (RCM) used in this study.
GCMRCM
CNRM-CM5CCLM4-8-17
CNRM-CM5RCA4
EC-EARTHRACMO22E
IPSL-CM5A-MRRCA4
MPI-ESM-LRCCLM4-8-17
MPI-ESM-LRRCA4
MPI-ESM-LRREMO2009
MOHC-HadGEM2-ESCCLM4-8-17
MOHC-HadGEM2-ESRCA4
MOHC-HadGEM2-ESRACMO22E
Table 2. Type of climate according to the De Martonne aridity index (IDM, adapted after Baltas [24]).
ClassificationValues (mm/Degrees Celsius)
AridIDM < 10
Semi-Arid10 ≤ IDM < 20
Mediterranean20 ≤ IDM < 24
Semi-humid24 ≤ IDM < 28
Humid28 ≤ IDM < 35
Very Humid35 ≤ IDM ≤ 55
Extremely humidIDM > 55
Table 3. Descriptive statistics of the De Martonne aridity index (IDM) for each scenario and period.
ScenarioPeriodMeanStandard DeviationCoefficient of Variation (%)
Historical1971–200530.1512.0439.94
RCP4.52006–203527.8511.3340.67
2036–206525.7511.0742.98
2066–209524.8410.2541.26
RCP8.52006–203527.8510.3837.26
2036–206523.7210.4243.92
2066–209521.069.8546.77
Table 4. Statistics of the Mann-Kendall test (ZMK) and the magnitude of trends approximated by Sen’s estimator (β) for the De Martonne aridity index (IDM), considering the historical period and all years until the end of the 21st century for each scenario. RC is the relative change.
ScenarioZMKβRC(%)
Historical3.58 ***0.033.70
RCP4.5−3.65 ***−0.06−20.65
RCP8.5−6.75 ***−0.11−39.03
*** Significant trend at the 0.001 level.
Table 5. Statistics of the Mann-Kendall test (ZMK) and the magnitude of trends approximated by Sen’s estimator (β) for the De Martonne aridity index (IDM), considering the historical period and different periods (P1, 2006–2035; P2, 2036–2065; P3, 2066–2095) until the end of the 21st century for each scenario. RC is the relative change.
ScenarioPeriodZMKβRC(%)
Historical 3.58 ***0.033.70
RCP4.5P1−0.54−0.07−7.00
P2−1.28−0.08−8.85
P3−0.82−0.05−5.92
RCP8.5P1−1.82 +−0.11−12.17
P2−1.43−0.06−7.84
P3−0.11−0.01−1.85
+ Significant trend at the 0.1 level. *** Significant trend at the 0.001 level.
Table 6. Differences (%) between each scenario and the baseline climate (1971–2005).
ClimateP2_45-P1P2_85-P1P3_45-P1P3_85-P1P4_45-P1P4_85-P1
Semi-arid13.6316.1127.7739.7830.0464.41
Mediterranean−0.54−3.085.725.607.14−12.99
Semi-humid−0.72−1.08−14.80−23.93−17.64−26.70
Humid−10.19−9.83−14.39−14.80−14.60−15.76
Very humid−1.68−1.58−3.40−5.29−3.85−7.09
Extremely humid−0.52−0.54−0.90−1.36−1.09−1.86
Disclaimer/Publisher’s Note: The statements, opinions and data contained in all publications are solely those of the individual author(s) and contributor(s) and not of MDPI and/or the editor(s). MDPI and/or the editor(s) disclaim responsibility for any injury to people or property resulting from any ideas, methods, instructions or products referred to in the content.

